
Introduction
GaAs nanowires (NWs) are promising building blocks for fast transistors,[Reference Miao, Chabak, Zhang, Mohseni, Walker and Li1] light-emitting diodes,[Reference Dimakis, Jahn, Ramsteiner, Tahraoui, Grandal, Kong, Marquardt, Trampert, Riechert and Geelhaar2] lasers,[Reference Mayer, Rudolph, Schnell, Morkötter, Winnerl, Treu, Müller, Bracher, Abstreiter, Koblmüller and Finley3] and solar cells.[Reference Krogstrup, Jørgensen, Heiss, Demichel, Holm, Aagesen, Nygard and Fontcuberta i Morral4] Due to their small footprint, vertical GaAs NWs can be grown epitaxially on dissimilar substrates such as silicon. This way, the integration of direct-bandgap semiconductor nanostructures on the silicon platform for electronic applications can be realized.[Reference Tomioka and Fukui5] GaAs NWs can be grown vertically and without foreign catalyst material on Si(111) substrates by the so-called vapor–liquid–solid mode[Reference Fontcuberta i Morral, Colombo, Abstreiter, Arbiol and Morante6, Reference Colombo, Spirkoska, Frimmer, Abstreiter and Fontcuberta i Morral7] utilizing a liquid Ga-droplet deposited on a Si substrate, which is covered by a thin oxide layer. The Ga-droplet plays a crucial role in the growth process[Reference Jacobsson, Panciera, Tersoff, Reuter, Lehmann, Hofmann, Dick and Ross8]: It serves as a material reservoir for the unidirectional NW growth, and strongly influences the NW morphology, for example, the crystal structure and the shape. Crystal structure and shape of the NWs are again of great importance for the efficiency of later devices. Also the NW number density and homogeneity are important factors when it comes to technologic applications. So far, growth studies have aimed on optimizing each of these points individually.[Reference Matteini, Dubrovskii, Rüffer, Tütüncüoglu, Fontana and Fontcuberta i Morral9–Reference Gibson and LaPierre13] However, it turned out that by tuning the NW number density via the growth parameters, both NW crystal structure and shape are affected as well.[Reference Matteini, Dubrovskii, Rüffer, Tütüncüoglu, Fontana and Fontcuberta i Morral9, Reference Bastiman, Küpers, Somaschini and Geelhaar11, Reference Krogstrup, Curiotto, Johnson, Aagesen, Nygård and Chatain14, Reference Joyce, Wong-Leung, Gao, Tan and Jagadish15]
Further research focused on separating the fabrication processes responsible for NW growth from those defining the NW number density, respectively. In site-selective area growth (SAG), NWs can be grown at pre-defined nucleation sites on a pre-patterned oxide mask covering the Si(111), prepared by a suitable lithography method. The NW number density is thereby controlled by the lithography process; therefore, the parameters for NW growth can be optimized separately.[Reference Plissard, Larrieu, Wallart and Caroff12, Reference Gibson and LaPierre13, Reference Mårtensson, Carlberg, Borgström, Montelius, Seifert and Samuelson16–Reference Mosberg, Myklebost, Ren, Weman, Fimland and van Helvoort19] Although SAG provides high control over NW position and number density, it comprises an additional ex situ lithography step usually involving complex handling and chemical treatment.
More recent developments rely on lithography-free in situ methods, for example, combining Ga-droplet pre-deposition and annealing steps in order to tune the number density of nucleation sites.[Reference Somaschini, Bietti, Trampert, Jahn, Hauswald, Riechert, Sanguinetti and Geelhaar20–Reference Küpers, Bastiman, Luna, Somaschini and Geelhaar23] The lithography-free approach is in situ compatible avoiding detrimental influences from the use of foreign materials and additional handling. Although variations in the NW number density are expected to change the local growth conditions,[Reference Ramdani, Harmand, Glas, Patriarche and Travers24] a comprehensive study investigating the crystalline morphology of NWs with varying number density grown by such approaches has been pending. For such a study, we have grown self-catalyzed GaAs NW on Si(111) covered by native oxide. By iterative, lithography-free surface modification, we tune the number density of NWs without varying the growth parameters for NW growth itself. We characterize the grown NW ensembles by combining scanning electron microscopy (SEM) and high-resolution x-ray diffraction and evaluate the x-ray data using a statistical model for polytypism in GaAs NWs, and relate the findings to growth theory.
Samples
We prepared three samples with self-catalyzed GaAs NWs for this investigation. In order to vary the NW number density, we use a lithography-free in situ approach similar to those of Tauchnitz et al.[Reference Tauchnitz, Nurmamytov, Hübner, Engler, Facsko, Schneider, Helm and Dimakis21] and Hakkarainen et al.[Reference Hakkarainen, Schramm, Mäkelä, Laukkanen and Guina22] Instead of depositing and removing Ga-droplets or GaAs crystals, we grow NWs, which are then thermally desorbed. After that, the same substrate is used for the growth of the next NW ensemble applying identical growth parameters. In detail, the NWs for this study were grown on Si(111) substrates covered with native oxide using Ga-droplets as catalyst. The n-type Si(111) wafers were degased at T = 300 °C for 30 min before loading into the molecular beam epitaxy (MBE) growth chamber. There, the Si wafers were heated to approximately T = 650 °C for 30 min in order to create small openings in the native oxide layer. Subsequently at T = 590 °C, an equivalent of 40 ML (monolayer) Ga was deposited, forming small Ga-droplets at the Si substrate. NW growth was initiated by providing Ga and As simultaneously. At a V/III ratio of ~2 (absolute fluxes), and equivalent Ga-limited two-dimensional (2D) GaAs(001) growth rate f Ga = 0.07 ML/s, Ga-catalyzed NW were grown for 30 min. After this procedure, the sample was cooled down and taken out of the MBE resulting in sample A. The growth procedure for sample B consists of two parts. The first part is identical to that of sample A, but instead of the cooldown after the growth, the grown GaAs structures were thermally desorbed at T = 700 °C. The complete removal of GaAs during desorption was verified by in situ reflection high-energy electron diffraction. After this desorption step, Ga-droplets were deposited again and NW growth was repeated. After the second growth, sample B was cooled down and taken out of the MBE. For sample C, an additional desorption and re-growth step was added. This way, we obtained three samples with NW grown under identical growth parameters, which only should differ by the pre-treatment procedure. In addition and in order to investigate the Ga-droplets serving as seed particle for NW growth, we prepared three additional samples stopping after the Ga deposition step, respectively.
Results and discussion
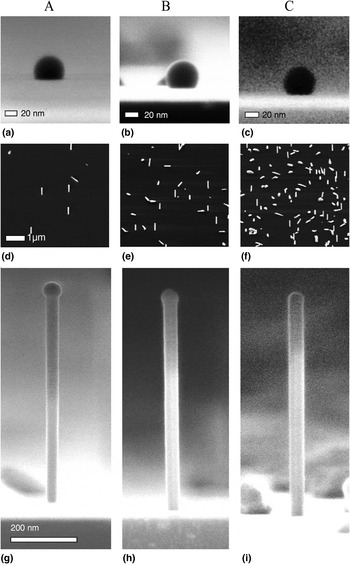
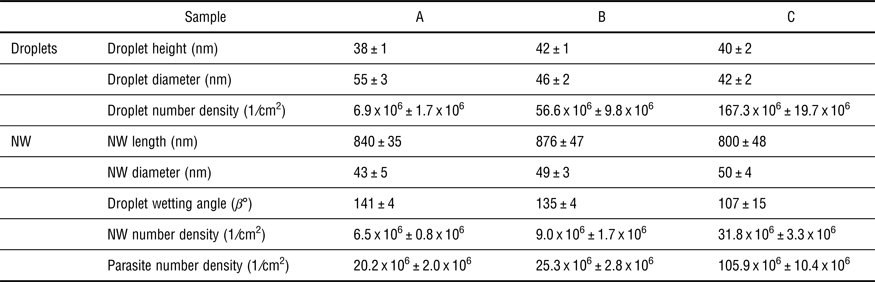
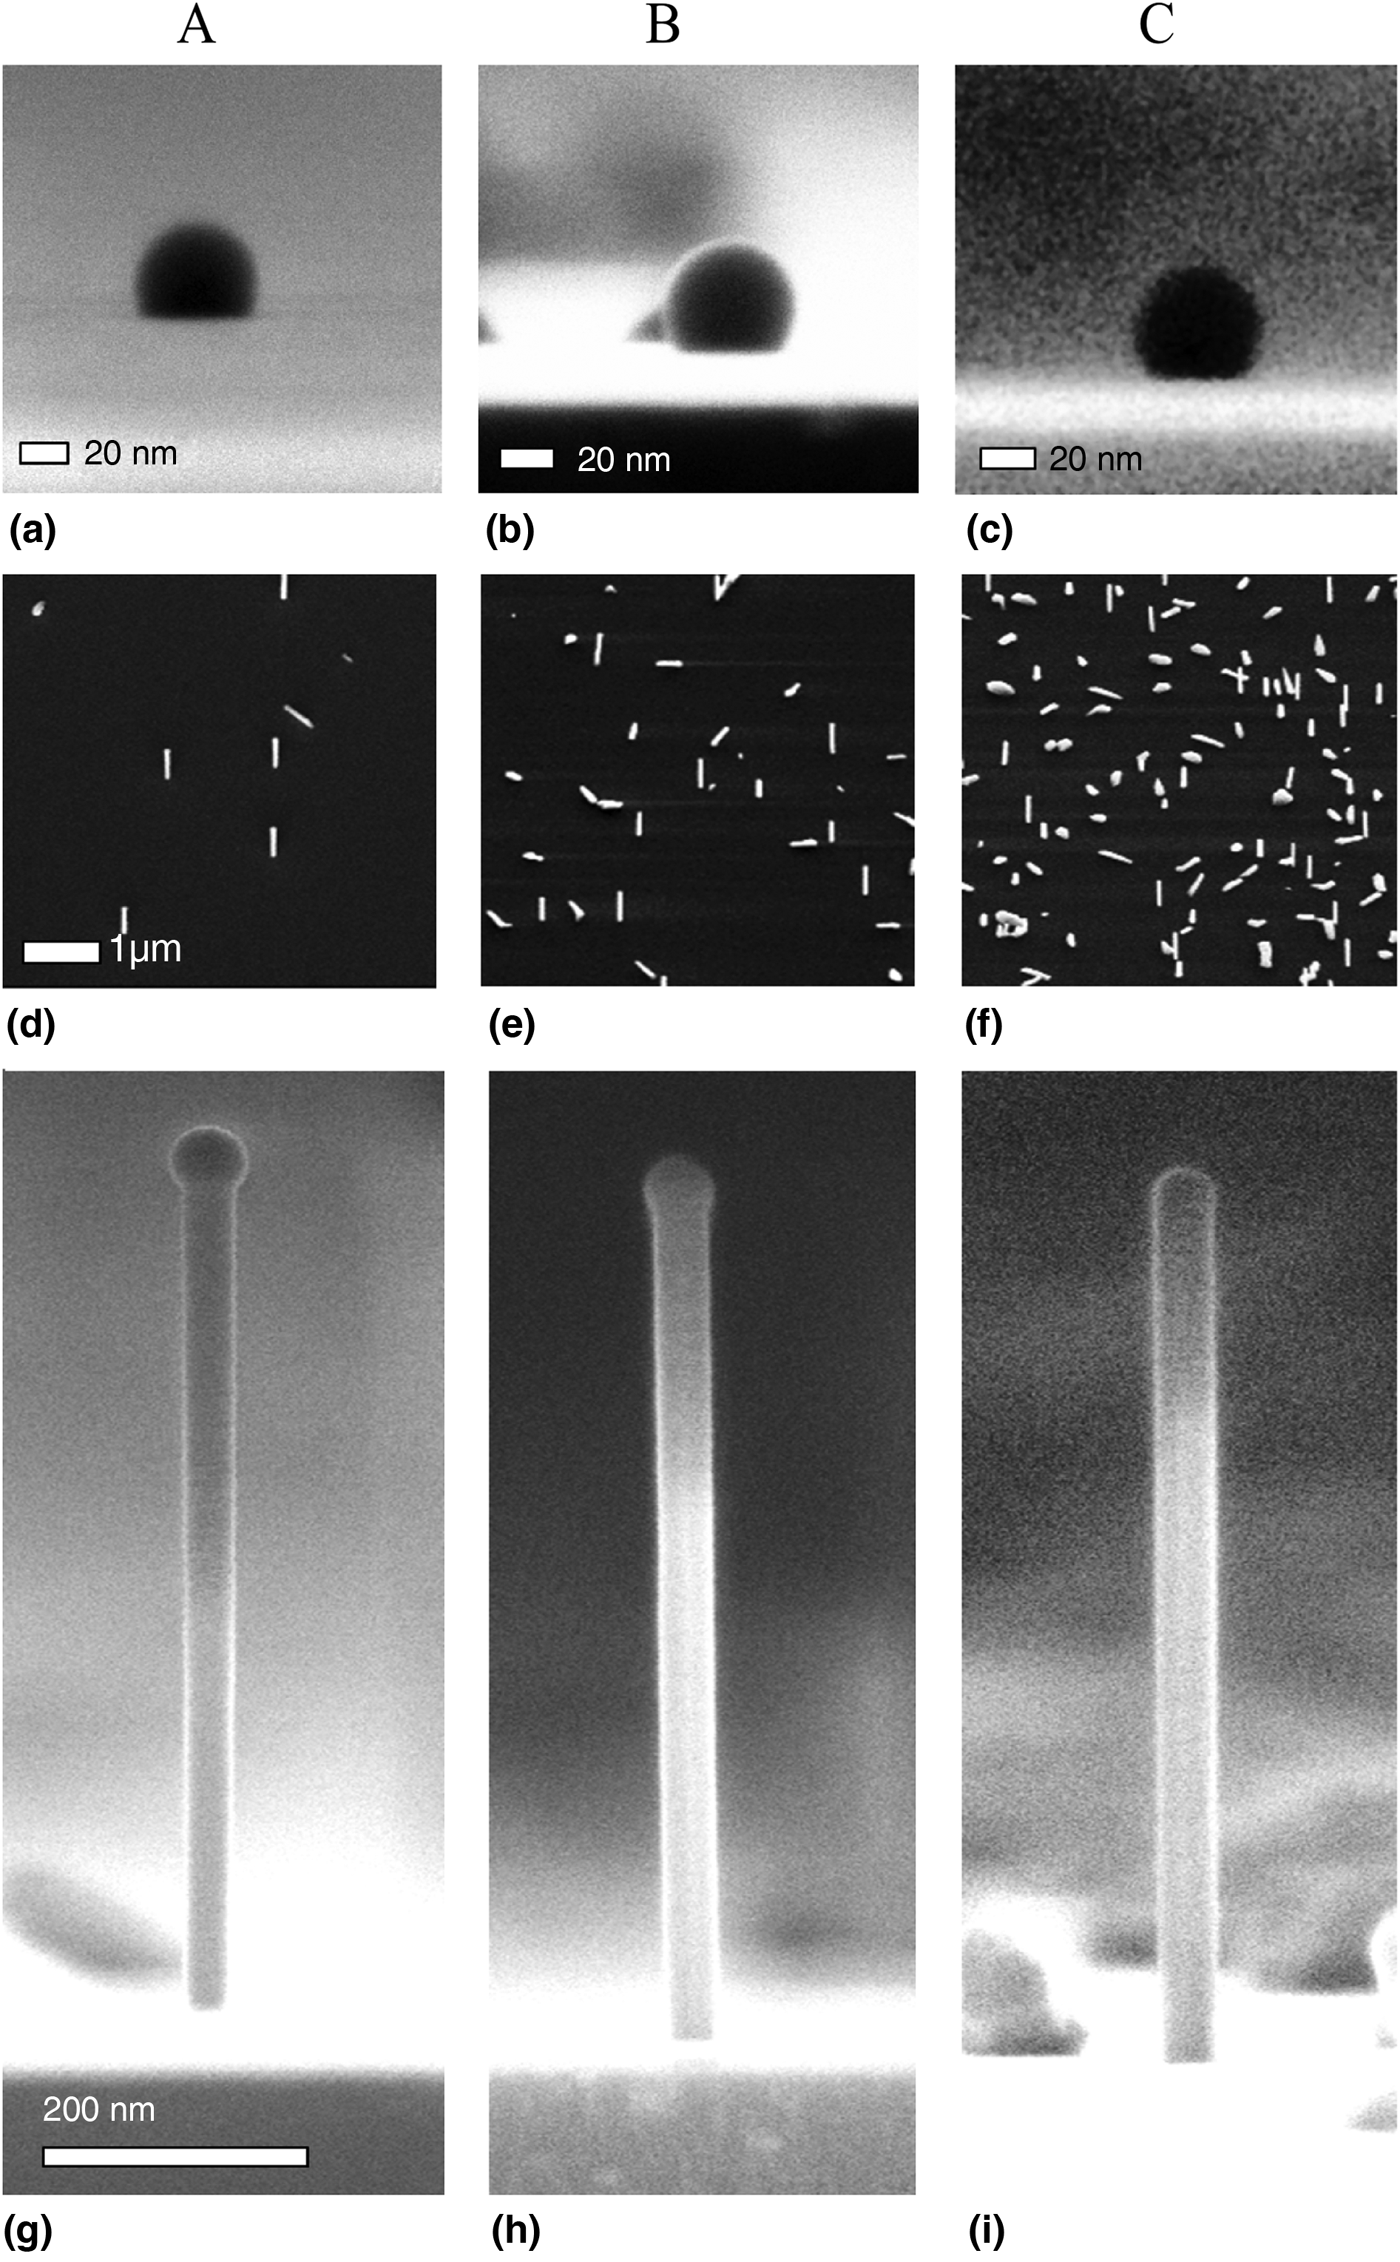
First, we investigated the grown samples by SEM in terms of NW length, diameter, droplet shape, as well as number density. The results are summarized in Fig. 1 and Table I. First, the Ga-droplets deposited prior to NW growth have similar size and shape. Second, we found that also the NW length and diameter are comparable for the three samples. At the same time, the NW number density increases, since new nucleation sites are created each time the GaAs structures are thermally removed. In addition, differences in the wetting angle β between Ga-droplet and the NW top facet can be observed. Whereas pronounced droplets with β A = 141 ± 4° were found for sample A, the wetting angle (and with it also the droplet volume) decreases continuously down to β C = 107 ± 15° in case of sample C. Since the axial NW growth rate scales with the As-flux, and the mean diameter is influenced by the Ga-flux, the NW dimensions are expected to be affected by a variation of the number density.[Reference Gibson and LaPierre13] In our case, NW length and diameter are comparable, implying similar growth conditions for the three samples from this point of view. The vertical NW yield, meaning the ratio of vertical GaAs NW and non-vertical GaAs structures (so-called “parasites”) was constant and ~0.3 for the investigated samples.
(a)–(c) Side view of Ga-droplets after the Ga-pre-deposition stage before the respective growth of the NW sample. (d)–(f) Birds-eye view (30° w.r.t. surface normal) of the grown NW samples. (g)–(i) Side view of GaAs NW from samples A, B, and C, showing Ga-droplets of varying shape at their tip.
Summarized SEM results obtained from Ga-droplets serving as the seed particles [compare Fig. 1(a)–(c)] and NW samples A, B, and C [compare Fig. 1(d)–(i)]. For samples B and C, two kinds of Ga-droplets are observed: small droplets with diameters of ~40−60 nm, and large but flat, shallow droplets measuring 100−200 nm across (not shown here) which later contribute to parasitic growth.
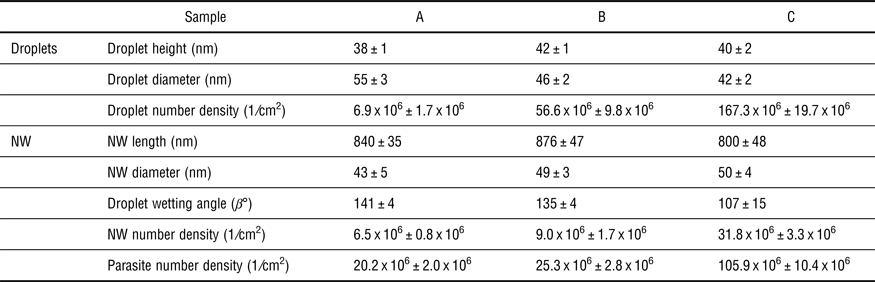
The error bars are the standard deviation of the respective value distribution.
The apparent difference observed by SEM, apart from the NW number density and slight tapering, is the wetting angle β of the Ga-droplet with the (111)-top facet of the NW. Having in mind that the Ga-droplets from which the NWs initially were grown have comparable size (V ~ 60 × 103–70 × 103 nm3) and shape (β ~ 130–140°), the differences in their wetting angle must have evolved during the growth process. The variation of β during growth, however, should have a crucial influence on the incorporation of stacking faults in the NW and the formation of polytypic GaAs segments.[Reference Jacobsson, Panciera, Tersoff, Reuter, Lehmann, Hofmann, Dick and Ross8] We characterize the crystal structure of the NWs by performing x-ray diffraction experiments at the KIT light source. A large x-ray beam size of 0.5 mm (v) × 2.0 mm (h) at E = 12 keV photon energy allows to measure statistically representative NW properties. Symmetrical diffraction is sensitive to the stacking sequence of polytypic segments along the NW [111] growth axis. Polytypism refers to the coexistence of the metastable hexagonal wurtzite (WZ) phase and the stable cubic zincblende (ZB) phase of GaAs within the same NW. Due to the large x-ray beam, we illuminate 105–106 NWs and thus obtain averaged statistical information on the mean segment length, and the fraction of WZ and ZB in the NW ensemble.
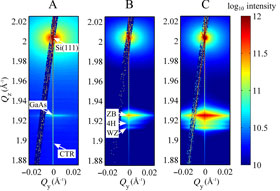
We measured the 2D scattered intensity distribution around the Si(111) and GaAs(111) Bragg reflection, represented in reciprocal space in Fig. 2. The coordinates of the reciprocal space can be calculated as
 $$\eqalign{Q_x &= (2\pi \hbox{E})/(hc) \;[\cos (\alpha_{\rm f})\sin (v_{\rm f}) + \cos (\alpha_{\rm i})\sin (v_{\rm i})],\cr Q_{y} &= -(2\pi \hbox{E})/(hc)\; [\cos (\alpha_{\rm f})\cos (v_{\rm f}) - \cos(\alpha_{\rm i})\cos (v_{\rm i})], \hbox{and} \cr Q_{z} &= (2\pi \hbox{E})/(hc)\;[\sin (\alpha_{\rm i}) + \sin (\alpha_{\rm f})].}]$$
c is the speed of light, and h is the Planck constant; α i,f are the incidence and exit angles of the x-ray beam with the sample surface. ν i,f are the angles between incident beam and outgoing beam with the diffracting planes[Reference Pietsch, Holy and Baumbach25] The overall intensity of the GaAs signal increases from sample A to C, together with the number density of GaAs structures. Besides that, the fine structure of the GaAs signal shows changing features. As a first approximation, we used a sum of 4 Gaussians in order to model the x-ray profiles along Q z (for details see Supplementary material).
X-ray data for samples (a)–(c). The exposure time for sample A was 20 s per detector frame, whereas the exposure time was 5 s for the samples B and C. (a) Two-dimensional intensity distribution in the Q y−Q z plane. (b) Normalized integrated intensity Q z profiles around the GaAs(111) Bragg reflection. The red line is the resulting simulation of the x-ray profile using the extended Markov approach (see text).

The most pronounced feature for all three GaAs (111) diffraction profiles is its sharp peak at Q z = 1.925 × Å−1, corresponding to the GaAs ZB phase in the NW. Close to Q z =1.918 × Å−1 and Q z = 1.912 × Å−1, additional signals can be observed which are attributed to GaAs in the 4H and WZ phases, respectively. In addition, a broad signal is overlapping with the ZB GaAs peak, arising from non-vertical parasitic GaAs growth.[Reference Köhl, Schroth, Minkevich, Hornung, Dimakis, Somaschini, Geelhaar, Aschenbrenner, Lazarev, Grigoriev, Pietsch and Baumbach26]
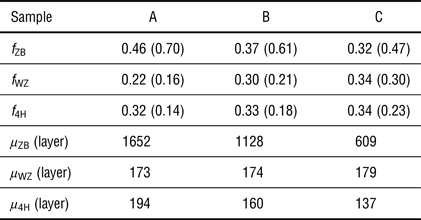
This implies that the iterative growth procedure, by changing the NW number density, has substantial impact on the crystal structure of the NWs. Comparing the intensity of the WZ GaAs signals (compare Table II values in brackets), we find that the NWs with pronounced Ga-droplets and large wetting angles of sample A contain less WZ than the NWs with the smaller droplets of sample B, and the shallow droplets of sample C. This finding is in agreement with recent reports of Jacobsson et al.,[Reference Jacobsson, Panciera, Tersoff, Reuter, Lehmann, Hofmann, Dick and Ross8] linking the nucleation of WZ to droplet wetting angles close to β ≈ 90°, whereas the growth of ZB is favored at large wetting angles β > 130°.
NW structure parameters polytype phase fraction f p and mean polytype segment length μ p resulting from simulations of the x-ray intensity profiles obtained from the extended Markov model.
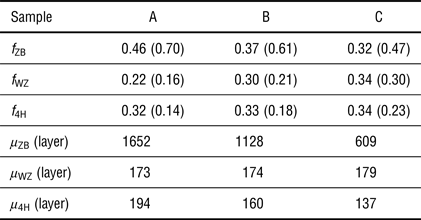
The values in brackets correspond to polytype fractions resulting from the areas of the respective Gaussian curves used for fitting the peaks at ZB, 4H, and WZ positions.
For a more precise interpretation of the x-ray results, we chose a statistical model for the generation of the stacking sequences in the NW based on a Markov approach. The original model is able to describe, for example, the evolution of the WZ–ZB polytypism in GaAs NW during growth revealed by in situ x-ray diffraction.[Reference Schroth, Köhl, Hornung, Dimakis, Somaschini, Geelhaar, Biermanns, Bauer, Lazarev, Pietsch and Baumbach27] Here, we employ an extension of this model in order to account for the occurrence of higher order polytypes such as 4H.[Reference Köhl, Schroth and Baumbach28] As shown by the red lines in Fig. 2(b), the model is capable of describing the features of the measured x-ray intensity profiles. For completeness, we added a Gaussian function to the simulation in order to account for the scattering of the GaAs parasitic growth (for details see Supplementary material). From the model parameters, we can conclude on polytype phase purity (mean segment length) μ p as well as polytype phase fraction f p in the NWs. The results are given in Table II.
According to our simulations, all NWs consist of long ZB segments and short WZ and 4H segments, in general. For self-catalyzed GaAs NW, long ZB segments are commonly observed. Also short WZ insertions are usually present at the NW base or at the NW tip. However, the 4H structure was so far mainly observed in Au-catalyzed GaAs NW.[Reference Dheeraj, Patriarche, Zhou, Hoang, Moses, Grønsberg, van Helvoort, Fimland and Weman29–Reference Johansson, Bolinsson, Ek, Caroff and Dick31] Comparing the three measured samples, not only the fraction of WZ f WZ in the NWs is increasing, whereas f ZB decreases, but also the average segment length of ZB μ ZB is decreasing from 1652 layers (A) to 609 layers (C). This means that the probability for stacking-fault generation differs for the three samples, resulting in less pure NWs in case of samples B and C. The differences in the values for the phase fraction obtained from the Markov model and the Gaussian fits in Table II can be attributed to very short segments of WZ, which do not contribute to the intensity at the main WZ peak. Instead, these short segments separated by ZB insertions give rise to a rather diffuse signal along the Q z-axis. These contributions cannot be captured by the Gaussian fit to the respective peaks, but are considered in the Markov model. This also leaves room for an ambiguous interpretation of the 4H mean segment length. Alternatively to 4H, the disordered M phase as suggested by Johansson et al.[Reference Johansson, Bolinsson, Ek, Caroff and Dick31] could cause similar contributions to the x-ray intensity profiles, since the 4H and M phases have the same hexagonality h = 0.5. Additional high-resolution transmission electron microscopy investigations of sample C (see Supplementary material) revealed no extended 4H segments but showed highly faulted segments next to WZ and ZB segments, supporting the calculations of Johansson et al.[Reference Johansson, Bolinsson, Ek, Caroff and Dick31]
A possible approach to explain the behavior of the NW crystal structure is to assume variations of the local growth conditions, meaning the material fluxes into the Ga-droplet.
Although the external growth parameters such as substrate temperature and material fluxes were kept constant for the three samples, the material is distributed among an increasing number of structures, and therefore the local conditions could change. Let us now discuss two possible scenarios: First, a reduction of the effective As-flux. We do neither observe shorter NW, nor do we observe larger droplets as the NW number density increases. Given that a reduction of the As-flux into the droplet would cause the axial NW growth rate to drop, and the Ga-droplet volume to increase, this scenario can be safely ruled out. On the other hand, an increase of effective As-flux into the droplet as described by Ramdani et al.[Reference Ramdani, Harmand, Glas, Patriarche and Travers24] would result in longer NWs, which we do not observe here.
Second, we discuss a decrease of the effective Ga-flux into the droplet. Due to the increased NW number density, the provided Ga has to be distributed among an increasing number of growing structures and thus could lead to a reduced droplet volume and serve as possible explanation for the smaller Ga-droplet wetting angles and the concomitant increase in WZ fraction. This also relates to the observed NW shape. While the NWs of sample A are inversely tapered [compare NW base diameter d b = 30 nm with NW top diameter d t = 40 nm in Fig. 1(g)], almost no tapering can be observed for the NWs of samples B and C. Inverse tapering indicates that more Ga is accumulated in the liquid droplet than needed for sustaining the crystal growth, causing an inflation of the liquid Ga-droplet. Therefore, the absence of tapering for samples B and C also implies a reduction of the effective Ga-flux into the droplet. In order to relate the observed droplet wetting angles with Ga-flux reduction, we use a model proposed by Tersoff,[Reference Tersoff32] considering the droplet at the NW tip being close to its equilibrium shape
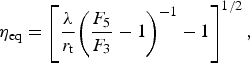 $$\eta _{{\rm eq}} = \left[ {\displaystyle{\lambda \over {r_{\rm t}}}{\left( {\displaystyle{{F_5} \over {F_3}} - 1} \right)}^{ - 1} - 1} \right]^{1/2},$$
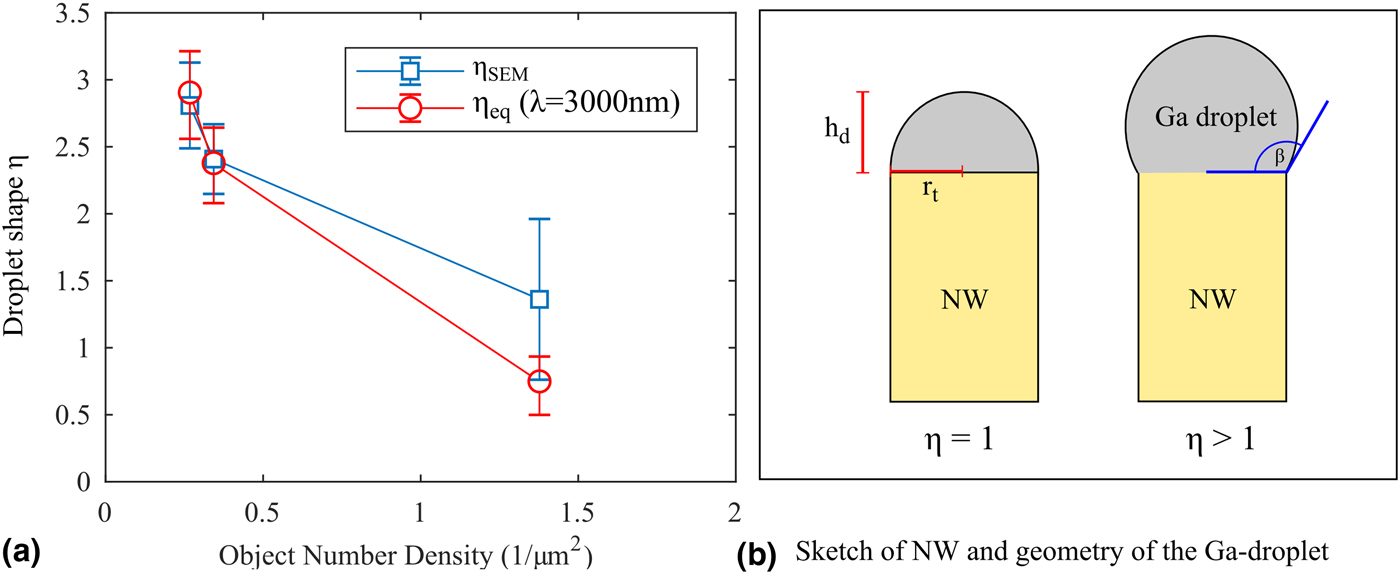
where λ is the Ga diffusion length, r t is the NW radius below the droplet, and F 5/F 3 is the ratio of the As-flux (F 5) and the Ga-flux (F 3).[Reference Tersoff32] η is the droplet shape
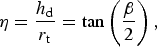 $$\eta = \displaystyle{{h_{\rm d}} \over {r_{\rm t}}} = \tan \left( {\displaystyle{\beta \over 2}} \right),$$
depending on the droplet height h d and the droplet wetting angle β (illustrated in Fig. 3).
(a) Comparison of equilibrium droplet shape η eq for reduced group III flux and measured droplet shape η SEM. (b) Illustration of the droplet geometry.
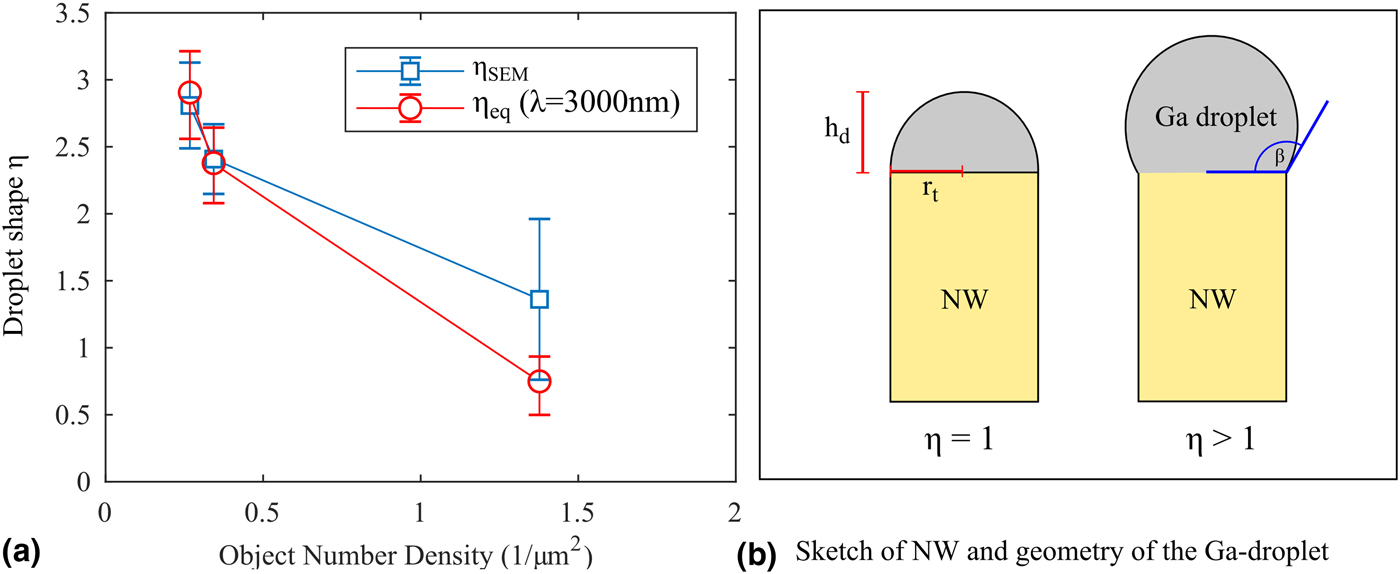
In Equation (1), a reduction of the Ga-flux F 3 causes a reduction of η eq, which is in agreement with our observations. If we further consider a relation between the reduction of the effective Ga-flux into the droplet, and the increasing number density of objects, we can express the reduced Ga-flux
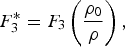 $$F_3^{\ast} = F_3\left( {\displaystyle{{\rho _0} \over \rho}} \right),$$
for ρ 0 ≤ ρ. Here, ρ is the number density of GaAs objects (including NW and parasites), and ρ 0 is the theoretical number density for which  $F_3^{\ast} = F_3$. Now we define ρ 0 = 1/(πλ 2) where the effective collection area for Ga supplying the growth of only a single object depends on the Ga diffusion length λ. The theoretical equilibrium droplet shape η eq for
 $F_3^* $ can be calculated by using ρ = ρ NWs + ρ parasites from Table I, with λ as the only free parameter. Comparing these results with the measured droplet shape from SEM, we find a good agreement between our calculations and experiment on Si covered by native oxide for λ = 3000 nm, which would correspond to ρ 0 = 3.54 × 106 cm−2, as shown in Fig. 3. Please note that the Ga-flux into the droplet is unlikely mediated by surface diffusion alone but also constituted by Ga re-evaporation from the surface. Therefore, λ does not directly correspond to the surface diffusion length of Ga, but has to be interpreted qualitatively as an effective collection length for Ga in an area surrounding a NW (accounting for Ga reaching the droplet by various pathways). Numerical modeling, including, for example, material re-evaporation, sidewall growth and shadowing effects describing the case of ordered and dense arrays of GaAs NW grown by SAG have been recently presented elsewhere[Reference Gibson and LaPierre13, Reference Oehler, Cattoni, Scaccabarozzi, Patriarche, Glas and Harmand33] but do not provide a practical formula, which could directly be used to calculate the NW number density on the effective Ga-flux into the droplet. In contrast, the above simple relationship between reduced Ga-flux and number density is able to describe the observed wetting angles, in agreement with theory, and demonstrates the effect of NW number density on the local growth conditions, and its consequence for NW crystal structure. As a consequence for NW fabrication aiming on high-density high-purity structures for device applications, the growth parameters have to be tuned for the desired NW number density separately. Our experiments indicate that the NW growth conditions cannot be fully decoupled from NW number density, resulting in the presented consequences for the evolving NW crystal structure. Our results, however, give a hint on how the growth parameters could be adapted: the reduction of the effective Ga-flux into the Ga-droplet, caused by the increase of NW number density could be remedied by increasing the nominal Ga-flux according to Eq. (3). These results were obtained for self-catalyzed GaAs NWs grown on Si(111) covered with native oxide, but an in principle similar behavior is expected for site-selective GaAs NWs grown on lithographically patterned substrates.
Conclusion
In conclusion, by an iterative, lithography-free growth procedure, we tune the NW number density investigating its influence on the local conditions for self-catalyzed NW growth. We compared GaAs NW ensembles of different number density grown with otherwise identical growth parameters. We characterized NW length and diameter, as well as the shape of the liquid Ga-droplets, and found that the wetting angle of the liquid Ga-droplet decreases, as the NW number density increases. X-ray diffraction and simulations reveal the presence of higher order polytypism, demonstrating the validity of the extended Markov model for the calculation of x-ray profiles from polytypic NW, and providing values for the mean polytype segment length and fraction. The WZ fraction increased concomitantly with the density, whereas the ZB fraction and mean ZB segment length decreased. These findings can be explained within the growth model of Tersoff, including the reduction of the available Ga-flux per liquid Ga-droplet during growth as a result of increased number density.
Supplementary material
The supplementary material for this article can be found at https://doi.org/10.1557/mrc.2018.145.
Acknowledgments
The authors thank G. Buth, B. Krause, and S. Stankov for their support at KIT. The Laboratory for Electron Microscopy (LEM) at KIT is acknowledged for TEM access, as well as the Institute for Nanotechnology (INT) for access to the SEM. The authors acknowledge the KIT light source for provision of instruments at their beamlines and we would like to thank the Institute for Beam Physics and Technology (IBPT) for the operation of the storage ring, the Karlsruhe Research Accelerator (KARA). This work was funded by BMBF project 05K16PSA.