I. INTRODUCTION
Visible light absorbing photocatalysts are a significant step in the move toward solar energy generation being a viable alternative to traditional fossil fuels. These photocatalysts can allow for the storage of excess solar energy by promoting useful chemical reactions, such as splitting water.Reference Cook, Dogutan, Reece, Surendranath, Teets and Nocera1 Metal oxides like TiO2,Reference Fujishima and Honda2,Reference Fujishima and Kohayakawa3 ZnGa2O4,Reference Ikarashi, Sato, Kobayashi, Saito, Nishiyama and Inoue4 and SrTiO3Reference Carr and Somorjai5–Reference Domen, Naito, Onishi, Tamaru and Soma7 have demonstrated stable activity for the water splitting reaction but are limited by their band gaps to UV light absorption. Increasing the portion of the light spectrum absorbed by these metal oxides is key to enhancing their utility.
While many efforts have been made to improve the activity of wide band gap semiconductors, of particular note is the work to reduce the band gap of metal oxides by substitution of oxygen with other anions. These substitutions have included iodine,Reference Hahn, Hoang, Self and Mullins8 sulfur,Reference Ma, Chen, Kuang, Akiyama, Hisatomi, Nakabayashi, Shibata, Katayama, Minegishi and Domen9 nitrogen,Reference Pan, Takata, Nakabayashi, Matsumoto, Shibata, Ikuhara and Domen10–Reference Maeda, Takata, Hara, Saito, Inoue, Kobayashi and Domen16 and among others. The Domen group, specifically, has done extensive work on metal oxynitrides for photocatalytic water splitting using visible light.Reference Pan, Takata, Nakabayashi, Matsumoto, Shibata, Ikuhara and Domen10,Reference Pan, Hisatomi, Wang, Nakabayashi, Shibata, Pan, Takata and Domen13,Reference Maeda, Lu and Domen14,Reference Maeda, Takata, Hara, Saito, Inoue, Kobayashi and Domen16–Reference Chun, Ishikawa, Fujisawa, Takata, Kondo, Hara, Kawai, Matsumoto and Domen24 The activity of metal oxynitrides for both the hydrogen and oxygen half-reactions is also known to increase with the addition of co-catalysts.Reference Ma, Chen, Kuang, Akiyama, Hisatomi, Nakabayashi, Shibata, Katayama, Minegishi and Domen9,Reference Pan, Takata, Nakabayashi, Matsumoto, Shibata, Ikuhara and Domen10,Reference Teramura, Maeda, Saito, Takata, Saito, Inoue and Domen17,Reference Lee, Terashima, Shimodaira, Teramura, Hara, Kobayashi, Domen and Yashima25–Reference Hitoki, Takata, Kondo, Hara, Kobayashi and Domen27 Synthesis of these oxynitride photocatalysts typically involves solid-state reaction of oxide precursors at temperatures ≥900 °C for several hours followed by nitridation in a stream of ammonia gas, also at high temperatures for several hours.Reference Maeda, Takata, Hara, Saito, Inoue, Kobayashi and Domen16 While this synthesis method is effective, the need for high temperature annealing, the use of ammonia gas, and the length of time of preparation limits the search for new candidate materials.
Combustion synthesis and solution combustion synthesis present a straightforward solution to these issues. Combustion synthesis methods have shown great promise to quickly and reproducibly generate multimetal oxides, oxides doped with secondary elements, nitrides, carbides, and crystalline silicon.Reference Aruna and Mukasyan28–Reference Buha, Djerdj, Antonietti and Niederberger40 Solution combustion synthesis relies on mixing one or more oxidizing precursors (often, nitrates) with a fuel source such as urea or glycine, and igniting them by either heating in a furnace or via a localized heat source, such as a live tungsten wire. A review of past and current work in the field of combustion synthesis, including work related to photocatalysis, is available and recommended for the interested reader.Reference Varma, Mukasyan, Rogachev and Manukyan41
In this work, we show that gallium zinc oxynitrides with controllable Ga:Zn ratios can be prepared by a combustion method, are visible-light active, and are capable of producing oxygen and hydrogen photocatalytically. These powders also exhibit photoactivity under both simulated AM1.5 and visible (λ > 435 nm) light. In addition, we discuss the hurdles to expanding this method to new candidate materials and potential strategies for dealing with them.
II. EXPERIMENTAL METHODS
A. Materials
Zinc nitrate hexahydrate (98%, Strem Chemicals, Newburyport, Massachusetts), gallium nitrate hydrate (99.9%, Alfa Aesar, Tewskbury, Massachusetts), sodium sulfate anhydrous (VWR), 9–11 and 45–55 mPa s ethyl cellulose (5% in toluene + ethanol, TCI), α-terpineol (VWR), rhodium trichloride (38.5–45.5% metals, Alfa Aesar), potassium chromate (99%, Beantown Chemical, Hudson, New Hampshire), lanthanum oxide (Alfa Aesar), silver nitrate (VWR), and urea (VWR) were purchased and used as received. All water used was deionized through a Millipore Direct8 system (MilliporeSigma, Burlington, Massachusetts) to 18 MΩ resistance.
Fluorine-doped tin oxide (FTO) glass (30 cm by 30 cm by 2 mm, 7 Ω/sq) was purchased from Sigma-Aldrich (St. Louis, Missouri). 1 cm by 3 cm substrates were cut from the glass, and the substrates were cleaned by sonication in soapy DI water, ethanol, and acetone to remove dirt and organics before use.
B. GaxZn1−xOyN1−y synthesis
Gallium nitrate, zinc nitrate, and urea were added to a ceramic crucible in predetermined molar ratios along with 10 mL of water. The crucible was covered (aluminum foil crimped over the crucible or a ceramic lid will suffice) and introduced to an oven preheated to the desired temperature. The reaction proceeded for 30 min. The as-synthesized product was homogenized in a mortar-and-pestle for subsequent physical and photoelectrochemical characterization.
***NOTE: a significant volume of gas is released during this reaction! Please use caution in your choice of reaction vessel to ensure that over-pressurization and subsequent explosion does not occur.
For guidance to the reader, the 1:1:10 sample was synthesized using 0.002 mol Ga(NO3)3, 0.002 mol Zn(NO3)2, and 0.02 mol urea. Molar ratios synthesized include 0:1:5, 0:1:10, 1:0:5, 1:1:0, 1:1:5, 1:1:10, 1:2:15, 2:1:15, 3:1:20, 1:3:20, 4:1:25, among others not discussed in this manuscript. The synthesis temperature ranged from 350 to 800 °C in 50 °C increments. “Double batches” (i.e., simple doubling of the mol amounts of each precursor) can be made to produce more powder product at once. Please note, however, that we have not conducted a full investigation to determine how much product can be synthesized at once and that all work described in this manuscript was carried out on powders synthesized as described above.
C. Electrode preparation
We prepared a paint using a modified method from Abbas et al.Reference Abbas, Basit, Yoon, Lee, Lee, Park, Kamat and Bang42 In brief, we ground 0.025 g of both 9–11 and 45–55 mPa s ethyl cellulose in a mortar-and-pestle with 3 mL of ethanol until fully dissolved. Then, a chosen amount of oxynitride powder (typically either 0.05 or 0.1 g) was added and ground into the ethyl cellulose solution. Finally, 170 μL of α-terpineol was added, and the mixture was ground until a paint-like consistency was achieved. This typically occurred in about 10–15 min.
Working electrodes of the oxynitride powders were prepared by doctor-blading the paint solution onto FTO substrates and subsequent annealing at 250 °C for 20 min in air.
D. Physical characterization
UV-visible (UV-Vis) spectra were collected in diffuse reflectance mode from 850 to 350 nm on a Shimadzu UV-2600 (Shimadzu Corporation, Tokyo, Japan) equipped with an ISR-2600 integrating sphere. Conversion to absorbance was carried out within UV Probe software. Samples were mixed with barium sulfate to a 2 wt% ratio. The reference sample was 100% barium sulfate.
X-ray diffraction (XRD) experiments were carried out on a Rigaku Ultima IV (Rigaku, The Woodlands, Texas) utilizing Cu Kα radiation with a diffracted beam graphite monochromator from 2θ = 10–70° with a step size of 0.04° and a scan rate of 1°/min. Calculated spectra were generated using Mercury software with CIF data downloaded from www.crystallography.net.
X-ray photoelectron spectroscopy (XPS) data were collected using a Kratos Axis Ultra DLD (Kratos Analytical, Manchester, UK) equipped with a monochromated Al Kα X-ray source and hemispherical analyzer. The samples were held under vacuum overnight before any measurements were carried out. All reported binding energies were calibrated to the C–C bond at 284.8 eV. Peaks were fit with XPSPEAK41 software.
SEM imaging and EDX analysis were captured on a Tescan Vega-3 SBU microscope (Tescan, Brno, Czech Republic) equipped with a backscattered electron detector. For imaging, the accelerating voltage was 10 kV. For EDX, the voltage was 20 kV.
E. Rh/CrOx deposition
For some photoelectrochemical experiments, a Rh/CrOx core/shell hydrogen evolution catalyst was photodeposited following the method of Maeda et al.Reference Maeda, Teramura, Lu, Saito, Inoue and Domen43 3 mg of RhCl3 was dissolved in 100 mL of water, followed by the addition of 100 mg of the oxynitride powder. The solution was degassed with argon for 30 min and irradiated with AM1.5 filtered light for 1 h.
The CrOx shell was then deposited onto the Rh/GaxZn1−xOyN1−y powder by irradiating a degassed 100 mL aqueous solution of 0.8 mM K2CrO4 for 3.5 h. Finally, the CrOx/Rh/GaxZn1−xOyN1−y powder was dried in an oven overnight in static air at 70 °C.
F. Photoelectrochemical characterization
Photoelectrochemical measurements were first conducted in a 3-electrode setup with the GaxZn1−xOyN1−y film on a conducting glass substrate as the working electrode, a Pt wire as the counter electrode, and a saturated calomel electrode (SCE) as the reference electrode. The electrolyte was either aqueous 0.2 M Na2SO3/0.1 M Na2SO4 or 0.5 M Na2SO4. A 300 W Xe lamp (ScienceTech SF300A, Ontario, Canada) equipped with an AM1.5 filter was used as the irradiation source. For measurements requiring visible light only, a 435 nm long pass filter (ThorLabs) was added to cut off the UV region of the spectrum. Light intensity was measured with a ThorLabs Si cathode-grounded photodiode.
2-electrode photoelectrochemical measurements were also carried out with a Pt wire as both the counter and reference electrodes and 0.5 M Na2SO4 as the electrolyte. GaxZn1−xOyN1−y films on conducting glass substrates were used as the working electrode.
All current–voltage experiments were conducted with a scan rate of 10 mV/s, a quiet time of 10 s at the starting potential, and were scanned from negative to positive potentials. Current–time measurements were carried out with thrice-repeated 30 s off, 30 s on periods of irradiation unless otherwise indicated.
G. Hydrogen and oxygen evolution measurements
Hydrogen and oxygen were evolved as half-reactions. For hydrogen, 100 mg of Rh/CrOx loaded powder was suspended by stirring in 250 mL of 50 vol% ethanol/water in a sealed flask. Prior to irradiation, the solution was degassed with argon while stirring. For oxygen, 100 mg of oxynitride powder, without any co-catalysts, was suspended in 250 mL of a 10 mM AgNO3 solution in a sealed flask. Prior to irradiation, the solution was degassed with argon while stirring. Headspace samples were collected via syringe with a constant volume of 0.5 mL used for measurements. Before pulling the samples from the headspace, the syringe was flushed with argon to prevent contamination of the samples with oxygen and nitrogen from the atmosphere. Evolved gas amounts were determined using calibrated gas samples and total headspace volume. Peak areas were fit and integrated using XPSPEAK41.
III. RESULTS AND DISCUSSION
GaxZn1−xOyN1−y powders were synthesized by a solution combustion method using urea as the fuel and nitrates as the oxidizer at a wide range of temperatures (350–800 °C). For simplicity, these powders are referred to throughout the text by the precursor molar ratio (e.g., 1:1:10 refers to 1 part Ga, 1 part Zn, and 10 parts urea). Urea decomposes, beginning at temperatures of approximately 150–200 °C, into a number of reactive products, including biuret, cyanic acid, and ammonia [as NH4+(aq) or NH3(g)].Reference Schaber, Colson, Higgins, Thielen, Anspach and Brauer44 The reaction was allowed to proceed for 30 min, after which the reaction is considered complete. As synthesized, the powders had a foam-like texture that became more granulated as the reaction temperature was raised to 800 °C. Zinc-rich powders typically produced a deeper orange color while gallium-rich powders tended to a yellow-white hue. In general, a 5:1 fuel-to-metal ratio was found to produce powders with the largest visible-region range of absorption. Increasing or decreasing the fuel-to-oxidizer ratio typically favored the formation of only oxides, although there was evidence of slight N-doping in some samples (see Fig. S2).
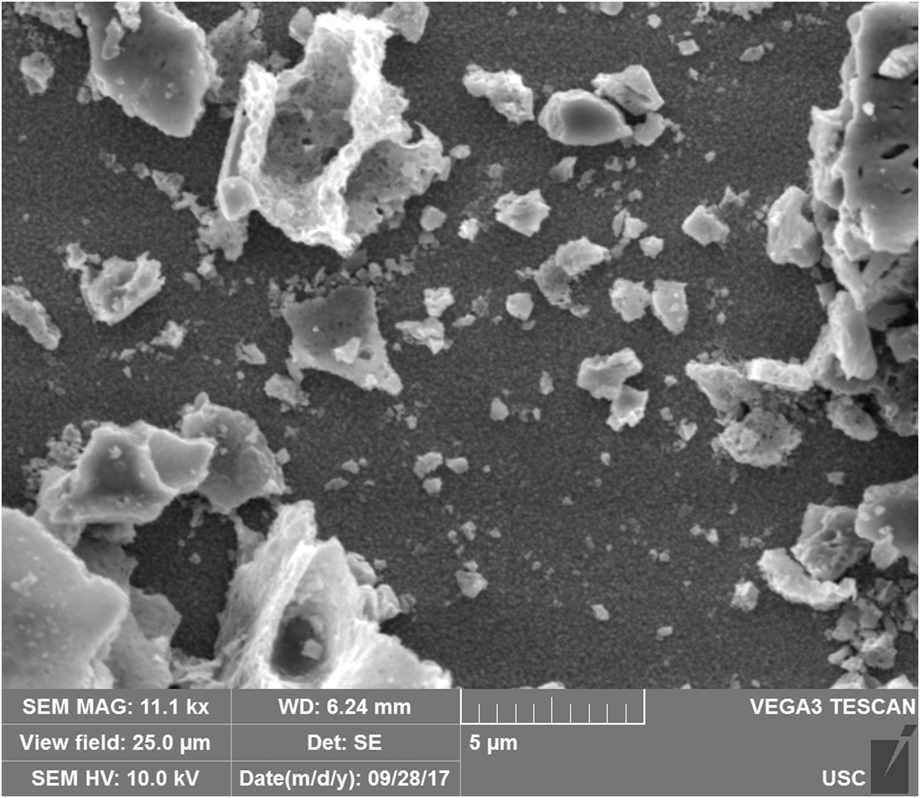
The particle size of the powders and morphology of the as-synthesized GaxZn1−xOyN1−y samples were estimated by scanning electron microscopy (SEM) imaging (Fig. 1) of painted films. It is clear from the images that the powders consist of particles ranging from a few tens of nanometers to microns in diameter. The porous structure of the particles is due to the rapid formation of gas bubbles during the synthesis procedure.
SEM image of the 1:1:10 GaxZn1−xOyN1−y sample prepared at 500 °C for 30 min. The morphology seen here is a characteristic of all GaxZn1−xOyN1−y samples imaged with the SEM. The accelerating voltage was 10 kV.

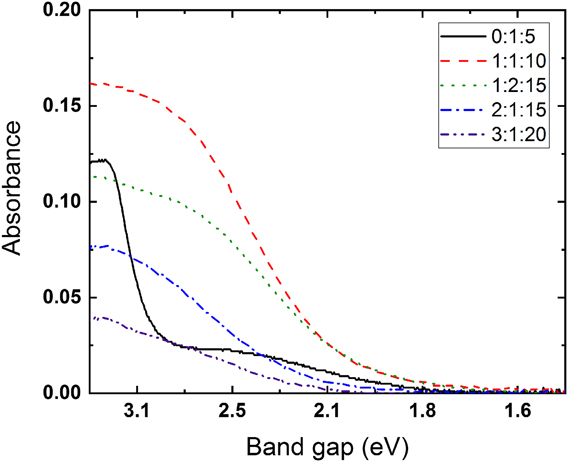
Figure 2 shows the absorption onset for several GaxZn1−xOyN1−y samples. Direct band gapsReference Fujishima, Kato, Maekawa and Honda45 were determined using Eq. (1) with diffuse reflectance measurements:
 $${\left( {h\nu \alpha } \right)^2} = A\left( {h\nu - {E_{\rm{g}}}} \right)\quad ,$$
where hν is the energy of the incident photon, E g is the band gap of the material, A is a proportional constant, and α is the Kubelka–Munk absorption coefficient.
Kubelka–Munk absorbance of synthesized powders from different precursor molar ratios of Ga(NO3)3, Zn(NO3)2, and urea synthesized at 500 °C. Spectra were gathered from 850 to 350 nm at a 1 nm/s scan rate. BaSO4 was used as a 100% reflectance reference material.

ZnO (>3.0 eV),Reference Fujishima, Kato, Maekawa and Honda45 GaN (3.4 eV),Reference Trapalis, Heffernan, Farrer, Sharman and Kean46 and ZnGa2O4 (>4.0 eV)Reference Ikarashi, Sato, Kobayashi, Saito, Nishiyama and Inoue4,Reference Oshima, Niwa, Mukai, Nagami, Suyama and Ohtomo47 are all wide band gap semiconductors, so absorbance in the visible region is due to the incorporation of nitrogen into the crystal lattice, leading to an upward, more negative shift of the valence band of the semiconductor.Reference Maeda, Takata, Hara, Saito, Inoue, Kobayashi and Domen16,Reference Tessier, Maillard, Cheviré, Domen and Kikkawa48
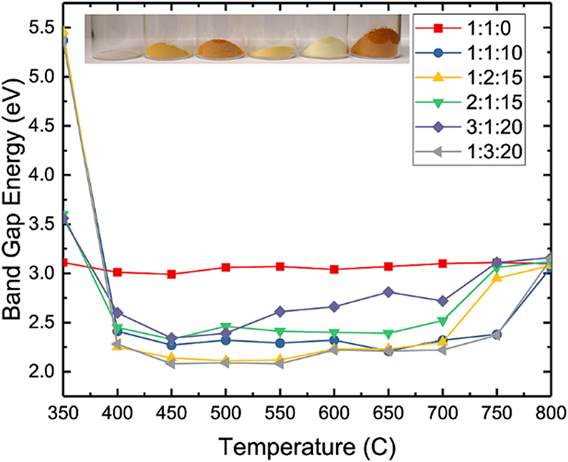
The narrowest band gaps were observed for the 1:1:10, 1:2:15, and 1:3:20 samples, all of which have direct band gaps of approximately 2.2 eV. That a narrow band gap is observed across multiple samples with different ratios of Ga:Zn suggests that the narrowing is not strongly dependent on the actual nitrogen content but is tied to the final product being Zn-rich. This is supported by previous work on GaxZn1−xOyN1−y prepared by the ammonolysis method.Reference Maeda, Teramura, Takata, Hara, Saito, Toda, Inoue, Kobayashi and Domen49 In GaxZn1−xOyN1−y samples that have either more or less than a 5:1 fuel:oxidizer ratio, the Tauc plots reveal band gaps corresponding to the metal oxides (i.e., E g ≥ ∼3.0 eV). A tail, though, was noticeable in the 0:1:5, 1:2:10, and 2:1:10 samples (Fig. S2). These tails are attributed to the incorporation of nitrogen at dopant levels during the combustion synthesis as either ZnOxN1−x or Zn3N2.Reference Lu, Zhang, Wang, Saito and Uchida50 Stable formation of a pure phase of Zn3N2, which can have an optical band gap of 1.3–1.5 eV, is unlikely, however, due to its tendency to quickly oxidize.51
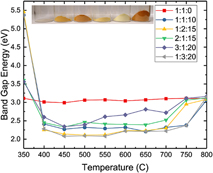
We also note that band gaps are smaller than 3.0 eV for all precursor ratios used, except 1:1:0 (synthesis without urea), for temperatures between 400 and 700 °C (Fig. 3). Furthermore, these band gaps are mostly constant throughout this region, with the exception of the 3:1:20 molar ratio samples. For the 3:1:20 ratio, a slight increase in band gap is observed starting at a synthesis temperature of 550 °C and above.
Calculated band gaps for various Ga:Zn:urea ratios at different reaction temperatures. In all cases, the reaction time was 30 min, and the atmosphere was static air. The inset picture is of the powders produced at 500 °C.

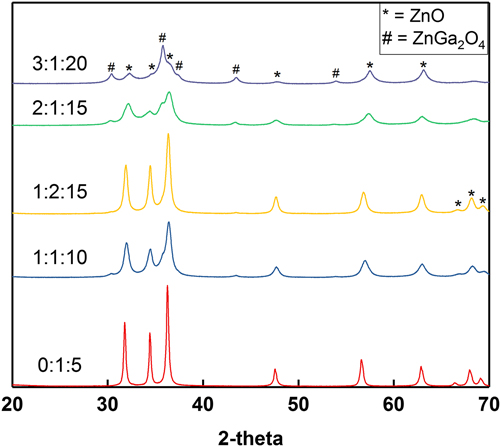
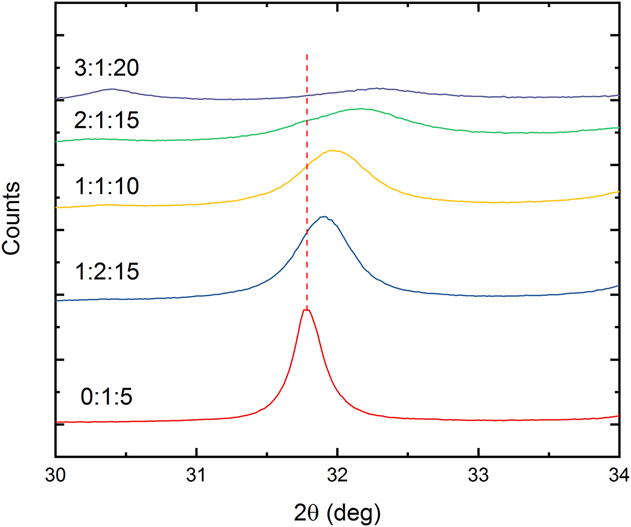
XRD data for several different precursor molar ratios prepared at 500 °C are compared in Fig. 4. ZnO is the primary crystalline phase in the 0:1:5 sample, as expected. As the amount of gallium present in the powders increases (0:1:5 to 2:1:15), however, the ZnO peaks shift to higher 2θ. This shift to higher 2θ angles suggests the co-formation of GaN (see blowup in Fig. 5) resulting in a GaN:ZnO complex. The Domen groupReference Maeda and Domen22,Reference Maeda, Teramura, Takata, Hara, Saito, Toda, Inoue, Kobayashi and Domen49 observed a similar shift in these peaks for gallium zinc oxynitrides synthesized by the solid-state ammonolysis method. The peaks corresponding to ZnO in the 2:1:15 and 3:1:20 samples broaden, indicating shrinking crystalline domains, and become smaller in intensity. At the same time, peaks corresponding to ZnGa2O4 become more prominent. In particular, peaks corresponding to the 002 and 102 planes of ZnO are gone in the 3:1:20 sample.
XRD patterns for samples with different precursor ratios synthesized at 500 °C. Scans were collected from 10 to 70° with a step size of 0.04° and scan rate of 1°/min.

Blow-up of Fig. 4, highlighting the shift from ZnO to GaN as the Zn/Ga precursor ratio changes. The red dotted line corresponds to the [100] crystallographic peak of ZnO.

Figure S3 shows XRD spectra for 1:1:10 samples with increasing reaction temperature. As expected, the crystallinity of the powders increases with increasing temperatures. We also note, however, slight shifts in the peak positions. From 350 °C up to 600 °C, peaks corresponding to ZnO and ZnGa2O4 shift to higher 2-theta positions, indicating the incorporation of nitrogen into the powders. Above 600 °C, however, the peaks shift back to lower 2-theta values corresponding to peak positions of ZnO and ZnGa2O4, indicating that oxide formation is favorable at higher temperatures.
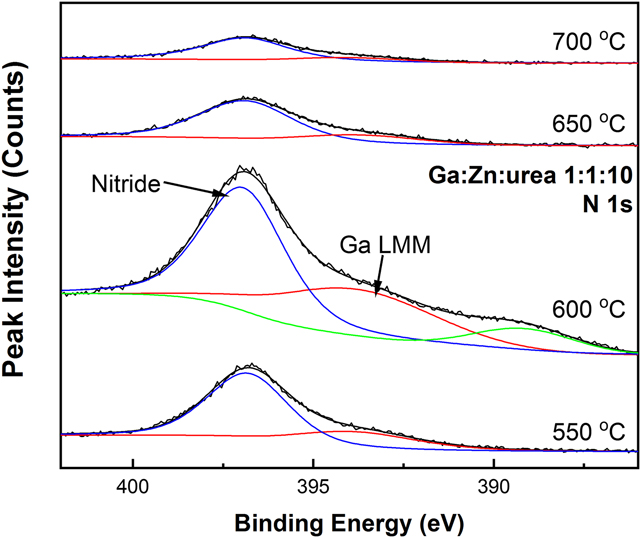
XPS analysis confirmed the incorporation of nitrogen and was used to determine the atomic composition of and elemental valence states in the as-synthesized powders. Figure S1 shows typical Ga 2p and Ga 3d XPS spectra, which confirm the formation of a GaN phase.Reference He, Chikyow, Chen, Chen, Liu and Sun52 Figure 6 has N 1s spectra for GaxZn1−xOyN1−y powders synthesized at different temperatures with a 1:1:10 precursor ratio. All the peaks are within a range that can be reasonably assigned to the formation of an N3− metal nitride species, with a Ga Auger peak inconsistently observed.Reference Rignanese, Pasquarello, Charlier, Gonze and Car53 Table SII summarizes the measured atomic ratios of GaxZn1−xOyN1−y samples synthesized at 500 °C with their corresponding starting molar ratios of precursors. It can be seen that the final ratio of Ga to Zn generally follows the ratio of starting materials. Of particular note, however, is that the apparent atomic compositions, as derived from XPS analysis, show a zinc-rich surface compared to the initial ratio of the precursors. Based on the reaction temperatures used, vaporization of Ga is not reasonable, suggesting that the zinc segregates preferentially to the surface during the synthesis. This was confirmed by the EDX analysis of some samples. For example, EDX analysis (not shown) of the 1:2:15 powder gave a Ga:Zn ratio of ∼1:2.5, much closer to the expected 1:2 ratio than that observed at the surface of the powder by XPS, which was ∼1:3.5.
N 1s spectra of 1:1:10 GaxZn1−xOyN1−y powders synthesized at different reaction temperatures. All reaction times of all samples were held at 30 min.

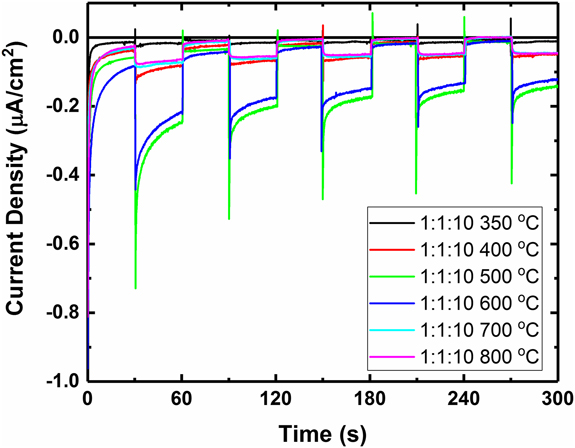
The photoactivity of select samples was evaluated with a series of photoelectrochemical measurements. SO32− was used in some experiments to scavenge holes at the photoelectrode/electrolyte interface.Reference Stefik54 The observed photocurrents (Fig. 7) are in line with that observed previously for dropcast films of GaxZn1−xOyN1−y powders.Reference Hashiguchi, Maeda, Abe, Ishikawa, Kubota and Domen55 For the 1:1:10 powder synthesized at 350 °C, no photocurrent is observed. For all other temperatures, photocurrent is observed, with the highest activity coming from the powders synthesized at 500 and 600 °C. The low photocurrent is attributable primarily to the large particle size of the oxynitride powders. The large particle size increases the likelihood of charge recombination within the particle before extraction occurs and also hinders interparticle charge transfer.
Current–time curves for different GaxZn1−xOyN1−y powders (denoted by Ga:Zn:urea ratio). Potential was held at 0 V versus SCE. Counter electrode was a Pt wire. Electrolyte was 0.2 M Na2SO3/0.1 M Na2SO4.

The 1:1:10 film gave clear and repeatable photoresponse upon illumination with visible light (λ > 435 nm) both in the presence (Fig. S4) and in the absence (Fig. S5) of a hole scavenger, indicating that overall splitting of water is feasible even in the absence of hydrogen or oxygen evolution catalysts. Photocurrent was also observed in the 0.5 M Na2SO4 solution without any externally applied bias (Fig. S6).
GaxZn1−xOyN1−y powder suspended in water produced no detectable hydrogen or oxygen gas evolution under either AM1.5 or visible-light-only irradiation after 6 h, so sacrificial half-reactions were used to evaluate the potential for gas evolution. Oxygen evolution experiments were carried out in 10 mM AgNO3 aqueous solution under simulated AM1.5 irradiation at ∼100 mW/cm2. Without La2O3 present as a pH buffer, 3.4 μmol of O2 and 28 μmol of N2 were evolved after 6 h of irradiation, matching previous work that attributed the low rate of evolution to a significant acidification of the unbuffered solution as the silver nitrate is reduced.Reference Kasahara, Nukumizu, Takata, Kondo, Hara, Kobayashi and Domen56 In the presence of 200 mg of La2O3, 14.1 μmol of O2 and 28 μmol of N2 were evolved after 6 h (Fig. S8). Addition of a CoOx oxygen evolution catalyst did not increase the rate of oxygen evolution, suggesting that the intraparticle charge recombination dominates. Hydrogen evolution was carried out using a 50 vol% ethanol solution and 1:1:10 GaxZn1−xOyN1−y powder loaded with a Rh/CrOx catalyst. After an initial induction period of approximately 1 h, hydrogen gas was evolved steadily over the next 3 h at a rate of 273 μmol/(h g) photocatalyst before plateauing (Fig. S7). The plateau and slight decline is due to the build-up of surface-adsorbed acetate that oxidizes at a significantly slower rate.Reference Vayssieres57
Based on the observed results, we have identified the relatively large particle size as a first point of improvement. Work is ongoing to reduce particle size in two different ways: (i) by extending the reaction time under nitrogen atmosphere and (ii) utilizing the flame spray pyrolysis technique to nebulize the precursor solutions and produce smaller reaction pools. There are also a number of post-treatements that should enable further improvements upon the method demonstrated in this work, even with larger particles. Previous work has demonstrated that necking treatments can enhance the photocurrent generated by facilitating better charge collection via reducing interparticle recombination.Reference Abe, Higashi and Domen58 Creating an intimate back contact via sputtering a microns-thick metal electrode directly onto the powder has also been shown to enhance the photoelectrochemical output by effectively eliminating the charge collection bottleneck.Reference Minegishi, Nishimura, Kubota and Domen59
Another key to generalizing this synthesis method is understanding the role of the metal salt anions. As an example, substitution of ZnCl2 for Zn(NO3)2 results in a different final product when all other reaction conditions are held constant. We are currently working on elucidating the role of the salt anion in the overall reaction and developing a system that will allow for analysis of the particles at various stages of the reaction while controlling the synthesis temperature and atmosphere. In addition, it is not yet clear that simply having NO3− present is sufficient for the reaction to proceed successfully—concomitant substitution of the metal salt anion (i.e., Cl− for NO3−) and addition of ammonium nitrate does not give the same final product. Both of these issues are being explored to gain insight into the reaction mechanism.
IV. CONCLUSIONS
In this work, we have demonstrated the ability to synthesize GaxZn1−xOyN1−y with control over the final content of gallium and zinc and, thus, control over the photophysical properties of the final product. XPS, XRD, and UV-Vis characterization were used to confirm the incorporation of nitrogen, elucidate the nature of the GaN:ZnO solid solution formed, and confirm that the GaN:ZnO solid solution absorbed light well into the visible region. In addition, XPS and UV-Vis spectroscopy showed that as little as 20% GaN was necessary to reduce the band gap of the material to 2.2 eV, much smaller than the band gaps of ZnO, ZnGa2O4, and Ga2O3. Finally, visible region photoactivity of the oxynitride powders was demonstrated as a film, and hydrogen and oxygen were shown to evolve from suspended oxynitride powder in the presence of scavengers under AM1.5 irradiation. We identified as primary issues the large size of the particles synthesized and the poor interparticle connectivity. We believe this method represents a promising avenue for research into oxynitrides without the need for equipment that may be prohibitively costly and safety risks associated with the use of ammonia gas. Specifically, this method should be extendible to other metal cations, with the goal of being able to mix-and-match cations of interest.
Supplementary Material
To view supplementary material for this article, please visit https://doi.org/10.1557/jmr.2018.402.
ACKNOWLEDGMENTS
The research described herein was supported in part by the NASA South Carolina Space Grant Consortium. We acknowledge the University of South Carolina College of Engineering and Computing X-ray Photoelectron Spectroscopy Facility for use of the instrument. BHM wishes to thank Dr. Stavros Karakalos for his assistance with XPS data collection and analysis and the Lauterbach group for access to their diffractometer.