Introduction
Breast cancer is supposed to be a life intimidating disease for women. The existence of malignant cells lying inside the breast tissue causes cancer. Almost 1.80 million breast cancer incidents are reported per year [Reference Stewart and Wild1]. It becomes crucial to diagnose this disease early, which improves the chances of survival by up to 97%. Conventionally, an effective and reliable method has been studied in [Reference Mahmood and Mahmood2].
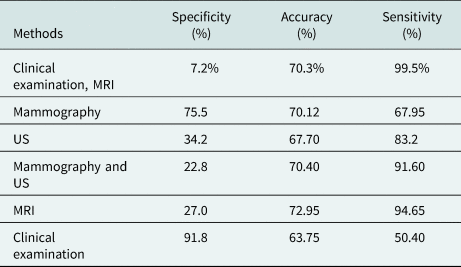
Additionally, several non-invasive methods have been proposed for clinical imaging of the human body, e.g., X-ray mammography, ultrasound (US), magnetic resonance imaging (MRI), and computed tomography are commonly applied methods for diagnosing breast cancer [Reference Kuhl, Schrading, Leutner, Morakkabati-Spitz, Wardelmann, Fimmers, Kuhn and Schild3, Reference Elmore, Barton, Moceri, Polk, Arena and Fletcher4]. However, these pioneer methods lack many ways such as X-ray mammography have false negative and false positive results (between 10 and 30% and more than 5%, respectively). Furthermore, this technique has a hazardous ionizing effect, which may turn healthy tissue into a malignant one. The process involves discomfort for the patient, limiting the success rate for dense breast tissue. The US is another technique for detection but has higher (almost 17%) false-negative results. Moreover, cancerous tissues lying in depth are difficult to detect. High-resolution images are obtained by MRI, but it is an expensive and time taking process (Table 1).
Assessment of different diagnostic techniques of tumor detection in breast [Reference Rao and Mishra5–Reference Mahmud, Islam, Misran, Kibria and Samsuzzaman7]

The microstrip antenna's design process is modest and cost-bearable, but it undergoes some limits such as lower gain (<5 dB) and weaker radiation performances. Some of the techniques applied to boost the antenna characteristics as gain, bandwidth, and directivity are unit-cell [Reference Islam, Islam, Samsuzzaman, Faruque, Misran and Mansor8], cross Vivaldi [Reference Zhang, Fear and Johnston9], multiple-input multiple-output [Reference Sharma, Kumar, Saini, Gangwar, Kanaujia, Singh and Ekuakille10], and artificial magnetic conductor (AMC) structure [Reference Langley and Parker11, Reference Aldhaeebi, Almoneef, Attia and Ramahi12]. The meta-material (MTM) has extensive usage in microwave imaging solicitation due to its high implementation potential for microwave devices. An MTM with a negative index is an artificial electromagnetic (EM) arrangement with additional material properties that are not available in naturally occurring materials. The metamaterials' properties can be enhanced by incorporating various structures established on the transmission line [Reference Eleftheriades, Iyer and Kremer13] and double-bowknot-shaped resonators [Reference Zhou, Liu and Zhao14].
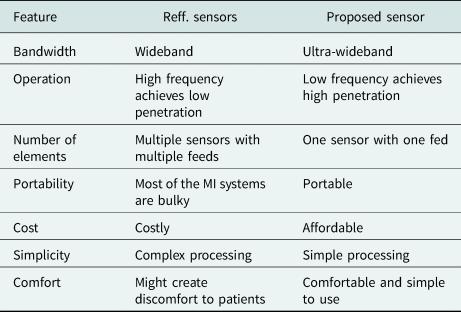
AMC is an artificially made repetitive structure that has been a bright contrivance to boost the antenna enactment, bandwidth, gain, and radiation performance. The property of preventing the radiation in backward is called phase reflection. In this paper, an AMC-based antenna is presented for detecting the tumor in the breast. Initially, an antenna with a modified circular profile microstrip patch is designed for the ultra-wideband. The system's novelty is that the proposed sensor operates from a single feed point compared to previously developed sensors. A single feeding port sensor reduces system costs. It also reduces the complexity created by the processing of multi-feeding point data due to multiple feeding point sensors, as mentioned in Table 2. The breast model has been designed with a radius of 60 mm. Within phantom, the malignant tumor has been introduced in different sizes at different locations. By using the principal component analysis (PCA) method, the tumors have been identified. A further test has been carried out using the specific absorption rate (SAR) calculation to verify the results.
Advantages of the proposed sensor compared to the reported sensors

AMC design layout with unit cell
The AMC reflects the back lobe radiation of the EM wave, directed toward the source wave. This orientation causes in-phase interference with the source EM wave, which improves the antenna's gain and bandwidth.
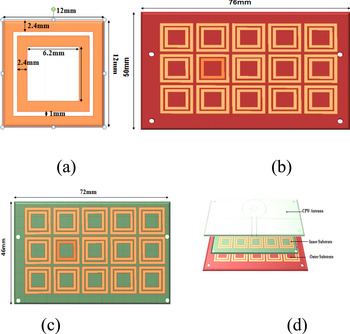
Antenna designing begins with metamaterials unit cells; cells' purpose is to achieve resonance from 2.8 to 10 GHz × frequency range. The proposed element cell model is shown in Fig. 1(a); each unit cell is 12 × 12 mm2, which involves a pair of copper ring shape patch with a rectangular strip. The dimensions of the designed section are varied so that AMC arrangements and antenna resonant frequency should be matched, and the AMC arrangement length should be less than λ/2. By inserting the inner one rectangle further, the gap in stripes is adjusted. Therefore, AMC size is limited to 12 mm.
(a) Unit cell. (b) Outer substrate. (c) Inner substrate. (d) The layered structure of the proposed design.

After designing the AMC structure, a coplanar waveguide (CPW)-fed antenna as the top layer is implemented with this AMC structure. The finishing creation is portrayed in Fig. 1(d). The cavity between the layers is 6.2 mm.
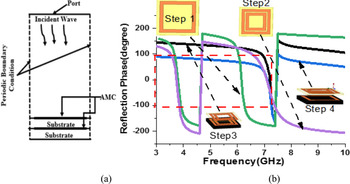
The phase reflection property of the AMC structure is determined by Ansys 15.2, as shown in Fig. 2(a). The AMC is designed by using two uniplanar layers with a square ring stub. Figure 2(b) shows the evolution steps of the AMC structure.
(a) Simulated phase reflection of the unit cell. (b) Evolution steps of the unit cell in the AMC structure.

Single ring structure reported in step 1, which exhibits two bands, 3.5–3.9 and 5.9–6.3 GHz, apart from that it also offers a phase reflection from +90 to −90°. In step 2, two square ring slots are used, which results in approximately no change to the first band, but the second band is shifted to the higher side (6.5–7.4 GHz). A phase reflection of +90 to −90° between 6.9 and 7.2 GHz is obtained when the double layer dielectric structure is used with a single square ring resonator, as shown in step 3. Step 3 structure fails to cover our required frequency band. This shortfall can be instigated by using a double layer substrate with a double square ring structure, as shown in step 4.
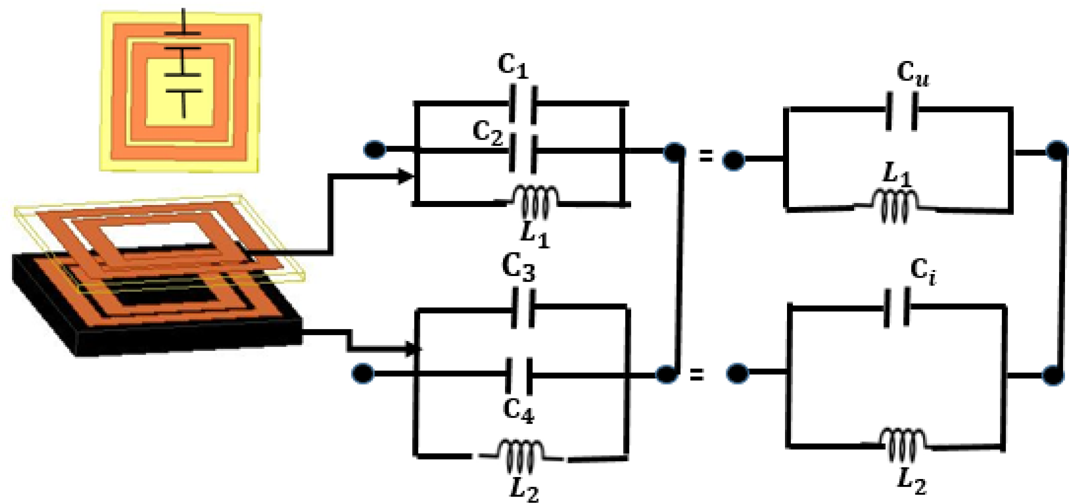
An AMC based on circular patch is modeled logically by an inductor–capacitor circuit with the characteristic, as shown in Fig. 3. This circuit constitutes surface impedance Z s whose value depends on the cell geometry, the square patches' capacity, and the inductance produced by the substratum's height. This model gives good results for cell size, whose wavelength is shorter than the phase of the cell.
Circuit model for the unit cell.

The resonant frequency can be calculated using the standard formula:

where C is the fringing capacitor and L is the inductance.
For the fringing capacitor

where A is the area of capacitor and g is the gap between two strips.
For the inductance

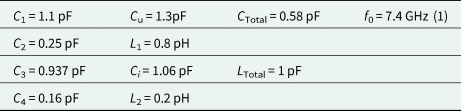
It can be found that the equivalent capacitance and inductance can be adjusted correctly by adjusting these parameters. Then the reflection phase bandwidth of two AMC units can be flexibly controlled. The calculated values of C, L and for unit cell are listed in Table 3.
CPW antenna structure
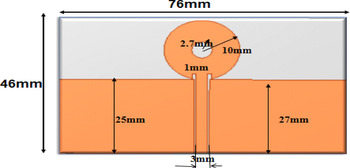
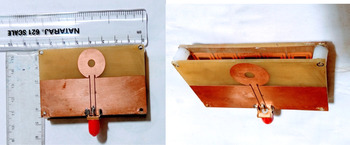
Initially, an antenna was proposed with CPW feed. Owing to its easy availability and cheaper cost, the antenna is made on FR-4 glass epoxy with a thickness of 1.6 mm and a dielectric constant of 4.4 (Figs 4 and 5).
Proposed design without AMC.

Proposed fabricated CPW-fed antenna.

The 0.5 mm gap is used between the feed line and ground to get wider bandwidth. The strip has a resilient outcome of raising the electrical path in lower and upper operational frequencies.
Antenna results
The double-layer AMC surface structure plays a significant role in enhancing CPW performance, which shows suitability for microwave sensors.
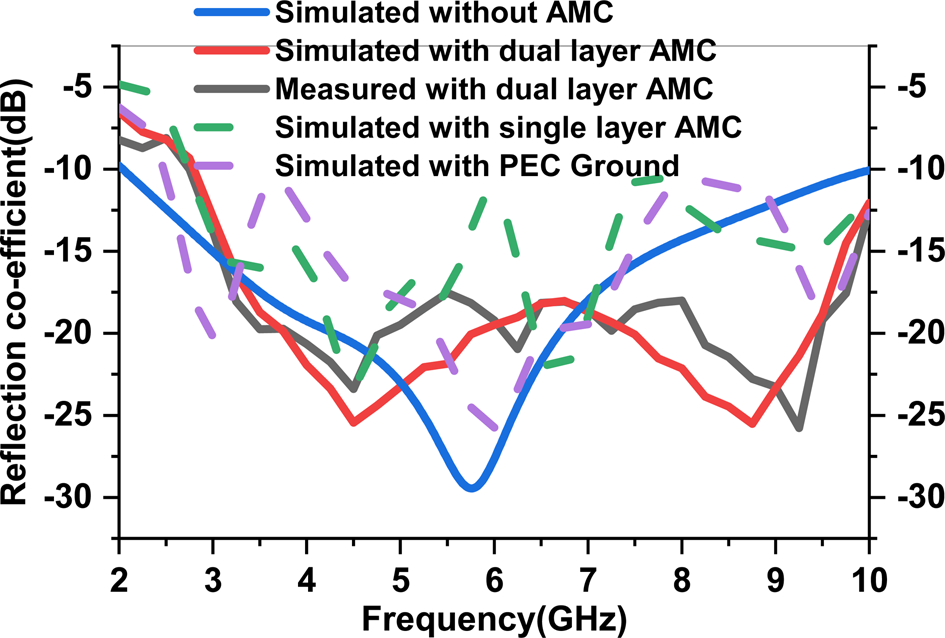
Figure 6 shows the simulated reflection coefficient of the proposed antenna with perfect electric ground (PEC) ground, single layer AMC, dual-layer AMC, without AMC, and measured reflection coefficient with dual-layer AMC. Simulated and measurement results show that the antenna's operating band is 2.1–10 GHz without AMC, with only one resonant frequency of 5.8 GHz. The antenna's working band is 2.8–10 GHz with AMC with two resonant frequencies of 4.8 and 8.8 GHz. The proposed antenna achieves almost the same simulated impedance bandwidth of 130.6% in a 2.1–10 GHz frequency band with different resonant peaks in all cases and achieves measured impedance bandwidth of 122.5% in a 2.8–10 GHz frequency band with dual-layer AMC.
Simulated and measured reflection coefficient of the antenna with PEC ground, without AMC, and with AMC.

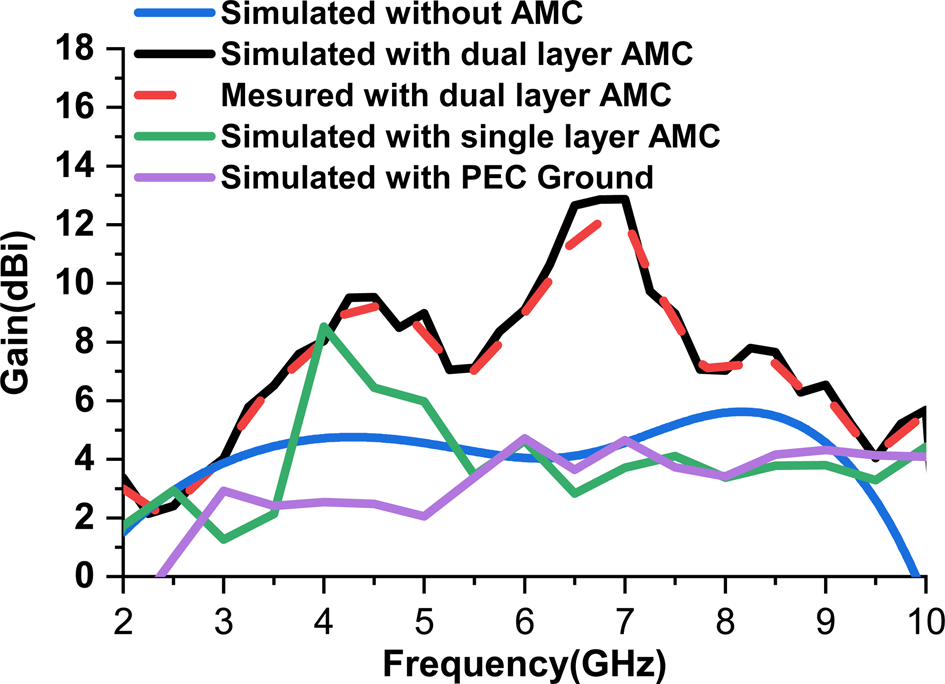
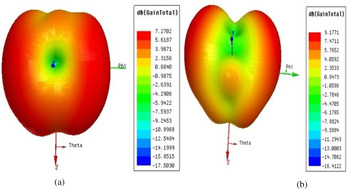
The proposed antenna gain is shown in Fig. 7. The proposed antenna's peak gain without AMC, with PEC ground, with single-layer, and dual-layer AMC are 4, 4.5, 8.5, and 12.5 dBi, respectively. The measured peak gain with dual-layer AMC is 12.5 dBi. Figure 8 shows the antenna's 3D polar plot at resonant frequencies of 4.8 and 8.8 GHz that indicate directional antenna radiation.
Gain of the antenna without AMC, with PEC ground, and with AMC.

Antenna 3D polar plot at (a) 4.8 GHz and (b) 8.8 GHz.

Breast tumor detection
Breast phantom
The electrical properties of tissue in the breast are mentioned in [Reference Michaowska-Samonek, Miaskowski and Wac-Wodarczyk15] considering Gaussian random variables (almost 10% variation from their usual mark) values. Table 4 show the electrical properties of woman breast tissues at a frequency of 6.5 GHz.
Calculated L, C, and f values of the unit cell

Electrical properties of woman breast tissues

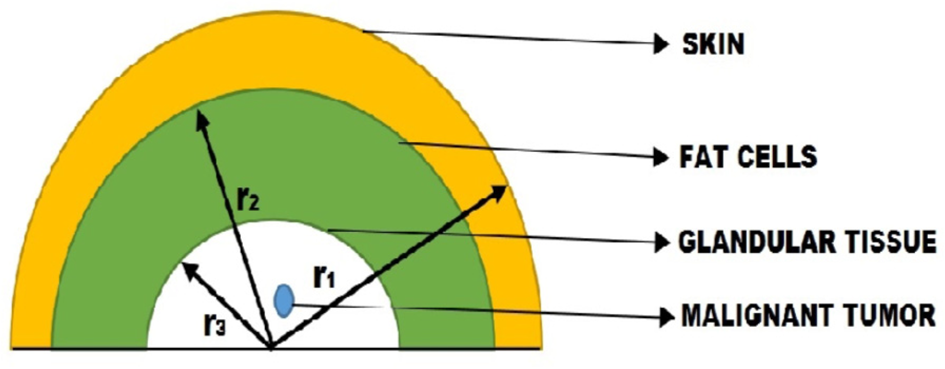
Tumor having a conductivity of 4 S/m and relative permittivity of 50 are inserted in the tissue. These tumors have different radii (2.5, 3.5, and 4.5 mm). The simulated 3D phantom model is shown in Fig. 9.
3D phantom model (r 1 = 55 mm, r 2 = 50 mm, and r 3 = 40 mm).

Principal component analysis
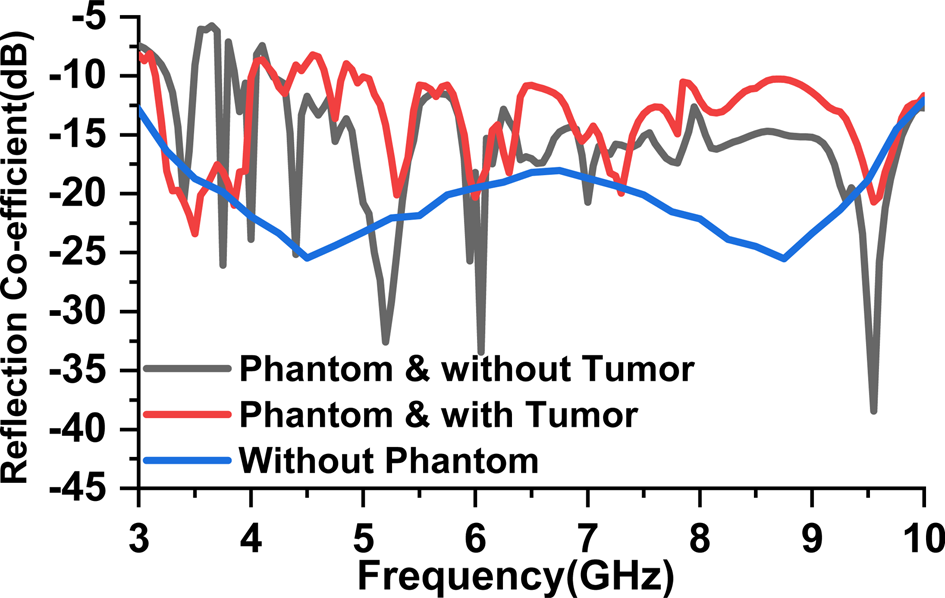
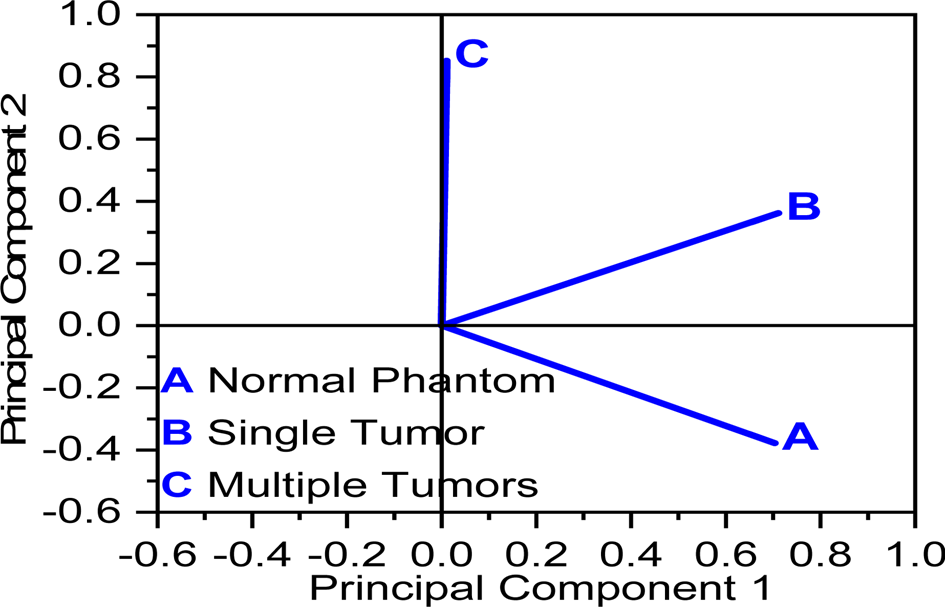
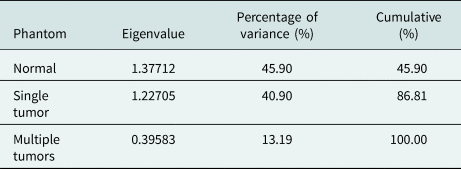
It is a dimensional reduction technique that identifies the co-relations and patterns in data sets that can be transformed into another data set. In Fig. 10, it is also clear that reflected power is degraded due to the absorption of power by the tumor. The PCAs are carried out on the reflection coefficient to determine the difference between malignant and normal phantoms. The eigenvalue is found with the help of reflection coefficient data, which are given in Table 5. PCA results are obtained with the help of these eigenvalues, as shown in Fig. 11. These results indicate the variation between the normal breast phantom, single-tumor breast phantom, and multiple tumors breast phantom. PCA graph is formed with two-component principal component 1 (PC1) and principal component 2 (PC2), and their corresponding values for different phantoms are provided. With normal phantom, the value of PC1 and PC2 is 0.7 and −0.4, respectively. For single tumor phantom, PC1 = 0.7 and PC2 = 0.4 likewise for multiple tumors PC1 = 0.03 and PC2 = 0.85. Therefore, we can easily differentiate a tumorous phantom from a normal phantom.
Simulated reflection coefficient of the antenna without phantom, phantoms with and without tumor.

PCA results of the phantoms.

Eigenvalue and variance results of phantoms

Specific absorption rate
SAR can be defined as the amount of EM energy engrossed by any realistic material in the EM field. In humans' case, it is measured as the power absorbed by tissue divided by its mass (W/kg). The SAR value is calculated in two ways first is local SAR, and the second one is Avg. SAR [Reference Xie, Guo, Xu, Li and Stoica16].
Local SAR
A value with a certain mass is found for each point in (W/kg) [Reference Subramanian, Sundarambal and Nirmal17]

Avg. SAR
It is the average value for a section. At every point, a particular shape (cube, sphere) with a definite mass is selected. Then by integrating over the cube, power loss density is calculated and after that the calculated power loss density is divided by the cubes or sphere mass [Reference Michaowska-Samonek, Miaskowski and Wac-Wodarczyk15]

where ρ(r) is the mass density at r in (kg/m3), σ(r, ω) is the conductivity (S/m), r is the position vector, V is the volume in (m3), and E(r, ω) is the E-field confined in tissue (V/m).
Tumor detection
The SAR value of the breast phantom model is simulated for the tissue at 4.8 GHz. Cancer cells or malignant tumor cells have been located everyplace in the breast tissue model.
Single tumor
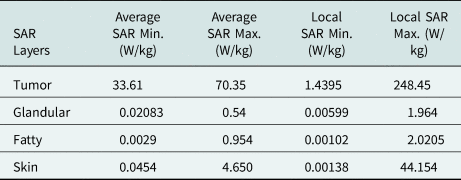
The tumor is placed at a location (−5, 16, 30) mm. The radius of the tumor is 2.5 mm. The maximum local SAR values for tumor, glandular tissue, fatty tissues, and skin are 248.45, 1.964, 2.0205, and 44.154 W/kg, respectively. Similarly, the maximum average SAR for the tumor, glandular, fatty, and skin are 70.35, 0.54, 0.954, and 4.650 W/kg, respectively, as mentioned in Table 6.
Simulated SAR1 g values for 2.5 mm tumor located at (−5, 16, 30) mm co-ordinates

When another tumor of 3.5 mm size has been inserted, the SAR1 g values for the tumor, glandular tissue, fatty tissues, and skin have been given in Table 7.
Simulated SAR1 g values for 3.5 mm tumor located at (−5, 26, 30) mm co-ordinates

Two tumors
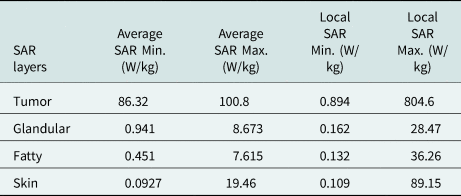
When two tumors (2.5 and 3.5 mm) are present in phantom at co-ordinates (−5, 16, 30) mm and (−5, 26, 30) mm, the SAR values for tumor, glandular, fatty, skin, and the tissue are presented in Table 8.
Simulated SAR1 g values for two tumors with radii 2.5 and 3.5 mm at (−5, 16, 30) mm and (−5, 16, 30) mm co-ordinates

Simulated SAR values for 2.5 and 4.5 mm tumor located at (−5, 16, 30) mm and (−5, 26, 40) mm coordinates, respectively, are presented in Table 9.
Simulated SAR1 g values for 2.5 and 4.5 mm tumors at locations (−5, 16, 30) mm and (−5, 26, 40) mm, respectively

Three tumors
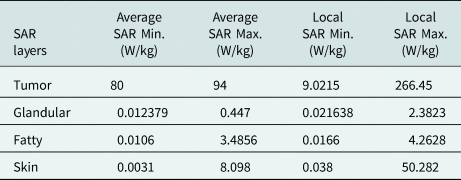
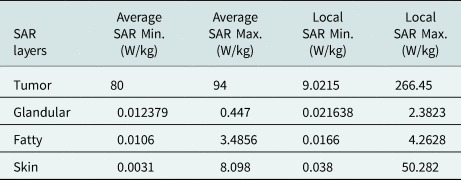
Three tumors with radii 2.5, 3.5 and 4.5 mm are introduced at location (−5, 16, 30) mm, (−5, 26, 30) mm, and (−5, 26, 40) mm, respectively. The SAR1 g values for tumor, glandular tissue, fatty tissues, and skin are presented in Table 10.
Simulated SAR1 g values for 3.5, 2.5, and 4.5 mm tumor at locations (−5, 16, 30) mm, (−5, 26, 30) mm, and (−5, 26, 40) mm, respectively

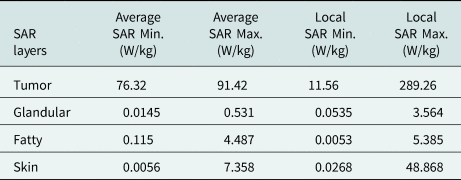
Table 11 shows the values of SAR due to tumors at locations (−5, 16, 30) mm, (−5, 26, 30) mm, and (−5, 26, 40) mm with sizes of 4.5, 3.5, and 2.5 mm, respectively.
Simulated SAR1 g values for 4.5, 3.5, and 2.5 mm tumors at locations (−5, 16, 30) mm, (−5, 26, 30) mm, and (−5, 26, 40) mm, respectively

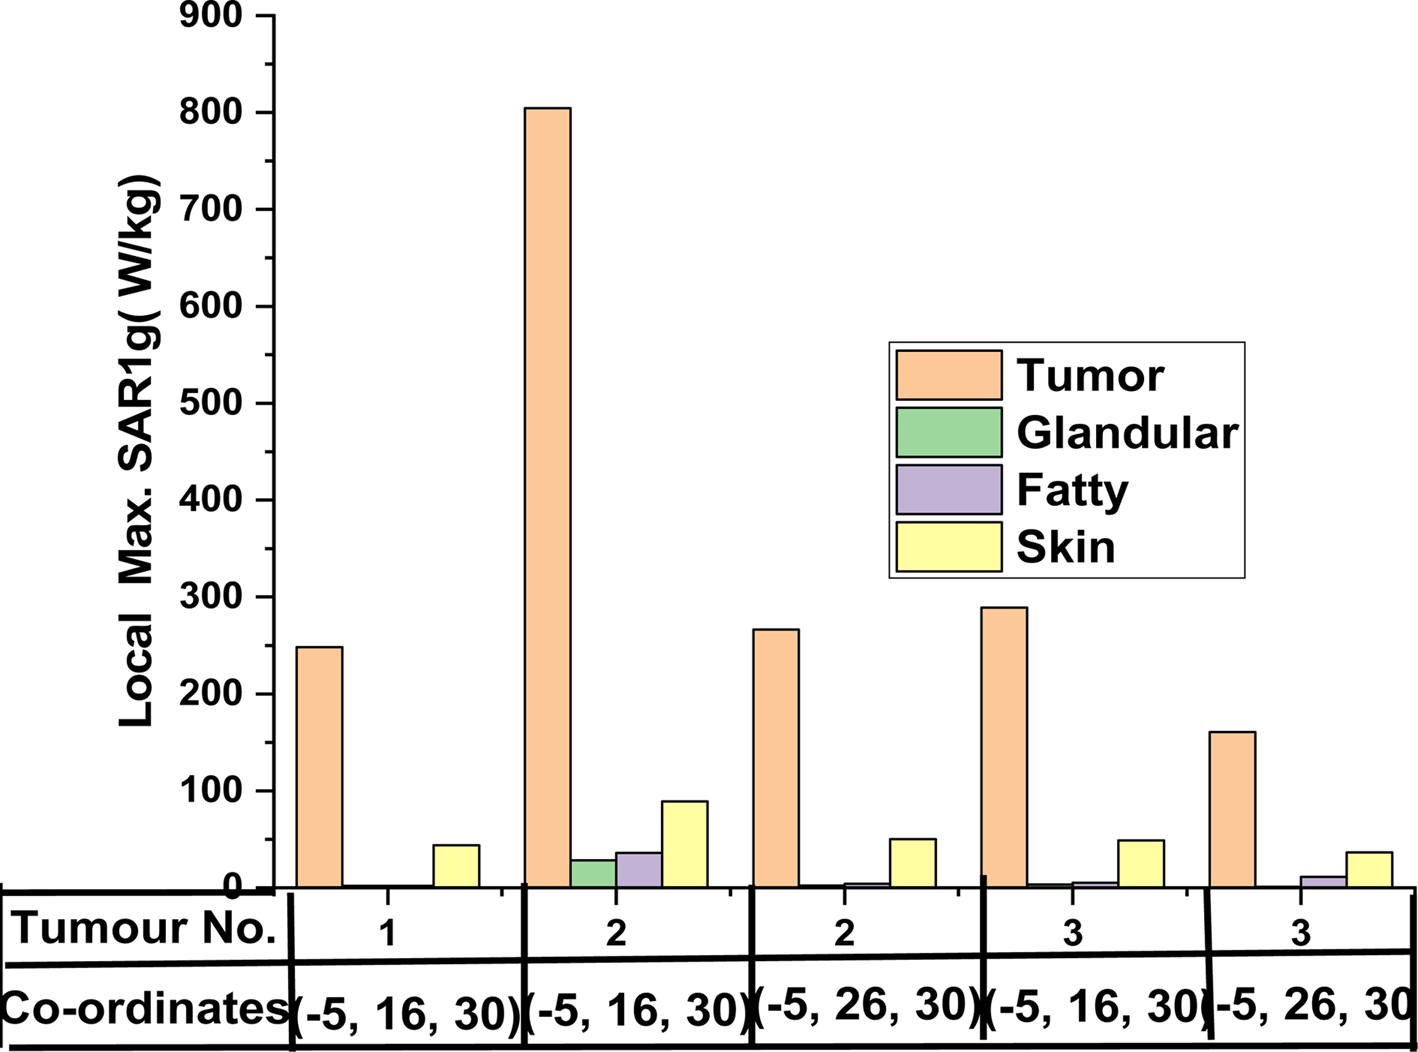
Figure 12 shows the maximum local SAR values for glandular tissue, fatty tissues, and skin with different tumor locations. This chart indicates that the local SAR value of cancerous tissue is much higher than normal tissue.
The maximum local SAR of breast phantom with different locations and different sizes of tumors: (a) without tumor – SAR average and (b) with tumor – SAR average.

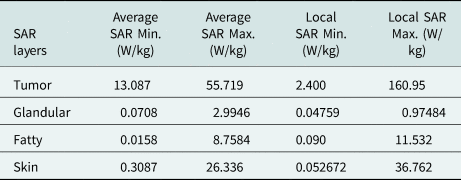
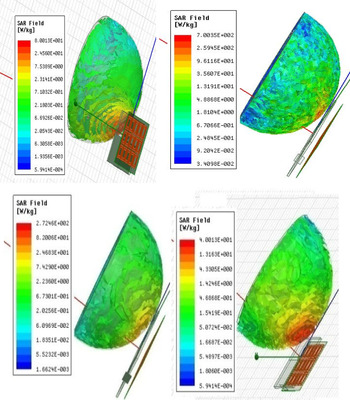
The gain of the proposed antenna is upto11.8 dB, and due to the directional pattern, the radiated power of the antenna covers the whole breast for more power absorption. Therefore, the SAR value is very high in the tumor phantom. The proposed antenna's local and average SAR values for phantom without tumor are 24.56 and 7.42 W/kg, respectively. The tumorous phantom absorbs more power than the normal phantom. If the proposed antenna's SAR values for the phantom are >24.56 and 7.42 W/kg, it is considered a tumorous phantom. Figure 13 shows the comparison between breast models with and without tumors. It has been observed that the average and local overall SAR values for the tumorous breast phantom are higher. This system can detect a tumor of size 2.5 mm, so this system can detect cancer at an early stage.
Simulated SAR1 g value for the breast model with tumor and without tumor.

Conclusion
The CPW-fed antenna with the AMC structure improves the antenna characteristics significantly. The gain is increased up to 10.1 dB. The energy leakage is reduced due to the AMC structure's reflection properties; hence, the antenna becomes unidirectional. The machine learning concept of PCA also has been implemented in determining the S-parameters. Further verification is done by using the SAR study of the simulated phantom for malignant tumor detection. The malignant tumor has been created in the breast's innermost layer with different sizes at various locations. For normal breast phantom, max. Local and avg. SAR is 24.56 and 7.429 W/kg, respectively. For breast phantom with a smaller size of a malignant tumor (2.5 mm), the maximum local and avg. SAR is 700.35 and 40.013 W/kg, respectively. This is quite higher than the maximum local and avg. SAR of normal breast phantom. So, this approach is useful for breast cancer detection at an early stage.
Acknowledgment
This work was supported by the UPCST sponsored project with grant number CST/D-8326.
 Praveen Kumar Rao is currently working as a Research Assistant in a funded project from the Council of Science and Technology, Govt. of U.P., India. He received his B.Tech degree in Electronics and Communication Engineering from Dr. A.P.J. Abdul Kalam Technical University (AKTU) (formerly UPTU) Uttar Pradesh, India, M.Tech in Communication Engineering from the Madan Mohan Malviya University of Technology (Formerly Madan Mohan Malviya Engineering College), Gorakhpur, India. Currently, he is pursuing his Ph.D. in RF and Microwave from Madan Mohan Malaviya University of Technology, Gorakhpur, India. His research interest includes RF and Microwave and antenna arrays for medical applications.
 Ashish Ranjan Yadav received his B.Tech degree in Electronics and Communication Engineering from Dr. A.P.J. Abdul Kalam Technical University (AKTU) (formerly UPTU) Uttar Pradesh, India, M.Tech in Communication Engineering from the Madan Mohan Malviya University of Technology (Formerly Madan Mohan Malviya Engineering College), Gorakhpur, India. His research interest includes RF and Microwave.
 Rajan Mishra is an Assistant Professor at the Department of Electronics and Communication Engineering, Madan Mohan Malviya University of Technology (Formerly Madan Mohan Malviya Engineering College), Gorakhpur, India since 2009. He received his B.E. degree in Electronics and Communication Engineering from M.J.P. Rohilkhand University, Bareilly, India, M.Tech in Digital Systems from the Madan Mohan Malviya Engineering College, Gorakhpur, India, and Ph.D. in RF and Microwave from Motilal Nehru National Institute of Technology, Allahabad (Prayagraj) in years 2001, 2007, and 2018, respectively. He has organized several workshops, short-term courses, and conferences. He is currently working as a PI in a funded project from the Council of Science and Technology, Govt. of U.P., India. His research interest includes antenna and antenna arrays for medical applications and the internet-of-things for agriculture and healthcare sectors.