1. INTRODUCTION
Modeling is a human process intrinsic to any human task (Le Moigne, Reference Le Moigne1999). The system's behavior is administrated explicitly or implicitly by at least one model, which is directly related to a perception of the world. Models are then the basis of problem solving and knowledge construction. In an industrial engineering context as well as in a social area, models are used to construct systems. Indeed, any designed system is based on a given representation of the context and the environment in which it is supposed to evolve. For instance, to launch a transport company, an investor has to implement a representation of the market. Models are also used to analyze an existing system and therefore to understand and predict its behavior to steer it. For instance, a decision maker (DM) in a transport company implements a representation of the transportation system rationale as well as of its environment stating constraints to be satisfied, thus determining the system behavior and consequently its performances. Thereafter, the DM's actions and decisions are guided explicitly or implicitly by this representation. Hence, as the constructivism theory suggests, models found any knowledge construction.
Because models are, in a sense, the interface between a subject and a real-world system, the evaluation of these models is crucial to ensure the quality of the constructed knowledge. Evaluation has been well studied in the fields of education, health, business, industry, and management, to mention a few. Many journals and conferences deal with evaluation issues in various areas (e.g., Performance Evaluation, American Journal of Evaluation, International Journal of Value Based Management, Business Ethics, European Journal of Engineering Education, AI EDAM). However, the main issue considered in this paper is conceptual and addresses the epistemology of evaluation. In other words, we do not address the issue of evaluating a given real system, but the issue of evaluating the quality of the model construction stage and thus the model itself.
In the second section of this paper, we present a state-of-the-art of the evaluation issue and the epistemological foundations of our research. In the third section, we present an evaluation framework intended to allow a subject to assess existing model or models under construction. The fourth section is dedicated to a case study explaining how our evaluation framework has been applied in the kansei (sense) engineering field to be used as a guideline in a modeling process intended to build road accident models. [Kansei engineering or emotional engineering (Nagamachi, Reference Nagamachi and Nagamachi1997; Schütte, Reference Schütte2005) is aimed at providing designers with models to help them understanding customers' needs and thereby predict their appreciation level of a new product.] In the fifth section, we propose to characterize the interrelationships between model evaluation criteria and knowledge evaluation criteria on the one hand, and within model evaluation criteria themselves on the other hand.
2. STATE-OF-THE-ART
Most theories and epistemologies agree to the fact that models are the interface between a subject and the real world. However, these epistemologies give different definitions to the notions of system, model, and knowledge. Therefore, we stress that it would be misleading to deal with model evaluation without defining these notions as well as the notion of evaluation itself.
2.1. Definitions
The definitions of the following notions are required to understand the epistemological foundation of our work.
Subjectivism: the doctrine that states that knowledge and value are dependent on and limited by our subjective experience
Relativism: the philosophical doctrine that all criteria of judgment are relative to the individuals and situations involved
Positivism: a doctrine taught by Auguste Comte (1798–1857) that states that positivism is a form of empiricism that bases all knowledge on perceptual experience (not on intuition or revelation)
Constructivism: a philosophical perspective derived from the work of Immanuel Kant, which views reality as existing mainly in the mind, constructed or interpreted in terms of one's own perceptions. Note: in this perspective, an individual's prior experiences, mental structures, and beliefs bear upon how experiences are interpreted. Constructivism focuses on the process of how knowledge is built rather than on its product or object.
2.2. Systems, models, knowledge, and evaluation
Epistemology is known as the branch of philosophy that deals with questions related to the nature, the scope, and the sources of knowledge. According to Heylighen (Reference Heylighen1993), the most fundamental question that any epistemology must answer is “how an infinitely complex environment can be represented by a model that is necessarily much simpler than this environment and that allows a subject to derive knowledge leading to valuable predictions.” We may distinguish two main epistemologies: positivism and constructivism.
Positivism, as Platonic idealism and empiricism, stresses the absolute, passive, and permanent character of knowledge. It assumes that science should not pretend to be more than what is observable and measurable. A real system in a positivist perspective (also called “hard” perspective) is seen as a set of existing and real entities. In other words, it has features, which are universally valid, embedded in its nature, and can be identified and studied as such. Thus, a model in such a perspective is universal, objective, and independent from the subject who builds it. The value of a model (or of an object in general) is then independent from the evaluation context and from the subject who performs the evaluation.
However, the constructivist epistemology points out the relativity and context dependence of knowledge as well as its continuous evolution. Cybernetics (Ashby, Reference Ashby and Hall1956; Von Foerster, Reference Von Foerster1995) and general system theory (Bertalanffy, Reference Bertalanffy1969) are two approaches derived from this epistemology. They claim that real systems are open to, and interact with, their environments, and that they can qualitatively acquire new properties through emergence, resulting in continual evolution. Rather than reducing an entity only to the properties of its parts or constituting elements, cybernetics, and the general system theory focus on the relationship between the parts, which gathers them as a whole (the holism principle). Hence, a model is considered as a perception of the real world in a given context. It is constructed by a subject for a given purpose. Then, in contrast to positivism, a model in constructivism is not dissociated from the subject who builds it.
2.3. Evaluation's influence on attitudes, perceptions, and actions
In this paper, we assimilate an evaluation task to an interaction process between the subject who performs the evaluation and the evaluated object (which is the model in our case). As it is emphasized by relativism, subjectivism, and constructivism, the perception of the subject and his/her personal background influence the values he/she assigns to the object. However, in contrast, during the interaction process, the evaluation tasks may, in turn, influence the evaluators' perception. In fact, in Kirkhart (Reference Kirkhart, Caracelli and Preskill2000), Henry (Reference Henry2003), and Henry and Mark (Reference Henry and Mark2003), the authors have noticed that assessments can influence perceptions of social problems, selection, and implementation of social policies. Furthermore, they encourage evaluators to rethink the outcomes influenced by assessments.
Based on these researches, one may notice that assessment can influence perceptions and thereby actions. Because models are the result of perceptions, we can assume that model evaluation can influence the modeling task itself. This can be explained as feedback behavior when a subject evaluates a model (or an object in general), his/her perception may be influenced: he/she may notice some incompleteness, misrepresented aspects, and so forth. Then, he/she may carry out new actions to tackle the identified limits, and thereby the model may be changed.
Because evaluation affects the subject's perception, and because modeling is based on perceptions, it would be misleading to carry out a modeling task without focusing on the issue of model evaluation. This is why it is worth determining some criteria to assess, for each stage of the modeling process, the adequacy of the model with the initial modeling objectives. The aim of this paper is to develop a framework for model evaluation and to use this framework as a guideline in the modeling process or as a guide to select a given model for a given objective. The context dependency and the subjectivity of models as well as of their evaluation from a constructivist point of view may lead to pure relativism. Nevertheless, the present paper advocates that, despite the variability and subjectivity of models, a number of criteria can be formulated to help a user selecting an adequate model among a list of existing alternatives or to validate the a priori quality of a model being implemented.
2.4. Knowledge evaluation
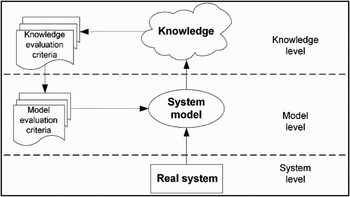
As we mentioned in the introduction, a model is not an objective in itself, but a tool to develop a goal-dependent knowledge. An adequate model is then the one that permits to derive an adequate knowledge. Thus, the question about model assessment may be transformed into a question about knowledge assessment as shown in Figure 1.
The relationship between model evaluation and knowledge evaluation.

The basic question the epistemology attempts to answer is what distinguishes true (or adequate) knowledge from false (or inadequate) knowledge (Campbell, Reference Campbell and Schilpp1974; Heylighen, Reference Heylighen1993, Reference Heylighen1997). In other words, how can knowledge quality, soundness, and so forth, be evaluated?
The dualistic debate between absolutism and relativism in philosophy arises in epistemology. Indeed, on the one hand, positivist theories stress the absolute, passive, and permanent character of knowledge, and thereby try to formulate unambiguous and fixed criteria for distinguishing “true” or “real” knowledge from “false.” On the other hand, constructivist theories stress the relativity and evolution of knowledge and therefore try to formulate subjective criteria that are more context dependent (i.e., see Campbell, Reference Campbell and Schilpp1974; Heylighen, Reference Heylighen1993; Reich, Reference Reich1994).
Despite the variability and subjectivity of knowledge, a number of researches have been carried out to formulate criteria that allow distinguishing between adequate knowledge and inadequate knowledge (see Campbell, Reference Campbell and Schilpp1974; Heylighen, Reference Heylighen1993; Reich, Reference Reich1994).
As a matter of fact, Turchin (Reference Turchin and Geyer1991) claims that the essential function of knowledge is prediction, and because there is no universal and absolute criterion of truth, the unique criterion of truth is the prediction power that the concerned knowledge is able to provide. In other words, “true” knowledge is the one that allows a system to handle different types of perturbations by anticipating them and testing (and further selecting among) possibly adequate actions that could contribute to its survival (Heylighen, Reference Heylighen1993).
Another point of view provides a natural definition of what “true” or “real” knowledge means: it is the selectionist point of view which states that “true” or “real” knowledge is knowledge that can survive. This selectionist point of view stems from Campbell's evolutionary epistemology (Campbell, Reference Campbell and Schilpp1974) and Heylighen's (Reference Heylighen1993) evolutionary–cybernetic epistemology. Hence, knowledge assessment criteria may result in knowledge selection criteria.
Reich (Reference Reich1995), using a constructivist approach, addressed the issue of the measure of knowledge. In particular, he demonstrated the need to use several different measures simultaneously rather than a single assessment.
Heylighen (Reference Heylighen1993) distinguishes three superclasses of criteria that are used by a subject to select a given knowledge: objective criteria, subjective criteria, and intersubjective criteria.
Objective criteria are those used for judging “objectivity” or “reality” of knowledge or a given perception in general. The first objective criterion is related to knowledge invariance. Indeed, there is a part of “solid”/objective knowledge related to a given phenomenon that must persist even when its perception (i.e., how perception is carried out, perception context, perception means, time of perception, etc.) is no more active or changed. Heylighen distinguishes three types of invariance: invariance over modalities: perception should be the same even though it is performed through different senses, points of view, or means of observation; invariance over time: perception should be the same even though it is performed at different moments in time; invariance over persons: perception should be the same even though it is performed by different observers. The second objective criterion is related to knowledge distinctiveness: a “real” perception is the one that can be characterized in details, structured in a coherent manner, and represented by a distinct pattern. Dreaming, for example, is not “real” because it is a coarse-grained and fuzzy set of perceptions. The third objective criterion is controllability: a knowledge that reacts differentially to the different actions performed on it is more likely to be real than one that changes randomly or not at all.
Subjective criteria are those related to how efficiently knowledge can be assimilated by the individual subject. For instance, despite its objectivity, the relativistic quantum field model of the beryllium atom is assimilated by very few people. Because the capacity of a cognitive system is limited and learning is based on strengthening associations, useless knowledge, complex knowledge, and knowledge into conflict with existing knowledge burdens the subject and reduces the chances for survival. Therefore, the first subjective criterion is related to the individual utility of knowledge: it is postulated that a subject will only make the effort to learn and retain an idea that can help him/her reach his/her goals. The second subjective criterion is related to the simplicity of knowledge (easy to learn): the more complex an idea, the higher the burden on the cognitive system, the lower the chance for the knowledge in question to be selected. This idea is the same as the information axiom within the axiomatic design theory by Suh (Reference Suh1993): the lighter the information required for the design process of a product to put on the market, the more likely the product is to be inexpensive, robust in terms of adaptability to a usage context, easy to reengineer, and finally, the more competitive it is likely to be and the more certain to survive. This is also related to the information entropy theory. The third subjective criterion is related to knowledge consistency: the ease with which a cognitive system assimilates new ideas depends on the support it gets from ideas assimilated earlier. In other words, ideas that do not connect to existing knowledge simply cannot be assimilated. The last subjective criterion is novelty: new, unusual, or unexpected ideas or perceptions tend to attract the attention, and thus arouse the cognitive energy that will facilitate their assimilation.
Intersubjective criteria are related to the capacity of knowledge to be transmitted and assimilated easily. Heylighen (Reference Heylighen1997) proposes the following criteria:
Publicity: It may be related to the subject's motivation (the effort the subject carrying the idea invests in making it known to others) or to knowledge itself (simplicity, consistency, novelty, etc.).
Expressivity: It depends on the whether the knowledge can be expressed in a clear and easy language.
Formality: The possibility for an idea to be formulated in a less context-dependent way, so it can be assimilated equally by different subjects.
Collective utility: Some forms of knowledge benefit to the community, while being useless for an isolated individual.
Conformity: Campbell stresses that a community achieves a selective pressure that removes individual selfish deviations from these collective beliefs.
Authority: The backing of a recognized expert contributes to the acceptance and the legitimacy of a given idea.
3. GENERIC FRAMEWORK FOR MODEL EVALUATION
One of the main issues when considering model evaluation is how complete the evaluation framework is. Moreover, many viewpoints may be used to evaluate a model; what are the relevant viewpoints? Which criteria must be satisfied to produce an “adequate knowledge”?
To address these issues, we use the cybernetic and systemic approaches: we consider a model as ontology (ideas, expressions, rules, patterns) that is open to and that interacts with its environments through a given functioning. It can qualitatively acquire new properties, resulting in continuous evolution to fulfill a given teleology (goal/motivations of the subject prior to the model implementation).
Hence, our evaluation framework consists of four generic viewpoints: ontology, functioning, evolution, and teleology. We are thus proposing a collection of evaluation criteria according to each of these systemic viewpoints.
3.1. Evaluating the model ontology
The model ontology consists of concepts used to represent the real system and/or the phenomena we are modeling. A concept is an abstract idea or a mental symbol, typically associated with a corresponding representation in a language or symbology. Hence, two important aspects must be considered in the evaluation of model ontology: the model concepts and the model representation formalism. To assess a model ontology, we propose the following criteria:
• Self-descriptiveness of the model ontology: It is the ability of the model concepts to embed enough information to explain the model objectives and properties. This criterion is related to the choice of the model concepts as well as the representation formalism in which these concepts are expressed. There exist several representation techniques such as graphs (Sowa, Reference Sowa1984), text, mathematical grammars, frames, rules, and so forth, to represent a model ontology. The model representation formalism is crucial to help; for instance, a subject to present and transmit his/her models or a group to share a common model. The more self-descriptive the model, the more expressive the knowledge expressed through the model (i.e., easy to be expressed in a clear and easy language) and the easier the publicity of this knowledge.
• Consistency of the model ontology: This is a second criterion to ensure the model coherence and self-descriptiveness. It is related to the degree of uniformity, standardization, and freedom from contradiction among the model concepts. Consistency is crucial to satisfy the two following knowledge subjective criteria: simplicity and consistency, and thereby the publicity intersubjective criterion. Indeed, the more consistent the model ontology, the easier the knowledge expressed through this ontology (i.e., simplicity), the higher the support this knowledge gets from ideas assimilated earlier (i.e., consistency), thereby the better the concerned knowledge is transmitted (i.e., publicity).
• Incompleteness of the model ontology: It is related to the lack of a concept or a misspecification of one of the concepts. An incomplete model might make the concerned knowledge more difficult to formulate and therefore more difficult to transmit and assimilate.
• Independence of the model ontology: This is related to the independency of the model from the subject who has elaborated it. Model ontology satisfying this criterion would improve the formality of the concerned knowledge (i.e., possibility to formulate knowledge in a less context-dependent way), its collective utility (i.e., its benefit to the community, while being useless for an isolated individual) and its invariance over persons.
3.2. Evaluating the model functioning
The model functioning is characterized by the model interaction with its environment (constraints of use, objective of use, inputs, etc.) to satisfy the model teleology (i.e., goal). Three important aspects must be considered to correctly assess the model functioning: the model interaction with users, the model behavior under normal conditions, and the model behavior under stressful conditions (e.g., erroneous input, varied constraints, etc.). In other words, criteria that should be satisfied by model functioning are related to these three aspects. Furthermore, these criteria should be defined such that the knowledge expressed through the concerned model satisfies the knowledge criteria we have defined. Based on these assumptions, we define the following criteria grouped into the three superclasses already mentioned:
3.2.1. Evaluating the model interaction with users
The evaluation of a model interaction with its users consists of characterizing the facility of use and the reusability of the model. This leads to the following criteria:
The attractiveness of the model is related to how attractive the model may be to the user. This refers to attributes of the model ontology intended to make the model more attractive for the user, especially attributes related to the representation formalism such as the use of color, the nature of the graphical design, and so forth. This criterion is also related to the previous criteria (i.e., consistency, self-descriptiveness, and independence). This criterion may improve the publicity criterion of the expressed knowledge.
The reusability of the model is related to the efficiency of the model in facilitating a selective use of its components or submodels.
The usability of the model is related to how the model allows the user to learn to operate, prepare inputs for, and interpret outputs.
The abstractness of the model is how a model allows a user to perform only the necessary functions relevant to a particular purpose.
The understandability of the model is related to how the model permits the user to understand whether the model is suitable for a given modeling purpose, and how it can be used for particular tasks and conditions of use.
The learnability of the model is related to how the model itself helps the user learn more on the modeled phenomena and application.
The adaptability of the model is related to the ease with which the model meets contradictory and variable users' constraints and users' needs.
The operability of the model is related to how the model allows the user to operate and control it. Aspects of suitability, changeability, and adaptability may affect the model operability. Operability corresponds to controllability, error tolerance, and conformity with users' expectations that we will present in the following paragraphs.
Criteria related to the model–user interaction such as reusability, understandability, adaptability, learnability, and so forth, play a relevant role to ensure certain subjective criteria of the knowledge expressed through the model. Indeed, the more usable, reusable, understandable, adaptable, learnable, and operable the model is, the higher the individual utility, the simplicity, and consistency of the inherent knowledge.
3.2.2. Evaluating the model behavior under normal conditions
The evaluation of the model behavior under normal conditions consists of the following concepts:
• The controllability of the model is related to how efficiently the model reacts differentially to the different actions it is submitted to.
• The repeatability of the model is related to how the model generates the same results under the same functioning conditions.
• The generality of the model is related to how the model performs a broad range of functions.
• The interoperability of the model is related to the ability of two or more models or model components to exchange information and to use the information exchanged.
• The replaceability of the model is related to how the model can be used instead of another specified model for the same purpose in the same environment.
• The usability compliance of the model is related to how the model complies with standards, conventions, style guides or regulations relating to usability.
3.2.3. Evaluating the model behavior under stressful conditions
Stressful conditions may be related to input quality (e.g., errors, incompleteness, noise, inconsistency, etc.), model component faults, and constraints of use (e.g., use duration, use period, validity domain, different types of stimulation allowed, etc.). The general criteria referring to the assessment of a model functioning under stressful conditions is robustness and reliability. It is defined as the ability of a model or a model component to function correctly in the presence of invalid inputs or stressful environment conditions or unexpected circumstances. Robustness and reliability can be characterized through the following criteria:
• Error tolerance is related to the ability of the model to continue an operation normally despite the presence of erroneous inputs.
• Fault tolerance is related to the ability of a model to continue an operation normally despite the presence of model component faults.
• Error proneness is related to the ability of a model to allow the user to intentionally or unintentionally introduce errors into the model or misuse the model.
The model robustness criteria (i.e., error tolerance, error proneness, reliability, controllability, etc.) make the knowledge expressed through the model concerned satisfy especially the objective criteria introduced previously. Indeed, robustness criteria improve knowledge invariance over input modalities, knowledge invariance over time, and knowledge invariance over persons and knowledge controllability.
3.3. Evaluating the model evolution
The model evolution is characterized by its transformation (i.e., structural or functional) because of an internal or external change. An internal transformation may affect a given function, component, or attribute of the model itself. For example, when a function or a component is defective, another component or function is added or improved and so forth. An external transformation may affect the model environment. For example, a new use environment, a new input, a new application, a new requirement, a new user, new constraints, and so forth.
The evaluation of a model evolution consists in assessing the modifiability of the model: the ease with which a model or model component can be modified to correctly fit evolutions and changes. To handle changes, a model should be able to evolve. Hence, model evolution refers the following criteria:
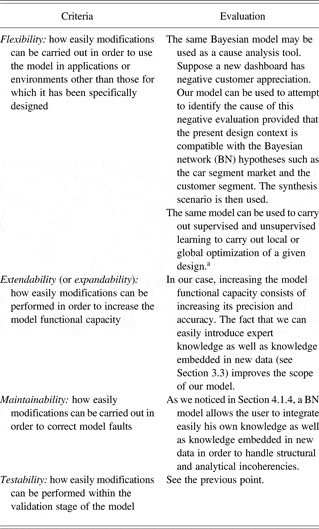
Flexibility depends on how easily modifications can be carried out to use the model in applications or environments other than those for which it has been specifically designed.
Extendibility (or expandability) is related to how easily modifications can be performed to increase the model functional capacity.
Maintainability is related to how easily modifications can be carried out to correct model faults.
Testability is related to how easily modifications can be performed within the validation stage of the complete model under construction.
3.4. Evaluating the model teleology
The model teleology is the goal of its elaboration. Assessing model teleology consists of measuring the gap between the users' needs and the effective functions the model fulfills. This gap is measured through the following criteria:
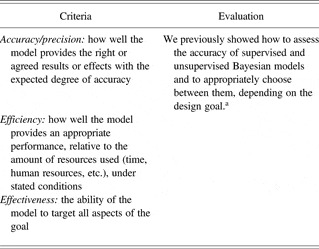
• accuracy/precision: how well the model provides the right or agreed results or effects with the expected degree of accuracy;
• efficiency: how well the model provides an appropriate performance, relative to the amount of resources used (time, human resources, etc.), under stated conditions; and
• effectiveness: the ability of the model to target all aspects of the goal.
4. A CASE STUDY OF MODEL EVALUATION
In the following sections, we show how our evaluation model allows both presenting a given model and evaluating it. We choose as a case study a model we constructed and presented in Ben Ahmed and Yannou (Reference Ben Ahmed and Yannou2009).
A set of 11 automotive experts (of sales departments) was gathered for a whole day of evaluation of 10 dashboards of recent cars belonging to the same marketing segment (of small cars), namely, Audi A2, Citroën C2, Fiat Idea, Lancia Ypsilon, Nissan Micra, Peugeot 206, Renault Clio, Renault Modus, Toyota Yaris, and Volkswagen Polo. The 11 subjects were immerged in a decision context and described as a target user profile and a purchasing situation. During this workshop, the 11 subjects were asked to assess dashboard pictures without actually seeing or touching these dashboards. We were conscious that there was a bias, but it was also a way to isolate the dashboards because the car brands were not displayed and were even removed from the pictures.
4.1. Presentation of our model
4.1.1. Presentation of the model teleology (objective)
A design process can be seen as an iterative and complex process guided by a final and ultimate objective, which is to make the developed product fitting the customer aspirations. Hence, predicting customers' satisfaction level when one develops a new product is fundamental. That is the aim of the model we use here as a case study. It stems from kansei engineering (or emotional engineering; Nagamachu, 1997; Schütte, Reference Schütte2005) that provide designers with models to help them understanding customers' needs and thereby predict their appreciation level of a new product.
In other words, the teleology of our model is to allow designers answering the two following questions:
1. What is the impact of a given decision related to the design parameters (i.e., technical and/or functional parameters) on the final customer perception?
2. Given a customer's expected need, what are the optimal technical choices a designer has to perform in order to satisfy the customer need?
The relevance of the answer to these questions depends on the quality of our kansei model. Thereby, the evaluation of this model is crucial.
4.1.2. Presentation of the model ontology
As we noticed in Section 3.1, the model ontology includes the model concepts as well as the representation formalism.
Presentation of the model concepts
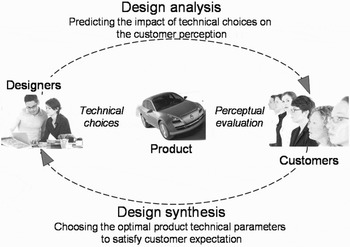
The several concepts of our kansei model are described in Figure 2.
Several concepts of a kansei model.

A kansei model can be seen as an interaction between the following concepts:
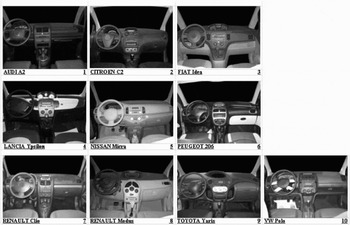
• The product to be designed: in our case, car dashboards (like those represented in Fig. 3).
• The customer: car users.
• The designer: dashboard designers.
The interaction between these three concepts is expressed through two types of attributes:
• Technical attributes characterize the dashboards. The role of a designer is to choose the adequate technical attributes. In a sense, technical attributes are the result of the interaction between designers and dashboards
• Perceptual attributes describe the customer assessment of the dashboards. In a sense, perceptual attributes are the result of the interaction between customers and dashboards.
The model building is based upon a data colleting protocol that has been described in Yannou and Coatanea (Reference Yannou and Coatanea2007), and already experimented on another case study in Petiot and Yannou (Reference Petiot and Yannou2004) and Yannou and Petiot (Reference Yannou and Petiot2004). Ten automotive dashboards (Audi A2, Citroen C2, Fiat Idea, Lancia Ypsilon, Nissan Micra, Peugeot 206, Renault Clio, Renault Modus, Toyota Yaris, and VW Polo} are evaluated by 11 customers (cf. Fig. 3).
The 10 dashboards evaluated by customers.

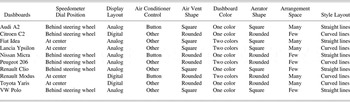
We defined a set of eight technical attributes characterizing the dashboards with corresponding modalities (two at least but the number may increase): the “speedometer dial position” = {behind steering wheel, at the center of the dashboard}, “display layout” = {analog, digital}, “air conditioner control” = {button, other}, “air vent shape” = {rounded, square}, “dashboard color” = {single color, two colors}, “aerator shape” = {rounded, square}, “arrangement space” = {many, few}, and “style layout” = {curved lines, straight lines}. The characterization of the 10 dashboards according to the technical attributes is objective and does not depend on the preference of customers. It is presented in Table 1.
The technical characterization of the 10 dashboards

We also defined a set of 11 perceptual attributes, which describe the customer assessing of the “space organization,” “control button comprehensibility,” “aerator layout,” “arrangement space,” “comfort,” “simplicity,” “sportive layout,” “masculinity layout,” “quality,” “novelty,” and “harmony” (for details on attributes, see Harvey, Reference Harvey2005). The customer evaluations of the dashboard perceptual attribute levels is made in qualitatively pairwise comparing the 10 dashboards under each of the 11 perceptual attributes (for mathematical details, see Limayem & Yannou, Reference Limayem and Yannou2004). It leads to 11 normalized score vectors. The advantage of this method is that the value scale is automatically built thanks to the pairwise comparison mechanism without the need to define a specific metrics (i.e., a score of 0.1 for the “masculinity layout” means much more feminine than a score of 0.3). Next, each normalized score vector (the scores sum is 1) is transformed to fit into a standard scale of [0, 20]. Finally, continuous attribute levels are projected into discrete categories: [0, 5] = very low, [6, 10] = low, [10, 14] = medium, [15, 17] = high, [18, 20] = very high.
Eleven customers participated in this study, so a 110 × 19 matrix was then constructed: rows = 10 dashboards × 11 customers, columns = 8 technical attributes and 11 perceptual attributes.
Presentation of the model representation formalism
As we noted in Section 3.1, we can use several representation techniques such as graphs (Sowa, Reference Sowa1984), text, mathematical grammars, frames, rules, and so forth, to construct our model. In Yannou and Petiot (Reference Yannou and Petiot2004), we used the principle component analysis, although in Yannou and Coatanea (Reference Yannou and Coatanea2007) we used Bayesian networks (BNs; Jensen, Reference Jensen1996) as the representation formalism. In this paper we briefly describe the second model.
BNs are directed acyclic graphs used to represent uncertain knowledge in artificial intelligence (Jensen, Reference Jensen1996). A BN is defined as a couple,

where
• S = (N, A) represents the structure (i.e., the graph) and N is a set of nodes. Each node represents a discrete variable X having a finite number of mutually exclusive states (modalities). In our case study, X may be a perceptual attribute as well as a technical attribute. Here, A is a set of edges, and the relation “N 1 is a parent of N 2” is represented by an edge linking N 1 to N 2. In our case study, an edge may be interpreted as a causal relation.
• P represents a set of probability distributions that are associated with each node. When a node is a root node (i.e., it does not have a parent), P corresponds to the probability distribution over the node states. When a node is not a root node, that is, when it has some parent nodes, P corresponds to a conditional probability distribution that quantifies the probabilistic dependency between that node and its parents. It is represented by conditional probability tables.
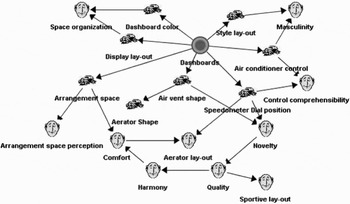
Figure 4 represents the BN we obtained through an automatic learning on the data. The presentation of the learning approach is out of the scope of this paper (for more details on the learning approach we used, see Lam & Bacchus, Reference Lam and Bacchus1994; Ben Ahmed & Yannou, 2008).
Unsupervised learning to identify probabilistic relationships within the data [i.e., between the dashboard's physical (car icon) and perceptual (face icon) attributes].

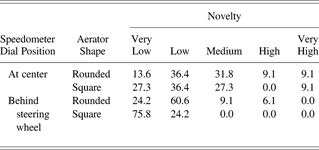
Edges in this BN can be interpreted as causal relationships. For instance, according to Figure 4, the subjective attribute novelty depends on the two physical attributes air vent shape and speedometer position. Each relation (i.e., edge) is expressed through a conditional probability table, which is automatically computed. For example, the relation between novelty, air vent shape, and speedometer position is represented through Table 2.
Conditional probabilities representing the causal relation among air vent shape, speedometer position, and novelty
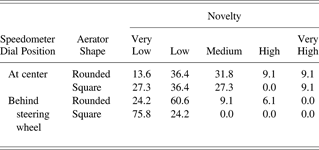
According to this table, P (novelty = very low/speedometer dial position = at center + air vent shape = rounded) = 13.6%.
4.1.3. Presentation of the model functioning
We notice here that the constructed model (cf. Fig. 5) allows the identification of three types of relationships:
1. Relationships within technical attributes. For example, air vent shape has a direct impact on the aerator shape.
2. Relationships within perceptual attributes. For example, harmony perception has a direct impact on comfort perception.
3. Relationships between technical and perceptual attributes. For example, the two physical attributes air vent shape and speedometer position have an impact on the novelty perception.
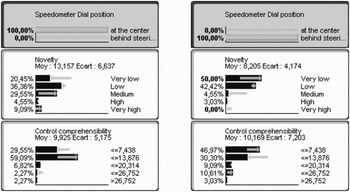
The influence of the speedometer dial position on the dashboard novelty layout and the control comprehensibility: a dashboard with the speedometer dial located at the center is perceived by customers as more novel than a dashboard with the speedometer dial located behind the steering wheel. However, that choice may deteriorate the control comprehensibility.

Because a BN is a complete model for the attributes and their relationships, it can be used to answer probabilistic queries about them. For example, the network can be used to find out updated knowledge of the state of a subset of attributes when other attributes (the evidence attributes) are observed. This process of computing of the posterior distribution of attributes given evidence is called probabilistic inference. Inference in BN (Huang & Dawiche, Reference Huang and Dawiche1996) allows then taking any state attribute observation (an event) into account so as to update the probabilities of the other attributes. Without any event observation, the computation is based on a priori probabilities. When observations are given, this knowledge is integrated into the network and all the probabilities are updated accordingly.
A kansei BN provides designers with several use, or simulation, scenarios. We present here only the main scenarios: the analysis scenario and the synthesis scenario (for all the use scenarios presentation, see Ben Ahmed & Jannou, 2008).
Analysis scenario
The analysis scenario allows answering the question “what is the probable impact of the choice related to physical attributes on the other design attributes and especially on the perceptual attributes.” Let us consider the speedometer dial position as an example of such a design impact. According to the model presented in Figure 4, the speedometer dial position has an impact on the dashboard “novelty perception” as well as on the “control comprehensibility.” This model not only helps the design to identify the relevant relations between this particular technical attribute and the other design attributes, but also allows him knowing in which proportions it impacts them. For instance, the model states that a dashboard whose speedometer dial is located at the center is perceived by customers as more novel than a dashboard whose speedometer dial is located behind the steering wheel. However, that choice deteriorates the control comprehensibility. In a sense, the model allows a designer to compare the two possible technical choices related to the speedometer dial position (i.e., at the center or behind the steering wheel) in a multicriteria way (cf. Fig. 5) with a certain confidence depending on the learning set of assessed dashboards.
Synthesis scenario
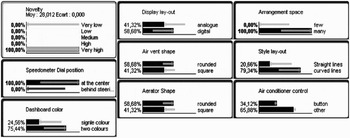
The synthesis scenario allows answering the question “what are the best choices (related to technical attributes) the designer must make so as to configure the level of a perceptual attribute as expected.” The same model presented in Figure 4 allows a designer to identify all possible design choices that let him optimizing the level of a given perceptual attribute (or performance). As an example, we take the “dashboard novelty perception” as target attribute to optimize and show how our BN model allows identifying the best technical choices designers can perform to improve that attribute.
Figure 6 shows that to improve “dashboard novelty perception,” designers should carry out the following choices: a speedometer dial position at the center of the dashboard, two colors instead of single color, digital display instead of analog, rounded air vent shape, many arrangement spaces and curved lines, and so forth.
The optimal technical choices that a designer should carry out in order to improve the novelty perception of a dashboard.

4.1.3. Presentation of the model evolution
As noted in Section 3.3, a model evolution is characterized by its transformation (i.e., structural or functional) because of an internal or external change. One of the main determining advantages of a BN approach is its ability to evolve to integrate changes. Many reasons may be a cause of change:
• A structural inconsistency: Because input data may be not representative of the reality, there may be an inconsistent relationship between two nodes (i.e., attributes). In this case, the user may easily modify the model structure to handle such an inconsistency instead of using the causal network computed after a given learning algorithm. Then, the user may remove an edge if he believes that there is no apparent causal relation between the correspondent nodes and restart a quantitative updating of inner conditional probability tables. Likewise, the user may add an edge between two nodes if he believes there is a causal relationship between them even if the learning algorithm has not detected the relation. He may also modify the orientation of a given edge. Let us take the example of the model presented in Figure 4. This model states a strong probabilistic correlation between “comfort” perception and “aerator style-out” perception. However, the edge orientation states that “comfort” perception has an impact on “aerator style-out” perception. It is easy to detect this “structural” inconsistency because the inverse is more coherent. In such a case, the user has just to change the edge orientation to make this relationship causally more relevant. There is apparently no change in the levels of node modalities, but there is a local recomputation of the conditional probability table, and a next simulation through the BN will lead to different results.
• An analytical incoherence: This is related to conditional probabilities characterizing attributes relationships. Let us take the example presented in Table 2: based on his experience, the user can change the figures that represent the conditional probabilities linking attributes if he believes that the figures do not represent the reality (when there is a lack of data form example).
• An update of the mode inputs: If there is an evolution of the input data used to learn the BN model, the user has just to perform a new learning of the BN model on the new data. The structure as well as the conditional probabilities is automatically updated.
In a sense, a BN model allows a user to integrate his knowledge as well as the knowledge embedded in new data.
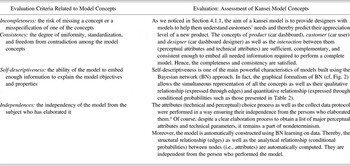
4.2. Evaluation of our kansei model
In the following we present the different assessment of our model along the four systemic axis as developed above.
4.2.1. Evaluation of our model ontology
In Table 3, we assess the model ontology (concepts and representation formalism) according to the criteria we presented in Section 3.1.

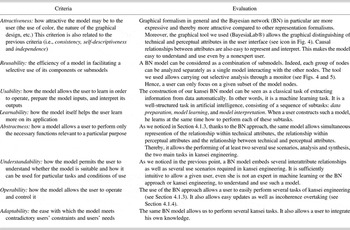
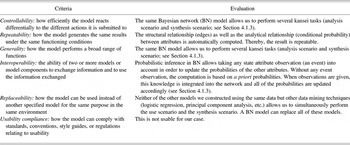
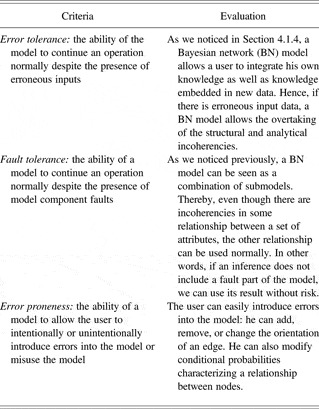
4.2.2. Evaluation of our model functioning
Table 4 provides the criteria for the evalutation of the model interaction with the user. Tables 5 and 6 present the criteria for the evaluation of the model behavior under normal and stressful conditions, respectively.
Evaluation of the model interaction with the user

Evaluation of the model behavior under normal conditions

Evaluation of the model behavior under stressful conditions

4.2.3. Evaluation of our model evolution
For the criteria to evaluate our model evolution, see Table 7.
Evaluation of the model evolution

aSee Ben Ahmed and Yannou (Reference Ben Ahmed and Yannou2009).
4.2.4. Evaluation of our model teleology
Table 8 contains the criteria for evaluating the model teleology.
Evaluation of the model teleology

aSee Ben Ahmed and Yannou (Reference Ben Ahmed and Yannou2009).
5. INTERRELATIONSHIPS BETWEEN EVALUATION CRITERIA
5.1. Introduction to the selection of criteria
The main technical issue that this work faced was related to the criteria identification. Coming from various fields such as education, policy making, information theory, economy, philosophy, the criteria evolved with the progress in understanding the processes. In most cases these criteria appear as single to undertake the assessment of a specific character. Based on the work of Reich (Reference Reich1994, Reference Reich1995) and the cybernetic of the second order we have considered all the potential scientific fields that have explicitly addressed the evaluation theory and methodology, and their associated criteria. We have then suggested consensus on their definitions based on the work of Heylighen (Reference Heylighen1993, Reference Heylighen1997).
5.2. Interrelationships between model evaluation criteria and knowledge evaluation criteria
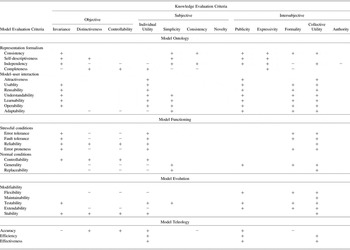
Because a model does not constitute an objective in itself, but is a means to create new knowledge, a satisfactory model must be the one that allows deriving adequate knowledge in given contexts. In other words, the model evaluation criteria must fulfill the knowledge evaluation criteria (see Section 2.4 and Fig. 1).
The question of links between the two types of criteria sets is worth studying. We propose, in this paper, a first suggestion of such links, based on our experience (example used in this paper and other initiatives). Table 9 is the result of a first generic correlation that can exist between the two sets of evaluation criteria.
Interrelationships within model evaluation criteria

A plus or minus in case (i, j) means that model criterion i is positively or negatively correlated to the improvement of model criterion j, respectively.
Table 9 may be interpreted in both directions. In the vertical direction, let us take the example of the criterion presented in the first column, that is, knowledge invariance: to improve this criterion (i.e., +), we can improve the model consistency, self-descriptiveness, independency, and so forth. We can also weaken the criterion model completeness. In the horizontal direction, let us take the example of the criterion presented in the third row, that is, model ontology independency: the improvement of this criterion (i.e., +) may lead to the improvement of the knowledge invariance, simplicity, and consistency and/or the degradation (i.e., −) of the knowledge distinctiveness, controllability, and formality.
Only the approach related to the relationship between knowledge evaluation criteria and model evaluation criteria must be considered here, and the reader must not pay too much attention to the table content, as it should be confirmed by more model implementations and postvalidations. We intend to provide Table 9 to a panel of researchers to figure out whether it is possible and relevant to refine this general correlation table. However, for the time being, we consider this table as an architecture to adapt (a pattern to instantiate) to any domain of application.
5.3. Interrelationships within model evaluation criteria
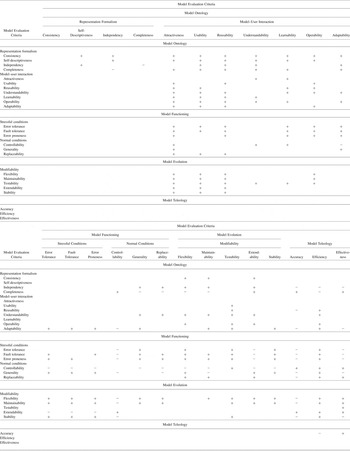
We have thus far considered a complete independence between the evaluation criteria of a model. However, in practice, the levels of compliance to the criteria turn out to be correlated. Again, we have found no existing study on that subject in the literature. We propose in Table 10 the generic correlation matrix between the model evaluation criteria filled by the knowledge gathered during this experiment. This result has to be considered as a framework, and should not be adopted without an extensive validation.
The interrelationships within model evaluation criteria

A plus or minus in case (i, j) means that model criterion i is positively or negatively correlated to the improvement of model criterion j, respectively.
Table 10 may be interpreted in its two directions. Vertically: let us take the example of the criterion presented in the 18th column, that is, model flexibility: to improve this criterion (i.e., +), we can improve model consistency, independency, and so forth. We can also weaken (i.e., −) model completeness. Horizontally: let us take the same example of the criterion model flexibility: the improvement of this criterion (i.e., +) may lead to the improvement of model attractiveness, reusability, and so forth. This may also lead to the weakening (i.e., −) of model controllability, model precision, and so forth. We notice here (as in the previous section) that only the approach related to the relationship within model evaluation criteria must here be considered, and the reader must not pay too much attention to the table content, as this content should be confirmed by more model implementations and postvalidations.
6. DISCUSSION OF THE APPROACH
There are several potential approaches to the representation of the perceived world. Modeling is a natural human process that started to be studied since the Greek civilization. The understanding of the explicit and implicit behavior of the “modeler” has been influenced by most of the school of thoughts in philosophy. It is too early to state that a Cartesian ontological description of the world is obsolete. However, there is a consensus in the scientific community for a need to describe the component of the perceived real or artificial world in terms of its components and its behavior or functionality. There are much more doubt and critics against the need to describe the teleology of a system.
The approach used here to set the list of criteria to be considered is based on two stages. A top-down perspective based on the general system theory that forces the consideration of the four levels of description; and the bottom-up approach based on a deep analysis of the criteria used in several disciplines. We provide here this classification.
The main drawback of the approach used belongs to the intrinsic characteristic of the approach dealing with the concept of recursively. In fact, although at the epistemological level it leaves the door open for a refinement of the description, at the same time it closes the door for a perfect control of the system behavior and thus lead to a risk of incompleteness.
Nevertheless, when applied in the design field (presented here) and in more areas since the beginning of the 1900s (for knowledge management, see Ben Ahmed et al., Reference Ben Ahmed, Mekhilef, Bigand and Page2003; design process documentation, Cantzler et al., Reference Cantzler, Mekhilef and Bocquet1995; Mekhilef et al., Reference Mekhilef, Bocquet, Cantzler and Gallardo1998; and industrial maintenance, Baud, 1965), it provided us with a real new approach leading to a more mature description of the systems under studies.
Nevertheless, from the application perspective, one has to consider that all the criteria might not be considered at the same time. It is best suitable to introduce some weighting or hierarchization according to the modeling objectives. The use of house of quality method is recommended.
7. CONCLUSION
Is my model of the real world or my model of an artificial world a satisfactory model? Here is the question that a biologist (relative to a model of bacteria), or, an industrial engineer [relative to a model of a production system or of a product system (digital mockup)] could ask when confronted to a modeling process aiming at generating the necessary knowledge that could result in the best set of actions in a given context.
This paper has adopted an evolutionary–cybernetic epistemology to state that the model assessment criteria may also derive from the assessment criteria of the generated knowledge. This paper has also adopted a systemic approach in systematically considering four viewpoints in the evaluation process: ontology, functioning, evolution/transformation, and teleology.
A generic model of a model evaluation has been defined through the proposal of 28 model evaluation criteria and 12 knowledge evaluation criteria. We have been using this approach is several case studies and presented a specific case in this paper.
In addition, we have proposed two correlation tables between evaluation criteria that should help the modeler to better characterize his/her application domain in terms of expected modeling difficulties.
We hope that this model of a model evaluation will bring a valuable aid to modelers in the future. The matrix presented might be extended to include any missed criteria. The ultimate question could then be “Is our model satisfactory?”
Walid Ben Ahmed received his degree in mechanical engineering from the National Engineering School of Tunis in 2000, his MS in design and product system development from Ecole Centrale Paris (ECP) in 2001, and his PhD in knowledge engineering and management in design from the Industrial Engineering Department at ECP in 2004. Dr. Ben Ahmed is now an expert on product reliability and is in charge of innovation risk management in the Powertrain Engineering Division at Renault. His research interests include product reliability analysis, complex system modeling, product modeling, innovation, evaluation, knowledge engineering, and data mining in design.
Mounib Mekhilef is an Associate Professor at the University of Orléans in France. He obtained his mechanical engineering degree in 1982, his PhD at ECP in 1991, and his habilitation degree to manage research from the University of Nantes in 2000. Dr. Mekhilef is teaching modeling techniques and computer-aided design in the Mechanical Engineering Department at the University of Orléans. His main research fields are in design optimization.
Bernard Yannou is a Professor of industrial and mechanical engineering at the Laboratoire Génie Industriel of ECP. He received an MS (1988) in mechanical engineering from Ecole Normale Supérieure of Cachan and a second MS (1989) in computer science from Paris-6 University. He received a PhD (1994) in industrial engineering from Ecole Normale Supérieure of Cachan. Dr. Yannou's research interests are centered on the preliminary stages of product design: defining the design requirements, synthesizing product concepts, rapid evaluation of product performances, preference aggregation of the product, and project performance for the supervision of the design process.
Michel Bigand is an Associate Professor of computer science and project management at Ecole Centrale de Lille (France). He received an MS in mechanical engineering (1980) from Ecole Normale Supérieure de Cachan and a PhD (1988) from Paris-6 University, enabling him to manage research since 2005. Dr. Bigand's research activities at the Industrial Engineering Laboratory of Lille (LGIL) are concerned with design systems engineering and their associated information systems. More specifically, he works on models integration for knowledge sharing and interoperability.