1. Introduction
Large-scale magnetic structures are commonly observed in astrophysical media and have also been shown to stabilize the H mode in tokamaks (Solano et al. Reference Solano, Lomas, Alper, Xu, Andrew, Arnoux, Boboc, Barrera, Belo and Beurskens2010). The question then arises as to what are the physical processes contributing to their formation and prescribing their characteristic size. In astrophysics, among the potential mechanisms, turbulent inverse cascades have been suggested. In this context, special attention has been paid in the literature to the cascade of magnetic helicity in the framework of incompressible magnetohydrodynamics (MHD) in the absence of an ambient field (Frisch et al. Reference Frisch, Pouquet, Léorat and Mazure1975; Pouquet, Frisch & Leorat Reference Pouquet, Frisch and Leorat1976; Meneguzzi, Frisch & Pouquet Reference Meneguzzi, Frisch and Pouquet1981; Alexakis, Mininni & Pouquet Reference Alexakis, Mininni and Pouquet2006; Müller, Malapaka & Busse Reference Müller, Malapaka and Busse2012; Linkmann & Dallas Reference Linkmann and Dallas2016, Reference Linkmann and Dallas2017; Pouquet et al. Reference Pouquet, Rosenberg, Stawarz and Marino2019). Extension to compressible MHD with Mach number that goes up to unity (Balsara & Pouquet Reference Balsara and Pouquet1999; Brandenburg Reference Brandenburg2001), as well as the case of incompressible Hall MHD (Pouquet, Stawarz & Rosenberg Reference Pouquet, Stawarz and Rosenberg2020) were also studied. The cascade is, however, prevented by the presence of an ambient field, due to the non-conservation of the magnetic helicity based on the fluctuations, and due to the lack of gauge invariance of the conserved generalized magnetic helicity that can be defined in this regime (Matthaeus & Goldstein Reference Matthaeus and Goldstein1982; Stribling, Matthaeus & Ghosh Reference Stribling, Matthaeus and Ghosh1994; Brandenburg & Matthaeus Reference Brandenburg and Matthaeus2004). Conservation of the magnetic helicity together with the existence of an inverse cascade (Kim & Cho Reference Kim and Cho2015) are nevertheless recovered in electron MHD (EMHD) that describes whistler waves at electron scales where the ion motion is negligible and the dispersion associated with the Hall effect is significant. One is thus naturally led to wonder about the possibility of the existence of an inverse cascade for kinetic Alfvén waves (KAWs) at sub-ion scales.
A question arises concerning the possible drivers for such inverse cascades. Bypassing the classical local direct cascade, energy could be directly injected at small scales via non-local interactions mediated by magnetic reconnection occurring in thin ion-scale current sheets. It has recently been proposed that these reconnection events could generate an inverse flux towards larger scales, as well as starting a transfer of energy towards smaller scales (Franci et al. Reference Franci, Cerri, Califano, Landi, Papini, Verdini, Matteini, Jenko and Hellinger2017). Another example of a possible mechanism was discussed in the context of Alfvénic turbulence in the distant ion foreshock region where observation of an inverse cascade was reported, related to the existence of nonlinear parametric instabilities generated by upstream accelerated protons reflected on the bow shock (He et al. Reference He, Duan, Zhu, Yan and Wang2019).
The dynamics of a strongly magnetized plasma characterized by small perturbations of a homogeneous equilibrium is appropriately described by the gyrokinetic formalism, from which reduced gyrofluid models of various complexity can be derived. Such models can provide a uniform description covering a spectral range extending from MHD to electron scales. They capture the transition from Alfvén waves to KAWs, which are known to play a dominant role in the solar wind at MHD (Belcher & Davis Reference Belcher and Davis1971; Réville et al. Reference Réville, Velli, Panasenco, Tenerani, Shi, Badman, Bale, Kasper, Stevens and Korreck2020) and sub-ion (Alexandrova et al. Reference Alexandrova, Saur, Lacombe, Mangeney, Mitchell, Schwartz and Robert2009; Sahraoui et al. Reference Sahraoui, Goldstein, Belmont, Canu and Rezeau2010; Salem et al. Reference Salem, Howes, Sundkvist, Bale, Chaston, Chen and Mozer2012; Podesta Reference Podesta2013) scales, respectively. Their nonlinear dynamics is isolated in the description provided by a reduced two-field gyrofluid model discussed in Passot, Sulem & Tassi (Reference Passot, Sulem and Tassi2018), Passot & Sulem (Reference Passot and Sulem2019) and Miloshevich, Passot & Sulem (Reference Miloshevich, Passot and Sulem2019). When neglecting electron inertia, it extends to finite beta parameters the model considered in Zocco & Schekochihin (Reference Zocco and Schekochihin2011) taken in the isothermal limit, retaining the coupling to the parallel magnetic fluctuations.
Kinetic effects, such as Landau damping, cyclotron resonance or micro-instabilities, are definitely not taken into account in the two-fluid gyrofluid model. The coupling to magnetosonic waves, which could play a role at larger scales (e.g. they permit the decay instability of Alfvén waves at MHD scales), is also not retained. Nevertheless, the two-field gyrofluid model enables the study (for a broad range of plasma parameters) of imbalanced turbulence, characterized by an excess of the energy carried by one of the two types of counter-propagating waves. Imbalanced Alfvénic turbulence is ubiquitous in the solar wind (Tu, Marsch & Thieme Reference Tu, Marsch and Thieme1989; Lucek & Balogh Reference Lucek and Balogh1998; Wicks et al. Reference Wicks, Roberts, Mallet, Schekochihin, Horbury and Chen2013), with the degree of imbalance dependent on the type of wind (Tu, March & Rausenbauer Reference Tu, March and Rausenbauer1990; Bruno, Trenchi & Telloni Reference Bruno, Trenchi and Telloni2014; Bruno et al. Reference Bruno, Telloni, DeIure and Pietropaolo2017; D'Amicis, Matteini & Bruno Reference D'Amicis, Matteini and Bruno2019) and on the distance from the Sun (Roberts et al. Reference Roberts, Goldstein, Klein and Matthaeus1987; Marsch & Tu Reference Marsch and Tu1990; Chen et al. Reference Chen, Bale, Bonnell, Borovikov, Bowen, Burgess, Case, Chandran, de Wit and Goetz2020). In the framework of the two-field model, imbalance is easily characterized by the generalized cross-helicity (GCH) which is an ideal quadratic invariant that reduces to the negative cross-helicity at MHD scales and to the magnetic helicity at sub-ion scales. When turbulence is driven by injection of energy and of GCH, these quantities are expected to cascade forward to smaller scales and/or backward to larger ones, depending in particular on the injection scale compared to the ion Larmor radius (or the sonic Larmor radius). Indeed, no inverse cascade can take place at the MHD scales in the presence of a strong ambient field, while an inverse cascade of magnetic helicity was predicted in the (dispersive) sub-ion range, by analogy with EMHD (Schekochihin et al. Reference Schekochihin, Cowley, Dorland, Hammett, Howes, Quataert and Tatsuno2009), and also on the basis of absolute equilibrium arguments (Passot et al. Reference Passot, Sulem and Tassi2018). Based on these observations, one expects that as the inverse cascade approaches the MHD scales, its properties will be significantly affected.
In addition to providing a mechanism for the formation of large-scale structures in fluids and plasmas, inverse cascades can reveal various interesting phenomena, like critical transitions that are observed in split-cascade configurations when the relevant dimensionless parameter is varied (Alexakis & Biferale Reference Alexakis and Biferale2018). This includes transitions from inverse to forward cascade of energy in thin-layer turbulence (Benavides & Alexakis Reference Benavides and Alexakis2017) and transitions from MHD to fluid turbulence, when the relative strength of the magnetic forcing parameter is varied (Seshasayanan, Benavides & Alexakis Reference Seshasayanan, Benavides and Alexakis2014). Furthermore, there are examples of such criticality in rotating and stratified flows where helicity conservation can be broken when dynamical parameters such as Rossby and Froude numbers are varied (Marino et al. Reference Marino, Mininni, Rosenberg and Pouquet2013).
The present paper addresses the existence and the properties of the inverse cascades that can develop in the two-field gyrofluid model when energy and GCH are injected. We vary the injection rate, the driving scale and the ratio  $\beta _e$ of equilibrium electron thermal pressure to the magnetic pressure due to the ambient field, and suggest that the ratio
 $\chi _f$ of the wave period to the characteristic nonlinear time at the driving scale affects some properties of the inverse cascade in the transverse spectral plane (e.g. its ‘degree of self-similarity’), at least at early times. At late times, the properties of the cascade appear to be rather dependent on the driving scale and
 $\beta _e$. Section 2 provides a description of the model, together with a brief discussion of the Fjørtoft argument often used for predicting the existence of an inverse cascade. Section 3 specifies the numerical set-up and the conditions of the simulations. Section 4 discusses the global properties of the cascade dynamics in the context of our fiducial simulation where turbulence is driven far into the sub-ion range. Section 5 addresses the effect of the turbulence strength on the early dynamics, and in particular the transition from a self-similar spectrum to a propagating spectral bump, the emergence of the parametric decay instability or the instability of balanced turbulence, as the amplitude of the magnetic fluctuations is reduced. Section 6 addresses the situation where the cascade reaches the weakly dispersive range. Section 7 is concerned with the arrest of the cascade and the generation of a finite-scale condensate, when
 $\beta _e$ is large enough. The coherent structures, in the form of magnetic vortices that are generated in physical space as consequences of the inverse cascades and of their arrest, are described in § 8. Section 9 presents the conclusions. The appendices include a brief description of the decay instability in the context of the present model and the derivation of the shell-to-shell transfers.
2. The two-field gyrofluid model
2.1. Equations and conservation laws
A description of the Alfvén wave dynamics from the MHD to the electron scales, in an electron–proton plasma, is provided by the two-field gyrofluid model which involves the gyrokinetic scaling corresponding to a strong spectral anisotropy and weak nonlinearity. In the absence of dissipation and driving, it involves two equations for the electron gyrocentre number density  $N_e$ and the parallelFootnote 1 component of the magnetic potential
 $A_{\|}$, in the formFootnote 2
 \begin{gather} \partial_t N_e +[\varphi,N_e]-[B_z,N_e]+\frac{2}{\beta_e}\boldsymbol{\nabla}_{\|} \varDelta_{\perp} A_{\|}=0, \end{gather}
 \begin{gather}\partial_t L_e A_{\|} -\left [\varphi,\frac{2\delta^2}{\beta_e}\varDelta_{\perp} A_{\|} \right ] + \left [B_z,\frac{2\delta^2}{\beta_e}\varDelta_{\perp} A_{\|}\right ] + \boldsymbol{\nabla}_{\|} \left (\varphi-N_e-B_z \right )=0. \end{gather}
In the above equations, the parallel magnetic fluctuations  $B_z$ and the electron gyrocentre number density
 $N_e$ are related to the electric potential
 $\varphi$ by
 $B_z= M_1 \varphi$ and
 $N_e= -M_2 \varphi$, where
 $M_1$ and
 $M_2$ are Fourier multiplier operators written as
 $M_1 = L_1^{-1}L_2$ and
 $M_2= L_3 + L_4 L_1^{-1}L_2$ (here,
 $\delta ^2 = m_e/m_i$ denotes the electron to proton mass ratio), the operators
 $L_i$ being defined as
 \begin{gather} L_1 = \frac{2}{\beta_e} +(1+2\tau)(\varGamma_0-\varGamma_1), \end{gather}
 \begin{gather}L_2 = 1 +\frac{1-\varGamma_0}{\tau} - \varGamma_0 +\varGamma_1, \end{gather}
 \begin{gather}L_3 = \frac{1-\varGamma_0}{\tau} -\delta^2\varDelta_{\perp}, \end{gather}
 \begin{gather}L_4 = 1-\varGamma_0+\varGamma_1, \end{gather}
 \begin{gather}L_e = 1-\frac{2 \delta^2}{\beta_e} \varDelta_{\perp}. \end{gather}
Here,  $\varDelta _{\perp } = \partial _{xx} + \partial _{yy}$ is the Laplacian in the plane transverse to the ambient field and
 $[f,g]= \partial _x\,f \partial _y g-\partial _y\,f \partial _x g$ the canonical bracket of two scalar functions
 $f$ and
 $g$. Furthermore,
 $\varGamma _n$ denotes the (non-local) operator
 $\varGamma _n(-\tau \varDelta _{\perp })$ associated with the Fourier multiplier
 $\varGamma _n(\tau k_{\perp }^2)$, defined by
 $\varGamma _n(x) = I_n(x) e^{-x}$, where
 $I_n$ is the modified Bessel function of first type of order n. Furthermore,
 $\tau$ denotes the ratio of the proton to the electron temperatures at equilibrium. For a scalar function
 $f$, the parallel gradient operator
 $\boldsymbol {\nabla }_{\parallel }$ is defined by
 \begin{equation} \boldsymbol{\nabla}_{\parallel}\, f=-[A_{\parallel} , f]+\frac{\partial f}{\partial z}. \end{equation}
One recovers the fluctuating magnetic field from the expression of  $B_z$ given above and
 ${\boldsymbol {B}}_{\perp } =\boldsymbol {\nabla }_{\perp }\times (A_{\|}\hat {{\boldsymbol {z}}})$.
Characterizing the plasma equilibrium state by the number density  $n_0$, the temperatures
 $T_{i0}$ and
 $T_{e0}$ and the ambient field
 $B_0$, the model is written above in a non-dimensional form, using the following units: time is normalized to the inverse ion gyrofrequency
 $\varOmega _i^{-1} = (eB_0/(m_ic))^{-1}$ (where
 $e$ is the proton charge and
 $c$ the speed of light), and lengths by the sonic Larmor radius
 $\rho _s= c_s/\varOmega _i$, where
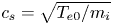 $c_s=\sqrt {T_{e0}/m_i}$ is the sound speed. Thus wavenumbers and wavevector components are measured in units of
 $\rho _s^{-1}$. The other normalization factors include
 $B_0$ for the parallel magnetic fluctuations
 $B_z$,
 $B_0\rho _s$ for the parallel magnetic potential
 $A_{\|}$, the equilibrium number density
 $n_0$ for the electron gyrocentre density
 $N_e$ and
 $T_e/e$ for the electric potential
 $\varphi$. Furthermore, the parameter
 $\beta _e= 8 {\rm \pi} n_0 T_{e0} /B_0^2$ is the ratio of the equilibrium electron pressure to the magnetic pressure due to the ambient field.
At the level of the linear approximation, the KAW parallel phase velocity  $v_{\textrm {ph}}= \omega /k_z$ is given by
 \begin{equation} v_{\textrm{ph}}^2\equiv\left(\frac{\omega}{k_z}\right)^2 = s^2\frac{k_{\perp}^2}{1 + \dfrac{2\delta^2 k_{\perp}^2}{\beta_e}} \dfrac{1 -{\hat{M}}_1 + {\hat{M}}_2} {{\hat{M}}_2}, \end{equation}
where the hat refers to the Fourier symbol of the operator and 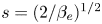 $s= (2/\beta _e)^{1/2}$ is the Alfvén velocity
 $v_A$ measured in sound speed units (
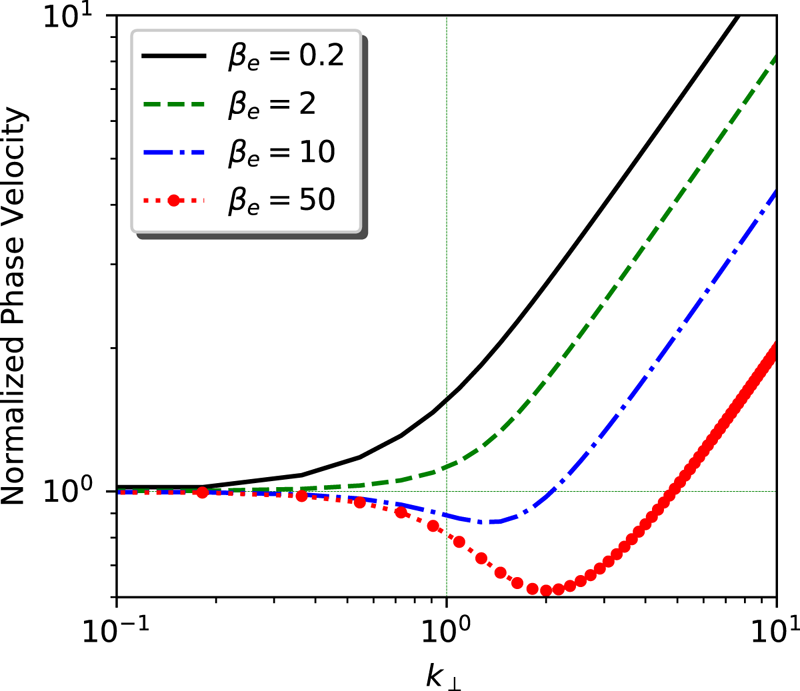
 $s=v_A/c_s$). In figure 1 we plot
 $v_{\textrm {ph}}/s$ versus the transverse wavenumber
 $k_{\perp }$, when electron inertia is neglected. For all values of
 $\beta _e$, the ratio
 $v_{\textrm {ph}}/s$, which can also be viewed as the wave frequency normalized by the Alfvén wave frequency
 $v_A k_{\|}$, is asymptotically equal to unity at large scale (dispersionless limit). On the other hand, while for small (
 $\beta _e = 0.2$) or moderate (
 $\beta _e=2$) values of the electron beta parameter,
 $v_{\textrm {ph}}/s$ involves a monotonic transition to a
 $k_{\perp }$-scaling at sub-ion scales, for larger
 $\beta _e$ (e.g. 10 or 50), it displays a local minimum at a wavenumber that (in inverse sonic Larmor radius units) increases with
 $\beta _e$ at fixed
 $\tau$ and only depends on
 $\beta _i$ when measured in units of the ion Larmor radius
 $\rho _i$. A similar behaviour is observed in figures 3 (
 $\tau = 100$) and 5 (
 $\tau =1$) of Howes et al. (Reference Howes, Cowley, Dorland, Hammett, Quataert and Schekochihin2006) where this quantity is computed from the gyrokinetic theory and also in the framework of the full linear kinetic theory taken in the quasi-transverse limit. As discussed below, it turns out that the sensitivity of the dispersion to the transverse wavenumber, as measured by the parallel phase velocity
 $v_{\textrm {ph}}$, has an important effect on the nonlinear dynamics of the cascade. In particular, it has an impact on the generation of a finite-size condensate and on the formation of large-scale coherent structures.
Normalized parallel phase velocity  $v_{\textrm {ph}} \sqrt {{\beta _e}/{2}}$ (or, equivalently, ratio of the KAW frequency
 $v_{\textrm {ph}} k_{\|}$ to the Alfvén frequency
 $v_A k_{\|}$) versus the transverse wavenumber
 $k_{\perp }$ for various values of
 $\beta _e$.

In physical space, the eigenmodes, which can be referred to as Elsasser potentials, are given by
 \begin{equation} \mu^{\pm} = \varLambda \varphi \pm s A_{\|}, \end{equation}
where
 \begin{equation} \varLambda = D_e^{-1} (1+M_2-M_1)^{1/2} M_2^{1/2} , \end{equation}
with  $D_e^2 = (-\varDelta _{\perp }) L_e$. They obey
 \begin{align} \partial_t \mu^{\pm} &\pm V_{\textrm{ph}} \partial_z \mu^{\pm} +\frac{1}{4} \varLambda^{-1} D_e^{-2} M_3\{[\varLambda^{-1} M_3 (\mu^++\mu^-) , \varLambda^{-1}M_2 (\mu^+ + \mu^-)]\nonumber\\ & +[(\mu^+-\mu^-), \varDelta_{\perp} (\mu^+-\mu^-)]\} \pm \frac{1}{4} D_e^{-2}\varDelta_{\perp} \{ [(\mu^+ -\mu^-), \varLambda^{-1} M_2 (\mu^++\mu^-)]\nonumber\\ &+ [L_e (\mu^+ -\mu^-), \varLambda^{-1} (1-M_1)(\mu^+ +\mu^-)]\}=0. \end{align}
The systems (2.1) and (2.2) or (2.12) preserve the energy  ${\mathcal {E}}$ and the GCH
 ${\mathcal {C}}$, defined as
 \begin{gather} {\mathcal{E}} = \frac{1}{2} \int \left( \frac{2}{\beta_e} |\boldsymbol{\nabla}_{\perp} A_{\|} |^2 + \frac{4\delta^2}{\beta_e^2}|\varDelta_{\perp} A_{\|} |^2- N_e(\varphi -N_e-B_z) \right) \,\textrm{d}^3 {x} \nonumber\\ \hspace{-9pc}=\frac{1}{4} \int \{ (D_e \mu^+)^2 + (D_e \mu^-)^2\} \,\textrm{d}^3x, \end{gather}
 \begin{gather}{\mathcal{C}} =-\int N_e \left( 1 - \frac{2\delta^2}{\beta_e}\varDelta_{\perp} \right) A_{\|}\,\textrm{d}^3 {x} = \frac{1}{4} \int \left \{\left ( V_{\textrm{ph}}^{-1/2}D_e \mu^+\right)^2 - \left ( V_{\textrm{ph}}^{-1/2}D_e \mu^-\right)^2 \right\} \,\textrm{d}^3x, \end{gather}
where  $V_{\textrm {ph}}$ is the operator in physical space, which in Fourier space corresponds to multiplication by
 $v_{\textrm {ph}}$. Note that
 ${\mathcal {C}}$ was defined with an opposite sign in Passot et al. (Reference Passot, Sulem and Tassi2018).
2.2. Normal-field formulation
As is common with non-canonical Hamiltonian systems, the associated Poisson bracket possesses Casimir invariants, corresponding to 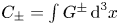 $C_{\pm } = \int G^{\pm } \,\textrm {d}^3x$, where
 $G^{\pm } = L_e A_{\|} \pm \delta N_e$ are referred to as normal fields. In terms of these fields, the two-field gyrofluid model can be rewritten in the form
 \begin{equation} \partial_t G^{\pm} + [\varphi^{\pm}, G^{\pm}] + \partial_z \left ( \varphi^{\pm} \mp \frac{1}{\delta} G^{\pm} \right) =0, \end{equation}
where  $\varphi ^{\pm } =\varphi -B_z \pm ({1}/{\delta }) A_{\|}$. In terms of these variables, GCH simply reads
 \begin{equation} {\mathcal{C}} = -\frac{1}{4\delta}\int \left \{(G^+)^2 - (G^-)^2 \right \} \, \textrm{d}^3x. \end{equation}
Similarly,
 \begin{equation} {\mathcal{E}} = \frac{1}{2} \int \left \{\frac{1}{2\beta_e} L_e^{-1} |\boldsymbol{\nabla}_{\perp} (G^+ + G^-)|^2 + \frac{1}{4\delta^2}M_3 M_2^{-1} (G^+ -G^-)^2 \right\}\, \textrm{d}^3x. \end{equation}
Note that the system of (2.15) for  $G^{\pm }$ becomes degenerate in the limit
 $\delta \to 0$, as the two equations become identical and reproduce the equation for
 $A_{\|}$. The equation for
 $N_e$ corresponds to the first order in a development in
 $\delta ^2$. As seen below, this formulation nevertheless is of major interest for estimating the energy and GCH spectral transfers estimated in appendix B.
2.3. Fjørtoft argument for an inverse cascade
The Fjørtoft (Reference Fjørtoft1953) argument originally referred to a simple method to predict the existence of an inverse cascade by noting the impossibility of simultaneous direct cascades of two ideal invariants whose spectra differ by a power of the wavenumber. Other versions of the argument can be found in Nazarenko (Reference Nazarenko2011) (and references therein). We first revisit the use of the Fjørtoft (Reference Fjørtoft1953) argument to support the existence of an inverse GCH cascade at sub-ion scales (Schekochihin et al. Reference Schekochihin, Cowley, Dorland, Hammett, Howes, Quataert and Tatsuno2009). In this range, the two-field model simplifies and reduces, when neglecting electron inertia, to electron reduced MHD (ERMHD) (Schekochihin et al. Reference Schekochihin, Cowley, Dorland, Hammett, Howes, Quataert and Tatsuno2009; Boldyrev et al. Reference Boldyrev, Horaites, Xia and Perez2013), under the conditions  $\tau k_{\perp }^2 \gg 1$,
 $\tau \sim 1$:
 \begin{gather} \partial_t A_{\|} + \left(1+\frac{1}{\tau}\right) \boldsymbol{\nabla}_{\|} \varphi=0, \end{gather}
 \begin{gather}\partial_t \varphi - \frac{\dfrac{2\tau}{\beta_e}}{1+\dfrac{\beta_e}{2}(1+\tau)} \boldsymbol{\nabla}_{\|}\varDelta_{\perp} A_{\|} =0. \end{gather}
In this regime, the invariants read
 \begin{gather} {\mathcal{E}} = \frac{1}{\beta_e}\int \left (|{\boldsymbol{B}}|^2 + \frac{2}{\beta_e} \frac{1}{1+\tau} B_z^2 \right )\,\textrm{d}^3x, \end{gather}
 \begin{gather}{\mathcal{C}} = \left ( 1 + \frac{2}{\beta_e}\frac{1}{1+\tau} \right ) \int A_{\|}B_z\,\textrm{d}^3x. \end{gather}
In the incompressible limit where the beta parameter tends to infinity, the GCH invariant reduces, in the quasi-transverse limit, to the generalized magnetic helicities of EMHD (Biskamp et al. Reference Biskamp, Schwarz, Zeiler, Celani and Drake1999), or of extended MHD when the ion velocity and electron inertia are taken to zero ((35) of Abdelhamid, Lingam & Mahajan (Reference Abdelhamid, Lingam and Mahajan2016) and (29) of Miloshevich, Lingam & Morrison (Reference Miloshevich, Lingam and Morrison2017)).
The magnetic field  ${\boldsymbol {B}}$ can be written
 ${\boldsymbol {B}} = \boldsymbol {\nabla }_{\perp } \times (A_{\|} {\hat {\boldsymbol {z}}}) + B_z {\hat {\boldsymbol {z}}}$. Introducing
 ${\boldsymbol {A}}_{\perp }$ such that
 $B_z = {\hat {\boldsymbol {z}}}\boldsymbol {\cdot } (\boldsymbol {\nabla }_{\perp } \times {\boldsymbol {A}}_{\perp })$, one has
 $\int A_{\|} B_z\,\textrm {d}^3x = (1/2)\int {\boldsymbol {A}}\boldsymbol {\cdot } {\boldsymbol {B}}\,\textrm {d}^3x$ with
 ${\boldsymbol {A}} = {\boldsymbol {A}}_{\perp } + A_{\|} {\hat {\boldsymbol {z}}}$ (see e.g. (F6) of Schekochihin et al. (Reference Schekochihin, Cowley, Dorland, Hammett, Howes, Quataert and Tatsuno2009)), together with
 $\int |{\boldsymbol {B}}|^2\,\textrm {d}^3x = \int |\boldsymbol {\nabla }_{\perp } \times {\boldsymbol {A}}|^2\,\textrm {d}^3x$.
In the large  $\beta _e$ limit,
 ${\mathcal {E}}= ({1}/{\beta _e})\int |{\boldsymbol {B}}|^2\,{\textrm {d}x}$ and, like in incompressible MHD without ambient field (see e.g. Pouquet et al. (Reference Pouquet, Rosenberg, Stawarz and Marino2019) for a recent review), assuming that the helicity is of a given sign and that it is maximal, one gets
 $E_c(k_{\perp })= (1/k_{\perp }) E(k_{\perp })$, which leads to conjecture the existence of an inverse cascade of magnetic helicity, by generalizing the argument developed by Fjørtoft (Reference Fjørtoft1953) for two-dimensional incompressible turbulence.
In the case of finite  $\beta _e$, the energy and GCH spectra cannot be directly related to each other. Nevertheless, when turbulence is not too strong, the first and third terms in the energy given by the first line of (2.13) are approximatively in equipartition (this property was checked to be accurately satisfied in the present simulations). In the ERMHD regime, where the coefficients
 $M_1$ and
 $M_2$ are scale-independent, it is easily seen that
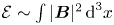 ${\mathcal {E}} \sim \int |{\boldsymbol {B}}|^2\,\textrm {d}^3x$, which then permits use of the above argument. In summary, the phenomenological argument for the existence of an inverse GCH cascade at finite
 $\beta _e$ requires both equipartition between total magnetic and internal energies and single-sign maximal helicity, while in the large
 $\beta _e$ limit the first condition is not necessary.
In contrast, when considering the Hall reduced MHD equations for dispersive Alfvén waves ((E19) and (E20) of Schekochihin et al. (Reference Schekochihin, Cowley, Dorland, Hammett, Howes, Quataert and Tatsuno2009) or (2.24) and (2.25) of Passot & Sulem (Reference Passot and Sulem2019)), which correspond to the regime  $\tau \ll 1$ and
 $\tau k_{\perp }^2 \ll 1$,
 $N_e ({\boldsymbol {k}})\approx - k_{\perp }^2 \varphi ({\boldsymbol {k}})$ and
 $B_z({\boldsymbol {k}}) \approx (1+ 2/\beta _e)^{-1} k_{\perp }^2\varphi {(\boldsymbol {k}})$, one has
 \begin{gather} {\mathcal{E}} = \frac{1}{2} \int \left [ \frac{2}{\beta_e}|\boldsymbol{\nabla}_{\perp} A_{\|} |^2 + \left (1 + \frac{k_{\perp}^2}{1+ \dfrac{\beta_e}{2}}\right) \left(1+ \frac{2}{\beta_e}\right)^2 \frac{1}{k_{\perp}^2} B_z^2 \right ]\,\textrm{d}^3x, \end{gather}
 \begin{gather}{\mathcal{C}} = \left( 1 + \frac{2}{\beta_e}\right) \int A_{\|} B_z\,\textrm{d}^3 x =\frac{1}{2}\left( 1 + \frac{2}{\beta_e}\right) \int {\boldsymbol{A}}\boldsymbol{\cdot} {\boldsymbol{B}}\,\textrm{d}^3x. \end{gather}
Two regimes are then to be distinguished. When formally taking the limit  $k_{\perp } \to \infty$ (which in the Hall reduced MHD model requires en extremely small value of
 $\tau$) and assuming equipartition of the magnetic and internal energies, one writes the total energy in the form
 \begin{equation} {\mathcal{E}}= \frac{1}{\beta_e}\int|{\boldsymbol{B}}_{\perp}|^2\,\textrm{d}^3x = \left ( \frac{1 + \dfrac{2}{\beta_e}}{2+ \dfrac{2}{\beta_e}}\right)\frac{2}{\beta_e} \int |{\boldsymbol{B}}|^2\,\textrm{d}^3x. \end{equation}
The same argument as in the case of ERMHD can then be used to conjecture the existence of an inverse GCH cascade. As expected, this argument does not apply in the reduced MHD regime corresponding to the limit  $k_{\perp } \to 0$. Using in this case the strongest assumption of local-in-scale energy balance, one gets
 \begin{equation} B_z({\boldsymbol{k}}) = \sqrt{\frac{2}{\beta_e}} \frac{1}{1+ \dfrac{2}{\beta_e}}k_{\perp} |{\boldsymbol{B}}_{\perp}({\boldsymbol{k}})|, \end{equation}
and thus
 \begin{equation} {\mathcal{C}} = \sqrt{\frac{2}{\beta_e}} \int |{\boldsymbol{B}}_{\perp}|^2\,\textrm{d}^3 x. \end{equation}
In this case,  ${\mathcal {E}}$ and
 ${\mathcal {C}}$ are proportional and no energetic condition prevents the existence of a simultaneous direct cascade of the two invariants. From the above argument, we can expect that an inverse cascade of GCH develops when turbulence is driven at sub-ion scales and that this cascade progressively slows down when approaching the non-dispersive scales.
3. Numerical set-up and conditions of the simulations
We performed three-dimensional numerical simulations of the two-field gyrofluid, in the form given by (2.15), supplemented with injection at a wavenumber  $k_f$ and small-scale dissipation. Usually, when retaining electron inertia in (2.1) and (2.2),
 $\beta _e$ must be small enough in order for electron finite Larmor radius terms to be negligible compared to electron inertia. In order for both electron finite Larmor radius and inertia terms to be negligible at the forcing wavenumber (we here concentrate on the inverse cascade), one needs to have (in dimensional units) both
 $k_f\rho _e=2^{1/2}\delta (k_f \rho _s)\ll 1$ and
 $k_f d_e=(2/\beta _e)^{1/2}\delta (k_f\rho _s)\ll 1$. In all the simulations listed in table 1 (except the one with
 $k_f\rho _s=36$), one has
 $k_f\rho _e<1$. Electron inertia will thus be even smaller if
 $\beta _e\gtrsim 2$. In order to make the effects associated with electron inertia completely negligible at all the scales, we prescribed an electron-to-proton mass ratio
 $\delta ^2$ smaller than the physical one.Footnote 3
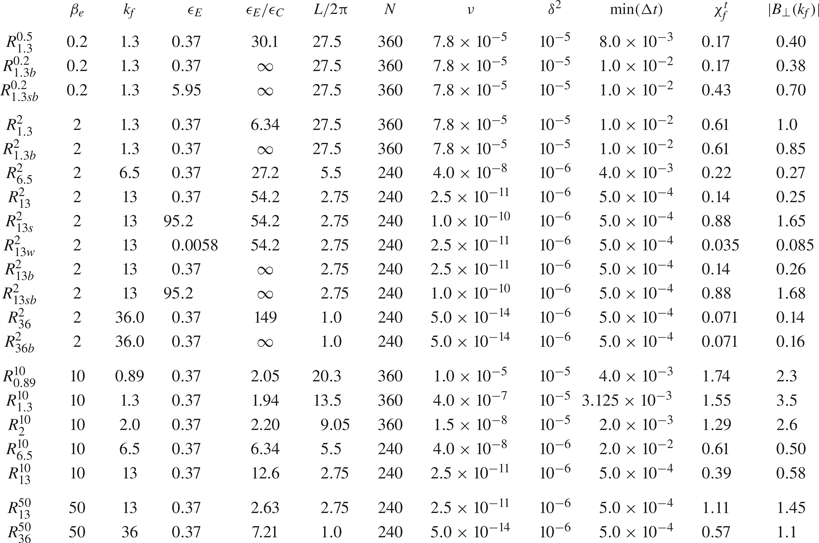
Parameters of the runs, together with the nonlinear parameter  $\chi _f^t$ at the driving scale. Runs are named after the perpendicular wavenumber of the driving and the value of
 $\beta _e$, appearing respectively as subscript and superscript. Additional subscripts
 $s$ and
 $w$ refer to energy injection rates respectively stronger or weaker than the usual value
 $\epsilon _E = 0.372$. In all the simulations,
 $\epsilon _{E^+} / \epsilon _{E^-} = 1.5$, except in runs
 $R_{1.3b}^{0.2}$,
 $R_{1.3sb}^{0.2}$,
 $R_{1.3b}^{2}$,
 $R_{13b}^{2}$ and
 $R_{13sb}^{2}$, where
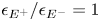 $\epsilon _{E^+} / \epsilon _{E^-} = 1$ (balanced driving).

The integration domain is assumed to be periodic of size  $L$ in the three directions, and a Fourier pseudo-spectral method was used, with aliasing suppressed by spectral truncation at
 $2/3$ of the maximal wavenumber. Time stepping was performed using a third-order Runge–Kutta scheme. The prescribed parameters of the simulations presented in the following are described in table 1, together with the typical level
 $B_{\perp }(k_f)$ at the injection wavenumber and a phenomenological estimate
 $\chi _f^t$ of the nonlinear parameter (defined below). They involve resolutions of
 $N=240$ or
 $N=360$ grid points in each direction and a time step
 $\Delta t$ that has usually to be reduced as the simulation proceeds.
All the simulations are driven by an additive random forcing, white-noise in time in such a way that the energy injection rate  $\epsilon _E^{\pm }$ of each type of counter-propagating wave is prescribed. This is done by forcing terms in the equations for
 ${\widehat {D\mu ^{\pm }}}$, in the form of
 \begin{equation} f_{\boldsymbol{k}}^{\pm} = \frac{1}{\sqrt{\Delta t}} A^{\pm} \exp \left[{-\frac{(k_{\|}-k_{0\|})^2 }{\sigma_{0\|}^2}} \right] \exp \left[ {-\frac{(k_{\perp}-k_{0\perp}^2)}{\sigma_{0\perp}^2}} \right], \end{equation}
truncated so that only wavenumbers  $k_{\perp }$ and
 $k_{\|}$ such that
 $|k_{\|,\perp }-k_{0\|,\perp }| \le 3 \sigma _{0\|,\perp }$ are driven (in practise, only three Fourier modes are forced in each direction) and multiplied by a factor
 $a + \textrm {i}b$, where
 $a$ and
 $b$ are Gaussian real random variables of zero mean value and variance unity, drawn independently for each of the fields at each time step. In (2.15) for
 $G^{\pm }$ that are integrated numerically in the following sections, this corresponds to driving terms of the form
 \begin{equation} {\frac{1}{2} \left[\frac{L_e}{s} \mp \delta M_2 \varLambda^{-1} \right] D_e^{-1}f^+ -\frac{1}{2} \left[\frac{L_e}{s} \pm \delta M_2 \varLambda^{-1}\right] D_e^{-1}f^-}. \end{equation}
In addition, dissipation terms  $\nu (-\varDelta )^4 G^{\pm }$ are included.
When not otherwise specified, we choose  $k_{0\|} = k_{0_{\perp }} = k_f$ and
 $\sigma _{0\|} = \sigma _{0\perp } = \sigma _f$. Due to the ordering underlying the derivation of the gyrofluid model (where longitudinal gradient balances transverse nonlinearity), this choice corresponds to a quasi-transverse driving in the primitive physical variables. The energy injection rate,
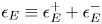 $\epsilon _E\equiv \epsilon _E^+ + \epsilon _E^-$, is chosen to be equal to
 $0.372$ for most of the runs, while the GCH injection rate
 $\epsilon _C\approx (\epsilon _E^+ - \epsilon _E^-)/v_{\textrm {ph}}(k_f)$ varies with
 $k_f$ and
 $\beta _e$. Since the goal of the simulations was to study the large-scale dynamics and because of constraints on computational resources, we had to introduce hyperviscosity coefficients
 $\nu$ that often do not permit the development of a small-scale inertial range. As a consequence there is no real scale separation between injections and dissipation.
4. Global properties of the GCH inverse cascade
In the small-scale limit, the model reduces to ERMHD. When  $\beta _e \to \infty$, this latter model can be derived in the strong anisotropic limit from EMHD (see e.g. Galtier & Meyrand Reference Galtier and Meyrand2015) for which direct numerical simulations in the case of imbalanced driving display an inverse cascade of magnetic helicity (Kim & Cho Reference Kim and Cho2015). Therefore, it is of interest to study the dynamics when the driving takes place at scales comparable to or moderately smaller than the sonic Larmor radius (taken as the length unit), for finite values of
 $\beta _e$.
It is first useful to define the various spectra and fluxes that will be used to illustrate the cascade properties. We denote by  $E(k_{\perp })$ and
 $E_C(k_{\perp })$ (hereafter, transverse spectra) the spectral density in the transverse plane of the energy and GCH, respectively. Similar quantities
 $E(k_{\|})$ and
 $E_C(k_{\|})$ are defined for the parallel spectra.Footnote 4 Integration of these spectra with respect to the transverse (
 $k_{\perp }$) or parallel (
 $k_{\|}$) wavenumbers reproduces the corresponding ideal quadratic invariants. It is also of interest to consider the Elsasser energy and GCH transverse spectra
 $E^{\pm }(k_{\perp })$ and
 $E_C^{\pm }(k_{\perp })$ related to the energy and GCH by the relations
 $E(k_{\perp }) = (E^+(k_{\perp }) + E^-(k_{\perp }))/2$ and
 $E_C(k_{\perp }) = (E_C^+(k_{\perp }) - E^-_C(k_{\perp }))/2$ with
 $E^{\pm }_C(k_{\perp }) = E^{\pm }(k_{\perp })/v_{\textrm {ph}}(k_{\perp })$. Here,
 $E^{\pm }(k_{\perp })$ can be viewed as the spectrum of the field
 $D_e \mu ^{\pm }$ and
 $E_C^{\pm }(k_{\perp })$ of the field
 $V_{\textrm {ph}}^{-1/2}D_e \mu ^{\pm }$. Furthermore, the perpendicular and parallel fluxes of the energy and GCH are respectively defined as the negative nonlinear contributions to
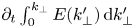 $\partial _t \int _0^{k_{\perp }} E(k'_{\perp }) \,\textrm {d}k'_{\perp }$ or
 $\partial _t \int _0^{k_{\perp }} E_C(k'_{\perp }) \,\textrm {d}k'_{\perp }$ (for the perpendicular fluxes) or to
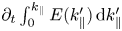 $\partial _t \int _0^{k_{\|}} E(k'_{\|}) \,\textrm {d}k'_{\|}$ or
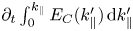 $\partial _t \int _0^{k_{\|}} E_C(k'_{\|}) \,\textrm {d}k'_{\|}$ (for the parallel fluxes). They are explicitly calculated using (B 1a,b) together with (B 21) and (B 22) of appendix B.
After presenting our fiducial run, which will serve to illustrate the existence and main properties of the GCH inverse cascade, we address the effect of a variation of the energy injection rate  $\epsilon _E$, and thus of the turbulence strength.
4.1. Spectra and fluxes
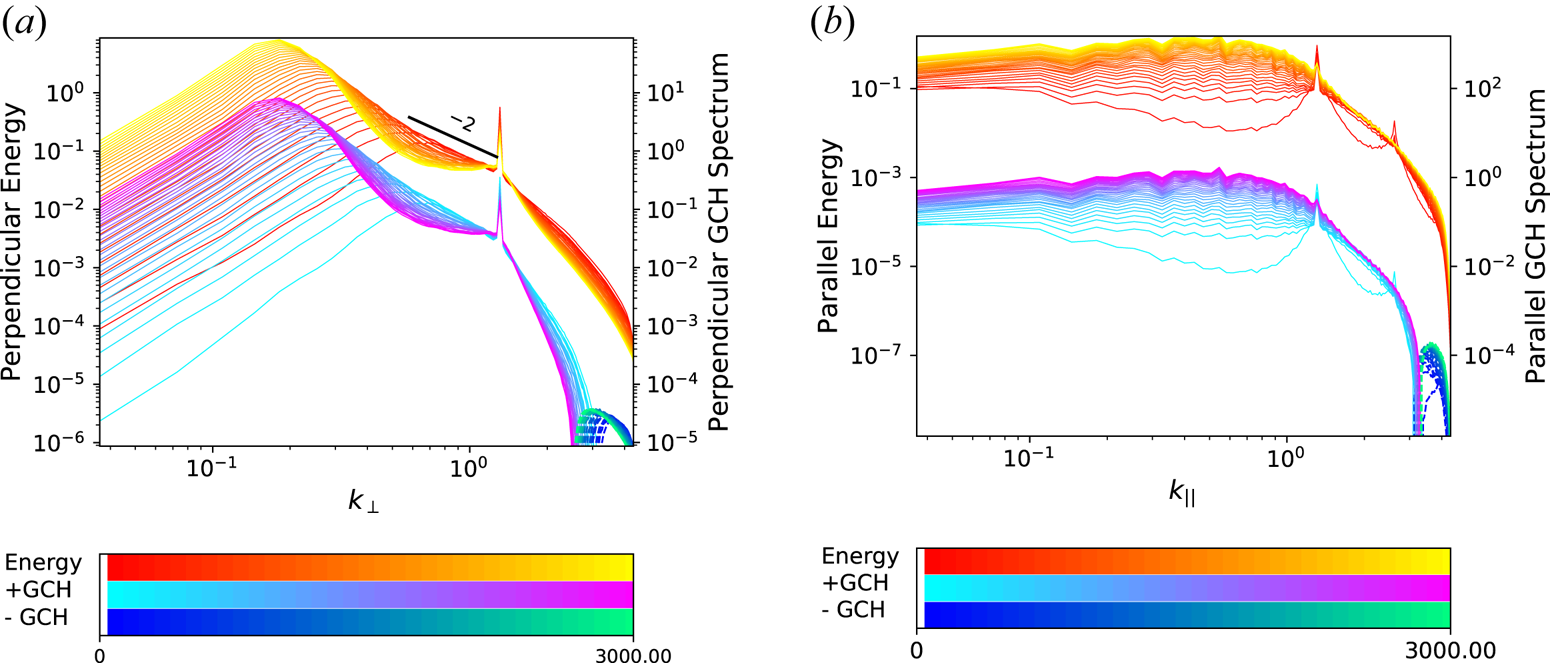
When choosing  $\beta _e=2$ and
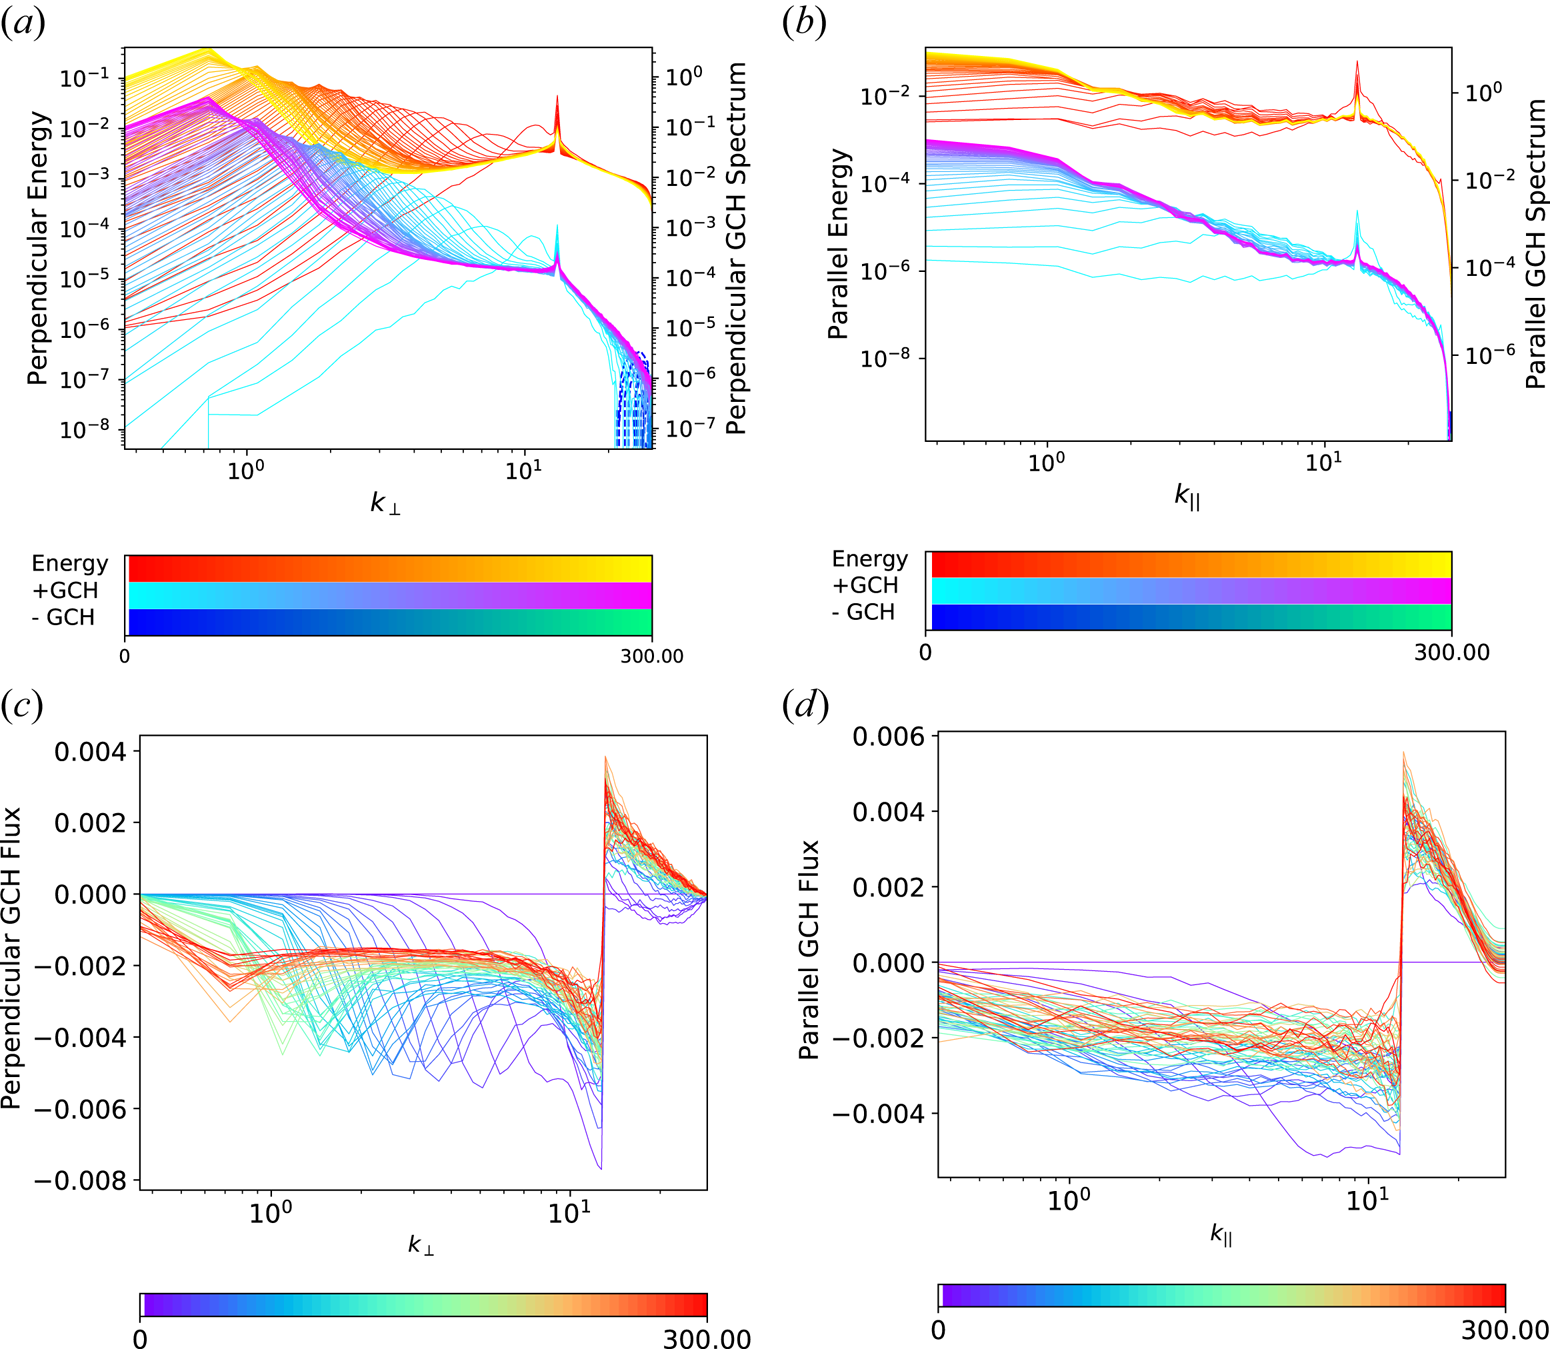
 $k_f = 13$, an inverse cascade of GCH quickly develops, giving rise to a spectral bump propagating towards large transverse scales. This is illustrated in figure 2(a). In this case, the inverse cascade extends over more than one decade before reaching the weakly dispersive scales. The observed dynamics is qualitatively similar to that obtained in numerical simulations of EMHD (Kim & Cho Reference Kim and Cho2015) and also of incompressible MHD in the absence of an ambient field (Müller et al. Reference Müller, Malapaka and Busse2012; Linkmann & Dallas Reference Linkmann and Dallas2017). At the final time of the simulation, the energy has almost reached the lowest modes and a separate simulation is needed to address the situation where the cascade crosses
 $k_{\perp }=1$ and penetrates into the weakly dispersive range. It is discussed in § 6 with run
 $R_{1.3}^2$.
Perpendicular (a,c) and parallel (b,d) energy and GCH spectra (a,b) and GCH fluxes (c,d) for run  $R_{13}^2$. The integration time that extends up to
 $t=300$ (in
 $\varOmega _i^{-1}$ units) is indicated in the the colour bars, where
 $+$GCH refers to positive values and
 $-$GCH to the modulus of negative values (dashed lines visible at the smallest scales) of the GCH spectra. For clarity, the axes of the energy and GCH spectra have been shifted. The same convention is adopted for subsequent graphs.

The perpendicular GCH flux displayed in figure 2(c) shows at late times a remarkably constant range, associated with an inverse cascade, in the spectral region between the peak and the forcing. Interestingly, a self-similar inverse cascade develops in the parallel direction as well, as shown in figure 2(b), also associated with a negative and constant GCH flux (figure 2d). The existence of this parallel inverse cascade has important consequences on the types of structures that form in physical space, as discussed in § 8. When considering energy fluxes (not shown), we note that the perpendicular one is significant at wavenumbers larger than  $k_f$ but very small for
 $k_{\perp } < k_f$. Energy is transferred to large scales together with the cross-helicity, but only the latter undergoes a true inverse cascade. In the parallel direction, the energy flux, although not displaying a constant range, is decaying more slowly as
 $k_{\perp }$ decreases away from
 $k_f$.
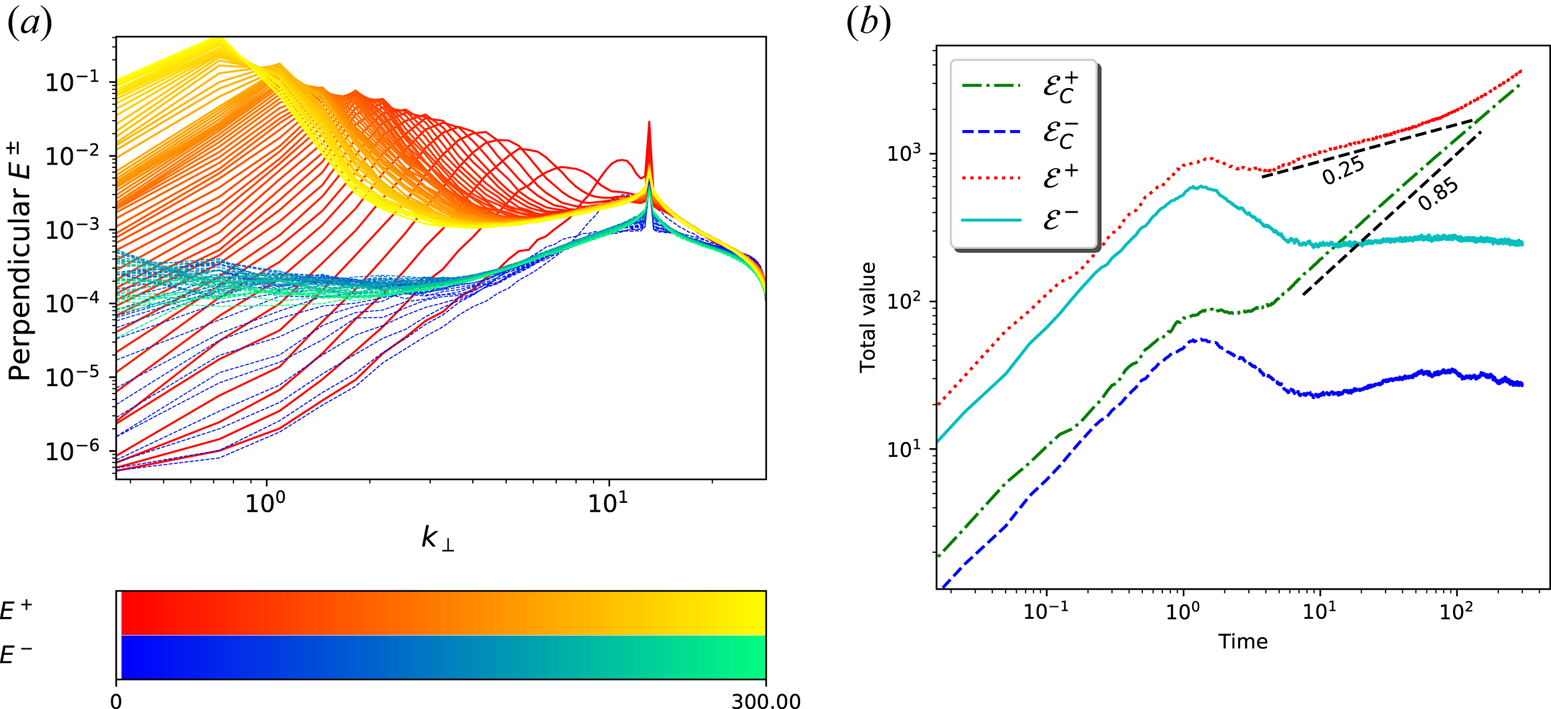
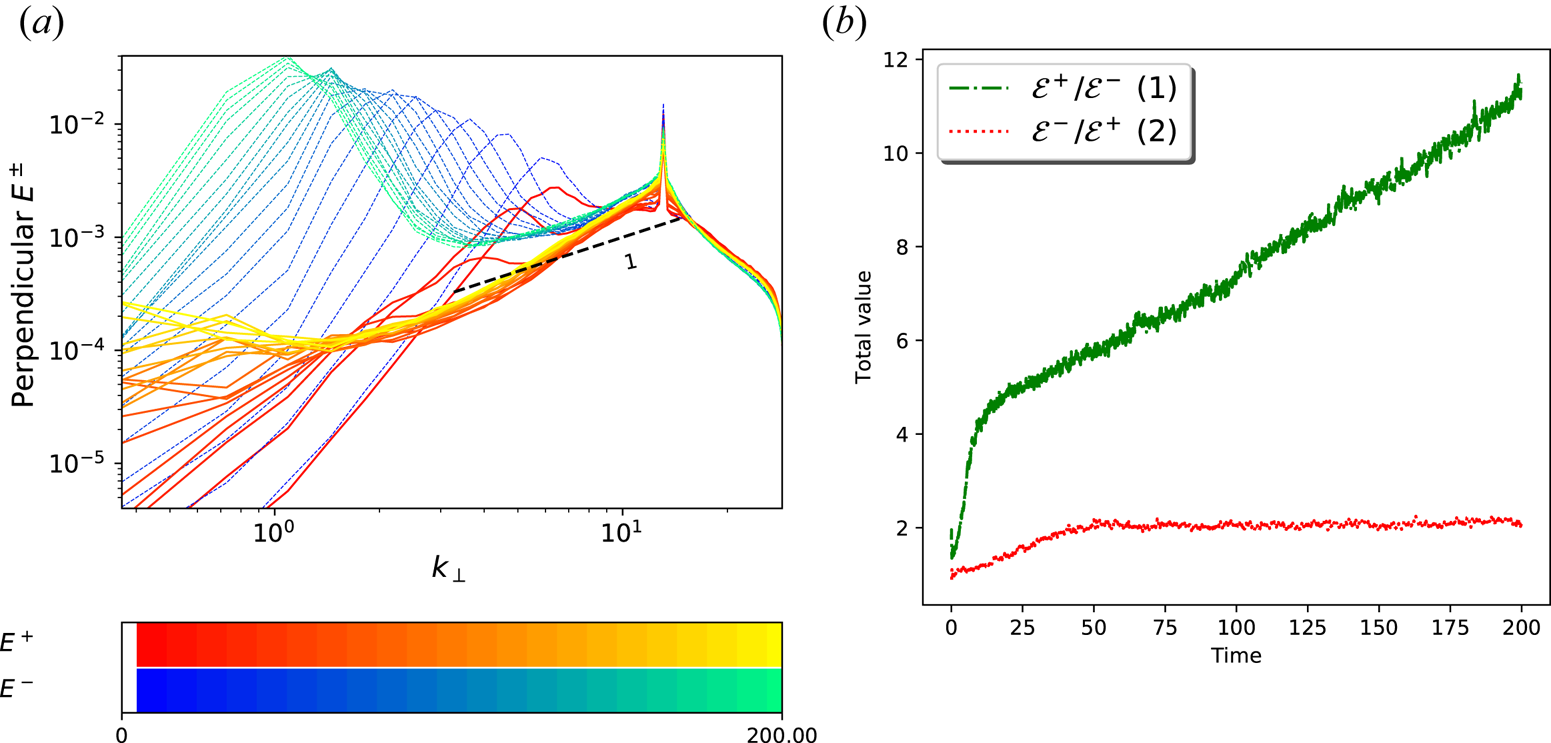
In figure 3, we show the Elsasser spectra  $E^{\pm }(k_{\perp })$ (figure 3a) and the time evolution of the total Elsasser energies
 ${\mathcal {E}^{\pm } =\sum _{k_{\perp }} E^{\pm }}(k_{\perp })$ and of the positive/negative GCHs
 ${\mathcal {E}}_C^{\pm } =\sum _{k_{\perp }} E_C^{\pm }(k_{\perp })$ (figure 3b). The inverse GCH cascade is only associated with an inverse transfer of
 $E^+$. This behaviour is specific to cases where the ratio
 $\epsilon ^+/\epsilon ^-$ is small or moderate, as also seen in EMHD simulations by Kim & Cho (Reference Kim and Cho2015). In this run, a non-negligible transfer of
 $E^-$ is nevertheless visible, which might develop into a different type of inverse cascade involving longer spatial and temporal scales. Simulations with a spectral range extending to much larger scales and spanning a longer time interval would be necessary to characterize this effect more precisely. Both
 $\mathcal {E}^+$ and
 $\mathcal {E}_C^+$ grow at long time as power laws with exponents similar but not identical to those reported in Kim & Cho (Reference Kim and Cho2015) in the case of EMHD. Furthermore, we verified that, while keeping the parameters of run
 $R_{13}^{2}$, but injecting only one type of wave (infinitely imbalanced driving), the other type of wave is generated by interactions of driven modes. While the energy of the dominant mode is transferred to the large scales through the propagation of a spectral bump whose envelope obeys a
 $k_{\perp }^{-3/2}$ scaling law, the subdominant wave undergoes a self-similar cascade with a
 $k_{\perp }^{-1}$ spectrum (not shown), indicating a behaviour of both spectra similar to that observed in EMHD simulations with maximal helicity injection (Kim & Cho Reference Kim and Cho2015).
Perpendicular Elsasser spectra (a) and time evolution of the total Elsasser energies  ${\mathcal {E}}^{\pm }$ and GCHs
 ${\mathcal {E}}_C^{\pm }$ (b) for run
 $R_{13}^2$.

4.2. Shell-to-shell transfers
In the following, we analyse the shell-to-shell transfers, i.e. the amount of energy and GCH transferred per unit time from one spectral shell in the transverse plane to another, after integration on the parallel wavenumbers. The transfer between parallel wavenumbers after integration on the transverse wavenumbers is also considered. These quantities provide useful information concerning the degree of (spectral) locality of the nonlinear interactions. Their expressions are derived in appendix B and explicitly given in (B 21) and (B 22). It is to be noted that in this context  $R_{13}^2$ is generic and the statements about the non-local nature of transfers apply to the other simulations. However, as shown in the following subsection, other features may differ.
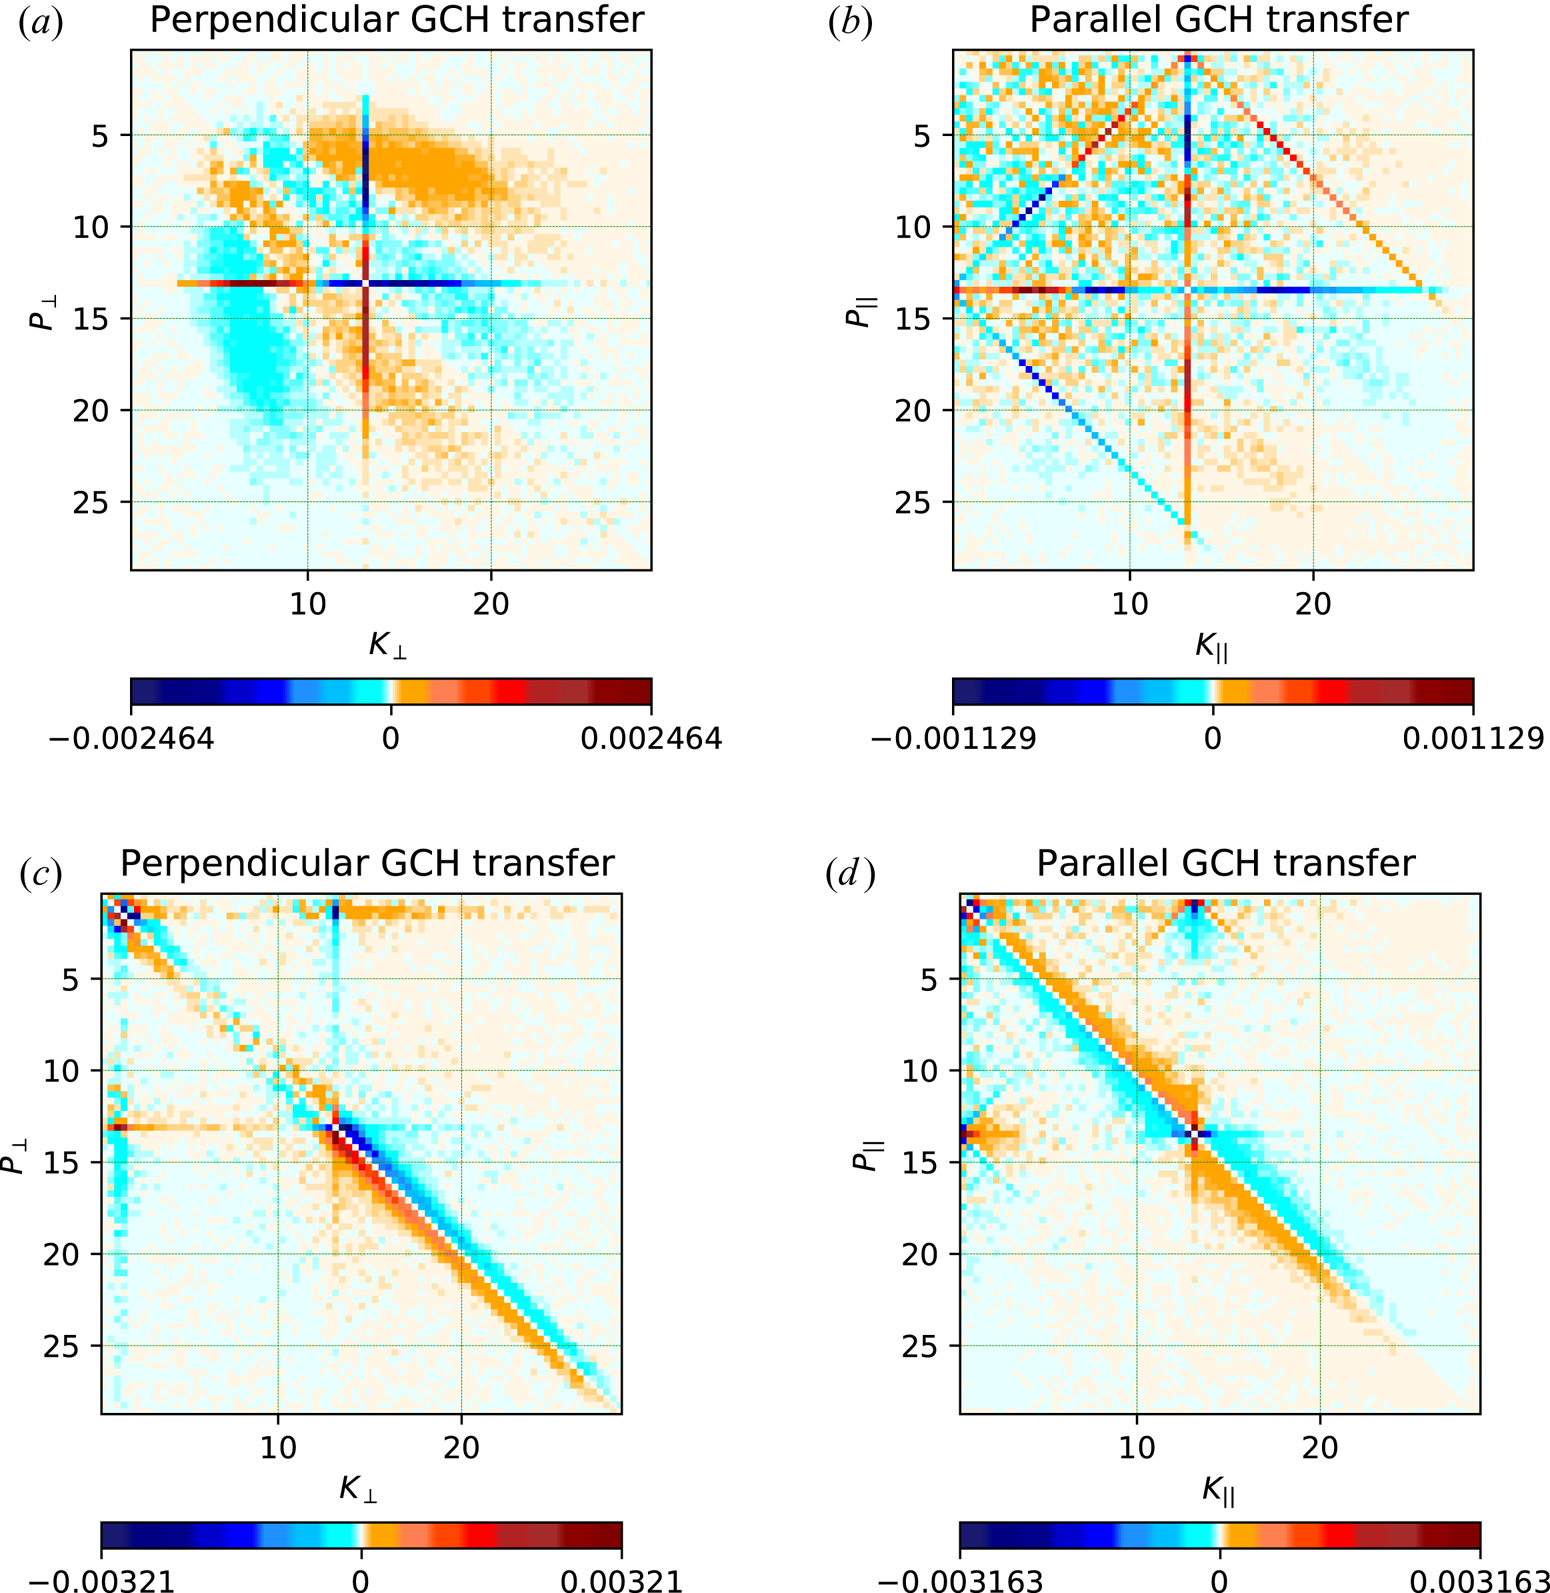
Figure 4 shows the GCH shell-to-shell transfers both in the transverse plane (figure 4a,c) and in the longitudinal direction (figure 4b,d), at an early time ( $t=5$; figure 4a,b) and at a time close to the end of the simulation (
 $t=100$; figure 4c,d). Transfers in the perpendicular directions are computed from (B 21) and (B 22) of appendix B. Similar expressions are used for the longitudinal transfers, where cylindrical shells are replaced by slabs.
Perpendicular (a,c) and parallel (b,d) transfers of GCH for run  $R_{13}^2$ at (a,b) an early (
 $t=5$) or (c,d) a late (
 $t=100$) time of the simulation.

At early time, inverse transfers of GCH appear to be strongly non-local, i.e. off-diagonal, which indicates transfer between non-neighbouring shells. We observe the characteristic cross-signature which demonstrates the interactions of the forcing with other shells. The modes located on the upper vertical and left horizontal axes that intersect at the forcing wavenumber are associated with an inverse transfer close to the forcing. On the contrary, the non-local transfers between the forcing and the wavenumbers that are much larger are consistently associated with direct transfers.
The inverse GCH cascade is mainly driven by the non-local interactions between the forcing and the propagating bump, which can be seen as the orange (respectively cyan) areas located in the regions where  $k_{\perp }$ (respectively
 $p_{\perp }$) is slightly smaller and larger than
 $k_f$ with
 $p_{\perp }$ (respectively
 $k_{\perp }$) between
 $5$ and
 $10$.
In the parallel direction, there is no significant inverse transfer but interacting triads involving the forcing and its first harmonic are clearly visible (see also the parallel spectrum at the first output in figure 2b). The oblique lines ( $k_{\|} + p_{\|} = k_f$ and circular permutations) and those parallel to the axes (
 $k_{\|} = k_f$ or
 $p_{\|}=k_f$) correspond to the interactions between triads including the driving mode. No other interaction is significant at this early time.
The transfers at late times display more local features, in both the parallel and perpendicular directions. The perpendicular inverse transfer of GCH still involves non-local interactions between the spectral bump and the forcing, while energy (not shown) has predominantly local features. It is noteworthy to mention that early bump propagation is always dominated by the non-local cross-type interaction between the forcing and the bump. The parallel GCH transfer associated with the direct cascade towards scales smaller than the forcing is local, while the inverse parallel cascade involves both strongly local and non-local features.
5. Influence of the turbulence strength on the early-time dynamics
Since the dynamics involves both waves and the nonlinear dynamics of the purely perpendicular component, it is natural to investigate the impact of changing the amplitude of the perpendicular magnetic fluctuations. This is easily done by changing the injection rate  $\epsilon _E$.
5.1. Varying the amplitude of the fluctuations
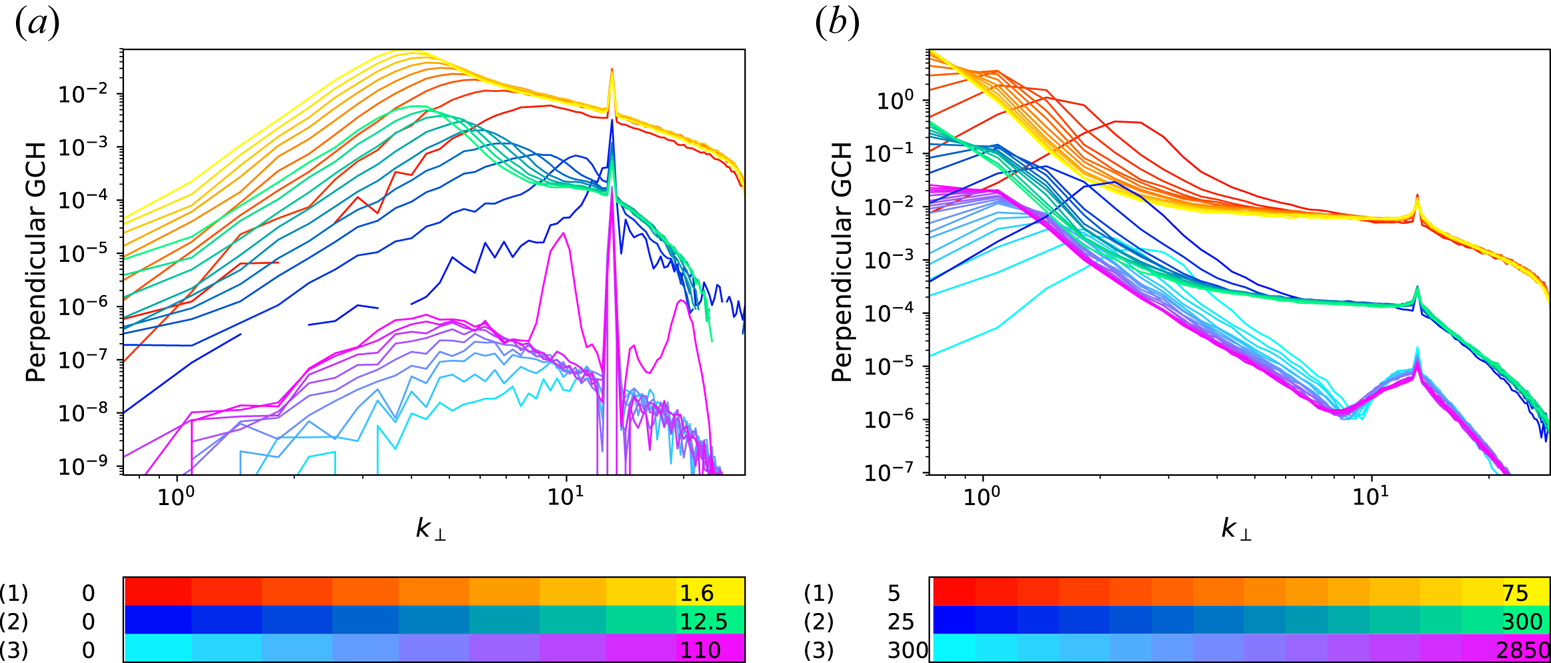
When varying the energy injection rate, the nature of the turbulent cascade that develops at relatively early time changes significantly (see figure 5a). At large amplitude, a self-similar cascade starts developing (as clearly seen in run  $R_{13s}^2$) but the spectrum rapidly distorts. When the driving is decreased (run
 $R_{13}^2$), the dynamics is that of a propagating spectral bump, as described in the previous section. Further decreasing the injection rate, the early dynamics is dominated by the development of a parametric decay instability of the pump waves driven by the random forcing (conspicuous in figure 5(a) where two bumps emerge at time
 $t\approx 110$). Indeed, in contrast with Alfvén waves in ideal MHD, three KAWs can interact resonantly, producing a decay instability (Voitenko Reference Voitenko1998a) (see appendix A for a brief description of this linear instability in the context of the two-field model, in the absence of injection and dissipation). This instability competes with the turbulence dynamics (see Shi et al. (Reference Shi, Li, Xiao and Wang2017) and Fu et al. (Reference Fu, Li, Guo, Li and Roytershteyn2018) for a study in the MHD context). Even though the growth rate becomes larger when the level of the magnetic fluctuations is increased, the transfer to neighbouring modes due to turbulence is more efficient, thus hiding or preventing the instability. When
 $\epsilon _E$ is small enough, as is the case for run
 $R_{13w}^2$, the growth rate is smaller, but the turbulence is also less efficient, making possible the appearance of the decay. A more detailed study of the resonance conditions is discussed in the next subsection.
Snapshots at short (a) and long (b) times of the GCH spectra for runs  $R_{13s}^2$ (1),
 $R_{13}^2$ (2) and
 $R_{13w}^2$ (3) corresponding to strong, intermediate and weak injection rates, respectively. Final times displayed in (a) are
 $t=1.6$ (1),
 $t=12.5$ (2),
 $t=110$ (3), and in (b) are
 $t=15$ (1),
 $t=300$ (2),
 $t=2850$ (3).

Decreasing  $\epsilon _E$ only affects the early-time dynamics. Indeed, as seen in figure 5(b), the late evolution of the two runs with strong and intermediate driving displays similar features associated with a strongly bent spectrum with a bump at large scale, separated from the forcing by a spectral domain where the dynamics tends to settle to an absolute equilibrium.Footnote 5 The case of a weak driving has the same tendency but the evolution is much slower. Similar simulations that display decay at early time but with a larger value of
 $\chi _f$ show in a more conspicuous way an evolution towards a flat spectrum in the range between the driving and the maximum of the spectrum.
Even if the inverse cascades displayed by the simulations previously discussed may suggest the existence of qualitatively different kinds of cascades, a more likely scenario is that there is a continuous transition between a self-similar cascade and a spectral bump propagating to large scales. Inspection of the time evolution of individual energy and GCH transverse Fourier modes indicates that when the inverse cascade reaches a given wavenumber, the corresponding modes first grow and then decrease with a characteristic decay time that becomes shorter when wave effects are enhanced. The relative effect of the strength of the turbulence compared to that of the waves, measured by the nonlinearity parameter at the driving scale  $\chi _f$, is then likely to characterize the cascade properties.
The nonlinear parameter  $\chi ({\boldsymbol {k}})$ at the wavenumber
 ${\boldsymbol {k}}$ can be estimated as follows. From (2.2) with
 $\delta =0$, we estimate the nonlinear time
 $\tau _{\textrm {NL}}(k_{\perp })$ (defining
 ${\hat {M}}_3 = 1 -{\hat {M}}_1 + {\hat {M}}_2$) by
 \begin{equation} \tau_{\textrm{NL}}({\boldsymbol{k}})^{-1} = k_{\perp}^2 {\hat{M}}_3 |\varphi({\boldsymbol{k}})|. \end{equation}
The nonlinear parameter  $\chi ({\boldsymbol {k}}) = \tau _{\textrm {NL}}({\boldsymbol {k}})^{-1} / (v_{\textrm {ph}} k_{\|})$ reads (using (2.9))
 \begin{equation} \chi({\boldsymbol{k}}) = \frac{1}{s} k_{\perp} {\hat{M}}_2^{1/2} {\hat{M}}_3^{1/2} \frac{1}{k_{\|}}|\varphi({\boldsymbol{k}})|. \end{equation}
At least when the nonlinearities are not too strong, one can expect equipartition of the magnetic and potential energy spectra (see e.g. Slepyan (Reference Slepyan2015) and references therein), a property which is observed to hold with good accuracy in most of the simulations considered in this paper (in particular, the ratio of the two spectra at  $k_f$ is typically
 $1\pm 0.03$, the error reaching
 $4\,\%$ at large
 $\beta _e$). This leads to a phenomenological estimate that near the injection scale
 \begin{equation} |\varphi({\boldsymbol{k}})| \approx s {\hat{M}}_2^{-1/2} {\hat{M}}_3^{-1/2} |{\boldsymbol{B}}_{\perp}({\boldsymbol{k}})|, \end{equation}
which allows one to relate the nonlinear parameter  $\chi _f$ at the injection wavevector
 ${\boldsymbol {k}}_f$ (whose perpendicular and parallel components are denoted
 $k_{\perp f}$ and
 $k_{\| \,f}$) to the magnitude of magnetic fluctuations
 $B_{\perp } (k_{\perp f})= \sqrt {k_{\perp } E_{B_{\perp }}(k_{\perp f})}$ (where
 $E_{B_{\perp }} (k_{\perp f})$ holds for the one-dimensional transverse magnetic spectrum) by
 \begin{equation} \chi_f = \frac{k_{\perp f}}{k_{\| \,f}} |B_{\perp}(k_{\perp f})|. \end{equation}
In order to have a qualitative relation between the level of magnetic field fluctuation  $|B_{\perp }(k_{\perp f})|$ at the driving wavenumber and
 $\epsilon _E$, it is nevertheless possible to use a simple strong turbulence phenomenology and write, still assuming energy equipartition,
 \begin{equation} \epsilon_E\approx\frac{2}{\beta_e}|B_{\perp}({k_{\perp f}})|^2 \tau_{\textrm{NL}}(k_{\perp f})^{-1}\approx\frac{2}{\beta_e}|B_{\perp}({k_{\perp f}})|^3 k_{\perp f} v_{\textrm{ph}}(k_{\perp f}). \end{equation}
This prompts the definition of the nonlinearity parameter based on turbulent phenomenology by, up to a numerical constant,
 \begin{equation} \chi_f^t= \frac{k_{\perp f}}{k_{\| \,f}}\left ( \frac {\beta_e}{2} \frac{\epsilon_E}{k_{\perp f}v_{\textrm{ph}}(k_{\perp f})} \right )^{1/3}. \end{equation}
Assuming that  $\tau$ is of order unity, we find, using table 1 in Passot & Sulem (Reference Passot and Sulem2019), that at large scales
 $v_{\textrm {ph}}\sim s$, and at small scales
 $v_{\textrm {ph}}\sim s k_{\perp }$ when
 $\beta _e\lesssim 1$ and
 $v_{\textrm {ph}}\sim s^2 k_{\perp }$ when
 $\beta _e$ is large. For a driving acting at sub-ion scales,
 $\chi _f^t\sim \epsilon _E^{1/3}k_{\perp f}^{1/3}k_{\| \,f}^{-1}\beta _e^{1/2}$ for small or moderate
 $\beta _e$ and
 $\chi _f^t\sim \epsilon _E^{1/3}k_{\perp f}^{1/3}k_{\| \,f}^{-1}\beta _e^{2/3}$ for large
 $\beta _e$.
The expression of the  $\chi _f$ parameter suggests that the dynamics will be sensitive to the angle of the injected KAWs with respect to the ambient magnetic field. Indeed, in simulations for which
 $k_{\| \,f}\ll k_{\perp f}$, which makes
 $\chi _f$ very large, the dynamics is quasi-two-dimensional. The waves have very long time scales and the inverse cascade is more self-similar. Moreover, in these conditions, the dynamics is influenced by the quasi-conservation of the squared magnetic potential, which is observed to undergo a self-similar inverse cascade (not shown).
Note that for small  $\beta _e$, where
 $v_{\textrm {ph}} \sqrt {{\beta _e}/{2}}$ has a finite limit, the parameter
 $\chi _f^s$ becomes independent of
 $\beta _e$ when velocities are measured in units of Alfvén speed instead of sound speed and the length unit is kept unchanged. Indeed, in this limit, after a proper rescaling of the dependent and independent variables, the equations become independent of
 $\beta _e$ and reproduce the model of Zocco & Schekochihin (Reference Zocco and Schekochihin2011), taken in the isothermal limit. Interestingly, the small-
 $\beta _e$ limit is already accurately approached when
 $\beta _e=0.2$. In contrast, at large
 $\beta _e$, the parameter
 $\chi _f^t$ increases with
 $\beta _e$, even when using the Alfvén velocity unit.
The values of  $\chi _f^t$ for the different runs considered in this paper are given in table 1, together with
 $|B_{\perp }(k_{\perp f})|$, which is measured immediately after the transient phase, at the beginning of the simulation. Note that, for some runs,
 $|B_{\perp }(k_{\perp f})|$ varies significantly during the time evolution. The ratio
 $\chi _f/\chi _f^t$ has a mean value of
 $1.78$ with a standard deviation of
 $0.43$. Both quantities vary in the same way from one run to another at moderate values of
 $\beta _e$, but not necessarily at larger values. Although relatively large, such uncertainty nevertheless permits using
 $\chi _f^t$ as a crude prediction of the nonlinear parameter
 $\chi _f$ which can be only measured a posteriori. It is natural to attempt to isolate the parameter
 $\chi _f$ to see if it solely controls the onset of self-similar bump transitions, etc. However, since it is not possible to precisely assign
 $\chi _f$ when initializing the simulations, we would have to initiate multiple runs to be able to select the appropriate desired values. Such ensemble would drain computational resources. Nevertheless, this conjecture that
 $\chi _f$ is the governing parameter appears to be consistent with the various simulations presented in this section.
5.2. Analysis of a decay event
Another example of the decay instability is encountered when, taking the same injection rate and  $\beta _e$ as for run
 $R_{13}^2$, the driving wavenumber
 $k_{\perp f}$ is increased to
 $36$. Figure 6(a) clearly shows that, after the development of self-similar spectra (with exponents
 $-2$ for energy and
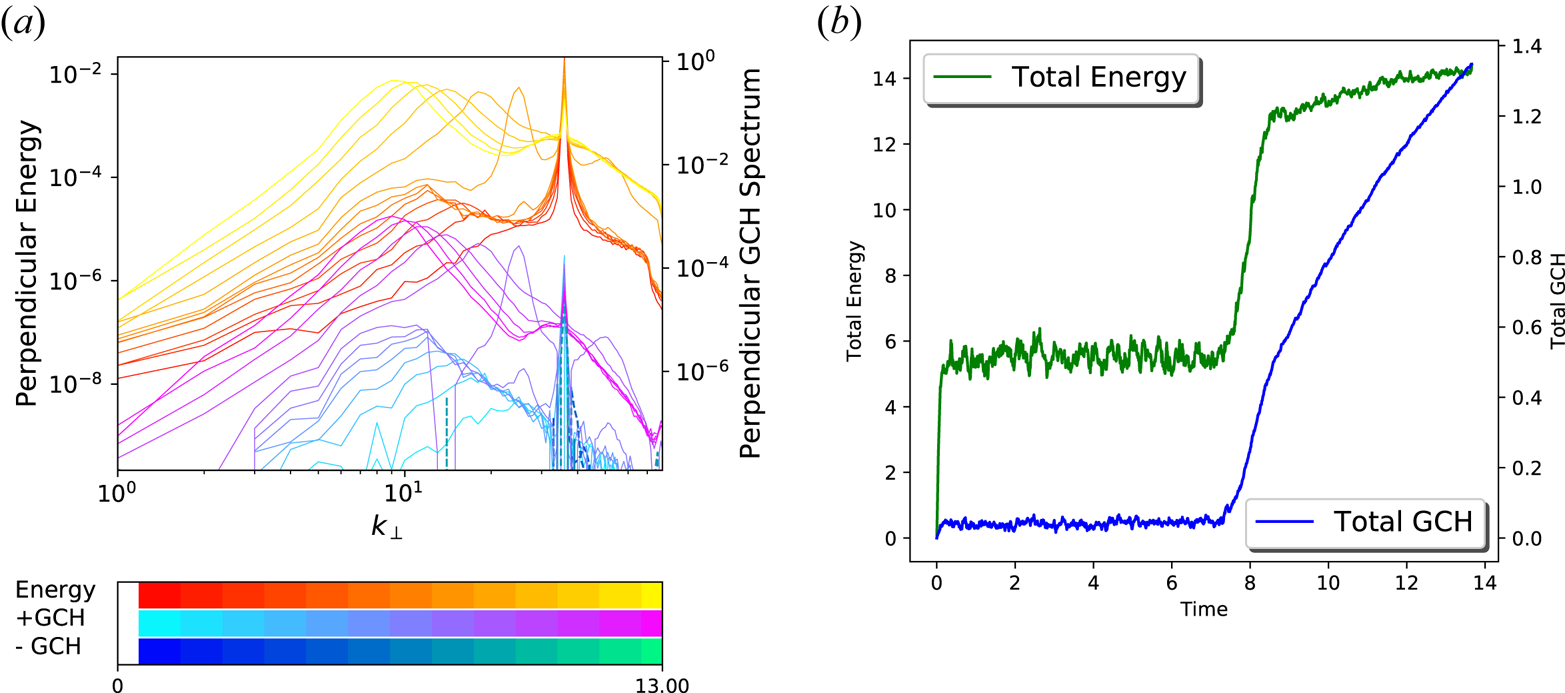
 $-3$ for GCH, together with a very weak negative GCH flux), a transient regime develops, corresponding to the onset of unstable modes, an effect that does not persist after turbulence has become sufficiently developed. This suggests that, if the decay instability can be a leading mechanism in the regime of weak turbulence (Voitenko Reference Voitenko1998b), its effect cannot be more than a transient in the strong turbulence regime. When present, the decay instability nevertheless significantly affects the global dynamics. As seen in figure 6(b), a sharp increase of the total energy and GCH takes place when the decay instability is acting. The instability can be identified at a time close to
 $t=7$. Later on, energy and GCH are still growing, but at lower rates, consistent with the existence of an inverse cascade. As expected, increasing
 $\beta _e$ for example to
 $\beta _e=50$ (not shown), the other parameters being fixed,
 $\chi _f$ increases to 1.1 and the decay instability is suppressed. It is also interesting to note that the cascade that develops at early time in this case is self-similar.
Transverse energy and GCH spectra (a) and time variation of the total energy and GCH (b) for run  $R_{36}^{2}$.

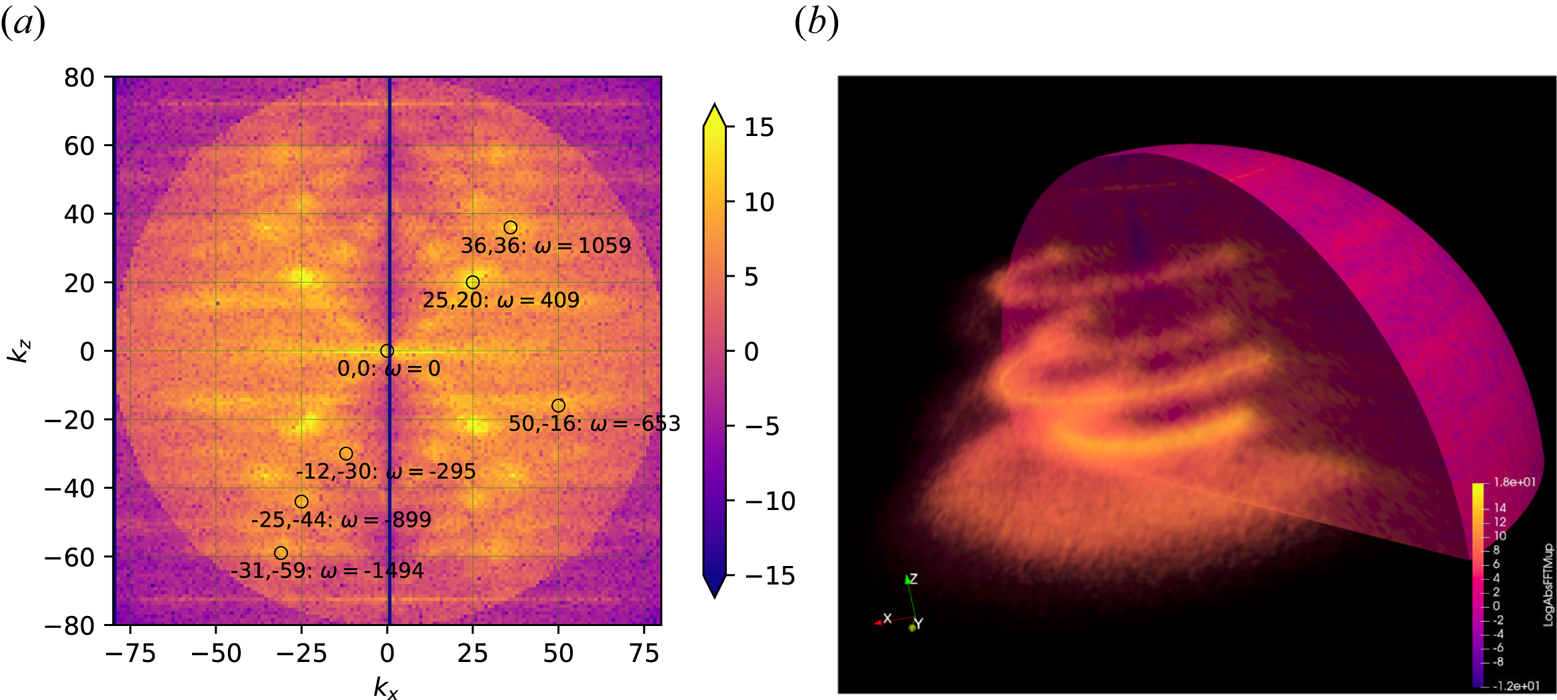
In order to highlight the presence of resonant interactions in run  $R_{36}^{2}$, we display in figure 7(a) the colour-scale plot of the two-dimensional spectrum
 $|{\hat {\mu }}^+({\boldsymbol {k}})|^2$ in the plane
 $(k_x, k_z)$, showing decay instability at work (at
 $t \approx 8$). Since the forcing is statistically isotropic in the
 $(k_x, k_y)$ plane, this plot is sufficient to demonstrate the features of the full
 $k_x$,
 $k_y$ and
 $k_z$ dependence. We see numerous peaks, some of them associated with resonant triads. In fact, due to axisymmetry, each peak is essentially a circle penetrating the plane (see figure 7b). This is important when evaluating the resonance condition since it provides more freedom in choosing the corresponding
 $k_x$ and
 $k_y$ wavevector components. Of particular interest are triads with coordinates in the
 $(k_x,k_z)$ plane given by
 $(50,-16)$,
 $(25,20)$ and
 $(36,36)$ (which corresponds to the forcing). We indeed see that, for this triad, both
 $k_{1z} + k_{2z} = k_{fz}$ and
 $\omega _1 + \omega _2 = \omega _f$. In this context, what appears as
 $k_x$ should be viewed as
 $k_{\perp }$. Resonance conditions in the transverse plane then consist of five equations (three norms of transverse wavevectors and two resonance conditions) for six unknowns. Choosing arbitrarily one of them, we can easily construct a resonant triad. There is thus an infinite number of such resonant triads which can be viewed as defining a resonant manifold.
Colour-scale plot of  $\ln |{\hat {\mu }}^+|^2$ for run
 $R_{36}^2$ showing decay instability. (a) Cross-section in a
 $(k_x, k_z)$ plane. Because the forcing is statistically isotropic in the
 $(k_x, k_y)$ plane, this plot is sufficient to characterize the full
 $(k_x, k_y, k_z)$ space (see text). Among the visible peaks, some of them, such as
 $(50,-16)$,
 $(25,20)$ and
 $(36,36)$ (which corresponds to the forcing), are associated with resonant triads. (b) Three-dimensional view. The dominant peaks visible as dots in the
 $(k_x, k_y)$ plane appear as circles symmetric around the
 $k_z$ axis. Some circles are not visible since a transparency mask was applied to clearly visualize the most intense peaks.

5.3. Instability of the balanced state
The case where the  $\mu ^+$ and
 $\mu ^-$ waves are driven in a balanced way, i.e. with a zero GCH injection rate, is illustrated with run
 $R_{13b}^2$, for which
 $\chi _f=0.26$, in figure 8. Figure 8(a) shows the energy spectra
 $E^{\pm }$ of the two counter-propagating waves. We observe that the balanced regime is unstable. The spectra of the counter-propagating waves, which identify at early times, separate and their difference increases with time. While positive GCH is transferred towards small scales and dissipated, negative GCH is transferred towards large scales, creating a finite global imbalance. As seen in figure 8(b), after some time, the global imbalance of run
 $R_{13b}^2$, as measured by the ratio
 ${\mathcal {E}}^+/{\mathcal {E}}^-$ of the energy of the counter-propagating waves, saturates to a value close to
 $0.5$, in contrast with the simulation with imbalanced driving for which this ratio keeps increasing with time. Interestingly, when the energy injection rate
 $\epsilon _E$ is increased by a factor of 256 (run
 $R_{13sb}^2$), leading to
 $\chi _f= 1.68$, balanced turbulence becomes stable. Another example where the balanced regime is unstable is provided by
 $R_{36b}^2$ for which
 $\chi _f= 0.16$. In this case, we first observe a decay instability before the amplitudes of the counter-propagating waves separate (not shown).
(a) The  $E^{\pm }(k_{\perp })$ spectra for run
 $R_{13b}^2$ resulting from a balanced driving. (b) Time evolution of
 ${\mathcal {E}}^-/{\mathcal {E}}^+$ for run
 $R_{13b}^2$ (red line) and of
 ${\mathcal {E}}^+/{\mathcal {E}}^-$ for run
 $R_{13}^2$ (green line). The balanced state is unstable and evolves to a regime where
 ${\mathcal {E}}^-/{\mathcal {E}}^+ \simeq 2$.

When for the same  $\beta _e$, and the same energy injection rate, the wavenumber
 $k_f$ is reduced to
 $1.3$ (run
 $R_{1.3b}^2$), thus increasing the value of
 $\chi _f$ to
 $0.85$, the instability is suppressed. It is recovered when reducing
 $\beta _e$ to
 $0.2$ (run
 $R_{1.3b}^{0.2}$), which has the effect of reducing
 $\chi _f$ to
 $0.38$. When, keeping
 $\beta _e=0.2$ and
 $k_f=1.3$, the energy injection rate is increased by a factor of
 $16$ (run
 $R_{1.3sb}^{0.2}$),
 $\chi _f = 1.68$ and the instability is again suppressed. A more quantitative study would be required to determine a precise instability threshold and to confirm the prediction that
 $\chi _f$ is the only parameter that controls the instability of the balanced state.
6. Inverse cascade near the weakly dispersive range
The goal of this section is to investigate the behaviour of the inverse cascade as the energy bump reaches the weakly dispersive range, i.e. for  $k_{\perp } <1$. We thus keep
 $\beta _e=2$ and the same value of
 $\epsilon _E$ as in run
 $R_{13}^2$ but the driving is now centred at
 $k_f = 1.3$ (run
 $R_{1.3}^2$). As a result, the value of
 $\chi _f^t$ is larger.
Figure 9 displays the transverse spectra  $E(k_{\perp })$ and
 $E_C(k_{\perp })$ (figure 9a) and the parallel spectra
 $E(k_{\|})$ and
 $E_C(k_{\|})$ (figure 9b) at increasing times. Inspection of these spectra also indicates the existence of an inverse cascade. In contrast with run
 $R_{13}^2$, at early time both
 $E(k_{\perp })$ and
 $E_C(k_{\perp })$ develop a self-similar range displaying a
 $k_{\perp }^{-2}$ power law. The similarity between
 $E(k_{\|})$ and
 $E_C(k_{\|})$ results from the very weak variation of the parallel phase velocity
 $v_{\textrm {ph}}$ in this spectral range for
 $\beta _e=2$ (see figure 1). This self-similar dynamics does not, however, proceed to longer times. After the cascade reaches scales where the variation of
 $v_{\textrm {ph}}(k_{\perp })$ becomes very small, the transfer to larger scales slows down significantly while the amplitude of the spectra still increases under the effect of the persistent driving. As a result, the spectra tend to bend, flattening close to the driving wavenumber and developing a spectral bump at the minimal excited wavenumber. The slowing down is evident from the fact that the position of the spectral maximum follows two different power laws in time, behaving like
 $t^{-1/3}$ in the dispersive range and like
 $t^{-1/2}$ in the the weakly dispersive range. On the contrary, for the (clear) bump of run
 $R_{13}^2$ the dependence in the dispersive range is of the form
 $t^{-2/3}$. Longer integrations are needed to check whether this behaviour is persistent.
Perpendicular (a) and parallel (b) energy and GCH spectra for run  $R^{2}_{1.3}$.

Interestingly, this cascade depletion is the result of the inner turbulence dynamics, due to a strong decrease of the dispersion, with no need for an external effect such as a hypo-viscosity, as required for example in simulations of the inverse magnetic helicity cascade in incompressible isotropic MHD (Linkmann & Dallas Reference Linkmann and Dallas2017) or in EMHD (Kim & Cho Reference Kim and Cho2015). In contrast, in the parallel direction, no inverse cascade is observed. Both the energy and GCH spectra become flat, corresponding to an absolute equilibrium regime where the energy is uniformly distributed among the  $k_{\|}$ wavenumbers.
The existence of an inverse cascade of GCH in the transverse spectral plane is also conspicuous when considering the transverse GCH flux (not shown) which displays a flat range between the injection wavenumber and the maximum of the perpendicular spectra. Compared to  $R_{13}^2$, in
 $R_{1.3}^2$ the transverse energy flux is also flat in this spectral range, but it is significantly stronger at scales smaller than the driving, suggesting a split cascade with most of the energy transferred to the small scales.
7. Impediment to the transverse cascade and formation of a finite-scale condensate
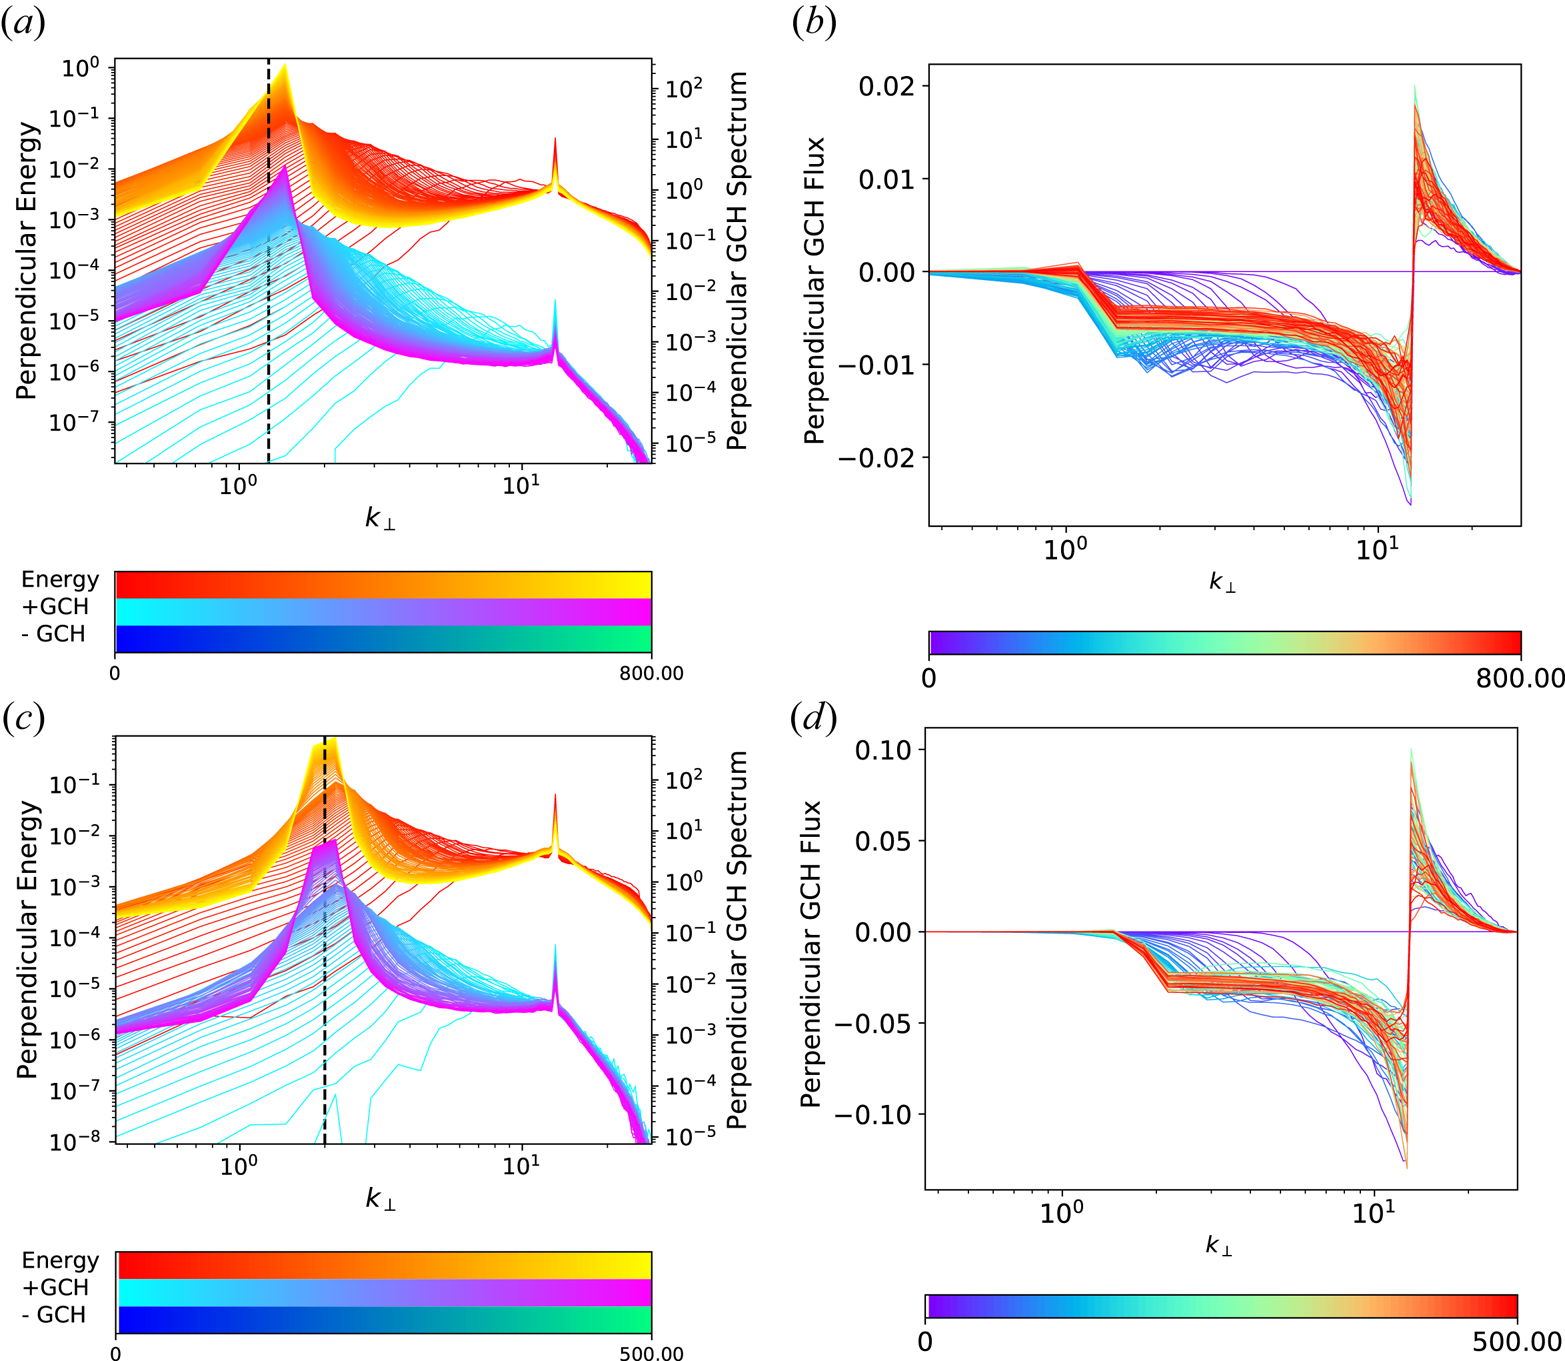
As mentioned previously, the shape of the dispersion curve has an important effect on the cascade dynamics. In order to confirm that the spectral location of this condensate corresponds to the minimum of the parallel phase velocity, we show in figure 10 two simulations with a driving at  $k_f = 13$, where
 $\beta _e=10$ (figure 10a,b) and
 $\beta _e=50$ (figure 10c,d). In the case where
 $\beta _e=10$, the cascade clearly stops at a perpendicular wavenumber slightly larger than unity, where the energy and GCH accumulate at late times.
Energy and GCH spectra (a,c) and perpendicular GCH flux (b,d) for run  $R^{10}_{13}$ (a,b) and run
 $R^{50}_{13}$ (c,d). In the former simulation, the maximum of the spectral bump is located at
 $k_{\perp } =1.3$ and in the latter at
 $k_{\perp } = 2$, corresponding to the respective local minima of the parallel phase velocity
 $v_{\textrm {ph}}$ for the respective
 $\beta _e$, displayed in figure 1.

A similar behaviour is observed in figure 10(c) for  $\beta _e=50$, but in this case the peak is centred at a slightly larger wavenumber, at a value close to
 $k_{\perp }=2$. It turns out that the wavenumbers where the cascade is arrested precisely correspond to the minimum of the parallel phase velocity, as displayed in figure 1, and only depend on the parameter
 $\beta _e$. It is remarkable that such a small variation in the curvature of this quantity (e.g. between the cases
 $\beta _e=2$ and
 $\beta _e=10$) can lead to such an important dynamical effect.
In both cases, the arrest of the cascade leads to the development of a flat GCH spectrum, together with an energy spectrum growing like  $k_{\perp }$, at scales slightly larger than the injection scales. Such an effect was also observed in simulations of the inverse cascade of magnetic helicity in MHD after the cascade had been arrested by the effect of a hypo-diffusivity (Linkmann & Dallas Reference Linkmann and Dallas2017). These spectra correspond to those predicted by absolute equilibrium arguments by Linkmann & Dallas (Reference Linkmann and Dallas2016) (up to the geometrical factors associated with space dimension). In the case of the present model, the GCH spectrum
 $E_C(k_{\perp })$ and the energy spectrum
 $E(k_{\perp })$ are related, in the strongly imbalanced regime, by
 $E_C(k_{\perp })=E(k_{\perp })/v_\textrm {ph}(k_{\perp })$, which leads us to predict that they will have a similar slope for scales larger than the ion scale but that
 $E_C(k_{\perp })$ will be steeper than
 $E(k_{\perp })$ by a factor of
 $k_{\perp }$ at sub-ion scales. Energy equipartition between the modes corresponds to transverse and parallel energy spectra scaling like
 $k_{\perp }$ and
 $k_{\|}^0$,respectively.
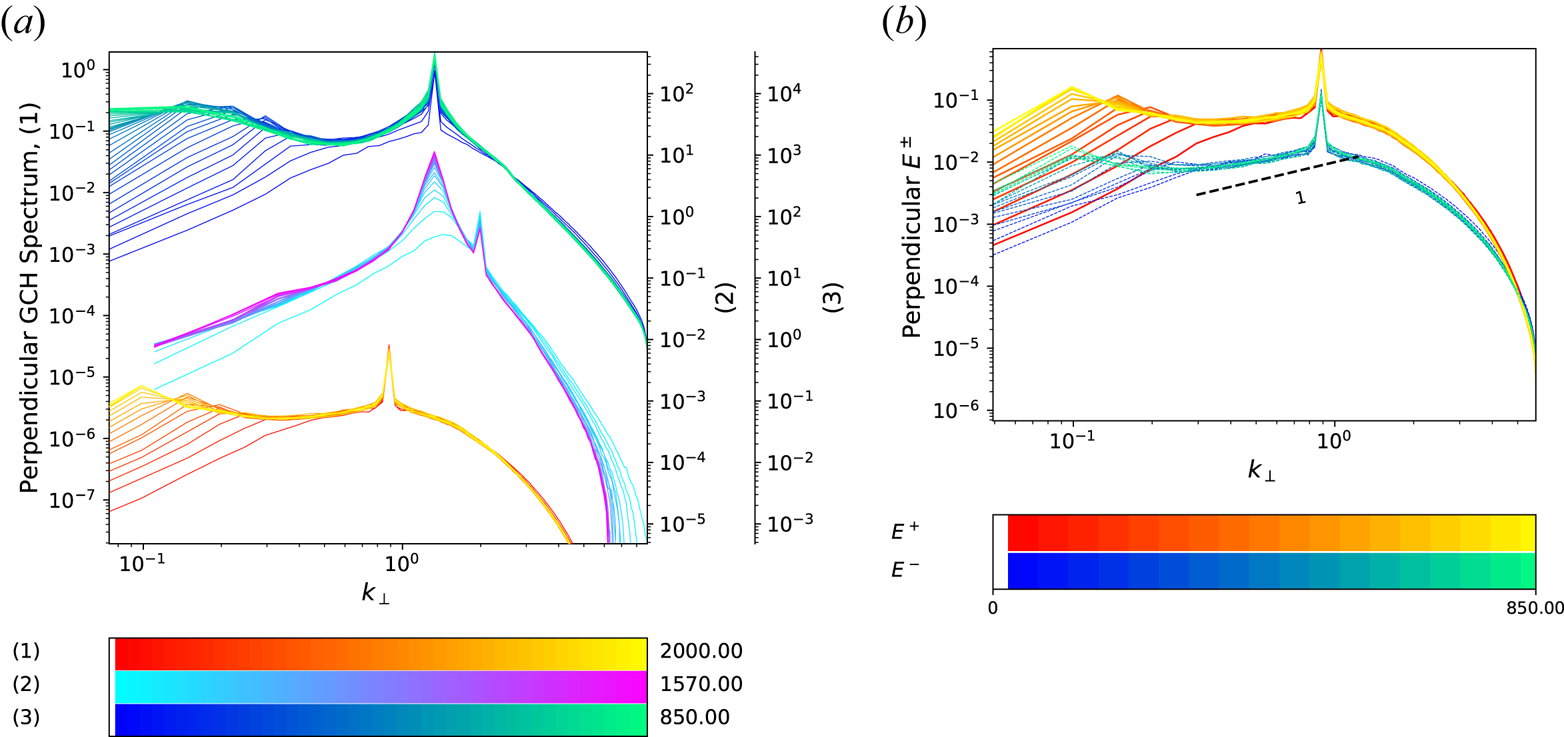
In order to highlight the sensitivity of the nonlinear dynamics to the shape of the phase velocity, we performed simulations, keeping  $\beta _e =10$, while the injection wavenumber
 $k_f$ was taken slightly larger than, equal to or slightly smaller than the wavenumber
 $k_m= 1.3$ where
 $v_{\textrm {ph}}$ has a minimum. Figure 11(a) displays the transverse GCH spectra corresponding to these three runs
 $R_{2}^{10}$,
 $R_{1.3}^{10}$ and
 $R_{0.89}^{10}$. For
 $k_f =2$, thus larger than
 $k_m$, the cascade is arrested at this latter wavenumber. A zone of negative GCH transverse flux develops in the small spectral range between the driving and the spectral peak, which only forms on the dominant wave (not shown). In contrast, for
 $k_f = 1.3$ or
 $0.89$ (thus
 $k_f \le k_m$), a weak non-self-similar inverse transfer of energy and GCH develops at large scales, with a GCH flux that is essentially zero (not shown). A tendency for analogous behaviour can be inferred from the GCH spectrum of run
 $R_{1.3}^{10}$ (cf. the small knee in the spectrum at
 $k_{\perp }\approx 0.3$), but the dynamics is much slower than for the two other simulations. Additional information is provided by the Elsasser spectra
 $E^{\pm }$ of run
 $R_{0.89}^{10}$ displayed in figure 11(b). Transfer to the large scales in run
 $R_{0.89}^{10}$ takes place in a similar way for both waves, in contrast with the simulations presented in previous sections in which only the dominant wave cascades. This large-scale part of the cascade, which is associated with a very small negative flux (not shown), is thus of a different nature and much slower, possibly due to the negative curvature of the parallel phase velocity in this range.Footnote 6 This point deserves a more detailed investigation in future.
(a) Perpendicular GCH spectra for runs  $R_{0.89}^{10}$ (1),
 $R_{2}^{10}$ (2) and
 $R_{1.3}^{10}$ (3). (b) The
 $E^{\pm }(k_{\perp })$ spectra for run
 $R_{0.89}^{10}$ (1).

8. Structures in physical space
Another point, important in the context of the formation of coherent structures, concerns the existence of a parallel inverse cascade. When comparing GCH parallel spectra of the fiducial run displayed in figure 2 with those of figure 9, it becomes evident that there is a transition from a split cascade with a significant inverse parallel component for run  $R^2_{13}$ at large
 $k_f$ to a predominantly forward cascade in run
 $R^2_{1.3}$ at smaller
 $k_f$. In the latter case, the beating of
 ${\pm }k_z$ modes can feed the zero mode in the parallel direction and further interactions can then drive the intermediate modes to an absolute equilibrium. We checked that a parallel inverse cascade only develops when
 $k_f$ is large enough. A precise determination of the condition for the existence of a parallel cascade would require a large number of simulations and is outside the scope of this paper.
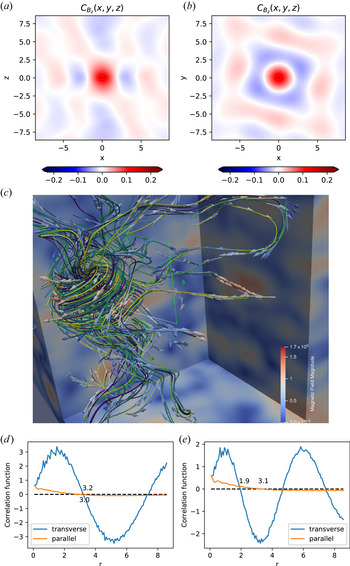
These qualitative spectral features have interesting consequences in physical space. As in two-dimensional hydrodynamics, we can expect the formation of large-scale vortices, but the situation is more complex due to the three-dimensional nature of the dynamics and due to the different types of behaviour in the parallel direction. To give a general overview, the transverse magnetic field appears to form various interconnected vortices, with a typical diameter that can be appreciated from the wavenumber corresponding to the maximum in the energy or helicity spectrum. Alternatively one may estimate the size of these structures based, for example, on the behaviour of the  $B_z$ correlation function, defined as
 \begin{equation} C_{B_z} ({\boldsymbol{r}}):= \int\,\textrm{d}^3 x\; B_z ({\boldsymbol{x}} + {\boldsymbol{r}})B_z ({\boldsymbol{x}}). \end{equation}
As the perpendicular inverse cascade proceeds, the structures, which originate from initial fluctuations at a scale comparable to the forcing, grow in time. For  $\beta _e > 3.5$, this process continues until the finite-
 $k_{\perp }$ condensate is reached. For smaller
 $\beta _e$, no condensate forms but the dynamics slows down significantly when approaching the MHD scales. Therefore several large-scale vortices may exist simultaneously in a large enough domain, even at late times. As a representative case, consider the fiducial run that develops the vortex presented in figure 12(c). The field line filaments displayed in this figure are associated with the magnetic fluctuations
 ${\boldsymbol {B}} =\boldsymbol {\nabla }_{\perp }\times (A_{\|}\hat {{\boldsymbol {z}}}) + B_z \hat {\boldsymbol {z}}$. We observe a vortex whose diameter can be roughly estimated as 3 to 4 length units, while the vertical extension is 5–6 units. The size estimates correspond to the domain of increased field intensity, as displayed by the colour of the arrows. The parallel and perpendicular cross-sections containing the origin of the correlation function defined in (8.1) are displayed in figures 12(a) and 12(b), respectively. In figure 12(d,e), we have plotted the radial (blue line) and longitudinal (orange line) dependence of the correlation function integrated over the azimuthal angle and restricted to
 $z=0$ and
 $|{\boldsymbol {r}}_{\perp }| =0$,respectively. Figure 12(e), which corresponds to the time at which the vortex is displayed, has two maxima. The typical transverse (parallel) size of the vortices corresponds to the distance at which the radial (longitudinal) correlation functions reach zero and the distance (in the transverse direction) between vortices of the same sign is given by the distance between the two maxima. Figure 12(d) shows the same plots at a later time when the cascades have reached the largest scales of the domain. From these figures, we can conclude that the typical vortices that are formed have generally elongated features, with an aspect ratio of order unity (in the rescaled variables of the model). Note that when transforming the rescaled coordinates to the physical ones, the structures are to be stretched along this direction by a quantity given by the inverse expansion parameter, for example the degree of spectral anisotropy.
(a,b) The parallel and perpendicular cross-sections containing the origin of the correlation function defined in (8.1). (d,e) Radial (blue line) and longitudinal (orange line) dependence of the correlation function integrated over the azimuthal angle and restricted to  $z = 0$ and
 $|{\boldsymbol {r}}_{\perp }| = 0$, respectively. (c) Magnetic perturbation field lines for run
 $R_{13}^2$ at an intermediate time of the simulation, showing the formation of an elongated vortex. The field has been filtered to remove the imprint of the small scales such as forcing and dissipation. Field lines are differentiated by colours. Arrows indicate the direction of the field. Colour map corresponds to the magnitude of the magnetic field both on the arrows and on the horizontal and the vertical cuts. The typical size of the three-dimensional structures is indicated using green rulers.

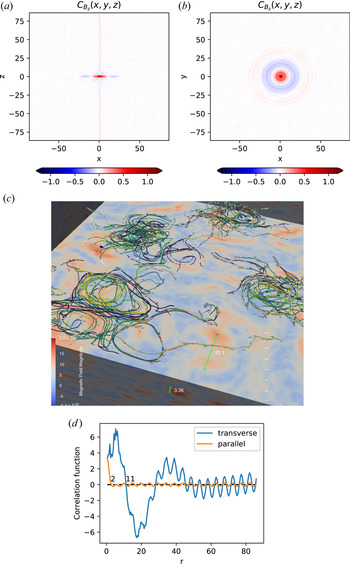
The parallel inverse cascade affects the parallel correlation length of the fluctuating magnetic field of vortices. In particular, in run  $R_{1.3}^2$, no inverse cascade takes place in the parallel direction and, consequently, the structures in physical space are found to be flattened in horizontal layers, as shown in figure 13.
Vertical (a) and horizontal (b) cuts through correlation functions. (d) Radial (blue line) and longitudinal (orange line) dependence of the correlation function integrated over the azimuthal angle and restricted to  $z = 0$ and
 $|{\boldsymbol {r}}_{\perp }| = 0$, respectively. (c) Magnetic fluctuation field lines for run
 $R_{1.3}^2$, showing a layer of looping filaments at a time corresponding to the late stage of the simulation. Field lines are differentiated by colours. Arrows indicate the direction of the field. Colour map corresponds to the magnitude of the magnetic field both on the arrows and on the horizontal and the vertical cuts. The typical size of the three-dimensionalstructures is indicated using green rulers.

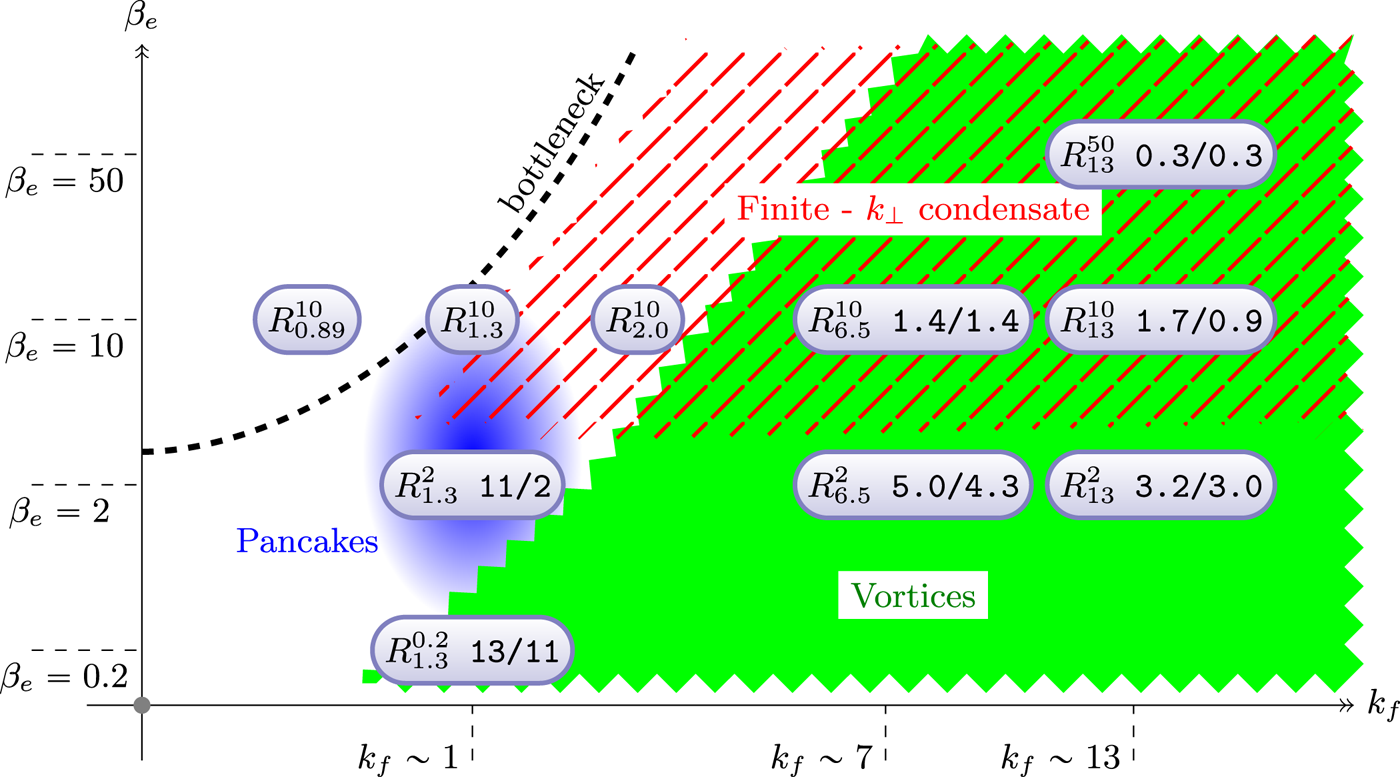
Figure 14 provides a schematic graphical summary of the performed simulations, together with the phenomenology observed in different regimes, in a phase diagram whose axes correspond to the driving wavenumber  $k_f$ and the electron beta parameter
 $\beta _e$. The two additional numbers following each run label correspond to the transverse and longitudinal correlation lengths determined using the approach described above. We can see from the figure that there are two main intersecting areas at sub-ion scales: the green part of the phase space, which corresponds to finite-aspect-ratio vortices, and the red part which corresponds to the runs with
 $\beta _e > 3.5$ that, due to the existence of a local minimum in the phase velocity curve, produce a finite-
 $k_{\perp }$ condensate. The ‘bottleneck’ curve is the locus of points on the diagram for which
 $v_{\textrm {ph}}$ displays such a minimum.
Phase space diagram in the  $(k_f,\beta _e)$ plane, where the locations of the various types of cascades and structures in physical space are indicated as shaded areas. The relevant runs are also added in the diagram, together with the bottleneck locus associated with the values of
 $k_{\perp }$ where the parallel phase velocity has a minimum. The two numbers to the right of each run label provide the estimated correlation lengths in the transverse/parallel format.

For moderate values of  $\beta _e$, a transition is also observed close to the ion scale between situations without a parallel inverse cascade (at smaller values of
 $k_f$), where pancake structures are observed, and those at larger
 $k_f$ where a clear inverse cascade develops in the parallel direction, associated with more elongated vortices. As we cross the bottleneck curve we encounter a critical behaviour described in § 7, associated with runs at
 ${k_f\sim 1}$. Beyond, for scales much larger than the ion sonic Larmor radius, the dynamics is dominated by the forward cascade of GCH, which we do not address in this paper. Below the red region, we have runs that do not produce finite-
 $k_{\perp }$ condensate, since the minimum in phase velocity disappears. It must be borne in mind that only a selected choice of runs is available for drawing general conclusions, and therefore this diagram has to be understood as a qualitative approximation.
9. Conclusion
Direct numerical simulations of a two-field gyrofluid model for KAW turbulence randomly driven at the sub-ion scales have been presented. A main observation is the development of an inverse cascade of GCH in the transverse direction and, to a lesser degree, of energy. This cascade is essentially non-local and some of its properties are sensitive to the nonlinearity parameter  $\chi _f$ (ratio of the period of the waves to the characteristic nonlinear time at the driving scale) and to the shape of the dispersion relation. When
 $\chi _f$ is large enough, a self-similar cascade develops at early time while, for smaller values of
 $\chi _f$, a spectral bump is observed to propagate towards small wavenumbers. In the latter case, transient parametric decay instability events are also possible, which enhance the development of the cascade. At later times, we observe a similar evolution in all the simulations, where the spectrum gets distorted, with the establishment of an absolute equilibrium range extending from the forcing wavenumber to larger scales. When the cascade reaches non-dispersive scales, it slows down while the maxima of the energy and GCH spectra still increase. For the moderate values of the GCH injection rate that we use throughout the paper, one type of wave is usually dominant, while the other develops an equilibrium spectrum. When the injection wavenumber is large or
 $\beta _e$ small enough (i.e. when
 $\chi _f$ is small), an inverse GCH cascade is even possible when the driving is balanced. This result suggests that fast magnetic reconnection events could not only drive small-scale turbulence (Cerri & Califano Reference Cerri and Califano2017), but also induce a cascade to larger scales, a dynamics somewhat similar to the island merging proposed in Franci et al. (Reference Franci, Cerri, Califano, Landi, Papini, Verdini, Matteini, Jenko and Hellinger2017). When
 $\beta _e \gtrapprox 3.5$, the parallel phase velocity
 $v_{\textrm {ph}} =\omega /k_{\|}$ displays a minimum at a perpendicular wavenumber close to the ion scale. In this case, the inverse GCH cascade is arrested, leading to the formation of finite-wavenumber condensates. In the parallel direction, depending on the parameters, an inverse cascade resulting mostly from local interactions can also develop.
Another result concerns the capability of the transverse GCH inverse cascade to lead to the formation of coherent vortices with a transverse size comparable to the ion scale. Depending on the plasma parameters, their longitudinal correlation length can be enhanced when an inverse cascade develops in the parallel direction. Typically, the structures that form have an aspect ratio of order unity in the anisotropic coordinates used in the model. They will be more elongated in the physical coordinates by a quantity given by the inverse expansion parameter, associated with the amplitude of the fluctuations. These structures are possibly related to those observed in the solar wind (Perrone et al. Reference Perrone, Alexandrova, Roberts, Lion, Lacombe, Walsh, Maksimovic and Zouganelis2017) or in the terrestrial magnetosheath (Wang et al. Reference Wang, Alexandrova, Perrone, Dunlop, Dong, Bingham, Khotyaintsev, Russell, Giles and Torbert2019), which in some instances are associated by Alexandrova (Reference Alexandrova2008) with the  $k_{\perp }^{-4}$ transition range. The simulations that we have discussed above provide a natural way to form vortices, and to demonstrate their dynamical stability. Further development would be needed to analyse the process of their formation, i.e. whether it proceeds in a conventional two-dimensional hydrodynamics sense of vortex merger/nucleation, and if one can observe instances of reconnection, as discussed by Zhou, Loureiro & Uzdensky (Reference Zhou, Loureiro and Uzdensky2020) in the context of reduced MHD. Another issue is the analytical characterization of these vortices and the comparison with the Alfvén vortices found analytically in Petviashvili & Pokhotelov (Reference Petviashvili and Pokhotelov1992) at MHD scales or in Jovanović et al. (Reference Jovanović, Alexandrova, Maksimović and Belić2020) (and references therein) at ion scales and large values of the beta parameter.
The present study can be extended to include the coupling to slow magnetosonic waves, using a four-field gyrofluid model (Tassi, Passot & Sulem Reference Tassi, Passot and Sulem2020). This description appears especially relevant in the regions near the Sun, explored by Parker Solar Probe and Solar Orbiter, where large-scale compressibility effects are important. Such a model allows for the development of the Alfvén wave parametric decay instability, an effect that is viewed as an efficient process for generating counter-propagating waves, required for the existence of turbulence at the MHD scales (Viñas & Goldstein Reference Viñas and Goldstein1991; Del Zanna, Velli & Londrillo Reference Del Zanna, Velli and Londrillo2001; Shoda & Yokoyama Reference Shoda and Yokoyama2018).
Another avenue could involve a detailed theoretical understanding of the impediment of the inverse cascade and the formation of a finite- $k_{\perp }$ condensate, observed in the simulations in the presence of a small depression in the KAW parallel phase velocity.
Acknowledgements
This work was granted access to the HPC resources of CINES/IDRIS under the allocation A0060407042. Part of the computations were also done on the Mesocentre SIGAMM machine, hosted by Observatoire de la Côte d'Azur. We are grateful to D. Borgogno for his contribution to the initial version of the numerical code.
Editor Alex Schekochihin thanks the referees for their advice in evaluating this article.
Declaration of interests
The authors report no conflict of interest.
Appendix A. Decay instability
Using the same notation for the operators and their Fourier symbols, we define the Fourier components  $c_{\boldsymbol {k}}^{\sigma _k} = D_e(k_{\perp }) \mu _{\boldsymbol {k}}^{\sigma _k}$ of the fields
 $D \mu ^{\pm }$ (where
 $\sigma _k= \pm$) and, in the interaction representation,
 \begin{equation} a_{\boldsymbol{k}}^{\sigma_k} = \exp\left({\textrm{i}\omega_k^{\sigma_k} t}\right) c_{\boldsymbol{k}} , \end{equation}
with  $\omega _{\boldsymbol {k}}^{\sigma _k} = \sigma _k v_{\textrm {ph}}(k_{\perp }) k_z$. The gyrofluid equations are rewritten as
 \begin{equation} \partial_t a_{\boldsymbol{k}}^{\sigma_k} - \int \sum_{\sigma_p, \sigma_q} \exp\left({\textrm{i} \varOmega_{{\boldsymbol{k}};{\boldsymbol{p}} {\boldsymbol{q}}}^{\sigma_k \sigma_p \sigma_q}t}\right) V_{{\boldsymbol{k}}{\boldsymbol{p}}{\boldsymbol{q}}}^{\sigma_k \sigma_p \sigma_q} a^{\sigma_p}_{\boldsymbol{p}}a^{\sigma_q}_{\boldsymbol{q}} \delta(\,{\boldsymbol{p}}+{\boldsymbol{q}} - {\boldsymbol{k}} )\,\textrm{d}{\boldsymbol{p}}\,\textrm{d}{\boldsymbol{q}}=0, \end{equation}
where we define
 \begin{equation} \varOmega_{{\boldsymbol{k}};{\boldsymbol{p}} {\boldsymbol{q}}}^{\sigma_k \sigma_p \sigma_q} = \omega_{\boldsymbol{k}}^{\sigma_k} - \omega_{\boldsymbol{p}}^{\sigma_p} - \omega_{\boldsymbol{q}}^{\sigma_q}= \sigma_k v_{\textrm{ph}}(k_{\perp}) k_{\|} - \sigma_p v_{\textrm{ph}}(p_{\perp}) p_{\|} - \sigma_q v_{\textrm{ph}}(q_{\perp}) q_{\|}. \end{equation}
When neglecting electron inertia,
 \begin{equation} V_{{\boldsymbol{k}}{\boldsymbol{p}}{\boldsymbol{q}}}^{\sigma_k \sigma_p \sigma_q}= \frac{1}{8} \frac{\sigma_p\sigma_q({\hat{\boldsymbol{z}}}\boldsymbol{\cdot}(\,{\boldsymbol{p}}\times {\boldsymbol{q}}))}{k_{\perp} p_{\perp} q_{\perp}} \left ( \frac{\sigma_p}{\xi(p_{\perp})} - \frac{\sigma_q}{\xi(q_{\perp})}\right )(\sigma_k k_{\perp}^2 \xi(k_{\perp}) + \sigma_p p_{\perp}^2 \xi(p_{\perp}) + \sigma_q q_{\perp}^2 \xi(q_{\perp})) \end{equation}
with  $\xi =s/v_{\textrm {ph}}$, consistent with the vertex given in (6.4) of Voitenko (Reference Voitenko1998a), directly derived from the Vlasov–Maxwell equations.
At this point it is easy to estimate the growth rate of the decay parametric instability of a KAW into two other KAWs. For this purpose, one considers a pump of type  $\sigma _k$, with wavenumber
 ${\boldsymbol {k}}$, frequency
 $\omega _{\boldsymbol {k}}$ and complex amplitude
 $a_{\boldsymbol {k}}^{\sigma _k}= D_e (\varLambda \varphi (\boldsymbol {k}, t)+ \sigma _k A_{\|}(\boldsymbol {k},t) )$ (see (2.10)). It can interact with KAWs of wavevectors
 ${\boldsymbol {p}}$ and
 ${\boldsymbol {q}}$ that satisfy the resonance conditions
 \begin{gather} {\boldsymbol{k}}={\boldsymbol{p}}+ {\boldsymbol{q}}, \end{gather}
 \begin{gather}\omega_{\boldsymbol{k}}= \omega_{\boldsymbol{p}}+ \omega_{\boldsymbol{q}}, \end{gather}
in the way that
 \begin{gather} \partial_t a_{\boldsymbol{p}}^{\sigma_p} = V_{{\boldsymbol{p}}\,{\boldsymbol{k}}\,{-{\boldsymbol{q}}}}^{\sigma_p \sigma_k \sigma_q} a_{\boldsymbol{k}}^{\sigma_k} {a_{\boldsymbol{q}}^{\sigma_q}}^*, \end{gather}
 \begin{gather}\partial_t{a_{\boldsymbol{q}}^{\sigma_q}}^* = V_{-{\boldsymbol{q}}-{\boldsymbol{k}}\,{\boldsymbol{p}}}^{\sigma_q \sigma_k \sigma_p} {a_{\boldsymbol{k}}^{\sigma_k}}^* a_{\boldsymbol{p}}^{\sigma_p}. \end{gather}
This results in a growth rate  $\gamma$ for the modes
 $a_{\boldsymbol {p}}^{\sigma _p}$ and
 $a_{\boldsymbol {q}}^{\sigma _q}$ given by
 \begin{align} \gamma^2 &= V_{{\boldsymbol{p}}\,{\boldsymbol{k}}\,{-{\boldsymbol{q}}}}^{\sigma_p \sigma_k \sigma_q}V_{-{\boldsymbol{q}}\,-{\boldsymbol{k}}\,{\boldsymbol{p}}}^{\sigma_p \sigma_k \sigma_q} |a_{\boldsymbol{k}}^{\sigma_k}|^2\nonumber\\ &= \frac{1}{64} \frac{({\hat{\boldsymbol{z}}}\boldsymbol{\cdot}(\,{\boldsymbol{p}}\times {\boldsymbol{q}}))^2}{\xi(p_{\perp})\xi(q_{\perp})}\frac{1}{k_{\perp}^2 p_{\perp}^2 q_{\perp}^2} \left ( \frac{\sigma_k}{\xi(q_{\perp})}-\frac{\sigma_p}{\xi(k_{\perp})}\right) \left(\frac{\sigma_p}{\xi(k_{\perp})}-\frac{\sigma_k}{\xi(p_{\perp})}\right)\nonumber\\ &\quad \times \left (\sigma_k k_{\perp}^2 \xi(k_{\perp}) + \sigma_p p_{\perp}^2 \xi(p_{\perp}) + \sigma_q q_{\perp}^2 \xi(q_{\perp})\right )^2 |a_{\boldsymbol{k}}^{\sigma_k}|^2, \end{align}
where the eigenmode  $a_{\boldsymbol {k}}^{\sigma _k}$ satisfies
 $|a_{\boldsymbol {k}}^{\sigma _k}|^2 = (8/\beta _e)|B_{\perp }(\boldsymbol {k})|^2$ (Passot & Sulem Reference Passot and Sulem2019). Instability thus requires
 \begin{equation} \left ( \frac{\sigma_k}{\xi(q_{\perp})}-\frac{\sigma_p}{\xi(k_{\perp})}\right) \left(\frac{\sigma_p}{\xi(k_{\perp})}-\frac{\sigma_k}{\xi(p_{\perp})}\right)>0. \end{equation}
Equation (7.5) of Voitenko (Reference Voitenko1998a) (see also Zhao, Wu & Lu Reference Zhao, Wu and Lu2010b) is reproduced when noting that in the latter equation the length unit is not  $\rho _s$ but
 $\rho _i$ defined as
 $\sqrt {\tau }\rho _s$ and that
 $\xi$, defined as the ratio of the Alfvén to the KAW frequency, is independent of the length unit. In the framework of the present paper, the growth rate of the parametric decay instability scales, in the ERMHD regime, as
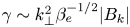 $\gamma \sim k_{\perp }^2 \beta _e^{-1/2} |B_k|$ when
 $\beta _e\lesssim 1$ and
 $\gamma \sim k_{\perp }^2 \beta _e^{-1}|B_k|$ when
 $\beta _e\gg 1$ (recall that for
 $\beta _e\gg 1$,
 $\xi (k_{\perp }) =s/v_{\textrm {ph}}\sim {1}/{sk_{\perp }}$). Note that, if we use
 $d_i$ as length unit, thus writing
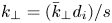 $k_{\perp } = ({\bar {k}}_{\perp } d_i)/s$, where
 ${\bar {k}}_{\perp }$ denotes the corresponding dimensional wavenumber, the growth rate
 $\gamma$ does not scale with
 $\beta _e$ in the large
 $\beta _e$ limit, as is the case in EMHD for whistler waves (Zhao, Lu & Wu Reference Zhao, Lu and Wu2010a).
Appendix B. Energy and GCH shell-to-shell transfers
Useful information on the cascade dynamics is provided by analysing the energy and GCH shell-to-shell transfers in Fourier space, when proceeding as in Alexakis et al. (Reference Alexakis, Bigot, Politano and Galtier2007) and Mininni, Alexakis & Pouquet (Reference Mininni, Alexakis and Pouquet2007). As in the calculation of the transverse and parallel energy and GCH spectra, we perform a partition of the Fourier space either in cylindrical shells  $S_{K_{\perp }}$ including all the wavevectors whose transverse component obeys
 $K_{\perp }<|\boldsymbol {k}_{\perp }| \leqslant K_{\perp }+ dk_x$, or in slabs
 $S_{K_{\|}}$ including all the wavevectors whose parallel component
 $k_z$ obeys
 $K_z<|k_z| \leqslant K_z+dk_z$, with the goal of studying the perpendicular and parallel transfer, respectively. Here,
 $dk_x$ and
 $dk_z$ refer to the spectral mesh along the transverse axes and along the parallel axis, respectively.
Our aim is to estimate the energy and GCH transfer rates  $T_E(K,P)$ and
 $T_C(K,P)$, respectively, between a shell
 $K$ that receives and a shell
 $P$ that gives, such that it is possible to write
 ${\partial _t E_K = \sum _P T_E(K,P)}$ and
 ${\partial _t C_K = \sum _P T_C(K,P)}$, where
 $E_K$ and
 $C_K$ are the contributions of a cylindrical or of a slab-shaped shell
 $S_K$ to the energy
 ${\mathcal {E}}$ and to the GCH
 ${\mathcal {C}}$, respectively (
 ${{\mathcal {E}} = \sum _K E_K}$ and
 ${{\mathcal {C}} = \sum _K C_K}$). Due its physical meaning, we expect that
 $T_E(P,K) = - T_E(K,P)$ and
 $T_{C}(P,K) = - T_{C}(K,P)$ are antisymmetric, since the amount of the invariant that the
 $K$-shell gives to
 $P$ equals the amount of the same invariant that the
 $P$-shell receives. Finally, the total fluxes of energy
 $\varPi _E(K)$ and GCH
 $\varPi _C(K)$ through a wavenumber
 $K$,
 \begin{equation} \varPi_E(K) =-\sum_{K^{\prime}=0}^{K} \sum_{P=0}^{\infty} T_E(K^{\prime}, P), \quad \varPi_C(K) =-\sum_{K^{\prime}=0}^{K} \sum_{P=0}^{\infty} T_C(K^{\prime}, P), \end{equation}
are obtained from the shell-to-shell transfer  $T_E(K',P)$ or
 $T_C(K',P)$ by summing over
 $P$ and over
 $K'\le K$.
A scalar field  $A$ restricted to a shell
 $S_{K}$ (here and in the following
 $K$ holds for either
 $K_{\perp }$ or
 $K_{\|}$) can be represented in terms of its Fourier modes
 $\widehat {A_{\boldsymbol {k}}}$ by
 \begin{equation} A_{K}(\boldsymbol{x})=\sum_{\boldsymbol{k} \in S_{K}} \hat{A}_{\boldsymbol{k}} \exp({\textrm{i} \boldsymbol{k} \cdot \boldsymbol{x}}), \end{equation}
so that
 \begin{equation} \sum_{K} A_{K}(\boldsymbol{x}) = A(\boldsymbol{x}). \end{equation}
When considering two scalar fields  $A$ and
 $B$, one has
 \begin{equation} \int\,\textrm{d}^3 x A_K(\boldsymbol{x}) B(\boldsymbol{x}) = \sum_{\boldsymbol{k} \in S_{K}^{\pm}}\int\,\textrm{d}^3 x {\hat{A}}_{\boldsymbol{k}} \exp({\textrm{i} \boldsymbol{k} \cdot \boldsymbol{x}}) B(\boldsymbol{x}) = \dfrac{1}{(2{\rm \pi})^3} \sum_{\boldsymbol{k} \in S_{K}^{\pm}} {\hat{A}}_{\boldsymbol{k}} {\hat{B}}^{\star}_{\boldsymbol{k}} \end{equation}
and
 \begin{equation} \int\,\textrm{d}^3 x A_K(\boldsymbol{x}) B_K(\boldsymbol{x}) = \sum_{\boldsymbol{k} \in S_{K}^{\pm}}\sum_{\boldsymbol{k}^{\prime} \in S_{K}^{\pm}}\int \,\textrm{d}^3 x {\hat{A}}_{\boldsymbol{k}} \exp({\textrm{i} (\boldsymbol{k} + \boldsymbol{k}^{\prime} )\cdot \boldsymbol{x}}) {\hat{B}}_{\boldsymbol{k}^{\prime}} = \dfrac{1}{(2{\rm \pi})^3} \sum_{\boldsymbol{k} \in S_{K}^{\pm}} {\hat{A}}_{\boldsymbol{k}} {\hat{B}}^{\star}_{\boldsymbol{k}}, \end{equation}
where again  $K$ holds for either
 $K_{\perp }$ or
 $K_{\|}$, depending if perpendicular or parallel transfers are considered. In practise, the latter expression is used to evaluate various integrals arising in the expression of the transfer
 $T_{E}(K,P)$ and
 $T_C(K,P)$.
For the two-fluid gyrofluid, the two-fluid Lie-dragging formulation (2.15) can be conveniently used when electron inertia is retained. The total GCH reads  ${\mathcal {C}} = \int C \,\textrm {d}^3x$, where we define the GCH density as
 \begin{equation} C= -\frac{1}{4\delta} \{ (G^+)^2 - (G^-)^2\}. \end{equation}
It follows that
 \begin{align} \partial_t C &= \frac{1}{2\delta}\left\{ G^+ [\varphi^+, G^+] - G^-[\varphi^- , G^-] -\frac{1}{2\delta}\partial_z ((G^+)^2 + (G^-)^2) \right.\nonumber\\ &\quad +\left.\frac{2}{\delta} L_e A_{\|} \partial_z A_{\|} + 2\delta N_e \partial_z (1-M_1)\varphi \right\}. \end{align}
To simplify the notation, we use
 \begin{equation} \sum_{\pm} \pm G^{\pm}[\varphi^{\pm}, G^{\pm}] \equiv G^+ [\varphi^+, G^+] - G^-[\varphi^- , G^-]. \end{equation}
In this case, the contribution 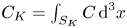 $C_K= \int _{S_K} C \,\textrm {d}^3x$ of shell
 $K$ to GCH (
 ${{\mathcal {C}} = \sum _K C_K}$) obeys
 \begin{equation} \dot{C}_{K}=\frac{1}{2 \delta} \int\,\textrm{d}^{3} x \sum_{P} \sum_{\pm} \pm G_{K}^{\pm}\left[\varphi^{\pm}, G_P^{\pm}\right], \end{equation}
where the contribution of the terms involving a  $z$-derivative cancel out by space integration, when using that
 $N_e = -M_2\varphi$ and the hermiticity of the operators
 $M_1$,
 $M_2$ and
 $-\varDelta _{\perp }$. The formulation given by (B 9) is interesting, since it is as though the transfer is achieved via Lie drag over the flow corresponding to
 $\varphi ^{\pm }$. In terms of primitive fields, the expression evaluates to
 \begin{align} \dot{C}_{K} &=\frac{1}{2 \delta} \int \,\textrm{d}^{3} x \sum_{P} \left( L_{e} A_{\|} \right)_K \left[\frac{A_{\|}}{\delta}, \left(L_{e} A_{\|} \right)_P\right]-\left( L_{e} A_{\|} \right)_K\left[\left(M_3-M_{2}\right) \varphi,\right.\nonumber\\ &\left.\delta (M_{2} \varphi)_{P}\right] -\delta (M_{2} \varphi)_{K}[(M_{3}-M_{2}) \varphi,( L_{e} A_{\|})_P]+\delta (M_{2} \varphi)_{K}\left[\frac{A_{\|}}{\delta}, \delta (M_{2} \varphi)_{P}\right]. \end{align}
The first summand, which involves a term  $A_{\| K} [A_{\|}, A_{\|P}]/\delta$, has a singular behaviour as
 $\delta \rightarrow 0$, but it does not contribute to the flux and is thus physically irrelevant. We ignore it in the estimate of the shell-to-shell transfer.
Turning to the energy, we write  ${{\mathcal {E}}= \sum _K E_K}$, where
 $E_K$, given by
 \begin{equation} E_K= \frac{1}{2} \int \left \{ (M_2 \varphi_K)((1-M_1) \varphi_K) + (M_2\varphi_K)^2- \frac{2}{\beta_e} (L_e A_K) (\varDelta_{\perp} A_K) \right\} \, \textrm{d}^3x, \end{equation}
is the contribution of shell K to the energy. The operator arising in the above equation being hermitian, we can write
 \begin{equation} \partial_t E_K= \int \left \{ ((1-M_1) \varphi_K)\partial_t(M_2 \varphi_K) + (M_2 \varphi_K)\partial_t(M_2\varphi_K)- \frac{2}{\beta_e} (\varDelta_{\perp} A_K) \partial_t (L_e A_K)\right\} \, \textrm{d}^3x \end{equation}
or
 \begin{equation} \left. \begin{gathered} \partial_t E_K= \int \left \{ ((1-M_1) \varphi_K)\partial_t(M_2 \varphi) + (M_2 \varphi_K)\partial_t(M_2\varphi)- \frac{2}{\beta_e} (\varDelta_{\perp} A_K) \partial_t (L_e A_)\right\} \, \textrm{d}^3x ,\\ \partial_t E_K= \frac{1}{4}\int \left\{ -(\varphi^+_K + \varphi^-_K) \partial_t \frac{G^+ -G^-}{\delta} + \frac{G^+_K -G^-_K}{\delta} \partial_t \frac{G^+ -G^-}{\delta} \right.\\ \qquad\,\, \left.+ \frac{G^+_K +G^-_K}{\delta}\partial_t \frac{G^+ +G^-}{\delta} -(\varphi^+_K -\varphi^-_K)\partial_t \frac{G^+ +G^-}{\delta} \right\} \, \textrm{d}^3x, \end{gathered} \right\} \end{equation}
where we have replaced  $L_e$ by its definition. Equivalently, after a simple algebraic rearrangement,
 \begin{equation} \partial_t E_K = \frac{1}{2\delta} \int \left\{\left (\frac{G^+_K}{\delta} -\varphi^+_K \right ) \partial_t G^+ + \left (\frac{G^-_K}{\delta} +\varphi^-_K\right) \partial_t G^-\right\} \, \textrm{d}^3x, \end{equation}
which we rewrite in the more compact form
 \begin{equation} \partial_t E_K = \frac{1}{2\delta} \int \sum_{\pm} \left (\frac{G^{\pm}_K}{\delta} \mp \varphi^{\pm}_K \right ) \partial_t G^{\pm} \, \textrm{d}^3x. \end{equation}
We then use the model equations in the form
 \begin{equation} \partial_t G^{\pm} + \left[\varphi^{\pm}, G^{\pm} \mp \delta \varphi^{\pm} \right] + \partial_z\left(\varphi^{\pm} \mp \frac{1}{\delta} G^{\pm} \right) =0, \end{equation}
where we include an additional term in the second argument of the bracket which does not contribute, and get
 \begin{equation} \partial_t{E}_{K}=-\frac{1}{2} \int \sum_{\pm}\left(\frac{G_{K}^{\pm}}{\delta} \mp \varphi_{K}^{\pm}\right)\left[\varphi^{\pm}, \frac{G^{\pm}}{\delta} \mp \varphi^{\pm}\right] \, \textrm{d}^{3} x. \end{equation}
This enables defining the shell-to-shell energy transfer  $T(K,P)$ such that
 \begin{equation} \partial_t E_K = \sum_P T(K,P) \end{equation}
via
 \begin{equation} T(K,P) = \frac{1}{2} \int \sum_{\pm}\left(\frac{G_{K}^{\pm}}{\delta} \mp \varphi_{K}^{\pm}\right)\left[\varphi^{\pm}, \frac{G_P^{\pm}}{\delta} \mp \varphi_P^{\pm}\right] \, \textrm{d}^{3} x, \end{equation}
which is antisymmetric in  $K$ and
 $P$.
In terms of the primitive variables ( $M_3= 1+M_2-M_1)$,
 \begin{align} &\left(\frac{G_{K}^{\pm}}{\delta} \mp \varphi_{K}^{\pm}\right)\left[\varphi^{\pm}, \frac{G_P^{\pm}}{\delta} \mp \varphi_P^{\pm}\right] = \left (\mp(M_3\varphi)_K - \frac{2\delta}{\beta_e} \varDelta_{\perp} A_K \right) \left\{ \left [M_3\varphi \pm \frac{1}{\delta} A_{\|} , \mp (M_3\varphi)_P\right.\right.\nonumber\\ &\quad - \left.\left.\frac{2\delta}{\beta_e} \varDelta_{\perp} A_P \right ] \right. \left.- \left[M_2\varphi \pm \frac{1}{\delta} A_{\|} , \mp (M_3\varphi)_P - \frac{2\delta}{\beta_e} \varDelta_{\perp} A_P \right] \right\} \end{align}
includes a term  $(M_3\varphi )_K [M_3\varphi , (M_3 \varphi )_P]$ that does not contribute to the flux, and that we thus suppress. As a result, the renormalized transfers we report are calculated according to the formulas
 \begin{equation} T_C(K,P)= \int \,\textrm{d}^{3} x \left( \frac{1}{\delta}A_{\| K} [A_{\|}, A_{\|P}] - \frac{1}{2 \delta}\sum_{\pm} \pm G_{K}^{\pm}\left[\varphi^{\pm}, G_P^{\pm}\right] \right) \end{equation}
and
 \begin{equation} {T}_{E}(K,P)= \int \,\textrm{d}^{3} x\left(-(M_3\varphi)_{K} [(M_3 \varphi), (M_3 \varphi)_P] -\frac{1}{2} \sum_{\pm}\left(\frac{G_{K}^{\pm}}{\delta} \mp \varphi_{K}^{\pm}\right)\left[\varphi^{\pm}, \frac{G_{P}^{\pm}}{\delta} \mp \varphi_{P}^{\pm}\right]\right). \end{equation}