1. Introduction
Thermal convection is the main heat transfer mechanism in the interiors of planets and many stars (Phillips Reference Phillips2013) and is responsible for most of their dynamics. Rayleigh–Bénard convection, which is the flow developing in a plane layer subject to a potentially destabilising temperature difference, is commonly used as a model for the dynamics of such astrophysical objects (Busse & Carrigan Reference Busse and Carrigan1976; Busse Reference Busse1989). It is also one of the most studied examples of a pattern-forming system (Cross & Hohenberg Reference Cross and Hohenberg1993). A horizontal layer of fluid heated from below and cooled from above can be unstably stratified – assuming, as is most usually the case, that the thermal expansion coefficient is positive. Indeed, in that case, the upper cold fluid is denser than the hot one at the bottom. It has been demonstrated (Rayleigh Reference Rayleigh1916; Chandrasekhar Reference Chandrasekhar1961) that for a large enough temperature gradient, the fluid adopts a convective state in which heat transport is partially realised by fluid motion.
Convection between two isothermal planes (i.e. with a fixed temperature (FT) boundary condition) modelled with the Boussinesq approximation constitutes the classical Rayleigh–Bénard thermal convection set-up. Lord Rayleigh offered a model for such a phenomenon (Rayleigh Reference Rayleigh1916) as an explanation for the experiments of Bénard (Reference Bénard1900). Other set-ups of the Rayleigh–Bénard system have been explored, for example, by choosing a fixed flux (FF) boundary condition, which is closer to usual experimental conditions (Busse & Riahi Reference Busse and Riahi1980). However, for geophysical and astrophysical applications, it can be difficult to choose between those two mathematical usual conditions: fixed field or fixed derivative, also known as Dirichlet and Neumann boundary conditions, respectively. Indeed, in some physical situations the boundary conditions is more accurately described by a thermal flux proportional to the temperature itself, leading to
 \begin{equation} \beta T + \frac{\partial T}{\partial r} = 0, \end{equation}
with  $\beta$ a proportionality factor homogeneous to an inverse length scale. Using a reference length scale
 $L$, one can construct the dimensionless Biot number
 \begin{equation} {{\textit{Bi}}} = \beta L. \end{equation}
The boundary condition (1.1) is intermediate between the Neumann (FF) and Dirichlet (FT) conditions which are obtained for  ${{\textit {Bi}}}=0$ and
 ${{\textit {Bi}}} \rightarrow \infty$, respectively, and is called the Robin boundary condition. Robin boundary conditions appear naturally in the presence of weakly conductive boundaries (Busse & Riahi Reference Busse and Riahi1980) or conductive–radiative empirical Newton's law (O'Sullivan Reference O'Sullivan1990). Note that linearized black-body radiative equilibrium are often interpreted as Newton's law (for example, in meteorological models, Savijärvi Reference Savijärvi1994). Thermal contact between two layers of distinct length and thermal conductivity can also be modelled by a Robin boundary condition (Guillou & Jaupart Reference Guillou and Jaupart1995; Grigné, Labrosse & Tackley Reference Grigné, Labrosse and Tackley2007).
Modelling the radiative equilibrium between a liquid shell and an atmosphere is our initial motivation. More precisely, we are interested in understanding the behaviour of surface global magma oceans crystallizing from the bottom upward (Labrosse, Hernlund & Hirose Reference Labrosse, Hernlund and Hirose2015). Following the current scientific consensus, Earth may have undergone giant impacts during its formation (Solomatov Reference Solomatov2007). Such impacts were able to melt a large part of the nowadays solid mantle, producing what is called a magma ocean. This physical object is not known with extreme precision but was characterised, at its formation, by large depth ( ${\sim }1\times 10^{6}\ \textrm {m}$), low viscosity (
 ${\sim }0.1\ \textrm {Pa}\,\textrm {s}$) and rapid flows (
 ${\sim }10\ \textrm {m}\,\textrm {s}^{-1}$) (Solomatov Reference Solomatov2007). Modelling the cooling and the crystallization of this terrestrial global magma ocean is of great interest in order to obtain information about the early evolution of the Earth and other terrestrial planets. In that case, the radiative equilibrium between an atmosphere and the surface of the magma ocean may be modelled using a Robin boundary condition. Indeed, approximating this radiative equilibrium by an interaction between two black bodies leads to setting the heat flux at the upper boundary of the magma ocean to the difference between the radiative flux leaving the surface and the one received from the atmosphere (assumed isothermal). Using Stefan–Boltzman's law (Boltzmann Reference Boltzmann1884) (which can be derived from Planck's law) and linearizing the flux variation with temperature leads to the Robin boundary condition.
Up to now, the influence of Robin boundary conditions has received scant attention. Linear stability analyses were conducted in a Cartesian system without rotation by Sparrow et al. (Sparrow, Goldstein & Jonsson Reference Sparrow, Goldstein and Jonsson1964), who determined that increasing the Biot number enables transitioning monotonously from FF to FT cases (in terms of critical Rayleigh numbers). This transition was found to occur in the range  ${{\textit {Bi}}}= 0.1\text {--}100$. Several studies consider only the extremal cases of FT and FF, the latter being a model for the poorly conductive wall used in some experiments. In two-dimensional Cartesian geometry, Chapman & Proctor (Reference Chapman and Proctor1980) showed, thanks to stability analysis calculations, the generation of much longer convective cells with symmetric FF, compared with those observed in symmetric FT configurations. A similar three-dimensional (3-D) set-up was also considered by Busse & Riahi (Reference Busse and Riahi1980) who showed that square-pattern convection planforms were preferred to two-dimensional rolls produced in the case of FT boundary conditions. Later, Ishiwatari, Takehiro & Hayashi (Reference Ishiwatari, Takehiro and Hayashi1994) explored, by numerical integration in a Cartesian two-dimensional system, the effects of the different combinations of boundary conditions and internal heating on thermal convection. They observed similar effects on the wavelength of convection cells of the FF boundary conditions (independently of the presence of internal heating) as previously mentioned by Chapman and Proctor. All these Cartesian geometry studies show that FF produces convection patterns with a larger wavelength than FT.
In geophysical fluid dynamics planetary rotation is often significant and rotational effects (Coriolis force) must be included in the physical model. In fact, rotation is able to impact dramatically Rayleigh–Bénard convection, altering convection patterns (elongated in Taylor columns) and increasing the intensity of the thermal gradient needed to start convection (Chandrasekhar Reference Chandrasekhar1961). Adding the influence of global rotation, Takehiro et al. (Reference Takehiro, Ishiwatari, Nakajima and Hayashi2002) studied horizontal layers of fluid with lateral boundaries and various orientations of the rotation axis. They showed that, for a vertical axis of rotation, the behaviour of FF convection at the threshold becomes similar to the FT case when rotation is increased. In the case of a horizontal rotation axis, the two set-ups remain different, the FF one being characterised by a zero critical wavenumber. More recently, Falsaperla & Mulone (Reference Falsaperla and Mulone2010) conducted studies on a Cartesian system with Robin boundary conditions influenced by weak rotation and also observed a monotonous transition from FF to FT when varying the Biot number. Influence of Robin boundary conditions has been mainly studied in Cartesian geometry. On the other hand, for geophysical and planetary relevance, both rotating and non-rotating convection in spherical shells have been widely studied, but mostly using traditional boundary conditions (FF or FT).
The crystallization of the terrestrial magma ocean is a complex question which cannot be reduced to the influence of a Robin boundary condition. Nevertheless, we have chosen to first focus on one of the fundamental aspects of our system of interest. The goal of this work is to study Rayleigh–Bénard convection in a spherical shell subjected to a Robin boundary condition at its upper boundary, with and without rotation. We first determine numerically the characteristics of the onset of convection with a linear stability analysis, and then we explore the nonlinear properties of the same system in terms of convection efficiency. In all the following we focus first on the two end-member situations, the FF and FT configurations, before studying intermediate cases by varying the value of  ${{\textit {Bi}}}$. The robustness of these observations is tested by varying the value of the Prandtl number.
2. Methods
2.1. Physical system
We consider a spherical shell of aspect ratio  $\eta = r_{i} / r_{e} = 2/3$, with
 $r_{e}$ and
 $r_{i}$ the external and internal radii, respectively, subjected to rotation of vector
 $\varOmega \boldsymbol {e_z}$ and filled with a Newtonian fluid of constant kinematic viscosity
 $\nu$, thermal conductivity
 $k$, reference density
 $\rho _0$, specific heat capacity
 $c_{p}$ and thermal expansivity
 $\alpha$.
The system is subjected to a radial gravity field  $\boldsymbol {g}=-g\boldsymbol {e_{r}}$,
 $g$ being uniform. Note that this uniform value is relevant for thin shells (if the shell is thin enough, any variation of gravity inside can be neglected) but also generally speaking for Earth mantle studies. Indeed, due to the density distribution within the Earth, gravity at the bottom of the mantle is approximately
 $10.7\ \textrm {m}\,\textrm {s}^{-2}$ with variations below
 $10\,\%$ up to the surface (Dziewonski & Anderson Reference Dziewonski and Anderson1981). Since our system of interest is the liquid equivalent of the current Earth mantle, we have chosen to use a constant gravity. Nevertheless, other density distributions in other differentiated rocky bodies (Moon, Mars, Mercury,
 $\ldots$) may lead to a different gravity profile in their respective mantle. Consequently, other radial dependencies of the gravity field can be used in other contexts (e.g.
 $g \propto r$ for uniform density models or
 $g \propto {1}/{r^{2}}$ for a centrally condensed mass).
The physical behaviour of the system is basically monitored by three equations of conservation (conservation of momentum, mass and energy) associated with boundary conditions. We assume the Boussinesq approximation, that is, variations of density are neglected except in their contributions to the buoyancy force in which the density varies as a function of
 \begin{equation} \frac{\rho}{\rho_{0}}=1-\alpha(T'-T_{0}), \end{equation}
 $\rho$ being the density, while
 $\rho _{0}$ and
 $T_{0}$ are reference values of density and temperature and
 $T'$ the temperature anomaly around
 $T_0$.
The reference state is motionless (uniform zero velocity) and follows a radial conductive temperature profile  $T_{ref}$ between the two boundaries with given temperatures (FT),
 \begin{equation} T_{ref}(r) = \Delta T\frac{r_{i}}{r_{e}-r_{i}} \left( \frac{r_{e}}{r}-1 \right) + T_0, \end{equation}
where  $\Delta T$ is the total temperature difference of the reference profile across the shell. In the Boussinesq approximation the value of
 $T_0$ plays no role and any value can be used such that the reference temperature profile satisfies the Robin boundary condition. In the following, temperatures are defined with respect to this reference.
The problem is rendered dimensionless using  $r_{e}$ as the length scale,
 ${\nu }/{r_{e}}$ as the velocity scale,
 $\Delta T$ as the temperature scale and
 $\rho _0 \nu \varOmega$ as the pressure scale. The system is characterised by the following dimensionless numbers: the Biot number
 ${{\textit {Bi}}}$, the Prandtl number
 ${{\textit {Pr}}}=\nu \rho _0 c_{p} / k$, the Rayleigh number
 ${{\textit {Ra}}}=({g \alpha \Delta T r_{e}^{3}\rho _0 c_p})/{\nu k}$ and the Ekman number
 ${{\textit {Ek}}}={\nu }/{\varOmega r_{e}^{2}}$. The dimensionless conservation equations are then
 \begin{equation} \frac{\partial \varTheta }{\partial t} + \boldsymbol{u}\boldsymbol{\cdot} \boldsymbol{\nabla} \left( \varTheta + \frac{T_{ref}}{\Delta T} \right)=\frac{1}{{{\textit{Pr}}}} \boldsymbol{\nabla} ^{2} \varTheta \end{equation}
for the energy,
 \begin{equation} {{\textit{Ek}}}\left(\frac{\partial \boldsymbol{u}}{\partial t}+\boldsymbol{u}\boldsymbol{\cdot}\boldsymbol{\nabla} \boldsymbol{u} \right) +2 \boldsymbol{e}_{z} \times \boldsymbol{u} + \boldsymbol{\nabla} \varPi = {{\textit{Ek}}}\boldsymbol{\nabla} ^{2} \boldsymbol{u} + {{\textit{Ra}}} {{\textit{Pr}}} {{\textit{Ek}}} \varTheta \boldsymbol{e}_r \end{equation}
for the momentum and
 \begin{equation} \boldsymbol{\nabla} \boldsymbol{\cdot} \boldsymbol{u} = 0 \end{equation}
for the mass, with  $\boldsymbol {u},\ \varTheta \ \mathrm {and}\ \varPi$ the fluid velocity, the temperature anomaly and the reduced pressure, respectively.
Mechanical boundary conditions imposed on  $\boldsymbol {u}$ are non-penetrative (
 $u_r=0$), stress free (i.e. tangential stress is null, that is, with
 $[ \boldsymbol \sigma ]$ the tensor of viscous stresses of the fluid,
 $\boldsymbol {t}$ the tangential and
 $\boldsymbol {n}$ normal vector to the interface)
 $([\boldsymbol \sigma ]\boldsymbol {\cdot }\boldsymbol n)\boldsymbol {\cdot }\boldsymbol t=0$) at the top (
 $r=r_e$) and no slip (
 $\boldsymbol {u}=\boldsymbol {0}$) at the bottom (
 $r=r_i$). For the thermal boundary conditions, we impose a FT at the bottom (FT, i.e.
 $\varTheta (r_{i})=0$) and a Robin boundary condition at the top (i.e.
 $- \beta r_e \varTheta (r_{e}) = ({\partial \varTheta }/{\partial r})(r_{e})$).
These conditions can be relevant for modelling a fluid undergoing a phase change at its bottom interface and subject to a radiative equilibrium at the top surface. Indeed, pressure at the bottom is set by the fixed depth of the interface, which imposes the value of the temperature thanks to the liquid–solid equilibrium. Concerning the top interface, radiative equilibrium between a layer of fluid, with surface temperature  $T(r_e)$ and surface heat flux
 $-k \frac {\partial T}{\partial r}(r_e)$, and an isothermal atmosphere at temperature
 $T_{a}$ leads to an energy balance,
 \begin{equation} \sigma (T_{a}^{4}-T^{4}(r_e)) = k \frac{\partial T}{\partial r}(r_e), \end{equation}
where  $\sigma \simeq 5.67 \times 10^{-8}\ \mathrm {W}\,\mathrm {m}^{-2}\,\mathrm {K}^{-4}$ is the coefficient of the Stefan–Boltzmann law giving the amount of heat flux produced by a black body at a given temperature. We further introduce the reference depth-dependent temperature
 $T_{ref}$ such that its value at the surface is set by
 \begin{equation} \sigma (T_{a}^{4} - T_{ref}^{4}(r_e) ) = k \frac{\partial T_{ref}}{\partial r}(r_e), \end{equation}
and the depth-dependent temperature anomaly  $\theta = T-T_{ref}$. Assuming that
 $\theta \ll T_{0}$, (2.6) can be expanded to give
 \begin{equation} -4\sigma T_{ref}^{3}(r_e) \theta = k\frac{\partial \theta}{\partial r}(r_e). \end{equation}
Generally speaking, a Robin boundary condition applied on a field  $Y$ and its spatial derivative with respect to a space variable
 $l$ at a boundary
 $r_0$ can be expressed as
 ${{\textit {Bi}}}\, Y+{\partial Y}/{\partial l}=0$. With that definition,
 ${{\textit {Bi}}}=0$ imposes a FF boundary condition (zero spatial derivative, i.e. flux) while
 ${{\textit {Bi}}}=+\infty$ imposes a FT boundary condition (temperature anomaly is zero at the interface).
The Biot number in the usual thermal context is written as  ${{\textit {Bi}}} = h L/k$, with
 $h$ the convective heat transfer coefficient having the dimension of a
 $\textrm {W}\,\textrm {m}^{-2}\,\textrm {K}^{-1}$,
 $k$ the thermal conductivity of the affected body and
 $L$ its typical length scale. Here
 ${{\textit {Bi}}}$ can be estimated by different means depending on the type of heat transfer modelled. For material pieces in contact with a conductive–convective atmosphere, the thermal exchanges can be modelled by a thermal Newton's law with
 $h$ a coefficient of the order of
 $10\ \textrm {W}\,\textrm {m}^{-2}\,\textrm {K}^{-1}$. As an illustration a metre-size piece of copper in contact with the atmosphere is characterised by
 ${{\textit {Bi}}} \simeq 0.1$. Conversely, for a same size polystyrene piece,
 ${{\textit {Bi}}} \simeq 1000$. As a final example, a 5 cm glass of water cooled by contact with air in usual conditions of pressure and temperature is characterised by
 ${{\textit {Bi}}} \simeq 5$. All these estimations can be computed from generic or specific handbooks (e.g. Kreith Reference Kreith2000).
In the case described in (2.8),  $h=4\sigma T_{a}^{3}$ so that
 \begin{equation} {{\textit{Bi}}} = \frac{4\sigma T_{a}^{3}L}{k}. \end{equation}
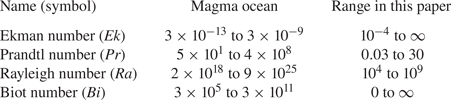
Here we choose to use the thickness of the shell  $L = r_e - r_i$ as the typical length scale to compute and express the Biot number. Even if our modelling remains unspecific to magma oceans (we basically model a spherical rotating shell of fluid), we should mention the estimated values of the dimensionless numbers characterising a terrestrial magma ocean modelled by our method. Parameters given are those of a terrestrial fully liquid magma ocean. Values are computed in both cases and reported in table 1. These parameters constitute extreme conditions for numerical simulations (for example, in terms of
 ${{\textit {Ek}}}$) which cannot be considered with current computational resources. Since we focus here on a specific aspect of such a system (modelled by a Robin boundary condition), we restricted our study to a more convenient parameter space (see table 1).
Dimensionless numbers characterising a terrestrial global magma ocean, maximal and minimal values are given, computed from Solomatov (Reference Solomatov2007), Maas & Hansen (Reference Maas and Hansen2015) and Snyder, Gier & Carmichael (Reference Snyder, Gier and Carmichael1994) (for typical values of the thermal conductivity). The extremal values for each parameter cover the full range between a fully liquid to a quasi-solid (because of a high proportion of crystals in suspension) magma ocean. Finally, the range of parameters used in this study is precised.

In addition to radiative equilibrium, a Robin boundary condition can also model thermal contact between two layers of distinct conductivity ( $\lambda _1$ and
 $\lambda _2$) and thickness (
 $L_1$ and
 $L_2$). In that case, following Guillou & Jaupart (Reference Guillou and Jaupart1995), a Robin boundary condition can be written at the frontier. It links linearly dimensionless temperature and flux by a factor
 $Bi = {\lambda _2 L_1 }/{L_2 \lambda _1}$. Such a model could be used for internal oceans of icy satellites of Jupiter (Sotin & Tobie Reference Sotin and Tobie2004) or Saturn (Collins & Goodman Reference Collins and Goodman2007) in which a layer of liquid water lies below an ice crust. In that case, the ratio of the conductivities would be typically around three (Kreith Reference Kreith2000). This means that a thick ice layer (typically
 $300$ km) above a thin ocean (typically
 $10$km) produces a small
 $Bi \simeq 0.1$, while a thick ocean below a thin icy crust (reverse thickness ratio) produces a large
 $Bi \simeq 10$ configuration.
2.2. Numerical tools
We use the eigenvalue solver SINGE (freely available at https://bitbucket.org/vidalje/singe; Vidal & Schaeffer Reference Vidal and Schaeffer2015; Monville et al. Reference Monville, Vidal, Cébron and Schaeffer2019) in order to determine the critical Rayleigh number of the system,  ${{\textit {Ra}}}_C$, and, in terms of spherical harmonics, the order of azimuthal symmetry
 $m$ of the most unstable mode at the onset of convection in our system. SINGE is a Python code conceived to determine the eigenvalues and eigenmodes of incompressible and stratified fluids in spherical cavities. SINGE uses the SLEPc solver (Vidal & Schaeffer Reference Vidal and Schaeffer2015), finite difference (second-order scheme with
 $N_{r}$ points) in the radial direction and spherical harmonic decomposition, with degree
 $l$ and azimuthal wavenumber
 $m$ truncated at (
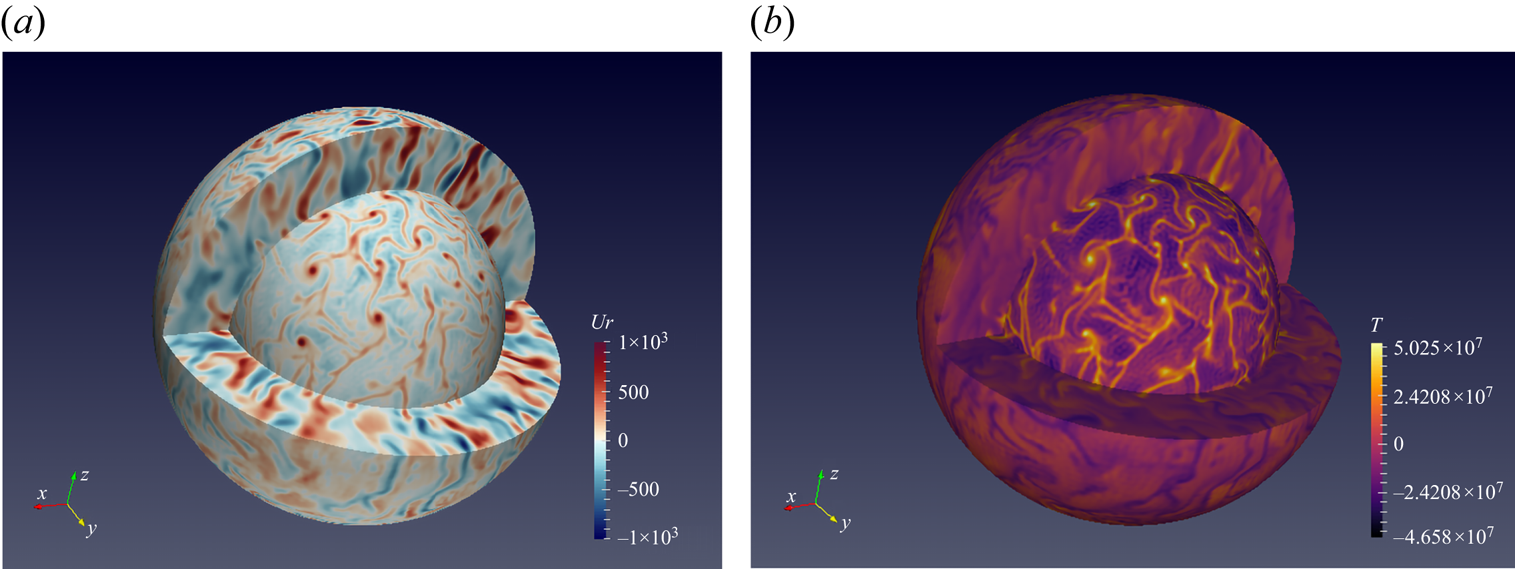
 $l_{max},m_{max}$). Equatorial symmetry or anti-symmetry is imposed. The nonlinear problem is solved by the XSHELLS code (freely available at https://bitbucket.org/nschaeff/xshells). This geodynamo code has been used to solve convection in a spherical rotating shell (see, for example, Kaplan et al. (Reference Kaplan, Schaeffer, Vidal and Cardin2017) or Guervilly, Cardin & Schaeffer (Reference Guervilly, Cardin and Schaeffer2019)). XSHELLS solves the Navier–Stokes equation in a spherical set-up thanks to the toroidal–poloidal decomposition and a pseudo-spectral approach using the fast SHTns library (Schaeffer Reference Schaeffer2013). Poloidal and toroidal scalars as well as temperature are expanded over spherical harmonics truncated in a similar way to SINGE. In the radial direction, XSHELLS uses a second-order finite difference differentiation. Each simulation is run long enough to reach a statistically steady state. We then obtain a 3-D distribution of the anomalies of the main fields (temperature, velocity, etc.; see, for example, figure 1). We extract from these latter two-dimensional maps of anomalies or global quantities at a given time or compute time-average data. Both numerical codes have been modified for this study in order to take into account the Robin boundary conditions.
Three-dimensional visualization of radial velocity (a) and temperature anomaly (b) of a nonlinear computation. Simulation run for  ${{\textit {Ra}}}=9\times 10^{6}$,
 ${{\textit {Pr}}}=3$,
 ${{\textit {Ek}}}=10^{-4}$ and
 ${{\textit {Bi}}}=0$. Internal and external surfaces have been defined slightly outside boundary layers.

3. Linear stability analysis
3.1. Differences between FF and FT cases with respect to Ekman number
We determine the critical Rayleigh number and azimuthal wavenumber (when it is relevant) at the linear onset of convection for different rotation rates ( ${{\textit {Ek}}}=+\infty$ to
 $10^{-6}$), in both FF and FT end-member cases. We checked that the symmetric modes (with respect to the equatorial plane) are always the preferred unstable modes at the linear onset of convection (i.e. their
 $Ra_{C}$ is the smallest).
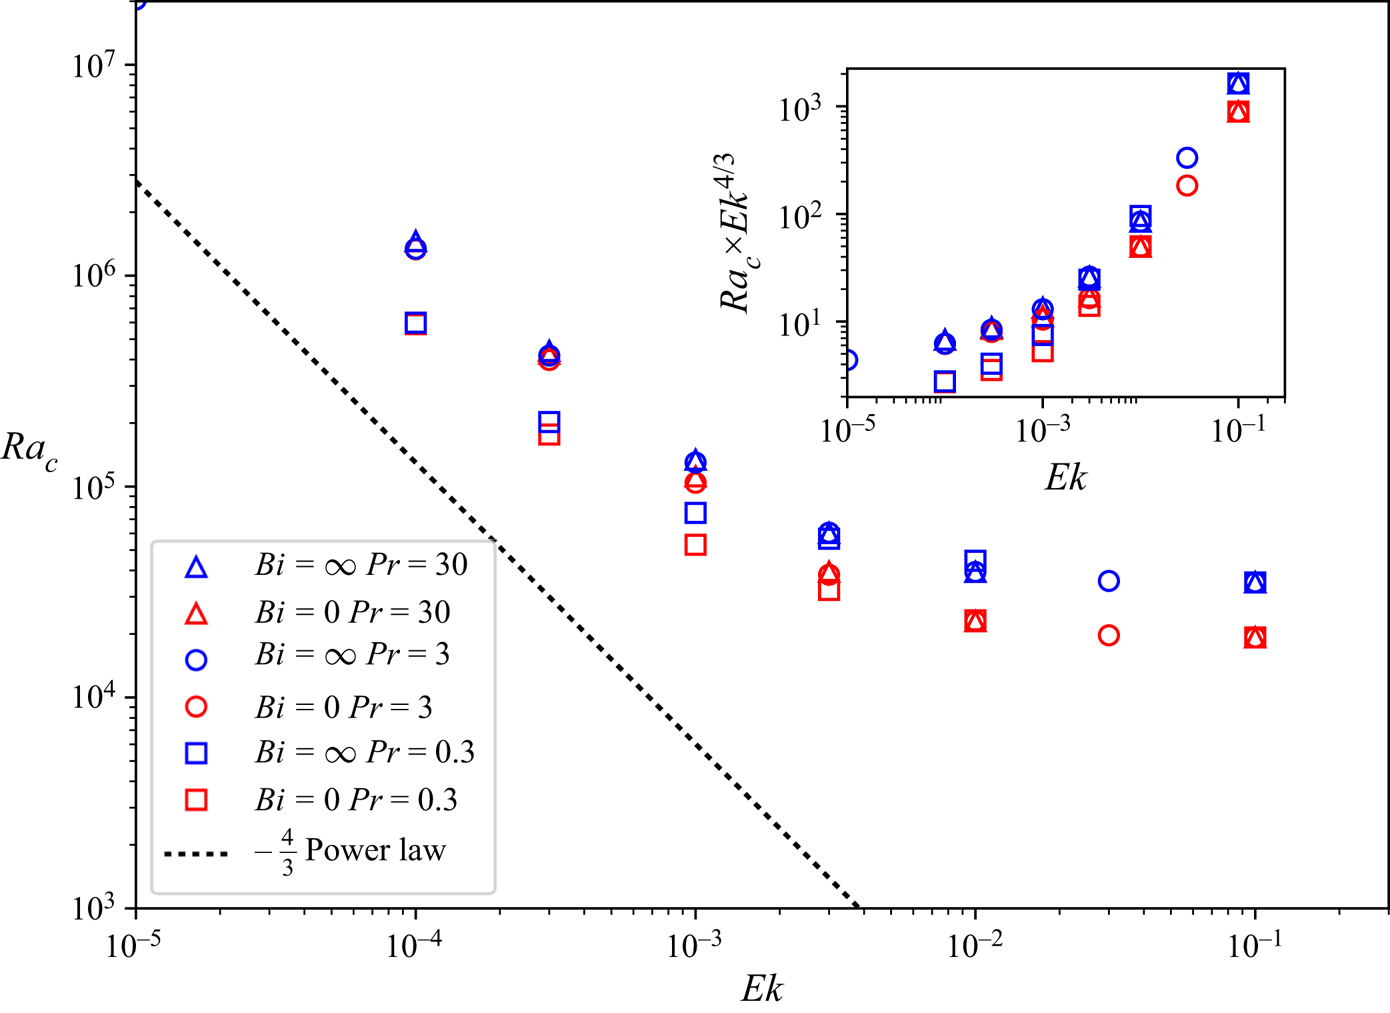
In figure 2 we plot  ${{\textit {Ra}}}_C$ as a function of
 ${{\textit {Ek}}}$, for different values of
 ${{\textit {Pr}}}$, in order to illustrate the existence of two regimes [expected from previous studies, e.g. (Gastine, Wicht & Aubert Reference Gastine, Wicht and Aubert2016) : in the first one (
 ${{\textit {Ek}}} \rightarrow +\infty$) rotation does not affect
 ${{\textit {Ra}}}_C$ while this number diminishes with
 ${{\textit {Ek}}}$ in the second regime. For small enough
 ${{\textit {Ek}}}$, the expected power law
 ${{\textit {Ra}}}_C \propto {{\textit {Ek}}}^{-4/3}$ is observed (Chandrasekhar Reference Chandrasekhar1953). Note that, although
 ${{\textit {Ra}}}_C$ is a relevant criterion to discriminate FF and FT set-ups at high values of the Ekman number, it is no longer the case when rotation impacts notably the critical Rayleigh number. The effect of the Prandtl number is contrasted: the general behaviour of
 ${{\textit {Ra}}}_C$ as a function of
 ${{\textit {Ek}}}$ is not affected by the value of
 ${{\textit {Pr}}}$ but its influence on the exact value of
 ${{\textit {Ra}}}_C$ depends on the Ekman number. For
 ${{\textit {Ek}}} \ge 10^{-1}$,
 ${{\textit {Pr}}}$ has no visible effect since cases are differentiated only by their boundary conditions. This is in line with the classical behaviour of non-rotating Rayleigh–Bénard convection for which the onset of convection is known to be independent of the value of the Prandtl number (e.g. Chandrasekhar Reference Chandrasekhar1961). On the other hand, for
 ${{\textit {Ek}}} \le 10^{-3}$, the
 ${{\textit {Pr}}}=0.3$ cases become distinct from the cases with larger values of
 ${{\textit {Pr}}}$ (
 ${{\textit {Pr}}}=3$ or
 $30$).
Critical Rayleigh number  ${{\textit {Ra}}}_C$ of FF and FT cases as a function of Ekman number
 ${{\textit {Ek}}}$ for Prandtl number values
 ${{\textit {Pr}}}=0.3$,
 $3$ and
 $30$. For evanescent
 ${{\textit {Ek}}}$,
 ${{\textit {Ra}}}_C$ scales as
 ${{\textit {Ek}}}^{-4/3}$ (represented by the dotted line). The inset is a compensated plot of the same data points.

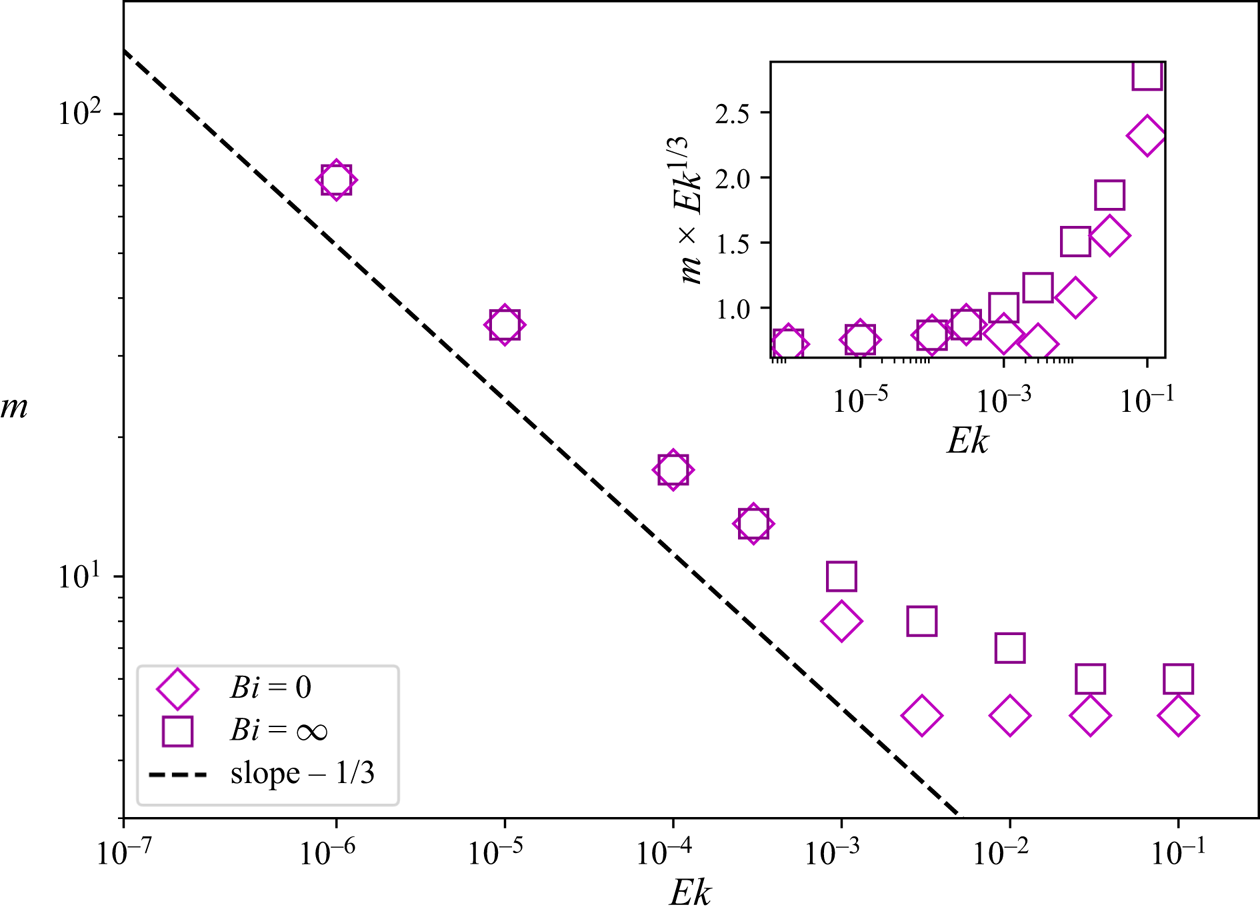
Let us now turn to the azimuthal structure of the flow at the onset of convection. Figure 3 shows the critical value of the azimuthal number  $m$ for the most unstable mode for both boundary conditions as a function of the Ekman number. We observe no difference between FF and FT configurations for high rotation rates: in the limit of small values of
 ${{\textit {Ek}}}$,
 $m$ scales as
 ${{\textit {Ek}}}^{-1/3}$, as expected (Busse Reference Busse1970). For large values of
 ${{\textit {Ek}}}$, the critical value of
 $m$ tends toward a constant. In the case of
 ${{\textit {Bi}}}=0$, the transition to a constant value of
 $m$ happens sharply at around
 ${{\textit {Ek}}}=2 \times 10^{-3}$. This particularity may be compared with the transition described by Falsaperla & Mulone (Reference Falsaperla and Mulone2010) at
 ${{\textit {Ek}}} \simeq 10^{-2}$.
Values of the critical azimuthal wavenumber  $m$ as a function of
 ${{\textit {Ek}}}$ for both FF (
 ${{\textit {Bi}}}=0$) and FT (
 ${{\textit {Bi}}}=\infty$) cases. For small enough values of
 ${{\textit {Ek}}}$,
 $m$ scales as
 ${{\textit {Ek}}}^{-1/3}$ (represented by the dashed line). The inset is a compensated plot of the same data points.

We should also mention that in the non-rotating case,  ${{\textit {Ek}}}=\infty$, the
 $m$ number is not relevant. Indeed in a non-rotating set-up, the most unstable mode is degenerated in terms of
 $m$ number. Nevertheless, in that case, the critical degree
 $l$ can be determined and, with our chosen set-up, is equal to 5 for a FF boundary condition and 6 for a FT one.
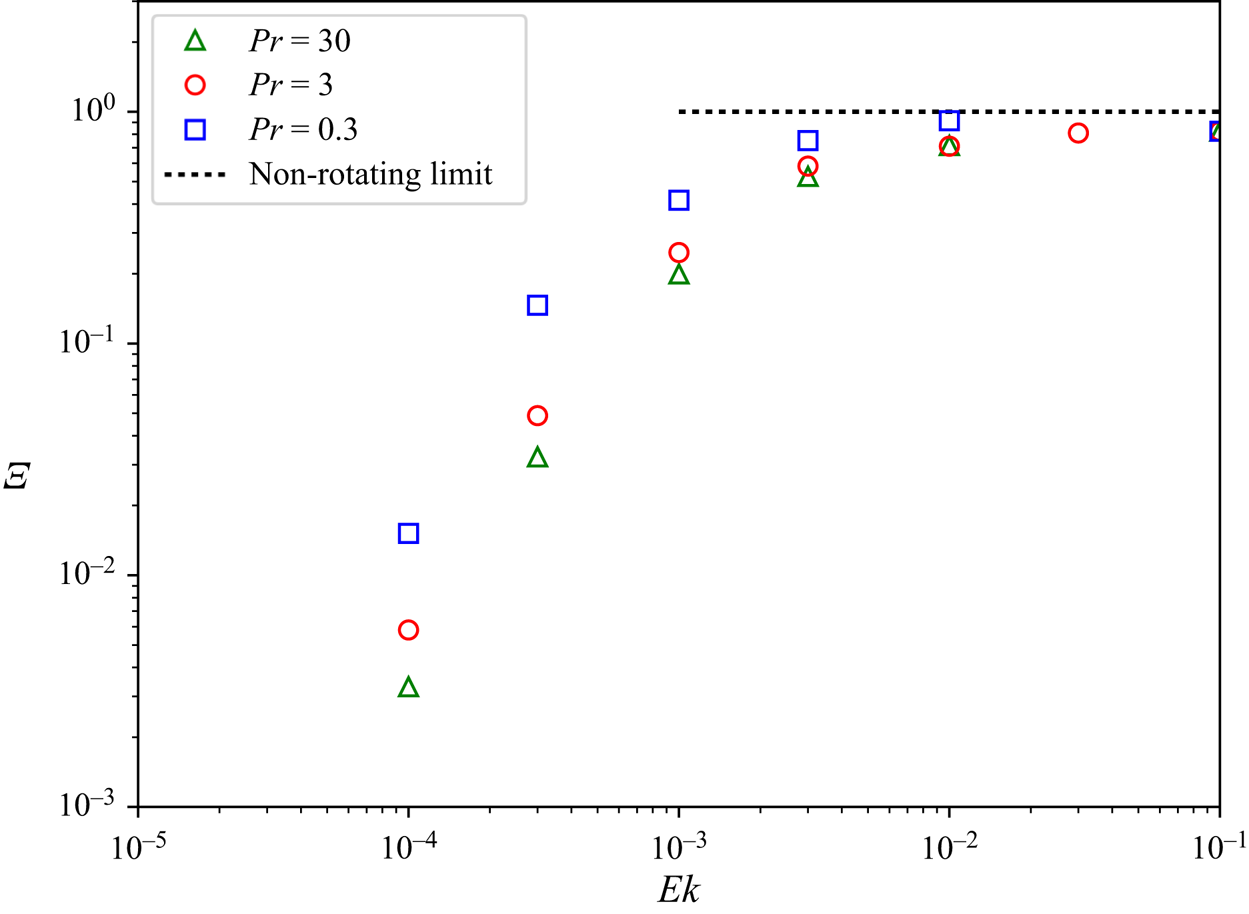
To observe more precisely the distinction between FF and FT cases, we plot in figure 4,
 \begin{equation} \varXi= \frac{{{\textit{Ra}}}_C({{\textit{Bi}}}=\infty,{{\textit{Ek}}})-{{\textit{Ra}}}_C({{\textit{Bi}}}=0,{{\textit{Ek}}})}{{{\textit{Ra}}}_C({{\textit{Bi}}}=\infty,{{\textit{Ek}}}=\infty)-{{\textit{Ra}}}_C({{\textit{Bi}}}=0,{{\textit{Ek}}}=\infty)}, \end{equation}
which quantifies the normalised difference between the FF and FT cases as a function of  ${{\textit {Ek}}}$. By definition, we have
 $\varXi \rightarrow 1$ when
 ${{\textit {Ek}}} \rightarrow +\infty$.
Plot of  $\varXi$ (i.e. difference of
 ${{\textit {Ra}}}_C$ between FF and FT cases for a given
 ${{\textit {Ek}}}$ normalised by the non-rotating difference (cf. (3.1))) as a function of
 ${{\textit {Ek}}}$. Here
 $\varXi$ decreases with the same general behaviour independently from
 ${{\textit {Pr}}}$.

For  ${{\textit {Ek}}}<10^{-3}$, as shown in figure 4, decreasing the Ekman number decreases the difference between FF and FT cases, independently from
 ${{\textit {Pr}}}$. This growing similarity of
 ${{\textit {Ra}}}_C(FF)$ and
 ${{\textit {Ra}}}_C(FT)$ when rotational effects are increased is in good accordance with the conclusions of Takehiro et al. (Reference Takehiro, Ishiwatari, Nakajima and Hayashi2002). Indeed they show, in the case of top and bottom FF boundary conditions and for Cartesian models in which
 $\boldsymbol {\varOmega }$ is vertical, that when
 ${{\textit {Ek}}}$ goes to zero,
 ${{\textit {Ra}}}_C(FF)\rightarrow {{\textit {Ra}}}_C(FT)$. Consequently, we have chosen to limit our study to
 ${{\textit {Ek}}} \geq 10^{-4}$.
Even though high similarities of  ${{\textit {Ra}}}_C$ and azimuthal periodicity of the flow are observed at high rotation rates between the FF and FT cases, the structure of the solution, in particular its radial shape, depends strongly on the choice of boundary condition. In the FT case the temperature is uniform at the boundary and lateral heterogeneity is restricted to the bulk of the domain, whereas in the FF case the temperature is variable at the boundary. This is shown later in figure 7. After having considered the two extreme regimes (FF:
 ${{\textit {Bi}}} \rightarrow 0$ and TF:
 ${{\textit {Bi}}} \rightarrow +\infty$), we can now focus on the intermediate case in which the Biot number is arbitrary.
3.2. Transition from FF to FT owing to the Robin boundary condition
We determine the critical Rayleigh number for different values of the Biot number with various Ekman numbers in the same range as formerly. Increasing  ${{\textit {Bi}}}$ from 0 to
 $+\infty$ tunes the boundary condition from a FF upper boundary condition to a FT one (FF to FT transition). We can reasonably expect that the amplitude of this transition is limited by the extremal cases described in § 3.1. Since the convective set-up can evolve continuously from a FF to FT configuration thanks to the Robin boundary condition, we expect (as the simplest hypothesis) significant influence of this condition on the onset only in the first regime (high Ekman numbers), in which a large
 ${{\textit {Ra}}}_C$ difference is observed.
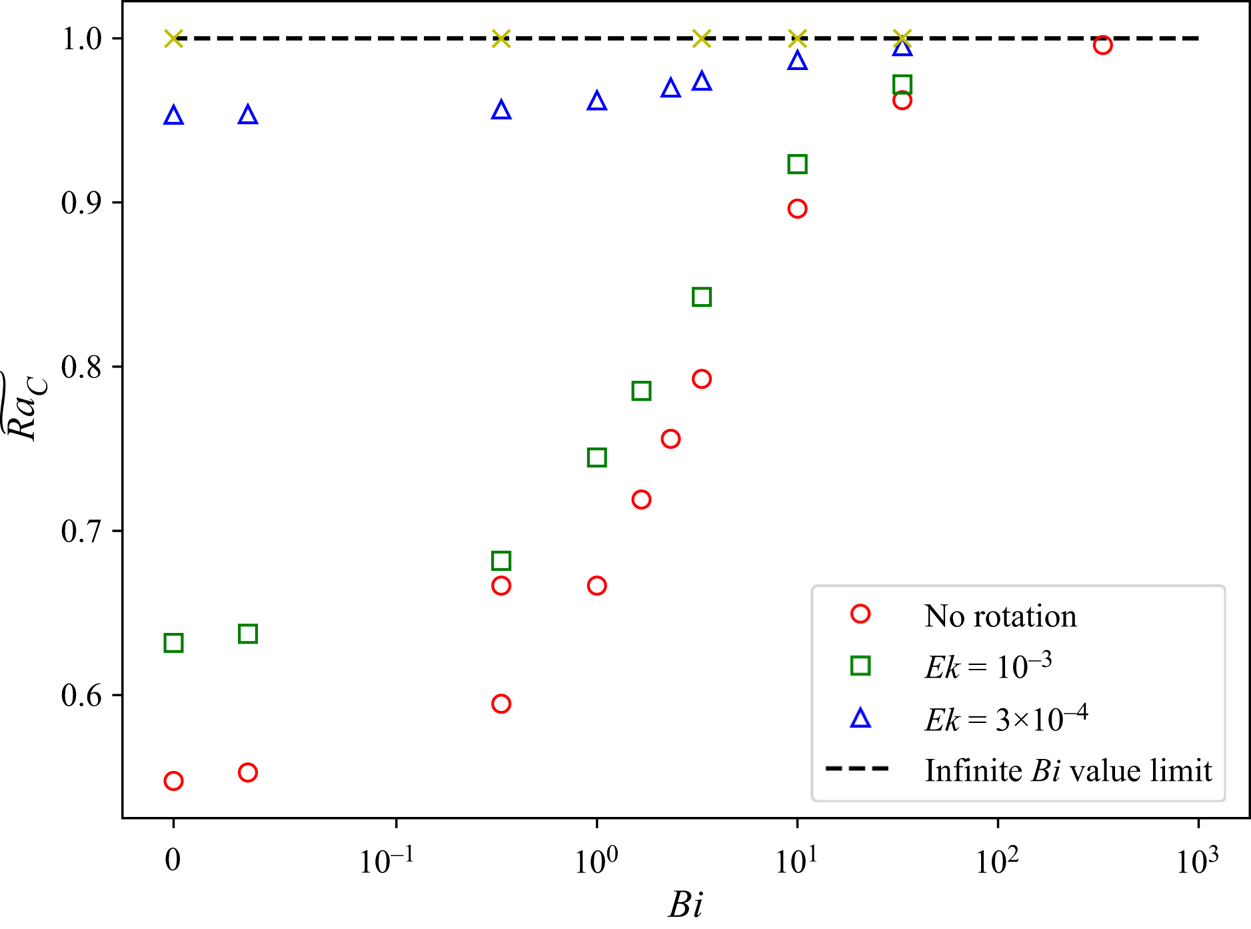
In order to determine the evolution of the critical Rayleigh number with respect to the Biot number, we plot in figure 5, for a given Ekman number, its normalised values,
 \begin{equation} \widetilde{{{\textit{Ra}}}_C}=\frac{{{\textit{Ra}}}_C({{\textit{Bi}}})}{{{\textit{Ra}}}_C({{\textit{Bi}}}=\infty)}. \end{equation}
A continuous and monotonous transition can be observed in terms of the critical Rayleigh number. Without rotation, the effect is the largest, with a minimum ratio of 0.5 ( ${{\textit {Ra}}}_C(FF)={{\textit {Ra}}}_C(FT)/2$). As expected from the previous section, the amplitude of the transition is reduced when the Ekman number is decreased. Finally, most of the transition occurs for
 ${{\textit {Bi}}} \in [0.03,30]$.
Plot of  $\widetilde {{{\textit {Ra}}}_C}$ (cf. (3.2)) as a function of
 ${{\textit {Bi}}}$ for
 ${{\textit {Pr}}}=3$. The amplitude of the continuous transition from FF to FT is decreased when
 ${{\textit {Ek}}}$ is reduced. By definition,
 $\widetilde {{{\textit {Ra}}}_C} \rightarrow 1$ when
 ${{\textit {Bi}}} \rightarrow \infty$ (i.e. when the boundary condition goes to FT). The axis of abscissas uses a hybrid linear-logarithmic scale.

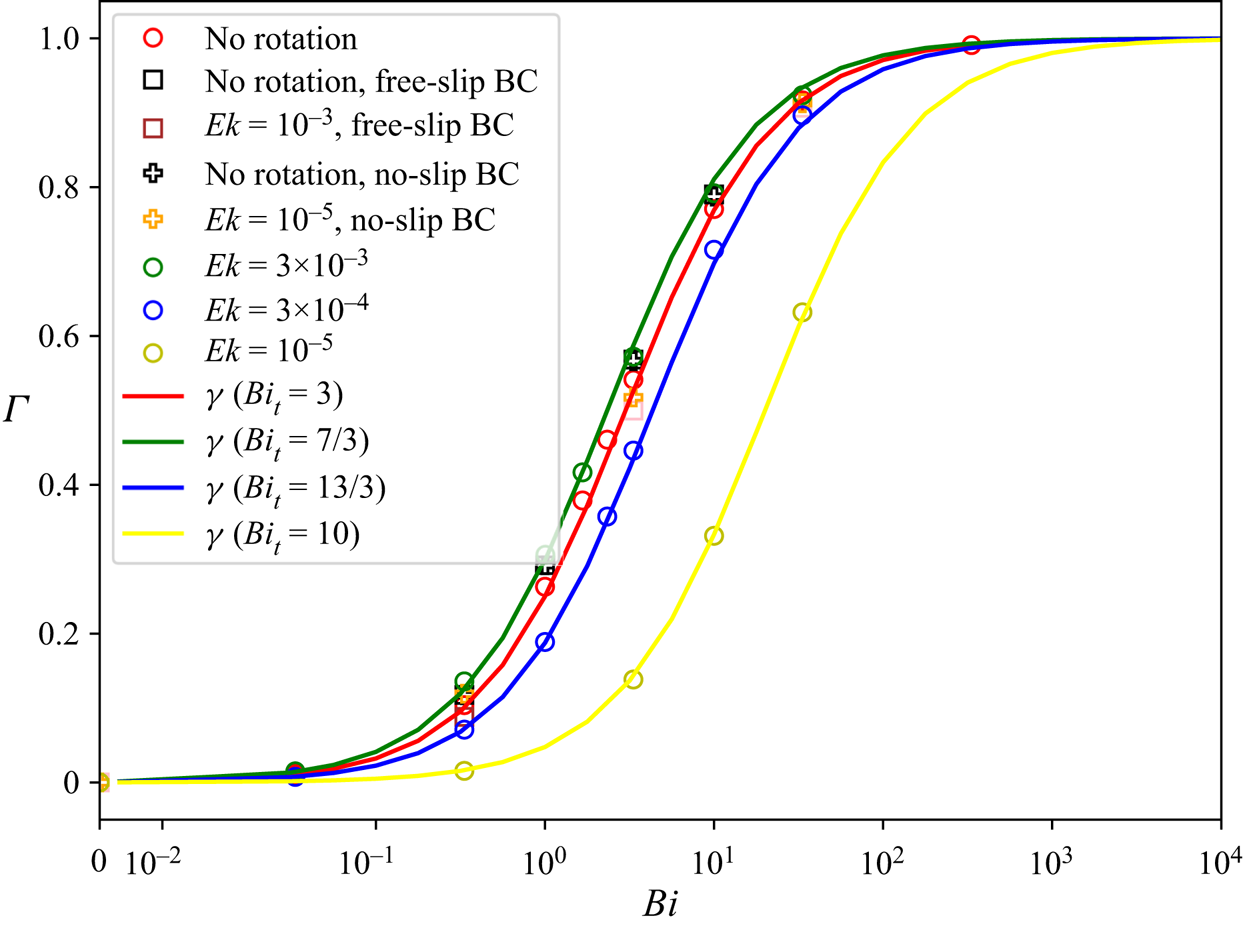
In order to further characterise the transition of the solution as a function of the Biot number, we define
 \begin{equation} \varGamma = \frac{{{\textit{Ra}}}_C({{\textit{Bi}}})-{{\textit{Ra}}}_C({{\textit{Bi}}}=0)}{{{\textit{Ra}}}_C({{\textit{Bi}}}=\infty)-{{\textit{Ra}}}_C({{\textit{Bi}}}=0)}, \end{equation}
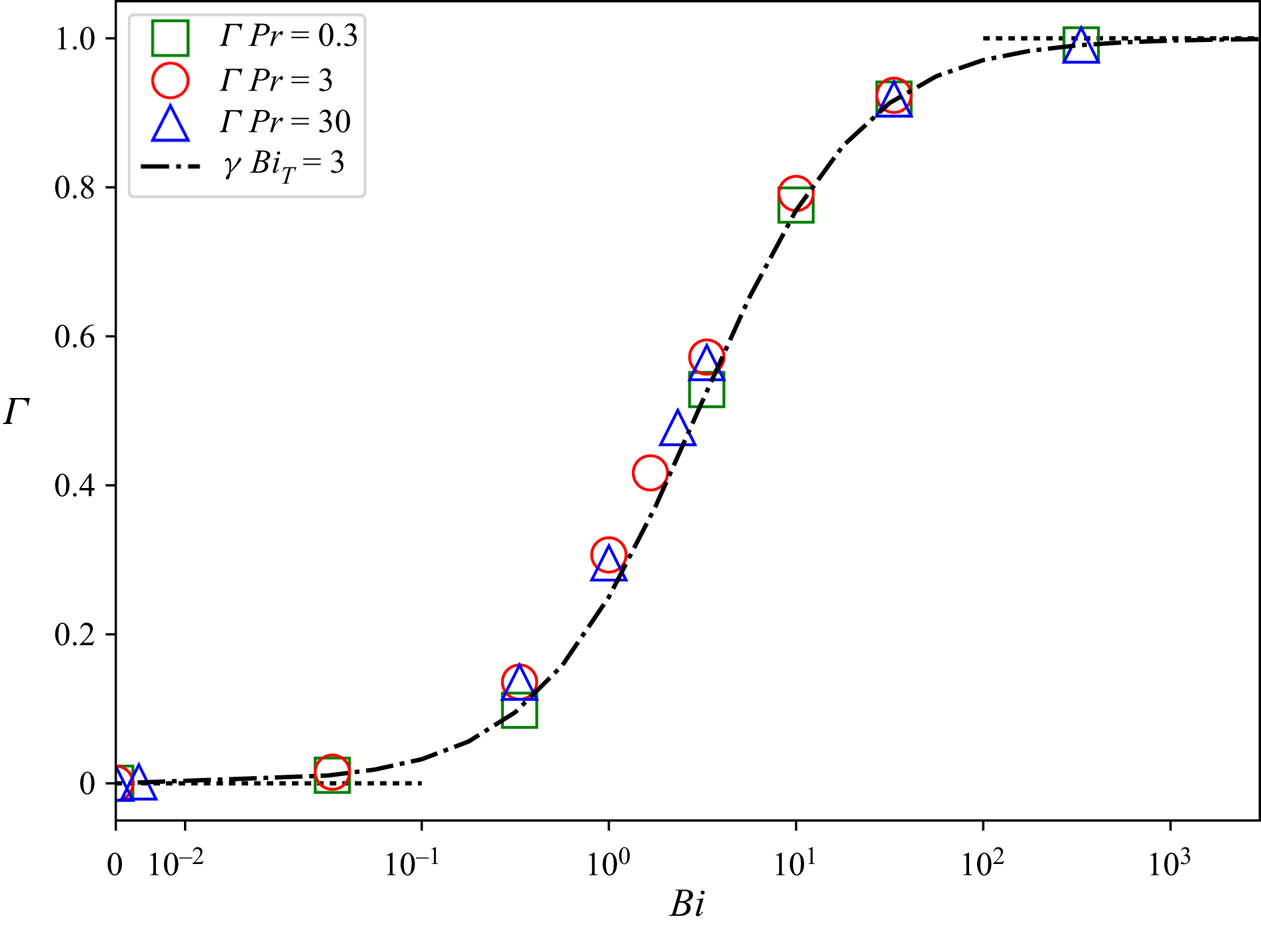
which is plotted as a function of  ${{\textit {Bi}}}$ in figure 6, for various values of the Ekman number. This quantity allows us to compare the behaviour of the transition regardless of its amplitude set uniformly to 1. Worth noting that the transition shows a common behaviour for different combinations of mechanical boundary conditions (symmetric free-slip or no-slip boundary conditions) and rotation rates. The only noticeable difference from one configuration to the other is the location of the transition. Indeed, we are able to model every transition by
 \begin{equation} \gamma=\frac{{{\textit{Bi}}}}{{{\textit{Bi}}}_{t}+{{\textit{Bi}}}}, \end{equation}
where  ${{\textit {Bi}}}_{t}$ is an unknown function of the Ekman number. This model, in which we estimated the suitable
 ${{\textit {Bi}}}_{t}$, shows good agreement with data (figure 6). We observe that, for moderate rotation rates (
 ${{\textit {Ek}}}>10^{-3}$), this threshold is almost constant with
 ${{\textit {Bi}}}_{t} \approx 3$. This sets the intermediate regime roughly between
 ${{\textit {Bi}}}=0.3$ and
 ${{\textit {Bi}}}=30$. The evolution of the
 ${{\textit {Bi}}}_{t}$ parameter with the Ekman number is not monotonous: it first decreases with decreasing
 ${{\textit {Ek}}}$ then increases and becomes larger than its value for
 ${{\textit {Ek}}}=\infty$ when
 ${{\textit {Ek}}}<10^{-3}$. Nevertheless, as mentioned previously in § 3.1, the amplitude of the transition – in term of
 ${{\textit {Ra}}}_C$ – becomes insignificant with such small values of the Ekman number.
Plot of  $\varGamma = ({{{\textit {Ra}}}_C({{\textit {Bi}}})-{{\textit {Ra}}}_C({{\textit {Bi}}}=0)})/({{{\textit {Ra}}}_C({{\textit {Bi}}}=\infty )-{{\textit {Ra}}}_C({{\textit {Bi}}}=0)})$ as a function of
 ${{\textit {Bi}}}$ for various velocity boundary conditions at the top of the sphere and values of
 ${{\textit {Ek}}}$,
 ${{\textit {Pr}}}=3$. It illustrates the transition of
 ${{\textit {Ra}}}_C$ from FF values (
 $\varGamma = 0$) to FT (
 $\varGamma = 1$) values. If a mechanical boundary condition is mentioned, this one is imposed at both boundaries, if not, the usual set-up (free slip at the top, no slip at the bottom) is used; see § 2.1. The axis of abscissas uses a hybrid linear-logarithmic scale.

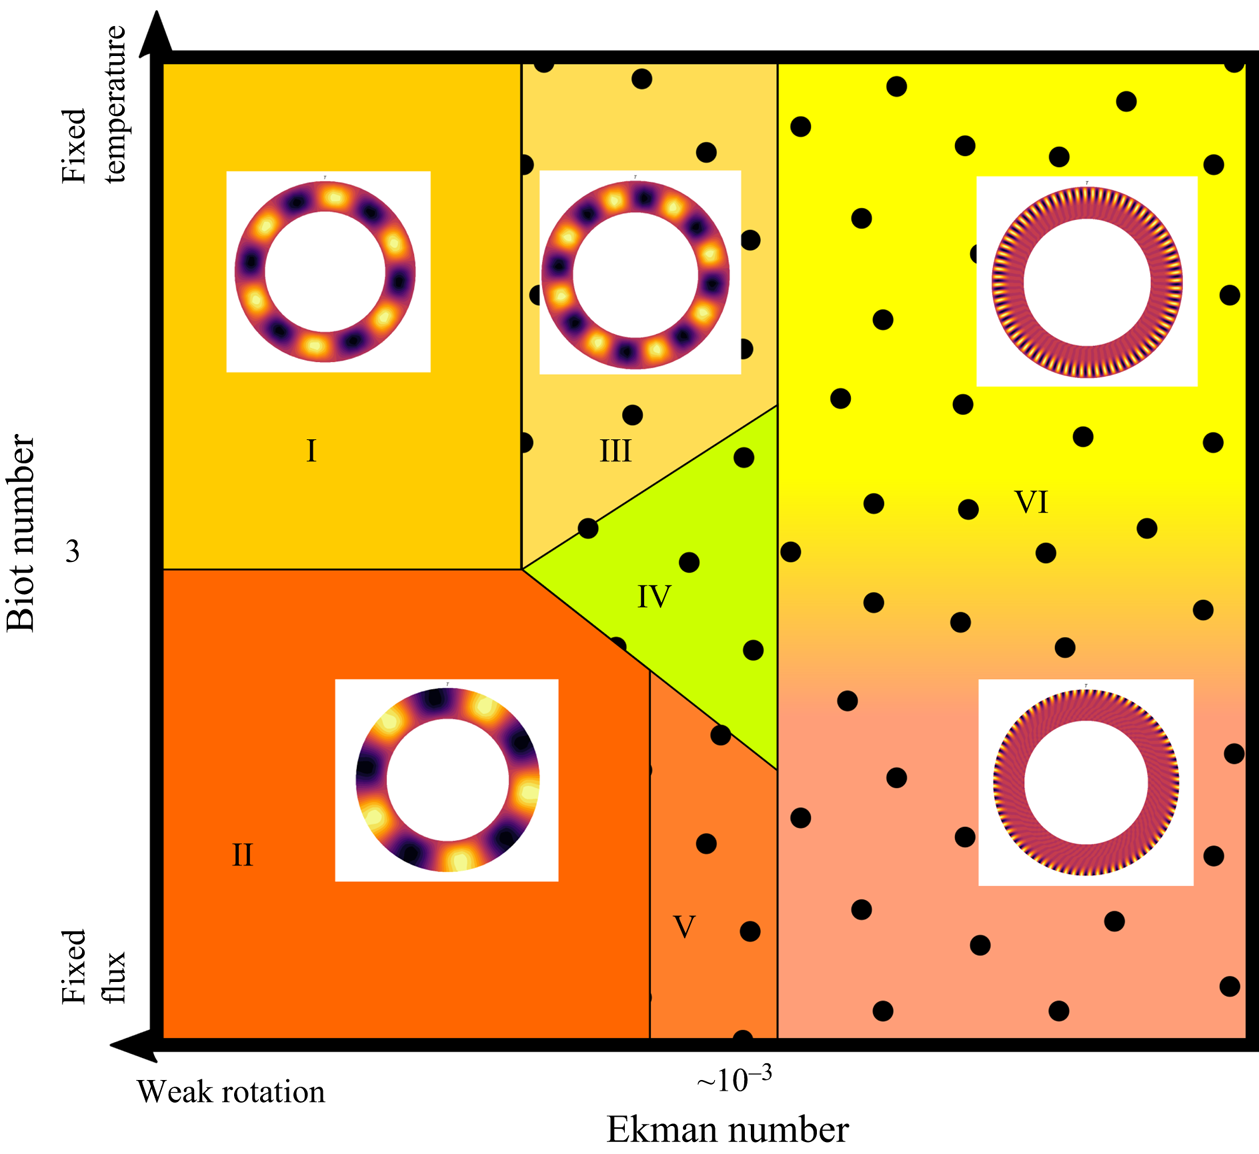
We further discuss the evolution of the solution structure at the onset of convection as a function of the Biot number. Following the results obtained for the two end-member cases of FF and FT situations, discussed in § 3.1, we first study whether the azimuthal  $m$ number of the selected mode depends on the Biot and/or Ekman numbers. This enables us to build a schematic phase diagram of the flow structure at the onset, shown in figure 7.
Phase diagram of the solution structure at the linear onset of convection as a function of  ${{\textit {Ek}}}$ and
 ${{\textit {Bi}}}$, typical structures of temperature anomalies and dependence on
 ${{\textit {Bi}}}$ or
 ${{\textit {Ek}}}$ is mentioned for each area. (I) Fixed temperature solution independent of rotation with a constant value of
 $m$, (II) FF solution independent of rotation with a constant value of
 $m$, (III) FT solution affected by rotation (
 $m$ increases with rotation), (IV) intermediate structure, (V) FF solution affected by rotation, (VI) common structure at high rotation rate.

In the far left part (high  ${{\textit {Ek}}}$) solutions are weakly affected by rotation and can be described as FF-like or FT-like structures. When the Ekman number decreases, the solution becomes affected by rotation showing a smaller azimuthal number, i.e. a larger
 $m$ value. Moreover, intermediate lateral structures appear for intermediate Biot numbers, these cases show
 $m\in [m({{\textit {Bi}}}=0),m({{\textit {Bi}}}\rightarrow +\infty )]$. Finally, when the Ekman number is very small, the azimuthal symmetry becomes independent of the Biot number. Nevertheless, FF and FT cases remain distinct since the radial extension is still a discriminating diagnostic. Indeed, FF configurations can be characterised by a smaller radial extension of the temperature perturbation compared with FT set-ups. Also, in the case of FF (and for
 ${{\textit {Bi}}} \lesssim 30$), the temperature perturbation extends to the boundary whereas it is zero at the boundary for FT cases.
3.3. Possible dependence on the Prandtl number
We have shown in figure 4 that the relative difference of  ${{\textit {Ra}}}_C$ measured by the quantity
 $\varXi$, decreases when
 ${{\textit {Ek}}}$ decreases. This general behaviour is not substantially affected by the variation of
 ${{\textit {Pr}}}$ in the range
 $0.3 \leq {{\textit {Pr}}} \leq 30$ that we investigated. In order to discuss the robustness of our observations concerning the effect of
 ${{\textit {Bi}}}$ against variations of the Prandtl number, we studied the FF to FT transition in a non-rotating case for
 ${{\textit {Pr}}}=0.3$ and
 $30$. A representation of the transition in terms of critical Rayleigh number is plotted in figure 8. We note that the transitional regime is almost independent of
 ${{\textit {Pr}}}$. In particular, the range of Biot number over which the transition from FF to FT occurs is
 $0.3 \leq {{\textit {Bi}}} \leq 30$.
Plot of  $\varGamma = ({{{\textit {Ra}}}_C({{\textit {Bi}}})-{{\textit {Ra}}}_C({{\textit {Bi}}}=0)})/({{{\textit {Ra}}}_C({{\textit {Bi}}}=\infty )-{{\textit {Ra}}}_C({{\textit {Bi}}}=0)})$ as a function of
 ${{\textit {Bi}}}$ with variable
 ${{\textit {Pr}}}$ and
 ${{\textit {Ek}}}=+\infty$. Here
 $\varGamma$ goes to 0 (respectively 1) when the boundary condition goes to FF, i.e.
 ${{\textit {Bi}}}=0$ (respectively FT, i.e.
 ${{\textit {Bi}}}\rightarrow \infty$). The axis of abscissas uses a hybrid linear-logarithmic scale.

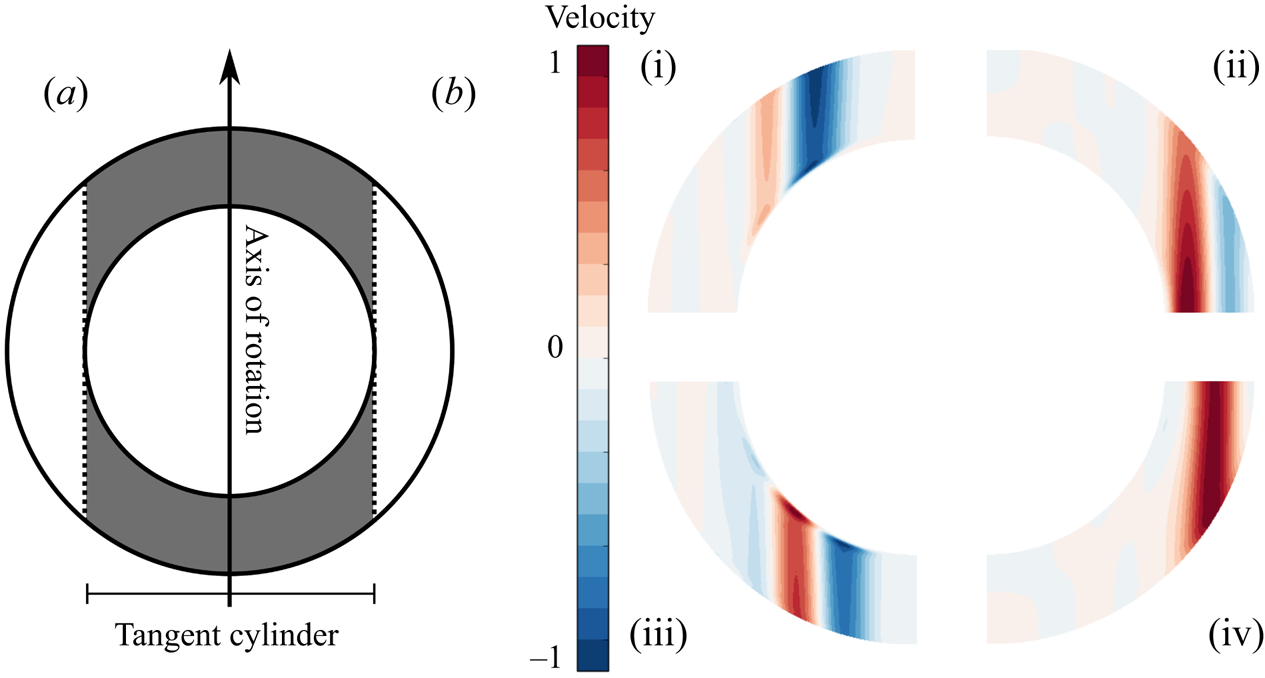
Finally, we consider the evolution of the flow structure in a meridional plane when  ${{\textit {Pr}}}$ is varied in the presence of rotation (
 ${{\textit {Ek}}}=10^{-4}$). The radial cylindrical component
 $u_{s}$ is plotted for FF and FT set-ups in figure 9(b) for
 ${{\textit {Pr}}}=0.3$ or
 $0.03$. Note that for larger values (
 ${{\textit {Pr}}}=3$ and 30), patterns similar to the
 ${{\textit {Pr}}}=0.3$ case were observed (not shown). For such large values (
 ${{\textit {Pr}}} \geq 0.3$), we observe that the flow at the onset is totally contained outside the tangent cylinder – the cylinder with axis
 $\boldsymbol {\varOmega }$ tangent to the inner boundary at the equator; see figure 9(a). For lower values of
 ${{\textit {Pr}}}$, we observe that the flow at the onset mainly develops within the tangent cylinder. This behaviour seems unaffected by the boundary condition imposed at the top interface. In other words, when
 ${{\textit {Pr}}}$ is decreased, we observe a transition from a symmetric equatorial mode (localised near the equator) to a polar mode (localised near the poles, inside the tangent cylinder). We can compare our results with those for a thinner shell obtained by Garcia, Chambers & Watts (Reference Garcia, Chambers and Watts2018). They determined a phase diagram of the selected modes at the onset, as a function of the rotation rate and
 ${{\textit {Pr}}}$. For the same (
 ${{\textit {Pr}}}, {{\textit {Ek}}}$) couples, they observed different transition from ours: from an equatorial attached mode to a spiralling columnar one. This difference can possibly be attributed to the different aspect ratio. Nevertheless, in a previous study conducted with a similar shell to ours, Garcia, Sánchez & Net (Reference Garcia, Sánchez and Net2008) observed a transition from a symmetric equatorial mode to an anti-symmetric polar one for
 ${{\textit {Ek}}} < 10^{-6}$, without mention of polar modes for higher
 ${{\textit {Ek}}}$. Our results suggest that such a polar mode can be found up to
 ${{\textit {Ek}}} = 10^{-4}$.
(a) Schematic of the tangent cylinder (grey) as part of a spherical shell rotating about an axis. (b) Quarter of meridional slices representing the radial cylindrical component of the velocity,  $u_{s}$, at the onset of convection (linear mode, arbitrary amplitude) for FF (iii,iv) and FT (i,ii) top boundary conditions and
 ${{\textit {Pr}}}=0.3$ (ii,iv) or
 $0.03$ (i,iii),
 ${{\textit {Ek}}}=10^{-4}$. We observe an effect of
 ${{\textit {Pr}}}$ on the flow, which appears outside of the tangent cylinder for
 ${{\textit {Pr}}}=0.3$ and inside it for
 ${{\textit {Pr}}}=0.03$.

4. Nonlinear simulations
In order to investigate the behaviour of the convective flow in the nonlinear regime we conducted various nonlinear numerical simulations for different values of  ${{\textit {Ra}}},\, {{\textit {Ek}}},\, {{\textit {Pr}}}$ and
 ${{\textit {Bi}}}$ (see § 2.1). We aim to determine if thermal convection subjected to a Robin boundary condition shows specific behaviours for global parameters (convection efficiency or kinetic energy) as well as local ones (structure of the flow). We first consider end-member configurations (FF and FT), before comparing them with solutions for intermediate Biot numbers.
In the following, we use a global diagnostic, the Nusselt number, which we define as
 \begin{equation} {{\textit{Nu}}}=\frac{1-\eta}{\eta} \frac{\tilde{Q}}{\widetilde{\Delta T_{eff}}}=\frac{1-\eta}{\eta}\frac{Qr_{e}}{\Delta T_{eff} k}, \end{equation}
where  $Q$ is the total heat flux leaving the system and
 $\Delta T_{eff}$ is the observed temperature difference across the system. The tilde symbolises the dimensionless character of the physical quantities. This definition of the Nusselt number is valid in the whole range of boundary conditions (from FF to FT) as imposed by the value of
 ${{\textit {Bi}}}$. In order to facilitate the understanding, we define
 $Q_{ref}$ the heat flux, computed in the motionless reference state (see (2.2)), leaving the system at the upper interface. When
 ${{\textit {Bi}}} \rightarrow 0$, in a FF situation,
 $Q = Q_{ref}$,
 ${Q (1-\eta )}/{r_{e} \eta k}=\Delta T$ and
 ${{\textit {Nu}}} = {\Delta T}/({T(r_{i})-T(r_{e})})$. When
 ${{\textit {Bi}}} \rightarrow \infty$, in a FT situation,
 $T(r_{i})-T(r_{e})=\Delta T$,
 ${\eta k \Delta T}/{r_{e} (1-\eta )}= Q_{ref}$ and
 ${{\textit {Nu}}} = {Q}/{Q_{ref}}$. In both end-member cases, the usual definitions of
 ${{\textit {Nu}}}$ for FF (see, for example, Long et al. Reference Long, Mound, Davies and Tobias2020) or FT (see, for example, Plumley & Julien Reference Plumley and Julien2019) set-ups are obtained and
 ${{\textit {Nu}}}$ provides a dimensionless measure of the efficiency of heat transfer in all cases. According to this definition,
 ${{\textit {Nu}}} = 1$ in the absence of convection. Consequently,
 ${{\textit {Nu}}}-1$ will be preferred on some plots where
 ${{\textit {Ra}}} \approx {{\textit {Ra}}}_C$. Here
 ${{\textit {Nu}}}$ is used to quantify the efficiency of convection in the nonlinear system in the statistically stationary regime, consequently, its average over time will be presented in this regime.
4.1. Behaviour of purely FT or FF set-ups
4.1.1. Global diagnostics
First of all, we study end-member configurations in terms of  ${{\textit {Bi}}}$ values, that is,
 ${{\textit {Bi}}}=0$ or
 ${{\textit {Bi}}} = \infty$, for rotating (
 ${{\textit {Ek}}}=10^{-4}$) or non-rotating cases, for
 ${{\textit {Pr}}}=0.3$ or
 $3$. The Rayleigh number has been set between
 ${{\textit {Ra}}} \approx {{\textit {Ra}}}_C$ and
 ${{\textit {Ra}}} / {{\textit {Ra}}}_C \approx 10^{3}$. As expected from numerous previous studies (e.g. Gastine et al. Reference Gastine, Wicht and Aubert2016; Long et al. Reference Long, Mound, Davies and Tobias2020), several successive convection regimes are observable when
 ${{\textit {Ra}}}$ increases above
 ${{\textit {Ra}}}_C$.
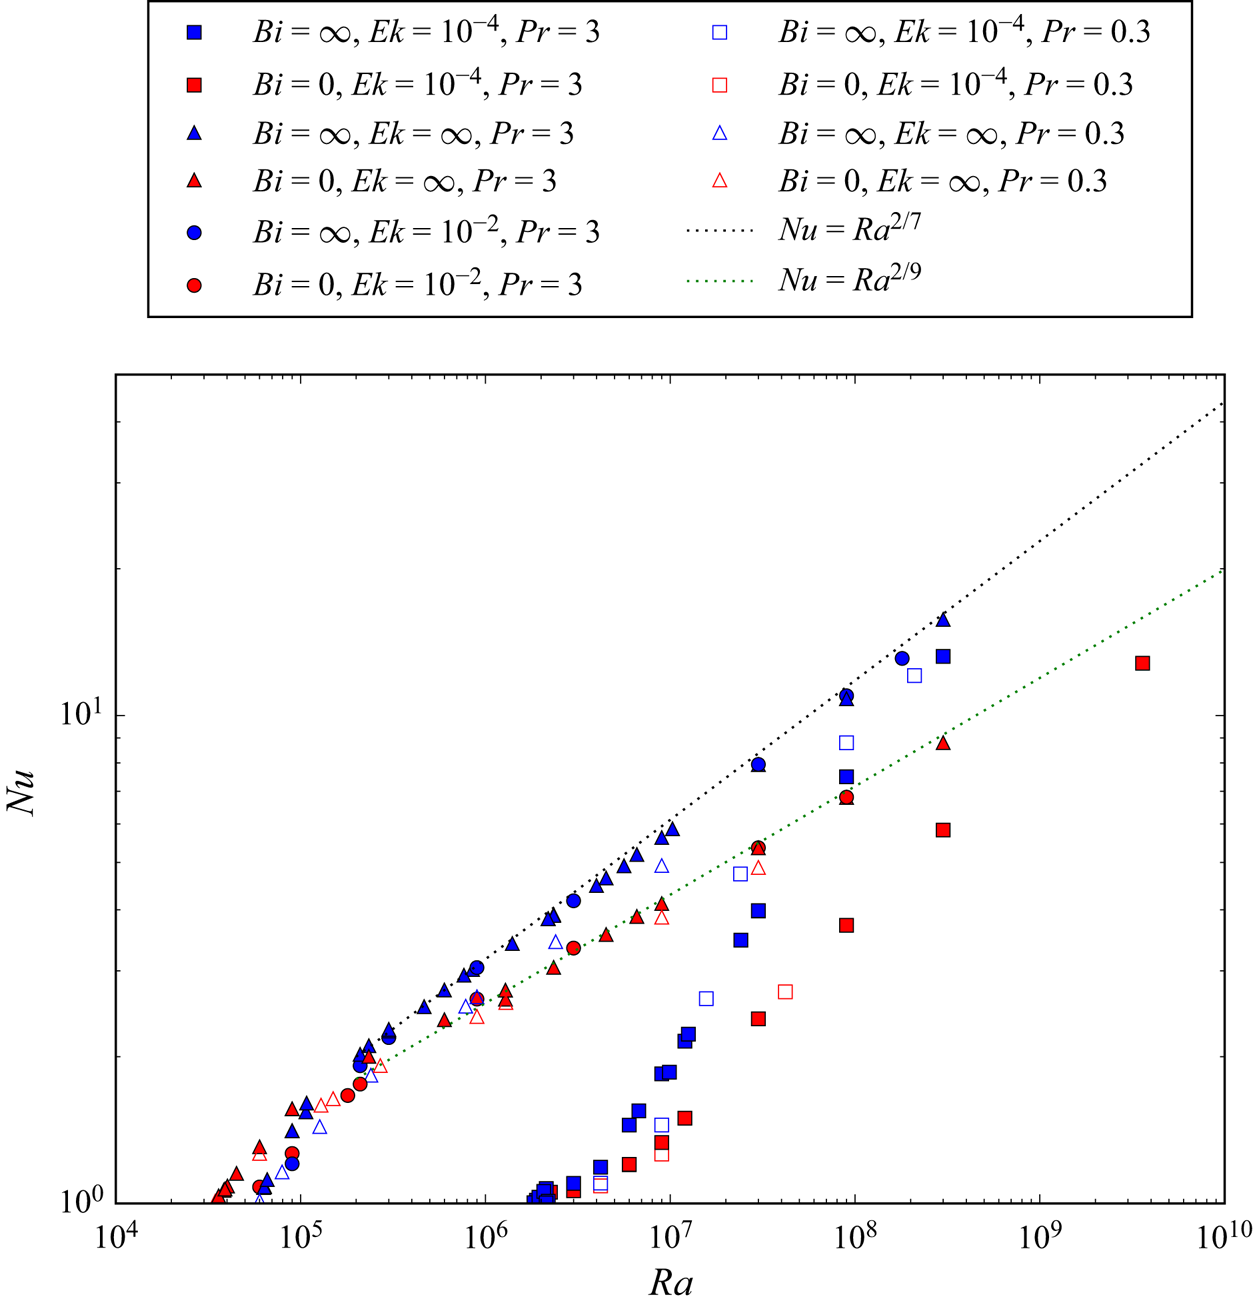
We first consider  ${{\textit {Nu}}}=f({{\textit {Ra}}})$ as represented in figure 10. We observe the well-known convective behaviour (e.g. King, Stellmach & Aurnou Reference King, Stellmach and Aurnou2012; Gastine et al. Reference Gastine, Wicht and Aubert2016): an increase of
 ${{\textit {Nu}}}$ with
 ${{\textit {Ra}}}$ starting from
 ${{\textit {Nu}}}=1$ for
 ${{\textit {Ra}}}\le {{\textit {Ra}}}_C$. Rotating cases show a higher
 ${{\textit {Ra}}}_C$ and a smaller
 ${{\textit {Nu}}}$ at a given
 ${{\textit {Ra}}}$ compared with the non-rotating cases. Since the slope of
 ${{\textit {Nu}}}=f({{\textit {Ra}}},{{\textit {Ek}}} \neq \infty )$ is also steeper (it can approach 1/2 for
 ${{\textit {Ra}}} \approx 10^{7}$), rotating and non-rotating cases show increasingly similar
 ${{\textit {Nu}}}$ when
 ${{\textit {Ra}}}$ is increased. We do not reach large enough values of
 ${{\textit {Ra}}}$ to see the convergence of moderately rotating and non-rotating cases that has been documented (King et al. Reference King, Stellmach and Aurnou2012; Gastine, Wicht & Aurnou Reference Gastine, Wicht and Aurnou2015; Gastine et al. Reference Gastine, Wicht and Aubert2016). Indeed the convective Rossby number,
 $R_{oc}=({{\textit {Ra}}} {{\textit {Ek}}}^{2} / {{\textit {Pr}}})^{1/2}$, used to compare a priori the Coriolis force to the buoyancy force (Gilman Reference Gilman1977) of
 ${{\textit {Ek}}}=10^{-4}$ cases is always below 10 (see Appendix A). Nevertheless, for weakly rotating cases, this convergence is well observed for
 ${{\textit {Ra}}} > 10^{6}$. The comparison of FT and FF cases on the basis of
 ${{\textit {Nu}}}$ values at given
 ${{\textit {Ra}}}$ shows that the two configurations almost always show distinct behaviour. Generally speaking,
 ${{\textit {Nu}}}(FF)<{{\textit {Nu}}}(FT)$. The only exception is noted for the
 ${{\textit {Ek}}}=10^{-4}$ cases when
 ${{\textit {Ra}}} \approx {{\textit {Ra}}}_C$ which shows no real difference between FF and FT configurations. This agrees with the fact that the
 ${{\textit {Ra}}}_C$ of these cases were found with the linear stability analysis to be very similar. Indeed, it is expected (Busse & Or Reference Busse and Or1986; Gillet & Jones Reference Gillet and Jones2006) that, near the threshold, the behaviour of the system is controlled by
 ${{{\textit {Ra}}}}/{{{\textit {Ra}}}_C}-1$. In the non-rotating case, for large enough
 ${{\textit {Ra}}}$, it is known that the Nusselt number scales as
 ${{\textit {Ra}}}^{\alpha }$, where
 $\alpha$ is expected to be similar to 1/3 (e.g. Plumley & Julien Reference Plumley and Julien2019) or 2/7 (e.g. Gastine et al. (Reference Gastine, Wicht and Aurnou2015), Iyer et al. (Reference Iyer, Scheel, Schumacher and Sreenivasan2020) for a FT configuration and Johnston & Doering (Reference Johnston and Doering2009), King et al. (Reference King, Stellmach and Aurnou2012), Long et al. (Reference Long, Mound, Davies and Tobias2020) for a symmetric FF configuration). Here, we observe
 $\alpha = 2/7$. This behaviour is well observed in our data set for the FT configuration. Nevertheless, a different exponent (
 $2/9$ here, as justified below) seems to be necessary to model the FF data. All these general observations can be applied to both
 ${{\textit {Pr}}}=0.3$ and
 ${{\textit {Pr}}}=3$ cases.
Nusselt number,  ${{\textit {Nu}}}$, as a function of
 ${{\textit {Ra}}}$ for
 ${{\textit {Pr}}}=0.3$ (open symbols) or
 $3$ (filled symbols) with (
 ${{\textit {Ek}}}=10^{-4}$: squares and
 ${{\textit {Ek}}}=10^{-2}$: circles) or without (
 ${{\textit {Ek}}}=\infty$ circles) rotation and with FF (red points) or FT (blue ones) at the upper boundary. The black dotted line represents the scaling
 ${{\textit {Nu}}} \propto {{\textit {Ra}}}^{2/7}$ relevant to model FT configurations while the
 ${{\textit {Nu}}} \propto {{\textit {Ra}}}^{2/9}$ – green dotted line – models the FF ones.

The differences observed in figure 10 between FF and FT cases ( ${{\textit {Nu}}}(FT)>{{\textit {Nu}}}(FF$) at a given
 $({{\textit {Ra}}},{{\textit {Pr}}},{{\textit {Ek}}}$)) can be explained by fundamental differences of the set-ups. In the first case, the stationary state is characterised by an effective difference of temperature
 $\Delta T_{eff}$ smaller than the fixed
 $\Delta T$ imposed in the FT case. To compare the values of
 ${{\textit {Nu}}}$ produced by FF and FT cases on an equal footing, we measure the effective Rayleigh number
 ${{\textit {Ra}}}_{eff}$ established in the stationary state defined as (Verzicco & Sreenivasan Reference Verzicco and Sreenivasan2008; Johnston & Doering Reference Johnston and Doering2009; Calkins et al. Reference Calkins, Hale, Julien, Nieves, Driggs and Marti2015)
 \begin{equation} {{\textit{Ra}}}_{eff}=\frac{{{\textit{Ra}}}\, \Delta T_{eff}}{\Delta T}. \end{equation}
One can note that  ${{\textit {Ra}}}_{eff}={{\textit {Ra}}}$ when the FT boundary condition is imposed at the upper interface. In order to precisely compare FF and FT configurations at the same
 ${{\textit {Ra}}}_{eff}$, we first run a FF case then determine its
 ${{\textit {Ra}}}_{eff}$ in order to run a FT case at the same
 ${{\textit {Ra}}}={{\textit {Ra}}}_{eff}$.
In figure 11 we plot  ${{\textit {Nu}}}$ as a function of
 ${{\textit {Ra}}}_{eff}$. One can notice that, for a given (
 ${{\textit {Pr}}}, {{\textit {Ek}}}$),
 ${{\textit {Nu}}}({{\textit {Ra}}}_{eff})$ follows the same behaviour independently of the top boundary condition except for cases near the threshold for non-rotating convection. This is reminiscent of the behaviour observed with the linear stability approach (§ 3) that showed that the threshold is highly dependent on the boundary conditions only in the absence of rotation. As expected, a FF boundary condition implies a lower critical Rayleigh number (which has a similar implication on the critical
 ${{\textit {Ra}}}_{eff}$ since
 ${{\textit {Ra}}} \simeq {{\textit {Ra}}}_{eff}$ for
 ${{\textit {Ra}}} \simeq {{\textit {Ra}}}_C$). Finally, as shown in previous studies (e.g. Calkins et al. Reference Calkins, Hale, Julien, Nieves, Driggs and Marti2015), FF and FT cases become indistinguishable for high enough values of
 ${{\textit {Ra}}}_{eff}$ (here typically
 ${{\textit {Ra}}}_{eff} > 3\times 10^{5}$), in terms of
 ${{\textit {Nu}}}$, and are in good agreement with the
 $2/7$ power law mentioned above.
Nusselt number,  ${{\textit {Nu}}}$, as a function of
 ${{\textit {Ra}}}_{eff}$ (4.2) for the same data as in figure 10. For a given
 ${{\textit {Pr}}}$, FF and FT points follow the same behaviour except near the threshold for non-rotating convection. Here
 ${{\textit {Nu}}}\propto {{\textit {Ra}}}^{2/7}$ is plotted with a blue dotted line.

Since one can write, in the FF case,  ${{\textit {Ra}}}_{eff,FF} \propto {{{\textit {Ra}}}}/{{{\textit {Nu}}}_{FF}}$, the new scaling
 ${{\textit {Nu}}}_{FF} \propto {{\textit {Ra}}}_{eff}^{2/7}$ leads to
 ${{\textit {Ra}}}_{eff,FF}\propto {{\textit {Ra}}}_{FF}^{7/9}$ and
 ${{\textit {Nu}}}_{FF}\propto {{\textit {Ra}}}^{2/9}$ which was observed in figure 10. Using our data to determine the coefficient of proportionality between
 $Ra_{eff,FF}$ and
 $Ra_{FF}$, we found for non-rotating convection and
 ${{\textit {Pr}}}=3$ that, far enough from the onset of convection and along at least three orders of magnitude,
 \begin{equation} Ra_{eff,FF} \simeq 8.6 \times Ra_{FF}^{7/9}, \end{equation}
with a discrepancy below  $5\,\%$.
The similarity of the FF and FT configurations observed at equal  ${{\textit {Ra}}}_{eff}$ on the basis of
 ${{\textit {Nu}}}$ prompted us to look at other quantities. Aside from determining
 ${{\textit {Nu}}}$ of each configuration, we computed their Péclet number in a statistically steady state,
 ${{\textit {Pe}}}=r_{e}\, u \rho _0 c_p / k$, where
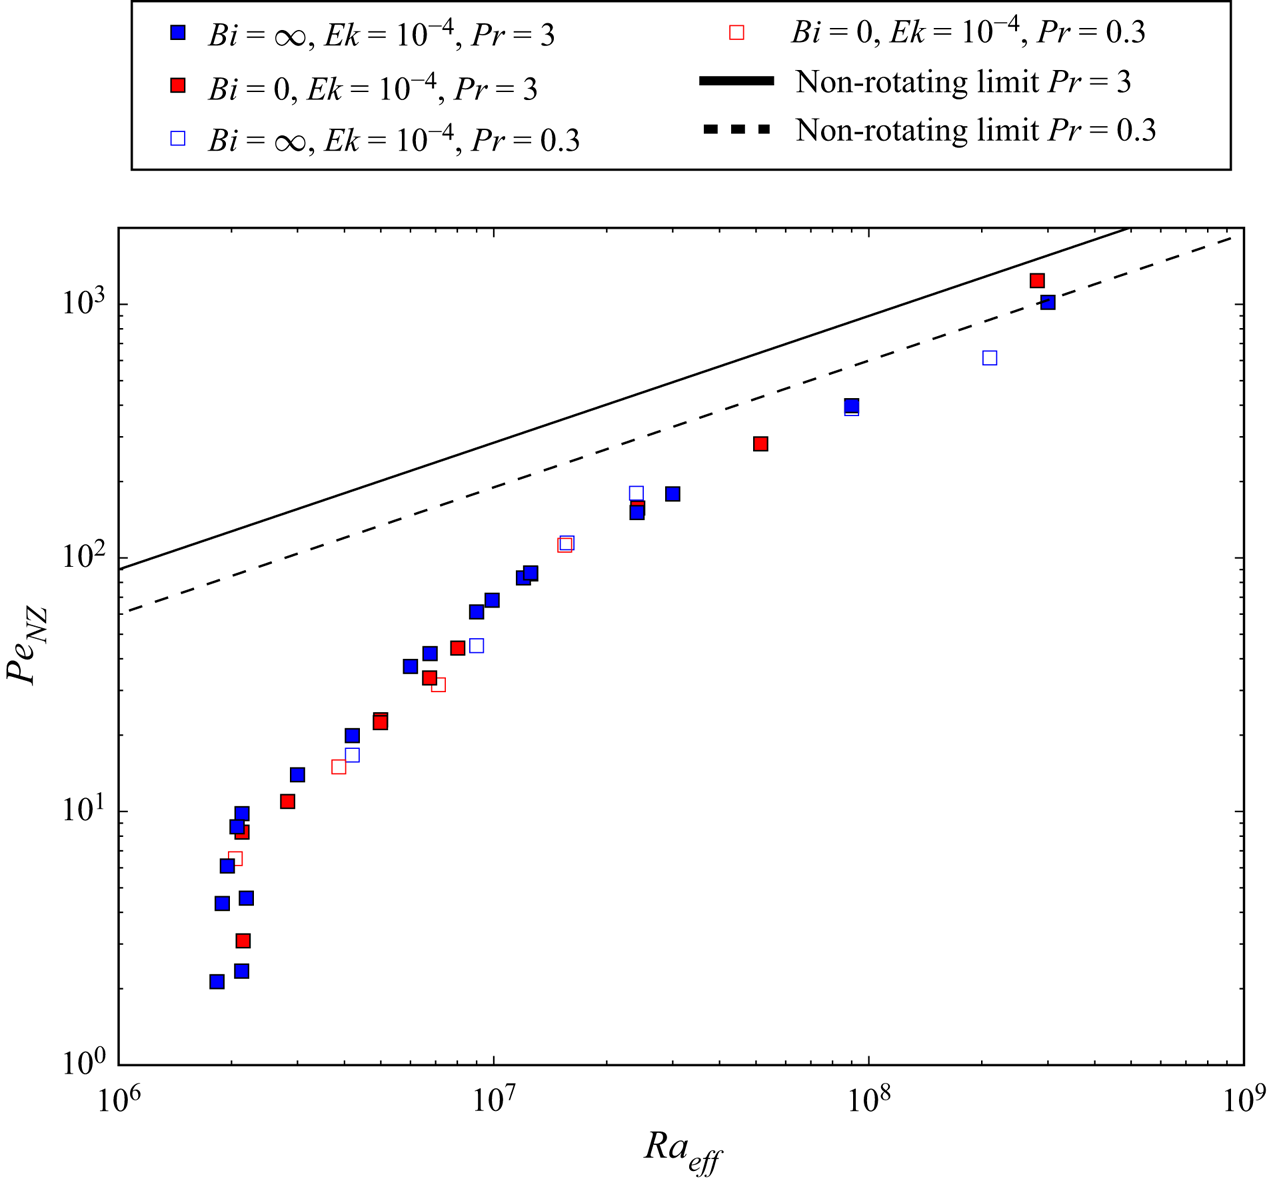
 $u$ is the root-mean-square flow velocity. As one can see in figure 12, where
 ${{\textit {Pe}}}$ is plotted as a function of
 ${{\textit {Ra}}}_{eff}$ for a given
 $({{\textit {Ek}}},{{\textit {Pr}}})$, the general behaviour far from the onset of convection is independent of the top boundary condition. For the rotating case,
 ${{\textit {Pe}}}$ increases sharply with
 ${{\textit {Ra}}}_{eff}$ near the onset, making it difficult to observe low values of
 ${{\textit {Pe}}}$.
 ${{\textit {Pr}}}=0.3$ cases can be distinguished by a systematically smaller value of
 ${{\textit {Pe}}}$ for
 ${{\textit {Ek}}}=\infty$ while they follow the same general behaviour as for the
 ${{\textit {Pr}}}=3$ points for rotating cases. We also observe the decrease of the gap between rotating and non-rotating configurations for high values of
 ${{\textit {Ra}}}_{eff}$. They almost reach a unified regime characterised by a
 ${{\textit {Pe}}}\propto {{\textit {Ra}}}^{1/2}$ scaling as expected from Gastine et al. (Reference Gastine, Wicht and Aurnou2015) or Long et al. (Reference Long, Mound, Davies and Tobias2020) (since
 ${{\textit {Pe}}}$ can be deduced from the Reynolds number by multiplication by a factor
 ${{\textit {Pr}}}$ independent of
 ${{\textit {Ra}}}$). We plot two models
 ${{\textit {Pe}}}\propto {{\textit {Ra}}}^{1/2}$, one for each
 ${{\textit {Pr}}}$ value. Note that the difference of the proportionality factor between the models is in good accordance with a
 ${{\textit {Pe}}}\propto {{\textit {Pr}}}^{1/2}$ dependency – that is, a
 $Re \propto {{\textit {Pr}}}^{-1/2}$ relation – found with a somehow different set-up in Calzavarini et al. (Reference Calzavarini, Lohse, Toschi and Tripiccione2005) for example.
Péclet number  ${{\textit {Pe}}}$ as a function of
 ${{\textit {Ra}}}_{eff}$ for the same data as plotted in figure 11. Except for
 ${{\textit {Ra}}}_{eff} \simeq {{\textit {Ra}}}_C$, FF and FT configurations follow the same behaviour at a given
 ${{\textit {Ek}}}, {{\textit {Pr}}}$. For large enough
 ${{\textit {Ra}}}_{eff}$,
 ${{\textit {Pe}}}$ becomes independent of
 ${{\textit {Ek}}}$. Solid and broken lines are
 $1/2$ slope scalings for
 ${{\textit {Pr}}}=3$ and
 ${{\textit {Pr}}}=0.3$.

We should comment on the short range of Rayleigh numbers (around  ${{\textit {Ra}}}=10^{8}$) for which
 ${{\textit {Ek}}}=10^{-4}$ cases show
 ${{\textit {Pe}}}$ values higher than their non-rotating counterparts, which is visible for both values of
 ${{\textit {Pr}}}$. This overshoot can be explained by our use of the total velocity field to compute
 ${{\textit {Pe}}}$. Indeed, in a configuration of convection in a rotating spherical shell with an upper free-slip boundary condition, we expect the development of strong zonal flows (Yadav et al. Reference Yadav, Gastine, Christensen, Duarte and Reiners2015), responsible for up to
 $90\,\%$ of the total kinetic energy, in a certain range of
 ${{\textit {Ra}}}$. We then plot in figure 13 similar quantities as in figure 12 but using only the non-zonal (i.e.
 $m \ne 0$ components) velocity field to compute
 ${{\textit {Pe}}}$. With this choice, the mentioned overshoot disappears. Moreover, the two branches attributed to low and high
 ${{\textit {Pr}}}$ values for
 ${{\textit {Ek}}} = 10^{-4}$ which are distinct in figure 12 collapse in figure 13. Consequently, the distinction between these two branches is probably solely due to the presence of a strong zonal component at low
 ${{\textit {Pr}}}$ that is absent or weaker in the
 ${{\textit {Pr}}}=3$ cases with
 ${{\textit {Ra}}}_{eff} < 10^{7}$. Some more comments are given about the contribution of the zonal flows to the total kinetic energy in Appendix A.
Non-zonal component of the Péclet number,  ${{\textit {Pe}}}_{NZ}$, as a function of
 ${{\textit {Ra}}}_{eff}$ for
 ${{\textit {Ek}}}=10^{-4}$ cases. Similar behaviour is observed regardless of
 $({{\textit {Pr}}},{{\textit {Bi}}})$:
 ${{\textit {Pe}}}_{NZ}$ values approaches the non-rotating limit when
 ${{\textit {Ra}}}_{eff}$ is increased. The overshoot observed in figure 12 is suppressed with the subtraction of the zonal component.

As a conclusion from the global diagnostics we just studied ( ${{\textit {Nu}}}$ and
 ${{\textit {Pe}}}$), for a given (
 ${{\textit {Ek}}},{{\textit {Pr}}},{{\textit {Ra}}}_{eff}$), the behaviour of thermal convection in our system is independent of the top boundary condition (FT or FF) if
 ${{\textit {Ra}}}_{eff} \gg {{\textit {Ra}}}_C$. Therefore, the behaviour of the system can be predicted based on results with classical boundary conditions, provided
 ${{\textit {Ra}}}_{eff}$ is used instead of
 ${{\textit {Ra}}}$. Moreover, this
 ${{\textit {Ra}}}_{eff}$ can be determined a priori in the non-rotating case from the
 $Ra$ value. This computation can likely be extended to finite
 ${{\textit {Ek}}}$ values as soon as
 ${{\textit {Ra}}}$ is large enough to be in the weakly rotating regime.
4.1.2. Temperature profiles
We also compare the two extreme configurations with respect to their temperature profiles. In figure 14 we plot radial profiles of the mean temperature of FF and FT cases characterised by the same  ${{\textit {Ra}}}_{eff}$. More precisely, we compute the mean radial temperature profile for several temperature fields saved at different times in the stationary state. Then, these mean radial profiles are used to produce a time-averaged radial profile
 $\bar {T}(r)$. We finally plot
 $({\bar {T}-T_{min}})/({T_{max}-T_{min}})$ in order to compare the shape of the profiles since, by construction,
 $\Delta T_{eff}$ is the same in these two configurations. We can see in figure 14 that temperature profiles of FF and FT configurations are almost identical when
 ${{\textit {Ra}}}_{eff}$ is large enough. In the case of a weakly supercritical simulation (
 ${{\textit {Ra}}} \simeq {{\textit {Ra}}}_C$), temperature profiles are more similar to diffusive ones since convection is not well developed.
Radial temperature profiles averaged in time and normalised by the mean temperature difference across the shell,  $({\bar {T}-T_{min}})/({T_{max}-T_{min}})$. Reference, FF and FT profiles are compared,
 ${{\textit {Ek}}}=\infty ,{{\textit {Pr}}}=3,{{\textit {Ra}}}_{eff} \approx 5.6\times 10^{6}$. For large enough
 ${{\textit {Ra}}}_{eff}$, equal
 ${{\textit {Ra}}}_{eff}$ configurations show similar profiles independently of the choice of boundary condition.

4.1.3. Flow structure
Convection can also be studied on the basis of the spatial structure of the flow. We consider first the structures in the meridional plane and then in equatorial ones.
The meridional slices enable us to investigate the disposition of the flow with respect to the tangent cylinder in the rotating cases (without rotation this concept is not relevant). As shown in figure 15(a), moderate supercriticality implies that flow is not active inside the tangent cylinder. When  ${{\textit {Ra}}}$ is increased enough (b), this spatial organization is lost and the flow occupies the whole shell. Nevertheless, in both cases, the influence of rotation can be noticed thanks to the alignment of the flow along columns of axis
 $\boldsymbol {\varOmega }$.
Meridional (a,b) and equatorial (c,d) maps of radial velocity at  ${{\textit {Ek}}}=10^{-4}$,
 ${{\textit {Pr}}}=3$ and
 ${{\textit {Bi}}}=\infty$; (a,c)
 ${{\textit {Ra}}}=9\times 10^{6}$, (b,d)
 ${{\textit {Ra}}}=9\times 10^{7}$. (a) The flow is only active outside the tangent cylinder, (b) the flow is active in the whole shell, (c,d) the flow loses its lateral organization when
 ${{\textit {Ra}}}$ is increased by a factor 10.

As a remark, we noticed in some cases (e.g.  ${{\textit {Bi}}}=\infty ,{{\textit {Ek}}}=10^{-4},{{\textit {Pr}}}=3,{{\textit {Ra}}}=3\times 10^{7}$, i.e. in rotating cases at moderate
 ${{\textit {Ra}}}/ {{\textit {Ra}}}_C$) the development of an anti-symmetric component of the velocity field with respect to the equatorial plane. This component was never stronger than the symmetric one. The anti-symmetric component of the flow is mostly seen within the tangent cylinder where the Taylor–Proudman constraint does not link both hemispheres.
Then, we choose to compare the respective properties of structures at equal  ${{\textit {Ra}}} / {{\textit {Ra}}}_{C}$ in order to compare slightly supercritical configurations. For higher
 ${{\textit {Ra}}}$, equal
 ${{\textit {Ra}}}_{eff}$ plots are compared since it has been shown that this number was an accurate criterion to fairly compare FF and FT configurations.
We can see in figure 16 that it is usually possible to discriminate FF from FT cases without consideration of ( ${{\textit {Ek}}},{{\textit {Pr}}}$) by checking if temperature anomalies extend to the upper boundary or not. This is illustrated clearly in the non-rotating configuration (see the first line for the slightly supercritical case and the third line for higher
 ${{\textit {Ra}}} / {{\textit {Ra}}}_C$) and in the rotating case (see the second line for slightly supercritical simulations and the last line for moderate
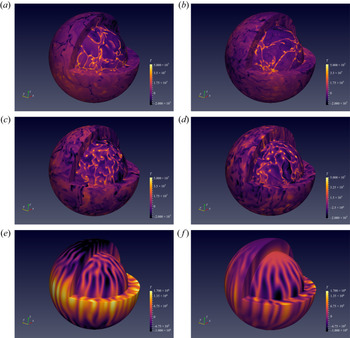
 ${{\textit {Ra}}} / {{\textit {Ra}}}_C$). Except for the vertical extent of the thermal anomalies near the upper boundary, it is nearly impossible to visually distinguish between FF and FT equatorial temperature snapshots on the basis of the size of the anomalies or their spatial organization. We extend this comparison to 3-D structures in the Appendix C.
Equatorial maps of temperature anomalies ( $l=0$ component is subtracted,
 ${{\textit {Pr}}}=3$ for all cases); (a,c,e,g)
 ${{\textit {Bi}}}=0$ (FF), (b,d,f,h)
 ${{\textit {Bi}}}=\infty$ (FT); (c,d,g,h) rotating cases (
 ${{\textit {Ek}}}=10^{-4}$), (a,b,e,f) non-rotating ones; (a,b,c,d)
 ${{\textit {Ra}}}/ {{\textit {Ra}}}_{C} \simeq 1.1$, (e,f,g,h)
 ${{\textit {Ra}}}_{eff}=3.10^{8}$. Except for differences in the thermal upper boundary layer, structures of FF and FT thermal anomalies are similar for each line.

In the slightly supercritical rotating cases (second line) we observe the lateral periodicity ( $m=17$) predicted by the linear stability analysis (see figures 3 and 7), which is identical for both FF and FT boundary conditions. It is worth noting the high amplitude of an equatorial temperature anomaly which is characteristic of the FF configuration compared with FT cases.
4.2. The FF to FT transition
We now focus on the transition from FF to FT configurations produced by an increase of the Biot number from zero to infinity. We restrict our set of parameters to the  ${{\textit {Pr}}}=3$ simulations. For various
 ${{\textit {Ra}}}$ and
 ${{\textit {Ek}}}$, we determined
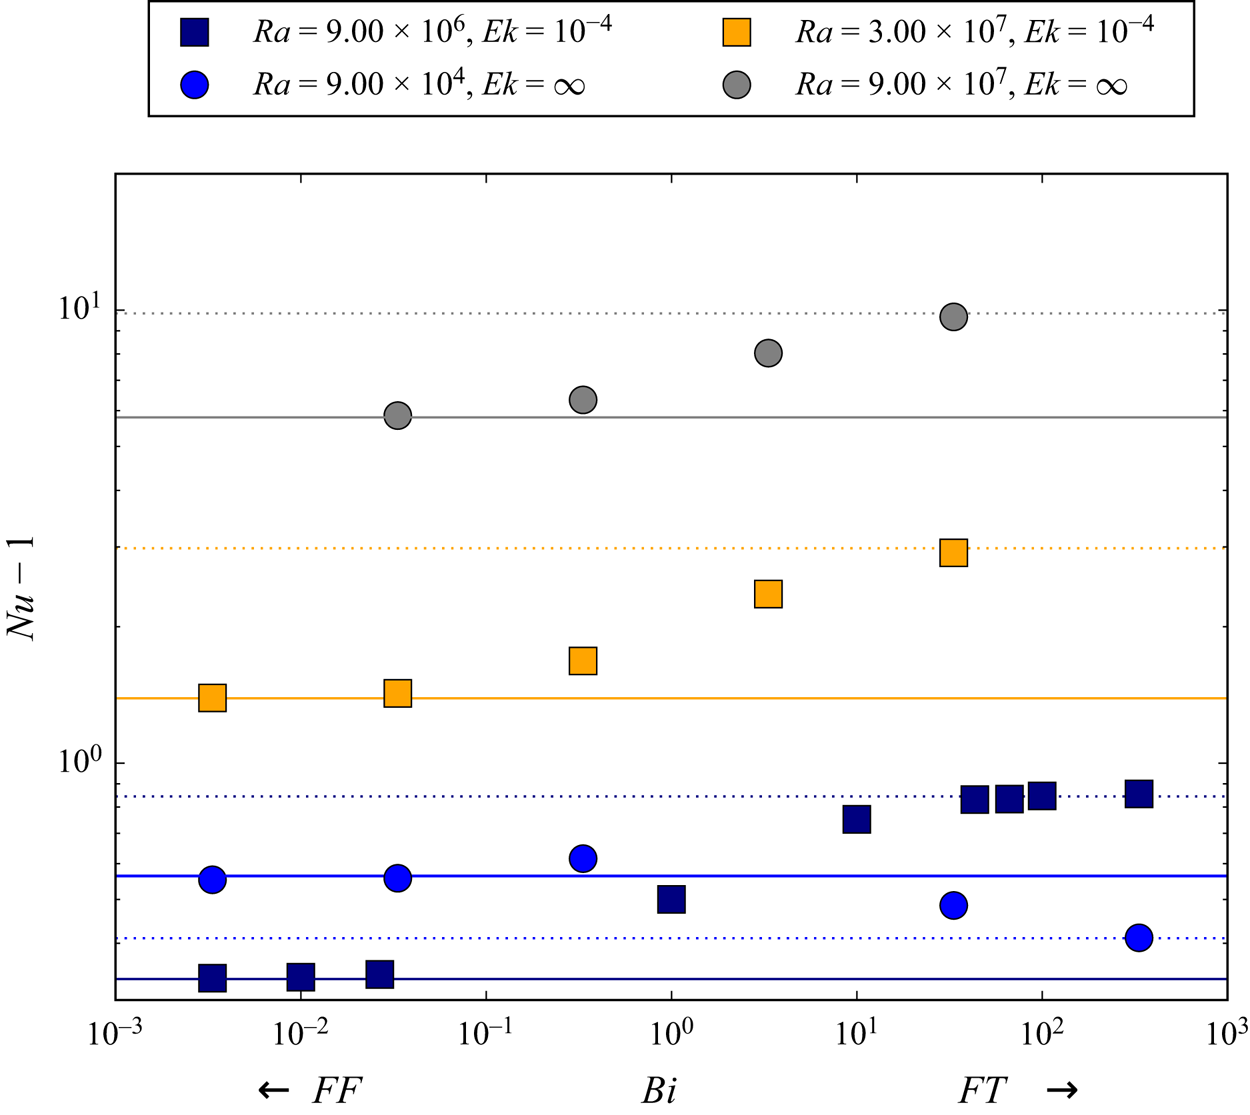
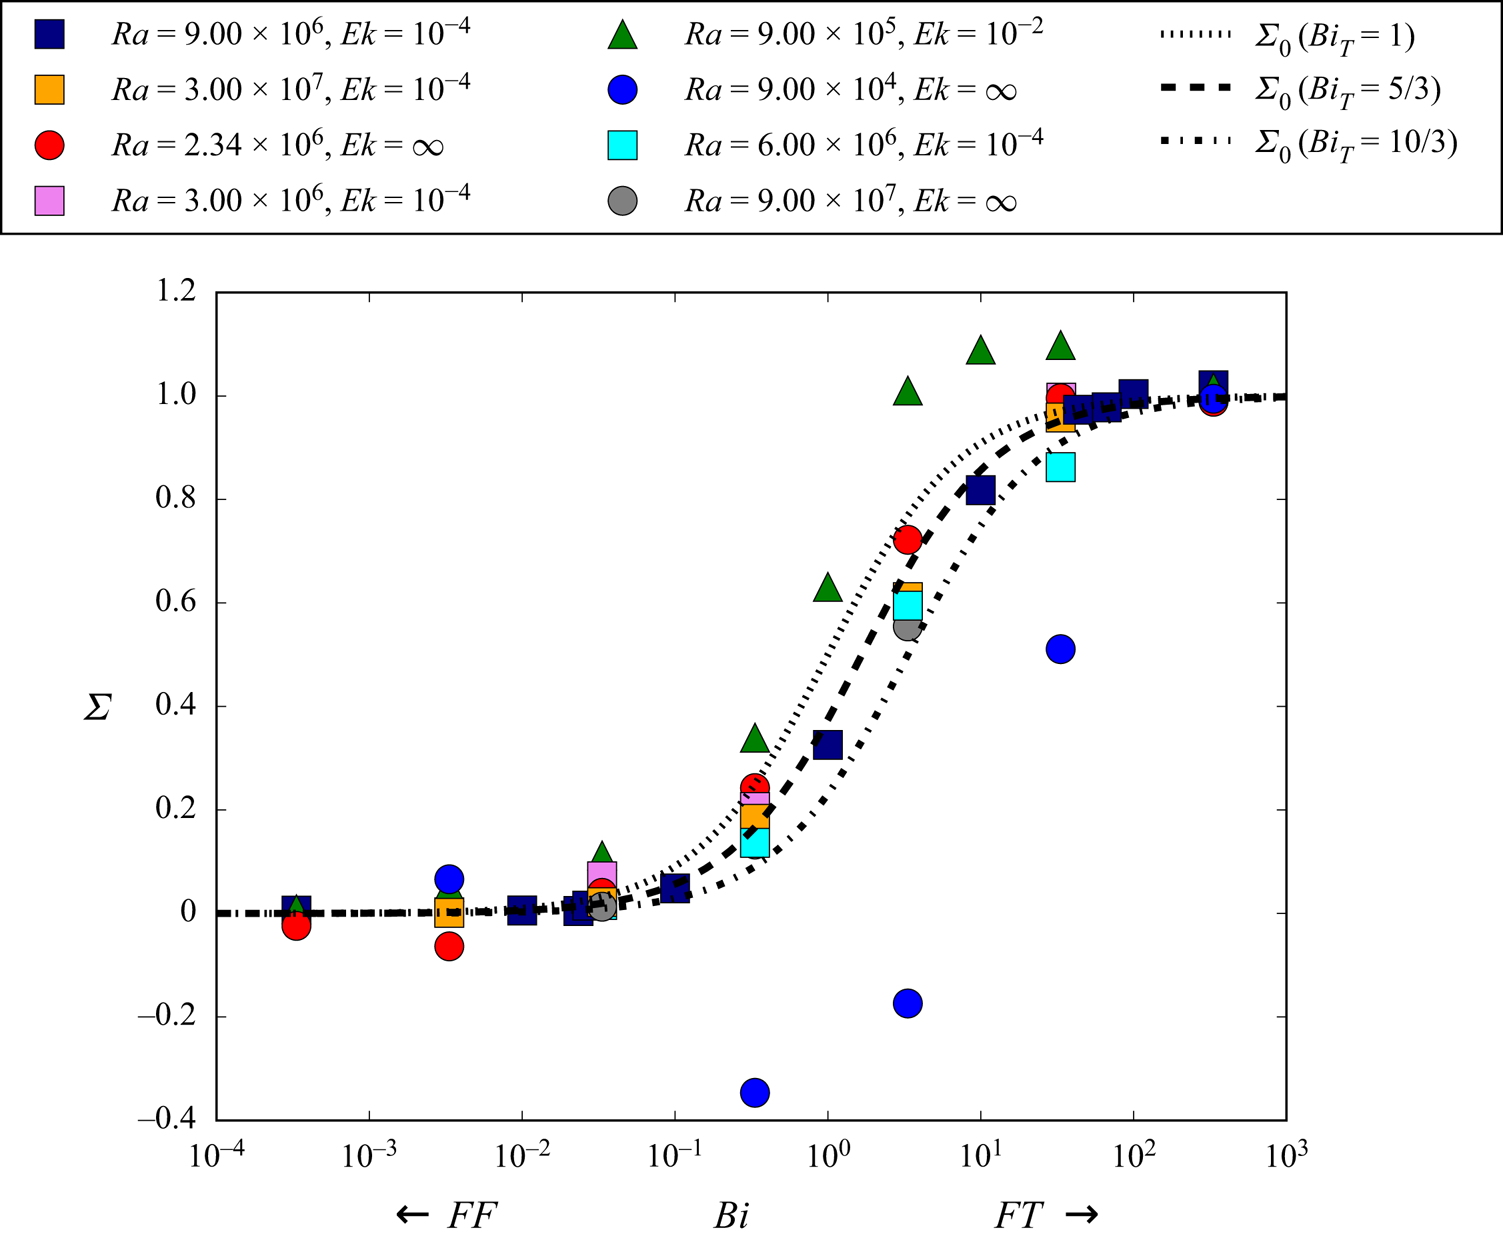
 ${{\textit {Nu}}}$ as a function of the Biot number.
4.2.1. Transition with respect to  ${{\textit {Nu}}}$

Intermediate  ${{\textit {Bi}}}$ value cases can be compared with FF and FT ones on the basis of their
 ${{\textit {Nu}}}$, as plotted in figure 17 as a function of
 $Ra_{eff}$. They follow the same behaviour as for FF and FT cases, which shows that
 $Ra_{eff}$ constitutes the relevant variable characterising these different types of thermal convection subjected to different boundary conditions. We did similar observations on the basis of
 ${{\textit {Pe}}}$ rather than
 ${{\textit {Nu}}}$.
Nusselt number  ${{\textit {Nu}}}$ as a function of
 ${{\textit {Ra}}}_{eff}$ for the same representation code as in figure 10. Intermediate
 ${{\textit {Bi}}}$ cases have been added to the figure 10 data. They are plotted with big symbols, coloured according to their
 ${{\textit {Bi}}}$ value. As in figure 10, points are distributed along two main branches determined by the value of
 ${{\textit {Ek}}}$. Except for (
 ${{\textit {Ek}}}= \infty$,
 ${{\textit {Ra}}} \approx {{\textit {Ra}}}_{C}$) points, intermediate
 ${{\textit {Bi}}}$ points are located on the same branches as extremal ones and then follow the same scalings as described in figure 10.

As in § 4.1.1, we compute  ${{\textit {Ra}}}_{eff}$ as a function of
 ${{\textit {Bi}}}$ for
 $({{\textit {Ek}}}=\infty ,{{\textit {Pr}}} =3)$. We found that, for fixed
 ${{\textit {Ra}}}$,
 ${{\textit {Ra}}}_{eff}$ increases continuously and monotonically from FF to FT values following
 \begin{equation} {{\textit{Ra}}}_{eff}({{\textit{Bi}}})={{\textit{Ra}}}_{eff,FF}+\Delta {{\textit{Ra}}}_{eff} \frac{{{\textit{Bi}}}}{{{\textit{Bi}}}+{{\textit{Bi}}}_{t}}, \end{equation}
with  $\Delta {{\textit {Ra}}}_{eff}$ the difference between FF and FT values of
 ${{\textit {Ra}}}_{eff}$ (which can be determined by (4.3)) and
 ${{\textit {Bi}}}_{t}$ a threshold of approximate value 3 – we noticed that
 ${{\textit {Bi}}}_{t}$ increased slightly with
 ${{\textit {Ra}}}$. Our data show a good agreement with this model on three orders of magnitude of
 ${{\textit {Ra}}}$ (discrepancies are always smaller than
 $10\,\%$).
4.2.2. Transition for a given effective Rayleigh number
Even if equal  ${{\textit {Ra}}}_{eff}$ implies similar
 ${{\textit {Nu}}}$ regardless of
 ${{\textit {Bi}}}$, is it possible to detect differences in the flow structure at constant
 ${{\textit {Ra}}}_{eff}$ with respect to the
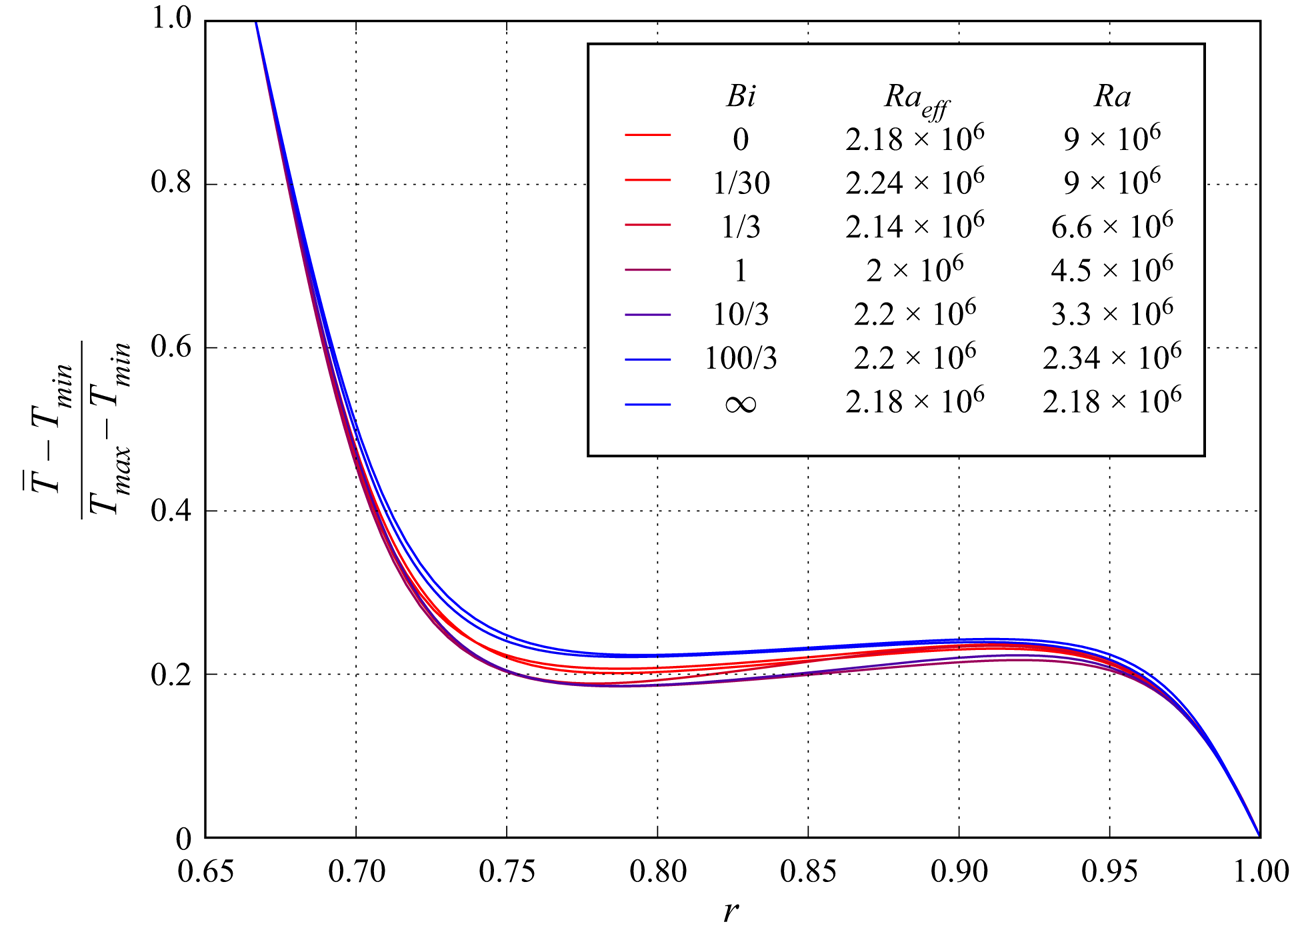
 ${{\textit {Bi}}}$ value? As an illustration, we plot the radial profiles of temperature (figure 18) of seven cases of approximately equal
 ${{\textit {Ra}}}_{eff}$ and variable
 ${{\textit {Bi}}}$. Note that we could not obtain a collection of cases with exactly the same value of
 ${{\textit {Ra}}}_{eff}$ but variable
 $({{\textit {Ra}}},{{\textit {Bi}}})$, since the value of
 ${{\textit {Bi}}}_{t}$ used in (4.4) evolves slightly with
 ${{\textit {Ra}}}$, nevertheless, differences are below
 $10\,\%$. These profiles have been time averaged over fields extracted from the statistically stationary regime. Here we focused on non-rotating systems with
 ${{\textit {Ra}}} \gg {{\textit {Ra}}}_C$. As one can see, the general structure of the profiles is the same: the temperature difference is concentrated in narrow boundary layers located at both shell limits, while the interior of the shell is homogenised by convection and exhibits a slightly stabilizing temperature profile. While the profiles are nearly identical near the boundaries, the middle temperature is affected by
 ${{\textit {Bi}}}$. This dependency is not monotonous: intermediate (i.e. between 1 and 30)
 ${{\textit {Bi}}}$ profiles have the lowest mean temperature, FF ones show medium temperature and FT cases the highest mean temperature.
Normalised and time-averaged radial temperature profiles for quasi constant  ${{\textit {Ra}}}_{eff} \simeq 2.2 \times 10^{6}$ but variable
 $({{\textit {Ra}}},{{\textit {Bi}}})$, (
 ${{\textit {Ek}}}=\infty ,{{\textit {Pr}}}=0.3$). Similar profiles are obtained, nevertheless, three different behaviours can be distinguished for large (FT), small (FF) and intermediate
 ${{\textit {Bi}}}$ values.

In order to give a quantitative description of the spatial structure of the flow, we plotted the velocity spectrum (figure 19) for each of these cases. With the information provided by the spectra it is possible to identify the three regimes suggested by the radial profiles in figure 18. Indeed, the low, intermediate and high  ${{\textit {Bi}}}$ value cases are characterised respectively by a dominance of
 $l=1,2$ and 3. Finally, small-scale flows are favoured at higher
 ${{\textit {Bi}}}$ (that is, FT-like top boundary condition) while the different spectra become indistinguishable as soon as
 $l \ge 7$.
Time-averaged energy spectrum of the velocity (sum of toroidal and poloidal components over the whole shell) for roughly constant  ${{\textit {Ra}}}_{eff}\simeq 2.2 \times 10^{6}$,
 ${{\textit {Ek}}}=\infty$,
 ${{\textit {Pr}}}=3$ but variable
 ${{\textit {Bi}}}$. For
 ${{\textit {Bi}}}\le 0.1$,
 $l=1$ is the dominant mode, intermediate values (
 $1/3\le {{\textit {Bi}}} < 10/3$) favour
 $l=2$, and
 $l=3$ dominates at high
 ${{\textit {Bi}}}$ as in the FT configuration. The total kinetic energy in all these configurations varies by less than 10
 $\%$.

To conclude this section, we have shown that even if  ${{\textit {Ra}}}_{eff}$ is the relevant parameter to compare convection efficiency of FF and FT cases, differences in the flow structure are observed at constant
 ${{\textit {Ra}}}_{eff}$ but variable
 ${{\textit {Bi}}}$ (without rotation). For rotating configurations (particularly at
 ${{\textit {Ek}}}=10^{-4}$), it has been impossible to bring out important differences of the flow structure between FF and FT cases.
4.2.3. Convection regimes for variable Biot number
Rotating and non-rotating thermal convection are known to show various regimes depending on the intensity of the thermal forcing (Gastine et al. Reference Gastine, Wicht and Aubert2016; Long et al. Reference Long, Mound, Davies and Tobias2020). Usually these successive regimes are spotlit by scaling laws deduced from  ${{\textit {Nu}}}=f({{\textit {Ra}}})$ or
 ${{\textit {Pe}}}=f({{\textit {Ra}}})$ graphs. Here we choose to combine these two in a
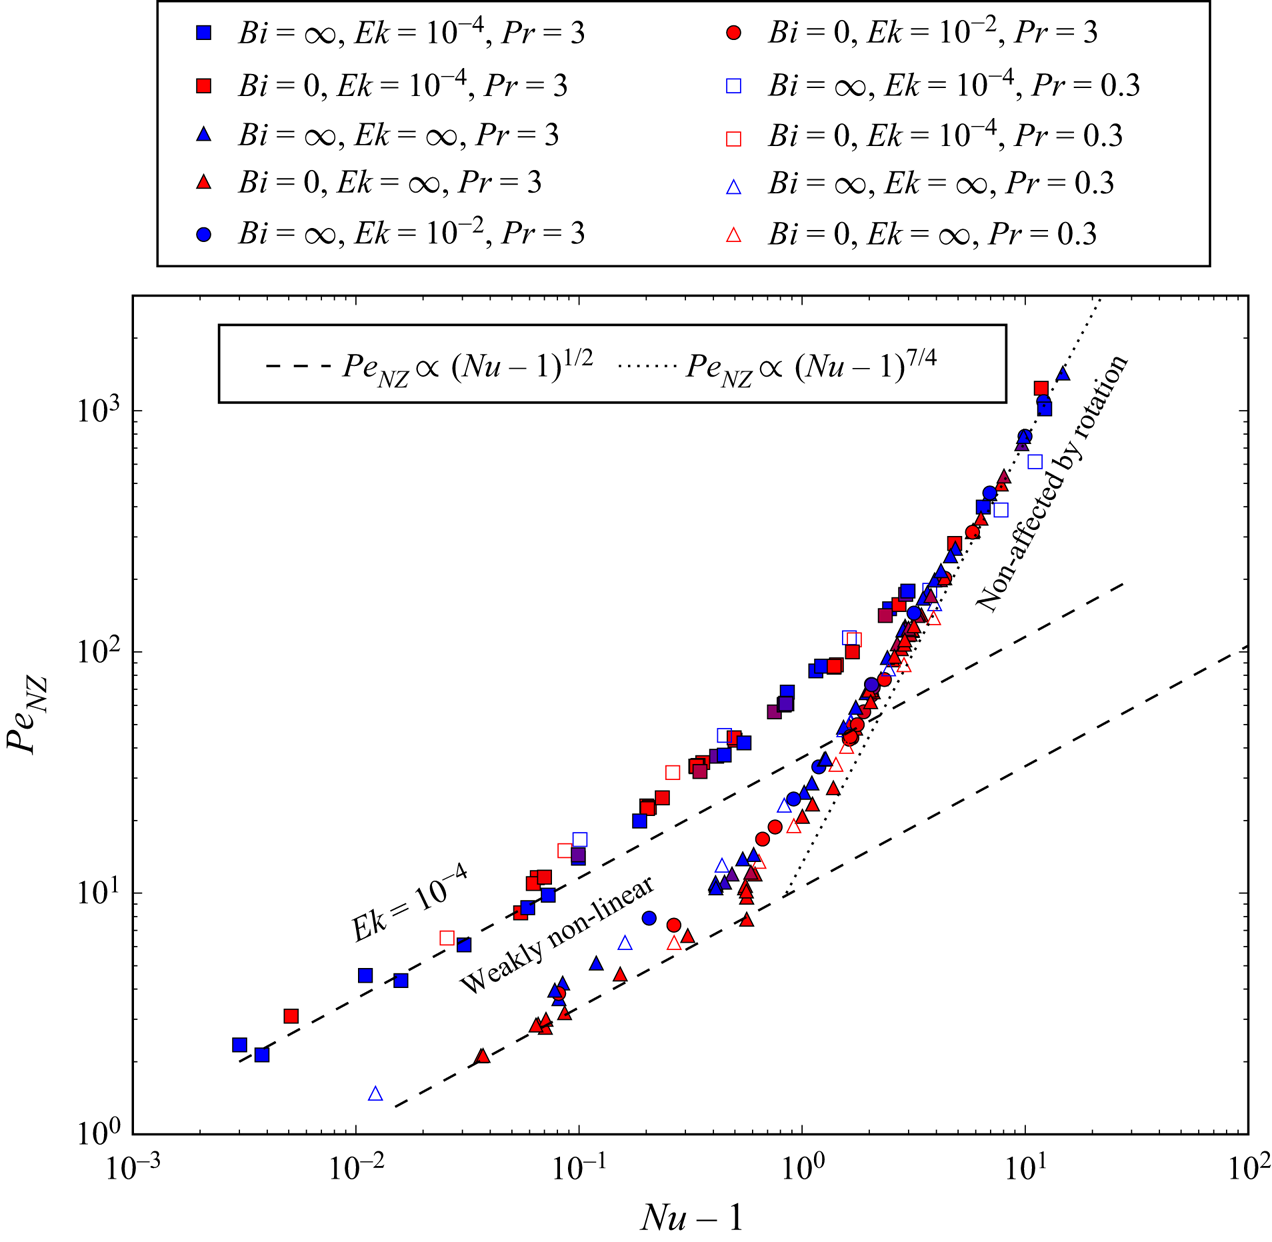
 ${{\textit {Pe}}}_{NZ}=f({{\textit {Nu}}}-1)$ graph (more usual graphs have been presented in the beginning of § 4.1; see figures 11 and 12). The non-zonal component of
 ${{\textit {Pe}}}$ is solely used since it excludes zonal winds that do not participate in the radial thermal transfer. We observe in figure 20 different branches on which points are distributed mainly following their Ekman number (
 ${{\textit {Ek}}}=10^{-2}$ points are poorly distinguishable from non-rotating ones). For low
 ${{\textit {Pe}}}$ and
 ${{\textit {Nu}}}$, two branches of specific
 ${{\textit {Ek}}}$ are visible. They are well modelled by a
 ${{\textit {Pe}}}\propto ({{\textit {Nu}}}-1)^{1/2}$ relation. For higher
 ${{\textit {Nu}}}$, these two branches join a new one with a steeper slope (
 ${{\textit {Pe}}} \propto ({{\textit {Nu}}}-1)^{7/4}$). The non-rotating branch joins this steeper branch for
 ${{\textit {Nu}}}\simeq 1$ while the rotating branch joins it for
 ${{\textit {Nu}}} \simeq 20$. We observe no strong influence of
 ${{\textit {Bi}}}$ or
 ${{\textit {Ek}}}$ on these branches except in the non-rotating one for small
 ${{\textit {Nu}}}-1$: FT points seem to show systematically slightly higher
 ${{\textit {Pe}}}$ compared with FF ones. Remarkably, there is almost no dependence on
 ${{\textit {Pr}}}$ in this representation – although only
 ${{\textit {Pr}}}=0.3$ and 3 are considered.
Non-zonal component of  ${{\textit {Pe}}}$ as a function of
 ${{\textit {Nu}}}-1$ for various
 ${{\textit {Ek}}},{{\textit {Pr}}},{{\textit {Bi}}}$ coded by shape, filling and colour of the symbols, respectively (as in figures 10 and 17). We distinguish two main regimes: the weakly nonlinear regimes at low
 ${{\textit {Pe}}}$ and
 ${{\textit {Nu}}}\simeq 1$ following the two broken-line models and the weakly or non-rotating regimes represented by the dotted line.

We further interpret these different branches relatively to convection regimes. Small  ${{\textit {Pe}}}$ and
 ${{\textit {Nu}}}-1$ are characteristic of a slightly supercritical convection that is a weakly nonlinear (WNL) regime in which the convective flow is mainly monitored by
 ${{{\textit {Ra}}}}/{{{\textit {Ra}}}_C}$. From usual scaling laws (see Busse & Or Reference Busse and Or1986; Gillet & Jones Reference Gillet and Jones2006) relative to the WNL regime, we expect that on the one hand
 \begin{equation} {{\textit{Nu}}}-1\propto \left(\frac{{{\textit{Ra}}}}{{{\textit{Ra}}}_{C}}-1\right), \end{equation}
and on the other hand, when the mean thermal profile remains similar to the diffusive one (which is appropriate for  ${{\textit {Ra}}} \simeq {{\textit {Ra}}}_C$), we expect, from the equilibrium between viscous dissipation rate and mean buoyancy power (see
 $(3.3)$ in Gastine et al. (Reference Gastine, Wicht and Aubert2016) and
 $(2.16)$ in Gastine et al. (Reference Gastine, Wicht and Aurnou2015)):
 \begin{equation} \frac{{{\textit{Ra}}}({{\textit{Nu}}}-1)}{{{\textit{Pr}}}^{2}} \propto \frac{\nu U_{C}^{2}}{\mathcal{L}_{C}^{2}}. \end{equation}
Here  $U_{C}$ and
 $\mathcal {L}$ are the respective typical velocity and length of the convective flow. Keeping only terms of order 1 in
 ${{\textit {Nu}}}-1\rightarrow 0$ leads to
 \begin{equation} {{\textit{Pe}}}\propto (({{\textit{Nu}}}-1){{\textit{Ra}}}_{C})^{1/2} \mathcal{L}_C. \end{equation}
This dependence ( $Pe_{NZ}\propto ({{\textit {Nu}}}-1)^{1/2}$) is illustrated by the broken lines in figure 20. Since
 ${{\textit {Ek}}}$ has a strong influence on
 ${{\textit {Ra}}}_C$ as well as on
 $\mathcal {L}_{C}$ (see § 3) – decreasing
 ${{\textit {Ek}}}$ makes the former increase and the latter decrease – the separation of the points between a rotating and a non-rotating branch can be understood. As shown in the linear stability analysis (§ 3), rotation impacts poorly the onset of convection for
 ${{\textit {Ek}}}>10^{-3}$, which explains why results for
 ${{\textit {Ek}}}=10^{-2}$ fall on the non-rotating branch. Since both
 ${{\textit {Ra}}}_C$ and
 $\mathcal {L}_C$ can be expressed as
 ${{\textit {Ek}}}$ functions using appropriate scaling laws, a
 ${{\textit {Pe}}} \propto {{\textit {Ek}}}^{-1/2}$ dependence can be predicted. Nevertheless, we are not able to test it since the scaling laws are established for smaller
 ${{\textit {Ek}}}$ than those used here. Finally,
 ${{\textit {Bi}}}$ has generally a weak or no influence on
 ${{\textit {Ra}}}_C$ except in the non-rotating configuration which explains the small difference between FF and FT points in the non-rotating branch.
The highest values of  ${{\textit {Pe}}},{{\textit {Nu}}}$ are characteristic of the non-rotating or weakly rotating regime. We presented above (§ 4.1.1) the usual scaling laws used in the non-rotating limit for
 ${{\textit {Nu}}}$ and
 ${{\textit {Pe}}}$ (see figures 10 and 12). The combination of both these laws leads to
 \begin{equation} {{\textit{Pe}}}\propto {{\textit{Nu}}}^{7/4}, \end{equation}
which is the slope observed in figure 20 for high  ${{\textit {Nu}}}-1\simeq {{\textit {Nu}}}$. Note that our scaling law is very similar to that found for this regime in another study of thermal convection with a different system and mechanical boundary conditions (King & Aurnou Reference King and Aurnou2013). In the non-rotating branch
 ${{\textit {Ek}}}$ is no longer a discriminating factor as expected. Remarkably, lower
 ${{\textit {Pr}}}$ points are not easily distinguished from the
 ${{\textit {Pr}}}=3$ group of points. This is worth noting since both
 ${{\textit {Pe}}}$ and
 ${{\textit {Nu}}}$ exhibit dependencies on
 ${{\textit {Pr}}}$ (see figures 11 and 12).
Between these WNL and non-rotating regimes, a transitional regime is expected for rotating simulations. We observe it roughly between  ${{\textit {Nu}}}\simeq 1.1$ and
 ${{\textit {Nu}}}\simeq 20$, it is characterised by an intermediate slope between the two end members. Following a former study (Gastine et al. Reference Gastine, Wicht and Aubert2016) we expect a somehow higher (
 ${{\textit {Nu}}} \simeq 1.5$) value of
 ${{\textit {Nu}}}$ as a lower limit of this regime. Note that since we never use
 ${{\textit {Ek}}}$ smaller than
 $10^{-4}$, we do not expect to significantly observe a rapidly rotating regime (Gastine et al. Reference Gastine, Wicht and Aubert2016; Long et al. Reference Long, Mound, Davies and Tobias2020).
As a conclusion, we observe that variable  ${{\textit {Bi}}}$ convective simulations follow the same general behaviour in terms of convective regimes as the two better known end members.
5. Discussion
Our objective was to study the influence of a Robin boundary condition (characterised by the Biot number) on thermal convection in a rotating spherical shell of fluid heated from below by an isothermal lower interface. This boundary condition has been implemented on the anomalies of temperature and thermal flux at the top interface.
We used, first, linear stability analysis to determine the properties of this boundary condition through the transition from FF to FT at the upper boundary (see § 3). This transition is obtained by varying the Biot number which monitors the linear relationship between the flux and the temperature for a Robin boundary condition at the interface. We observe a continuous transition in terms of critical Rayleigh number of the system between the two end members. This transition is significant only at weak rotation for which the two end-member regimes (FF and FT) remain distinct. In the regime of high  ${{\textit {Ek}}}$ (roughly
 ${{\textit {Ek}}}>10^{-4}$), a transition occurs approximately for
 ${{\textit {Bi}}} \in [0.03,30]$. We give a simple model for the evolution of the critical Rayleigh number as a function of
 ${{\textit {Bi}}}$ during this transition. Outside of this range, the general behaviour of the onset of convection can be described as the traditional FF or FT configuration. These results are in good accordance with the previous work of Sparrow et al. (Reference Sparrow, Goldstein and Jonsson1964). In terms of solution structure at the onset of the convection, we offer a schematic phase diagram showing the existence of FF-like, FT-like or intermediate structures depending on
 ${{\textit {Ek}}}$ and
 ${{\textit {Bi}}}$. We have extended our results concerning the FF to FT transition, at least without rotation, to other velocity boundary conditions and other
 ${{\textit {Pr}}}$ numbers.
Nonlinear simulations have been conducted subsequently (see § 4) to study vigorous convection. We have shown that the relevant parameter to compare convective cases subjected to the whole range of boundary conditions authorised by a variable  ${{\textit {Bi}}}$ is a Rayleigh number based on the effective mean temperature difference across the shell. We provided a simple model for the evolution of
 ${{\textit {Ra}}}_{eff}$ as a function of
 ${{\textit {Bi}}}$ for non-rotating configurations. In terms of global diagnostics quantifying convection (for example, the Nusselt number or the Péclet number), the transition at a given
 ${{\textit {Ra}}}_{eff}$ shows valuable amplitude only for non-rotating and
 ${{\textit {Ra}}}_{eff} \simeq {{\textit {Ra}}}_C$ configurations. Indeed, in this case
 ${{\textit {Ra}}}_C$ depends significantly on
 ${{\textit {Bi}}}$, while by construction
 ${{\textit {Ra}}}_{eff}$ ignores this effect. For other values of the parameters, the transition amplitude is considerably reduced. Concerning the organization of the flow, the transition is observable as long as the solution remains not too turbulent (that is,
 ${{\textit {Ra}}}_{eff} \simeq {{\textit {Ra}}}_C$). For respectively small and large enough
 ${{\textit {Bi}}}$, the system behaviour is very similar to the end-member set-ups. It is only when
 ${{\textit {Bi}}} \in [0.03,30]$ that intermediate specific structures can be noticed while global diagnostics remain unchanged, quasi identical to those of FF and FT configurations. Since
 ${{\textit {Ra}}}_{eff}$ is not an input parameter, we also studied the transition at fixed
 ${{\textit {Ra}}}$ and proposed a model for the evolution of
 ${{\textit {Nu}}}$ as a function of
 ${{\textit {Bi}}}$ (see Appendix B). We observe a noticeable transition only for
 ${{\textit {Bi}}} \in [0.03,30]$, this one can be modelled as a simple function of
 ${{\textit {Bi}}}$. The transition is in fact characterised by a unique parameter determined by (
 ${{\textit {Ra}}},{{\textit {Pr}}},{{\textit {Ek}}}$). Consequently, the range of Biot number for which the results significantly differ from end-member FF or FT boundary conditions is quantified in this paper. Depending on the object of application, computing the Biot number allows one to decide whether it is worth considering the full Robin boundary condition or, otherwise, which end-member model to use. In practice we have shown that Robin boundary conditions can be safely replaced, within the framework described in § 2.1, by a FF boundary condition for
 ${{\textit {Bi}}}<0.03$ and by a FT boundary condition for
 ${{\textit {Bi}}}>30$. Furthermore, for rapid rotation (
 $Ek \leq 10^{-4}$), no effect of the Biot number has been observed. This also implies that the FF and FT cases at the same
 $Ra_{eff}$ cannot be easily distinguished. This conclusion holds for the boundary condition of the temperature anomalies around the same given reference profile. In the case where the reference profile also depends on the boundary conditions, it is therefore reasonable to assume that all differences are due to the changes in the reference profile.
Considering the application to convection in magma ocean planets, we obtained (following the definition given in (2.9) and the references given in § 2.1) a Biot number of order  $10^{10}$ which implies that a FT at the upper surface is the proper boundary condition to apply. This remains true even if we should bear in mind that a geophysical object like a terrestrial magma ocean evolved with time by cooling and freezing. We must expect that the huge
 ${{\textit {Bi}}}$ computed here decreases when the ocean evolves and becomes thinner. Indeed
 ${{\textit {Bi}}}$ is directly proportional to the thickness of the system, inducing a reduction of a factor 100–1000 of the Biot number with the crystallization of the ocean. Nevertheless, it is only for very thin layers of high thermal conductivity below a cold atmosphere that FT modelling becomes irrelevant. For a caricatural example, a hundred-metre-thick liquid mercury layer below an atmosphere at 300 K sets the Biot number to approximately 60, which places this system in the intermediate regime. Extreme cases like metric-sized liquid layers authorise a low Biot number, that is, FF boundary conditions. We emphasize that this observation concerns only boundary conditions applied to anomalies, while the reference (conductive) temperature profile might obey different boundary conditions. Note also that a reference temperature with lateral variations could affect, conversely, the boundary conditions applied to anomalies. This is not considered here and is left for another study.
However, we also mentioned in the introduction other physical thermal systems which can be modelled using the Robin boundary condition. One of them is the superposition of two thermally conductive layers. In that case it is easier to produce configurations for which  ${{\textit {Bi}}} <1$, as a thin water ocean (of thickness
 $H$) below a thick ice layer (thickness
 $H_S$). Leaving aside the mechanical boundary condition at the top, our physical model is appropriate to describe these kind of systems (namely internal oceans of icy satellites). Furthermore, in this situation, the boundary condition depends on the lateral length scale
 $\ell$ of the temperature anomaly. For large length scales, the Biot number is unchanged, but for small length scales
 $\ell \ll H_S$ an effective number
 ${{\textit {Bi}}}_\ell = {{\textit {Bi}}}H / \ell$ should be used (see Guillou & Jaupart Reference Guillou and Jaupart1995). In this context, it may be appropriate to use a Robin boundary condition with a Biot number depending on the length scale, or at least to use a FT for the smallest scales of the system. We have not considered the influence of a symmetric top and bottom Robin boundary condition or the effects of varying the aspect ratio. However, our results bear much generality, and are very likely relevant to most convection set-ups, provided
 ${{\textit {Nu}}}$ and
 ${{\textit {Ra}}}_{eff}$ are used to characterise the system. It would also be surprising if other gravity or temperature profiles could change our conclusions. Global and deep oceans of hypothetical exo-planets could constitute another appropriate geophysical subject for such modelling. Robin boundary conditions could be chosen to model various relations between a field and its derivative at an interface. We could, for example, contemplate modelling partial crystallization of a two component liquid using this method. Indeed the evolution of the liquid composition
 $C$ at the solid/liquid interface during the crystallization (due to the fact that the produced solid does not have the same composition as the initial liquid) could be modelled by fixing a chemical flux
 $j_{C}$ determined by the local composition of the fluid. Such a relation could be made linear by a relation similar to
 $K\, C + j_{C} = 0$, with
 $K$ a coefficient similar to the Biot number.
Acknowledgements
We acknowledge discussions with T. Alboussière concerning the general definition of the Nusselt number. LGLTPE is part of the LABEX Lyon Institute of Origins (ANR-10-LABX-0066) of the Université de Lyon. Computations were performed on the Froggy platform of CIMENT (https://ciment.ujf-grenoble.fr), supported by the Rhône-Alpes region (CPER07_13 CIRA), OSUG2020 LabEx (ANR10 LABX56) and EquipMeso (ANR10 EQPX-29-01). ISTerre is part of Labex OSUG2020 (ANR10 LABX56). The open-source numerical codes xshells and singe are available at https://nschaeff.bitbucket.io/xshells/ and https://bitbucket.org/vidalje/singe/downloads/. Most figures were produced using matplotlib (http://matplotlib.org/) or paraview (http://www.paraview.org/).
Funding
J.V. acknowledges funding from the European Research Council (ERC) under the European Union's Horizon 2020 research and innovation program (grant agreement no. 847433). S.L. has been funded by the French Agence Nationale de la Recherche (grant no. ANR-15-CE31-0018-01, MaCoMaOc). The xshells code received funding from the European Union's Horizon 2020 research and innovation programme under the ChEESE project, grant agreement no. 823844.
Declaration of interests
The authors report no conflict of interest.
Appendix A. Zonal flows
As presented in § 4.1, the development of a strong zonal flow is observed for low or intermediate  ${{\textit {Ra}}}$ in rotating simulations. The convective Rossby number
 $R_{oc}=({{{\textit {Ra}}} \, {{\textit {Ek}}}^{2}}/{{{\textit {Pr}}}})^{1/2}$ is frequently used as a parameter to study the evolution of zonal flows. Here
 $R_{oc}$ roughly estimates the ratio of buoyancy to Coriolis forces (Gilman Reference Gilman1977). Small
 $R_{oc}$ implies a strong influence of rotation while the infinite limit corresponds to a flow not affected by rotation. In order to study this phenomenon we plot in figure 21 the ratio of the total kinetic energy
 $E$ over the non-zonal component of this energy,
 $E_{NZ}$, as a function of
 $R_{oc}$. The larger the ratio, the stronger the zonal flow.
Kinetic energy ratio  ${E}/{E_{NZ}}$ as a function of the convective Rossby number
 $R_{oc}$ for various (
 ${{\textit {Ek}}},{{\textit {Pr}}},{{\textit {Bi}}}$). Legend is similar to figure 22. Zonal flows are mainly active for small
 ${{\textit {Ek}}}$ and
 $R_{oc}\in [0.1,1]$.

For the two values of  ${{\textit {Ek}}}$, we observed the zonal flow first grows with
 $R_{oc}$ then decreases. Moreover, the zonal flow is almost negligible for the weakly rotating configuration (a flat maximum is observed for
 $R_{oc} \simeq 8$). For
 ${{\textit {Ek}}}=10^{-4}$, we observe a maximum for
 $R_{oc} \simeq 0.5$ at which the zonal flow represents more than
 $90\,\%$ of the total kinetic energy of the system. This maximum is compatible with previous results realised with different boundary conditions (see Christensen Reference Christensen2002; Yadav et al. Reference Yadav, Gastine, Christensen, Duarte and Reiners2015). We also observe that
 ${{\textit {Pr}}}$ and
 ${{\textit {Bi}}}$ do not seem to alter significantly the general behaviour of the zonal flows, only a small modification of the maximum being noticed. Finally, figure 21 shows that the
 ${{\textit {Ek}}}=10^{-4}$ data do not reach very high
 $R_{oc}$ values (
 ${\sim }3$ at most) which explains that we do not really observe the disappearance of the influence of the rotation on such simulations (see figure 10 for example).
Appendix B. Transition at a given ${{\textit {Ra}}}$

It was also possible to study the transition observed at constant  ${{\textit {Ra}}}$, when
 ${{\textit {Bi}}}$ varies from zero to infinity. As shown previously, this choice is not optimal to compare equivalent configurations but only uses input parameters.
Figure 22 shows  ${{\textit {Nu}}}-1$ as a function of
 ${{\textit {Bi}}}$ for various values of (
 ${{\textit {Ra}}},{{\textit {Ek}}}$). The amplitude of the transition by definition depends on
 ${{\textit {Nu}}}({{\textit {Bi}}}=0)-{{\textit {Nu}}}({{\textit {Bi}}}=\infty )$ which is a function of (
 ${{\textit {Ra}}},{{\textit {Ek}}},{{\textit {Pr}}}$). For all cases but one, for a given
 ${{\textit {Ra}}}$,
 ${{\textit {Nu}}}$ increases with
 ${{\textit {Bi}}}$, FT cases are more efficient in terms of heat transfer. The exception is explained below. Figure 22 shows that in the most common cases the transition from FF to FT is monotonous and continuous. Moreover, the transition occurs mainly between
 ${{\textit {Bi}}}=10^{-1}$ and
 ${{\textit {Bi}}}=10^{2}$.
Nusselt Number as a function of the Biot Number for various  $({{\textit {Ra}}},{{\textit {Ek}}},{{\textit {Pr}}}=3)$ simulations. Each data subset defined by
 $({{\textit {Ra}}},{{\textit {Ek}}})$ is plotted by symbols of the same colour and shape. Here FF (
 ${{\textit {Bi}}}=0$) and FT (
 ${{\textit {Bi}}}\rightarrow \infty$) limits are represented respectively by solid and dotted lines of the same colour.

In order to study more specifically the transition itself, we then plot for a given global diagnostics  $X({{\textit {Ra}}},{{\textit {Ek}}},{{\textit {Bi}}})$ (here
 $X={{\textit {Nu}}}-1$) the quantity
 \begin{equation} \varSigma = \frac{X-X({{\textit{Bi}}}=\infty)}{X({{\textit{Bi}}}=0)-X({{\textit{Bi}}}=\infty)}. \end{equation}
By construction,  $\varSigma$ evolves from 0 to 1 when
 ${{\textit {Bi}}}$ goes from 0 to
 $+ \infty$ and it can be interpreted as a transition parameter. This quantity has been computed for the same subset that was used to produce figure 22 and is plotted in figure 23. First of all, we notice that the large majority of the data subsets associated to a given
 $({{\textit {Ra}}},{{\textit {Ek}}})$ couple follows the same continuous and monotonous transition. The quantity
 \begin{equation} \varSigma_{0}= \frac{{{\textit{Bi}}}}{{{\textit{Bi}}}+{{\textit{Bi}}}_{T}} \end{equation}
gives an approximation of the evolution of  $\varSigma$, when the central value
 ${{\textit {Bi}}}_{T} \approx 1$ to
 $3$. This model is closer to the data points for rotating cases. Note that
 $\varSigma$ is very similar to the quantity
 $\gamma$ used to model
 ${{\textit {Ra}}}_C=f({{\textit {Bi}}})$ in § 3.2. We observe a slight evolution of
 ${{\textit {Bi}}}_{T}$ with
 ${{\textit {Ra}}}$ and
 ${{\textit {Ek}}}$. The only notable exception to these observations is the slightly supercritical,
 ${{\textit {Ra}}} = 9\times 10^{4}$ non-rotating case (blue dots), which is anomalous. For this case, the transition is not monotonous and is characterised by a minimum for
 ${{\textit {Bi}}} \approx 1$. In fact, this case is one of the few configurations in which the most efficient heat transfer is obtained for intermediate values of
 ${{\textit {Bi}}}$. This specific behaviour is linked to the vicinity of the critical Rayleigh number in this simulation as well as to the large relative difference between
 ${{\textit {Ra}}}_C$ for FF or FT boundary conditions in this case. As seen in § 3.1,
 ${{\textit {Ra}}}_C(\text {FF},{{\textit {Pr}}},{{\textit {Ek}}})<{{\textit {Ra}}}_C(\text {FT},{{\textit {Pr}}},{{\textit {Ek}}})$ and
 $({({{\textit {Ra}}}_C\text {FT},{{\textit {Ek}}})-{{\textit {Ra}}}_C(\text {FF},{{\textit {Ek}}})})/({{{\textit {Ra}}}_C(\text {FT},{{\textit {Ek}}}=\infty )-{{\textit {Ra}}}_C(\text {FF},{{\textit {Ek}}}=\infty )})$ decreases with
 ${{\textit {Ek}}}$. Moreover,
 ${{\textit {Nu}}}-1$ is proportional to
 ${{{\textit {Ra}}}}/{{{\textit {Ra}}}_C}-1$ near the threshold of convection (Gillet & Jones Reference Gillet and Jones2006; Gastine et al. Reference Gastine, Wicht and Aubert2016). Thus, for this case characterised by
 $({{\textit {Ra}}}=9\times 10^{4} \approx {{\textit {Ra}}}_C,{{\textit {Ek}}}=\infty ,{{\textit {Pr}}}=3)$, we can reasonably expect that
 ${{\textit {Nu}}}(\text {FF})>{{\textit {Nu}}}(\text {FT})$, which means that increasing
 ${{\textit {Bi}}}$ leads to a transition from higher to smaller values. Moreover, since
 ${{\textit {Ek}}}=\infty$, the relative amplitude of the transition is large and implies high variations of
 ${{{\textit {Ra}}}}/{{{\textit {Ra}}}_C}$ with
 ${{\textit {Bi}}}$ since
 ${{\textit {Ra}}}$ remains constant. This produces the non-monotonous variation of
 ${{\textit {Nu}}}$ with
 ${{\textit {Bi}}}$.
Plot of  $\varSigma$ transition parameter (cf. (B1), computed with
 $X={{\textit {Nu}}}-1$) from FF (
 ${{\textit {Bi}}}=0$) to FT (
 ${{\textit {Bi}}}=\infty$) as a function of the Biot Number for various
 $({{\textit {Ra}}},{{\textit {Ek}}},{{\textit {Pr}}}=3)$ simulations. Here
 $\varSigma _{0}$ trends (cf. (B2)) are plotted for three transition values:
 ${{\textit {Bi}}}_{T} =1,\,5/3,\,10/3$. Some cases show a large deviation from the trends, which is explained in the main body of this appendix.

We also consider other global diagnostics:  $\langle Et \rangle$ which is the root-mean-square value of the temperature anomaly and
 $P_{conv}$ which is the root mean square of
 $u\varTheta$ and found similar behaviour as for
 ${{\textit {Nu}}}$ with respect to
 ${{\textit {Bi}}}$.
Appendix C. Three-dimensional representations
Figure 24 shows 3-D maps of temperature anomalies ( $l=0$ component subtracted) for sub-shells of our system – boundary layers excluded – for
 ${{\textit {Pr}}}=3$. We compare FF and FT configurations for quasi equal
 $Ra_{eff},{{\textit {Ek}}}$. For cases with
 ${{\textit {Ra}}}_{eff}=3\ 10^{8}$, the effect of a boundary condition is hardly visible. Conversely, cases with lower
 ${{\textit {Ra}}}_{eff}$ with a strong effect of rotation show differences in the location of the anomalies with respect to the tangent cylinder (see figure 9a).
Three-dimensional representation of the temperature anomaly ( $l=0$ subtracted) inside a shell of radial limits 0.7 and 0.95 with
 ${{\textit {Pr}}}=3$. Rotational axis is
 $z$. (a,c,e) FF, (b,d,f) FT. For each line, (
 ${{\textit {Ra}}}_{eff},{{\textit {Ek}}}$) is kept approximately constant; (a,b) (
 $Ra_{eff} =3\times 10^{8},Ek =\infty$). (c,d) (
 $Ra_{eff} =3\times 10^{8}, Ek = 1 \times 10^{-4}$). (e,f) (
 $Ra_{eff} = 1 \times 10^{7}, Ek = 1 \times 10^{-4}$).