Introduction
Understanding the impact of disasters on patient outcomes and patient flows between hospitals and other providers is important for preparedness planning and analysis of hospitals’ surge capacity. During Hurricane Katrina, which hit the US Gulf Coast in August of 2005, dialysis centers struggled to maintain continuity of care. Forty-three centers closed during the storm, and 26 of these remained shuttered one month after Katrina.Reference Kenney 1 Evacuated patients often presented at receiving facilities without information about their dialysis regimens, medications, or comorbidities.Reference Kleinpeter, Norman and Krane 2
Despite anecdotal evidence of inadequate preparedness among some dialysis centers and patients, it remains an open question whether end-stage renal disease patients suffered medical injury during Katrina or received dialysis care at hospitals. A survey of patients from nine dialysis units in New Orleans found that 16.8% missed three or more dialysis sessions, and 23% were hospitalized in the month following Katrina.Reference Anderson, Cohen, Kutner, Kopp, Kimmel and Muntner 3 Many suffered from depressive symptoms.Reference Hyre, Cohen and Kutner 4
A descriptive analysis of pre- and post-Katrina trends by the United States Renal Data System (USRDS) national registry of patients with end-stage renal disease (ESRD) found that Katrina was associated with a number of adverse outcomes, including mortality, decreased receipt of vitamin D and iron injections, anemia, and hospitalization. 5 However, results may be biased by changes in the composition of patients in the sample pre- and post-Katrina. Prior to Katrina, the USRDS identified 3,609 patients receiving dialysis in the affected areas. Post-Katrina, only 2,602 patients received dialysis. If the patients that remained were sicker than the patients who migrated, then it is difficult to determine the causal impact of Katrina on outcomes. A recent analysis of the impact of Katrina on mortality found that Katrina was not associated with an increase in mortality rates in patients receiving dialysis in the affected areas prior to the Katrina landfall (August 29, 2005).Reference Kutner, Muntner and Huang 6 By following a fixed cohort of patients over time, the analysis avoided bias due to changes in the patient population.
In this study, the impact of Katrina on hospitalization rates was estimated using two approaches: (1) a simple descriptive analysis of trends in hospitalization rates; and (2) a repeated events duration model with a time-varying covariate for Hurricane Katrina.
Methods
Data and Study Sample
Patients in 103 clinics that experienced service disruptions during Hurricane Katrina were examined.Reference Kutner, Muntner and Huang 6 , Reference Kopp, Ball and Cohen 7 Of these, 40 were in the New Orleans metropolitan area, with the remainder in Louisiana, Mississippi, and Alabama. There are an estimated 332 dialysis facilities in these states, 8 though not all are in areas that were affected by Hurricane Katrina.
Ninety-four (94) were free-standing clinics and nine were hospital-based clinics. Nationally, 83% of dialysis centers are free-standing facilities unaffiliated with a hospital or hospital center. 8 Of these, 91% are for-profit facilities. 8 Using USRDS 2008 Standard Analytical Files (SAFs), patients who received treatment at these clinics from January 1, 2001 through August 29, 2005 were identified.
Variables
Patient characteristics, including age, serum albumin g/dl, the number of cardiovascular conditions, hemoglobin level g/dl, chronic obstructive pulmonary disease (yes or no), dialysis modality (hemodialysis versus other), sex, ability to walk (yes or no), race (white versus other), diabetes (yes or no), and Medicaid coverage (yes or no), were obtained from the 2008 USRDS SAFs. The number of cardiovascular conditions was a count variable based on providers’ report of the following conditions: congestive heart failure, coronary artery disease, history of acute myocardial infarction, cardiac arrest, dysrthythmia, cerebral vascular disease, and peripheral vascular disease. All variables were measured at the time of initiation of dialysis.
Patient deaths and hospitalizations were identified using the 2008 Patient and Hospitalization SAFs. The date of each hospitalization was recorded based on the day of admission. Hospital admissions were classified using the diagnosis-related group (DRG) codes on insurance claims. For purposes of payment, Medicare (the US national health insurance for Americans ≥65 years of age, and those with disabilities or end-stage renal disease) assigns every hospital admission to a single DRG for purposes of payment based on the diagnosis and procedure codes listed on claims. DRGs are split into two categories: medical and surgical. The medical category was further divided into renal-related DRGs and non-renal-related DRGs.
Diagnosis-related groups were selected for the renal-related category based on the high volume of admissions in these DRGs among patients on dialysis and because they were related to treatment of renal failure, complications of renal failure, or the underlying causes of renal failure. The category includes DRGs for delivery of dialysis (DRG 317), renal failure (316), nutritional and miscellaneous metabolic disorders (296-298), other kidney and urinary tract disorders (331-333), kidney and urinary tract neoplasms (318), kidney and urinary tract infections (320-327), red blood cell disorders (395), diabetes (294, 295), and coagulation disorders (397).
Data Analyses
Crude monthly hospitalization rates among patients at the affected clinics for the period January 2004 through February 2006 were calculated. Monthly hospitalization rates were calculated as the number of hospital admissions divided by person-months.
The primary analysis used a proportional rate model for repeated events to estimate the impact of Hurricane Katrina on hospitalization rates. Patients were followed from the time of dialysis initiation. The events were hospital admissions. Patients were left-truncated if they initiated treatment in a non-affected clinic before enrolling in an affected clinic and right-censored at the earliest of: (1) the date of transplantation; (2) the date of death; or (3) the study end date.
The proportional rate model included a time-varying Hurricane Katrina indicator. The indicator was equal to “0” from the point of dialysis initiation (or inclusion in the sample) until August 21, 2005. The indicator switched to “1” on August 21, 2005 for patients receiving dialysis in one of the affected clinics during the period August 21, 2005 to August 29, 2005. It switched back to “0” on September 21, 2005.
Identification of the impact of Hurricane Katrina on hospitalization rates was based on comparisons of hospitalization rates during Hurricane Katrina with: (1) hospitalization rates before and after the Hurricane Katrina period (August 21, 2005 through September 21, 2005); and (2) hospitalization rates among patients previously treated at the affected clinics but who switched clinics or migrated away from the affected area prior to August 21, 2005.
The analysis also adjusted for patient age, sex, race (white vs. black/other), Medicaid coverage (a US health program for Americans with low incomes and resources, used as a proxy for lower income status), and clinical characteristics, including number of cardiovascular conditions, diabetes (as a primary cause of ESRD or comorbid condition), chronic obstructive pulmonary disease (COPD), nonambulatory status, serum albumin d/gl, hemoglobin level d/gl, and initial treatment modality (hemodialysis versus peritoneal dialysis).
Results
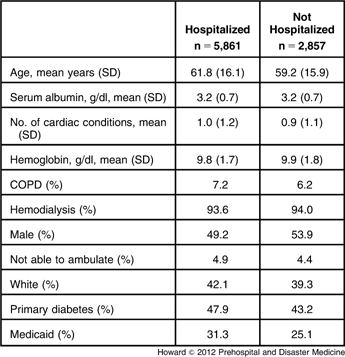
Characteristics of the sample are shown in Table 1. The first column shows the characteristics of patients who were hospitalized at any point during their period of observation. The second column shows the characteristics of patients who were never hospitalized. The groups differ in predictable ways (i.e. hospitalized patients have poorer health status).
Sample Characteristics

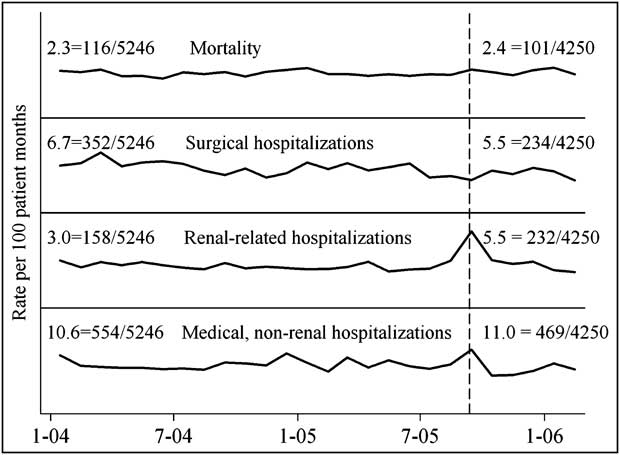
Figure 1 displays trends in mortality and hospitalization rates (expressed in terms of the number of events per 100 patients) by admission type. The numbers on the y-axis are the mortality and hospitalization rates for January 2004. The numbers next to the dashed line in the figure are the mortality and hospitalization rates for August 2005. Mortality rates were fairly constant over the study period. Surgical DRG admission rates decreased following Katrina. There is no discernable trend in medical DRG (non-renal related) admission rates through September 2005, after which the admission rate declined slightly.
Trends in Mortality and Hospitalization Rates by Cause. The vertical dashed line indicates September 2005. The first set of numbers in each graph indicates rates in January 2004. The second set indicates rates in September 2005. The scale for each graph is the same.

Only the admission rate for renal-related DRGs shows a large upward spike around Hurricane Katrina, rising from 3.0 admissions per 100 patient days in July 2004 to 5.5 admissions per 100 patient days during September 2005, before returning to normal levels.
Differences in rates reflect underlying trends in the number of hospital admissions (the numerator) and the number of patient days at risk (the denominator). The average number of renal-related admissions from August 2004 through July 2005 was 131 per month. There were 232 renal-related admissions in September 2005. The average number of patient days at risk from August 2004 through July 2005 was 5,457 per month. The number of days at risk during September 2005 was 4,250. The decline reflects a decline in incident dialysis cases in the period around Hurricane Katrina and outmigration from New Orleans before and after Hurricane Katrina among established dialysis patients.
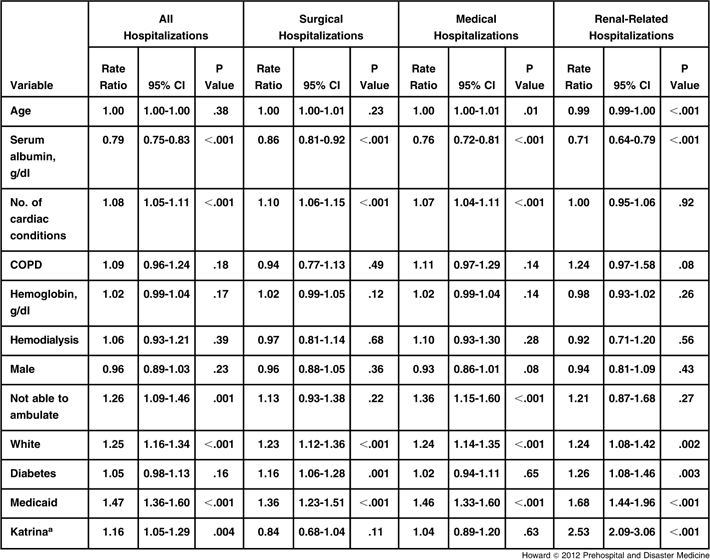
Table 2 displays results from the proportional rate models. The rate ratios for the time-invariant patient characteristics are generally in the expected direction. The rate ratios associated with the time-varying indicator for Hurricane Katrina are 1.16 for any hospitalization (P = .004), 0.84 for surgical DRG hospitalizations (P = .11), 1.04 for non-renal medical DRG hospitalizations (P = .63), and 2.53 for renal-related DRG hospitalizations (P < .001).
Cox-Proportional Hazard Estimates of the Impact of Hurricane Katrina on Hospitalization Rates

aThe time-varying Katrina indicator equals “1” for the period August 21, 2005 to September 21, 2005 and is “0” otherwise.
Multiplying the number of renal-related hospitalizations in September by [2.53 – 1] ÷ 2.53 results in an estimate of the number of excess renal-related hospital admissions attributable to Katrina: 140. This represents about three percent of total dialysis patients at the affected clinics (= 140 ÷ 4,250).
Discussion
Hurricane Katrina was associated with an increase in renal-related hospitalizations and a slight decline in hospitalizations for surgery. There was no change in the hospitalization rate for non-renal related medical DRGs.
The regression results indicate that patients enrolled in Medicaid and white patients are more likely to be hospitalized. Previous studies have also found that white patients are more likely to be hospitalized compared to minority patients.Reference Sehgal 9 Medicaid patients are of lower socioeconomic status, and may use the hospital as a substitute for outpatient care.
It was not possible to reliably determine the reasons for hospitalization within these broad categories. There were only 232 total hospitalizations during September 2005, and there was a great deal of variation in month-to-month admission rates for specific DRGs and diagnoses.
The authors believe this finding can be interpreted causally. As shown in Figure 1, the renal-related hospitalization rate remained unchanged through August and September 2004, the year prior to Hurricane Katrina. This observation suggests that the spike in hospitalizations during Hurricane Katrina was not a continuation of a pre-existing cyclical or seasonal pattern. The trends in hospitalizations by cause are also consistent with a causal interpretation. One would expect that a disaster would have the largest impact on hospitalizations for DRGs that are most closely related to the care of patients with end-stage renal disease, i.e., the renal-related DRGs. It is not surprising that hospitalizations for surgical DRGs declined during and following Hurricane Katrina. Patients and providers probably chose to delay elective surgeries.
Limitations
DRGs provide a convenient method of determining the reason for each hospitalization. However, one limitation of DRGs, as well as the diagnosis and procedure codes on which they are based, is that they do not necessarily reflect the reason for the admission. For example, a patient who was admitted for pneumonia but who received a coronary stent after being diagnosed with arthrosclerosis would be assigned to a surgical DRG.
The composition of the patient population changed prior to and immediately following Hurricane Katrina. Fewer patients started dialysis. The change in the composition of the population makes it difficult to precisely identify the impact of Hurricane Katrina on hospitalization rates. However, it is notable that despite the decline in the number of patients receiving dialysis in September 2005, the absolute number of renal-related hospital admissions actually increased.
The change in the composition of the sample of adopting an “intent to treat” perspective was addressed in the regression analysis. The “treatment group”, i.e., the patients for whom the Hurricane Katrina indicator equaled “1,” included patients who received dialysis treatment in the affected clinics after August 21, 2005 but evacuated prior to landfall on August 29, 2005. While this approach may have understated the effect of Hurricane Katrina on patients who were directly exposed to it, it does not make the unreasonable assumption that patients who remained in the affected areas are similar to those who evacuated.
The number of patients included in this analysis is larger than the number identified by the United States Renal Data System in its analysis of Hurricane Katrina-related mortality and morbidity. 5 The analyses differ in terms of timeframe, and this may account partly or entirely for the difference in the sample size.
Because hospitalization data are obtained from Medicare billing records, hospital admissions can be observed only for those patients for whom Medicare is a primary or secondary payer. Patients with end-stage renal disease who were not previously eligible for Medicare based on age or disability become eligible for Medicare 90 days after initiating dialysis.
This analysis leaves a major question unanswered: Does the increase in renal-related hospitalizations imply that patients suffered adverse outcomes during Hurricane Katrina? Or did patients seek inpatient care because they could not access their usual source of care? A prior study found that Hurricane Katrina did not increase mortality rates,Reference Kutner, Muntner and Huang 6 but mortality may be an insensitive measure of patient health.
Conclusion
Following Katrina, dialysis centers and US policymakers have stepped up efforts to improve preparedness planning, and the Centers for Medicare and Medicaid Services has promulgated new regulations for dialysis centers—the Conditions of Participation—that include a number of preparedness-related provisions. Preparedness planning is costly, and so it is important to test the assumption that dialysis centers’ pre-Hurricane Katrina preparedness planning was inadequate.
Regardless of whether hospitalized patients suffered adverse outcomes or were merely being “warehoused” while local dialysis clinics were closed, the results of this study serve to highlight a potential benefit of improved dialysis-focused preparedness planning: reduced hospitalization rates. While it is unreasonable to expect that a disaster as large and long-lasting as Hurricane Katrina would have no impact on hospitalization rates, even if dialysis clinics and patients followed preparedness guides and regulations to the letter, this study documents that three percent of dialysis patients in the affected clinics were hospitalized as a result of Hurricane Katrina. Aside from the direct financial cost of hospitalization, hospital admissions during disasters are costly in the sense that they put a strain on hospital resources and make it more difficult for other patients to receive care.
Abbreviations
- CI:
-
confidence interval
- COPD:
-
chronic obstructive pulmonary disease
- DRG:
-
diagnosis-related group
- ESRD:
-
end-stage renal disease
- SAFs:
-
Standard Analytical Files
- USRDS:
-
United States Renal Data System
Acknowledgements
The data reported here have been supplied by the United States Renal Data System (USRDS). The interpretation and reporting of these data are the responsibility of the authors and in no way should be seen as official policy or interpretation of the US government.