Introduction
Vineyards in France form a crucial component in territorial and economic development. Nowadays, there are over two million acres (800,000 hectares) of vineyards in 70 departments and 16 regions. There are currently 140 000 farms, and the field assures around 100000 direct employments and 500000 indirect. Between 7 and 8 billion bottles of wine are produced every year and over 147 million wine cases are exported for a total value of 7 billion euros.
Since one of the main causes of loss in the vineyard sector is due to diseases, a continuous protection approach is applied, which means that fungicides/pesticides are sprayed as uniformly as possible in the vineyard according to a regular, frequent calendar. More than 10 treatments are executed per season in several of the main wine-producing regions worldwide. There is, then, an interest in detecting initial symptoms of diseases to selectively target their treatment, preventing and controlling the establishment of the infection and its epidemic spread to wider patches or to the whole vineyard. Naked eye inspection is the main approach usually applied in practice, but the expert should be available for permanent monitoring, which is not practical in large vineyards. Disease diagnosis can also be carried-out in laboratory or in the field, but this demands professional knowledge. Both techniques are time consuming and their cost is high. An automatic tool, capable of not only replacing, to some extent, the inspector but also detecting symptoms earlier is hence needed. Early disease detection results in the need for inspecting internal change of leaf composition, so traditional RGB imaging sensors are not sufficient.
Current vineyard research is generally divided into 4 categories: yield estimation, quality evaluation, phenology prediction and disease detection (Whalley and Shanmuganathan, Reference Whalley and Shanmuganathan2013). (Hall et al., Reference Hall, Lamb, Holzapfel and Louis2002) reviewed the general optical remote sensing applications in viticulture. However, in what concerns disease detection particularly in the field, (Naidu et al., Reference Naidu, Perry, Pierce and Mekuria2009) and (Hou et al., Reference Hou, Li and He2016), tried to detect grapevine leaf-roll disease (GLD) with a spectrometer. In the first study they simply assessed the difference between healthy and diseased leaves but in the second, GLD disease was classified into three stages according to its infection severity.
Oberti et al. (Reference Oberti, Marchi, Tirelli, Calcante, Iriti and Borghese2014) investigated how the view angle can affect the detection’s sensitivity of powdery mildew in grapevine leaves. This study is conducted by applying a multispectral imaging approach. The above mentioned studies use traditional vegetation indices and try to find the best one correlated with the disease and its severity. MacDonald et al. (Reference MacDonald, Staid and Cooper2016), stated that the availability of a reproducible, efficient method such as hyperspectral airborne imagery to remotely detect and quantify disease at the vineyard scale has great potential for improving disease management by increasing the adoption of vine removal practices and thereby reducing economic impacts associated with GLD. In this study, the reflectance is recorded in a broad band which means that the computation will be a lot more considerable than in this study, since the intent is to only use a few spectral bands in the final analysis.
Practically, the intent is to target pesticides distribution on infected or susceptible areas in grapevines by using a Multispectral (MS) on-board sensor. The final sensor will combine texture, morphological and spectral data, which will be fed later on to a neural network, the spectral data being selected will depend on target diseases. In the following sections, only the spectral analysis will be presented for differentiating between healthy and symptomatic leaves affected by one of the most contagious and incurable vine diseases: the golden yellowing of vines or usually called ‘Flavescence Dorée’ (FD).
Materials and Methods
Vineyard diseases and identification tests
Vineyard disease detection is a complex task because some diseases have similar signs and symptoms. A disease can have different signs and symptoms sometimes depending on the grape variety, also several diseases can be present at the same time. Several factors, weather conditions, deficiencies, pesticides, can moreover produce symptoms that are similar to those of diseases.
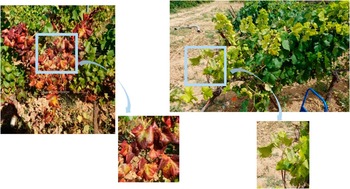
Among the large number of diseases, Flavescence Dorée (FD) is one of the most harmful, since it is incurable and endemic, causing loss of yield and degradation of quality. Today more than half of the French vineyard area is in compulsory control zone. FD has also spread to other European countries in southern Europe (Italy, Portugal, Switzerland, Serbia). FD has been declared a quarantine body by the European Union. (Chuche and Thiéry, Reference Chuche and Thiéry2014) have reviewed the biology and the ecology of FD. This phytoplasma disease is very contagious; it is transmitted from a field to another by diffusion of contaminated vegetative material and from a grapevine to another by Scaphoideus. titanus vector. The symptoms are expressed at least one year after contamination and can be limited to a single shoot. The following symptoms (some are shown in Figure 1) should be present simultaneously and on the same shoot to conclude the presence of Phytoplasma: discoloration of leaves which is function of the type of grapevines (yellow for white grapevines and red for red grapevines), lack of lignification of new shoots, mortality of inflorescences and of berries, non-awning of branches. Care must be taken in interpreting symptoms of FD because they are common to those of Stolbur of vines or what we frequently call ‘Bois noir’ (BN): another grapevine disease and only a Polymerase Chain Reaction can distinguished between the 2 diseases. The main difference, to note, is that the BN is not contagious.
Some symptoms of Flavescence Dorée on leaves, a red discoloration on a red grapevine variety (left) and a yellow discoloration on a white grapevine variety (right), a curling of leaves can also be seen.

Field measurements setup
Spectral tests were performed using a spectrometer FieldSpec3 (350 nm–2500 nm) with a spectral resolution of 1 nm and a Plant probe specially made for vegetative surfaces.
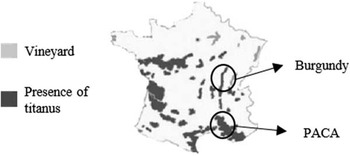
Various fields were tested located in two French vine regions (Burgundy and Provence-Alpes Côte d’Azur) (Figure 2). However this analysis will only focus on the data gathered from the south of France (PACA region), since the presence of FD in Burgundy in 2016 is not remarkable. Four varieties of grapevines were considered, 2 red ones: Grenache and Marselan, and 2 white ones: Vermentino and Chardonnay.
Vineyard regions and the distribution of S. titanus, a vector of Flavescence doree, in France (modified from Chuche and Thiéry (Reference Chuche and Thiéry2014).

Two acquisition campaigns were performed in 2016: the first one took place at the beginning of August which means that the symptoms were not yet clearly visible and the second one during September, late in the season, with symptoms clearly visible. The red grapevine varieties acquisitions were performed in the morning (10:00 to 12:00) and those relative to the white grapevine varieties were acquired afternoon (14:00 to 16:00).
From each variety, 4 healthy and 4 diseased grapevines were selected randomly. The number of samples was about 2–4 leaves per grapevine and 2–4 measurements per leaf. The choice of the grapevines and leaves was provided by a professional expert from the Regional Federation of Defense against Pests of Provence Alpes Côtes d’Azur. The tests were combined with Polymerase Chain Reaction (PCR) analysis on healthy and diseased grapevines to check the experts claim. In total, there were 213 diseased and 201 healthy assessed (63 Diseased Grenache and 64 Healthy Grenache; 63 Diseased Marselan and 64 Healthy Marselan; 47 Diseased Vermentino and 40 Healthy Vermentino, 42 Diseased Chardonnay and 34 Healthy Chardonnay). In order to ensure timely follow-up, the grapevines were located using a GPS, leaves also were labeled.
Spectral data analysis for disease detection
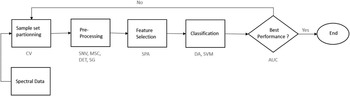
The Figure 3 provides a detailed description of the method used for the spectral analysis. After, the feasibility of choosing some spectral bands to describe the full data while maintaining its efficiency, will be, hence, proven.
Flowchart of methodology used for band selection for FD detection.

The most common pre-processing techniques for near-infra-red spectra can be divided into 2 categories: scatter-correction (SC) methods and spectral derivatives. The SC methods reduce the physical variability between samples due to scatter and adjust baseline shifts between samples. The Multiplicative Scatter Correction (MSC), probably the most widely used, is capable of removing artifacts and imperfections. It estimates the correction coefficients (additive and multiplicative contributions). Standard Normal Variate (SNV) is the second most applied method for scatter correction and it is very similar to normalization (object-wise standardization of the spectra). Detrending (DET) subtracts the mean or the best-fit line (in the least-squares sense) from data. Removing the trend from the data enables analysis on the fluctuations in the data about the trend. The spectral derivatives have the capacity to remove both additive and multiplicative effects in spectra. Savitzky-Golay (SG) is a method for numerical derivation of a vector including a smoothing step. To find the derivative at center point i, a polynomial is fitted in a symmetric window on the raw data, when the parameters for this polynomial are calculated, the derivative of any order of this function can be easily found analytically, this value is subsequently used as the derivative estimate of this center point. More details about the above cited techniques can be viewed in (Rinnan et al., 2009).
In this case, the data objects are described by a large number of features, so dimension reduction seems essential improve computational efficiency and to improve the precision of the analysis. The multi-spectral device can only contain few spectral bands, so feature selection us been used, which means locating the best minimum subset of the original features. This was done using the Successive Projection Algorithm (SPA) (Araujo et al., Reference Araujo, Kawakami, Galvao, Yoneyama, Chame and Visani2001), first, the instrumental response data are used to create chains of variables according to a sequence of vector projection operations designed to minimize multi-collinearity among the variables of the chain. Second, the algorithm creates a model for each of the candidate subsets of variables extracted from the chains generated. Finally, each model is evaluated and the optimal candidate subset is chosen according to its performance. This technique was used in many studies such as (Zhang et al., Reference Zhang, Tan, Shi and He2013) or (Yang et al., Reference Yang, Hong, You and Cheng2015). The classification task was applied using 2 classifiers: the Discriminant Analysis (DA) and the Support Vector Machine (SVM), as these are the most widely used in the literature.
The maximal area under the curve (AUC) was chosen as a criteria of the performance of a subset defined by SPA. The ideal is to have an AUC close to 1. Cross-validation (CV) with 10 folds was used for the validation of the classification.
Results and discussion
The ultimate goal of band selection is to determine the design of the MS sensor. We considered the spectra starting from 450 nm due to high signal to noise ratio near 350 nm. It is certain that all spectral bands are interesting but due to price weight constraints related to the UAV in which the MS sensor will be installed, only the region between 450 and 1000 nm was considered. This was selected as the classical sensors that are affordable are made of Silicium, which provides spectral information up to a maximum of 1000 nm approximately.
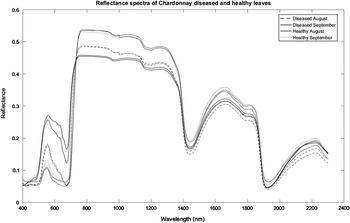
The results of combining asymptomatic observations (first acquisition campaign) and symptomatic ones (second acquisition campaign) are presented so that there are a larger number of samples to study. This doesn’t affect the analysis because there were no significant differences between data from the same leaf from August to September in the range of interest (450–1000 nm) (Fig. 4).
Reflectance of 2 leaves (Healthy and diseased) between August and September.

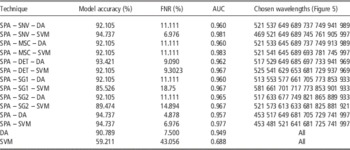
The full results of the SPA analysis for the Chardonnay variety are given in Table 1. The summary of the best perform model for the other varieties is given in Table 2. The model accuracy defined the percentage of testing set samples correctly classified and the False Negative Rate (FNR) defines the percentage of negative results that are, in fact, positive.
Classification results with complete spectra, with variable selection and with variable selection and pre-processing for Chardonnay varietal.

Best classification results for the rest of the grapevines varieties

According to Table 1, it can be seen that SPA variable selection technique gives a better precision than using the complete spectra. Moreover it allows a gain of time and a reduction of the complexity.
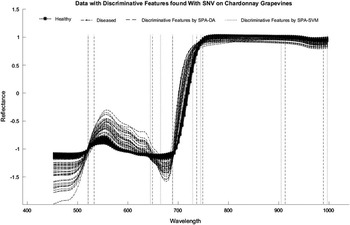
The best performance for the Chardonnay grapevine variety is for the models: SPA-SNV-SVM, the best combination of model accuracy (94.737%) and best AUC (0.981). The SNV, as we can see in Figure 4, was capable of differentiating between the 2 groups of spectra. For the other grapevine varieties, the best models were SPA-SNV/SG1-DA for Marselan, SPA-SG1-SVM for Grenache and SPA-SG2-SVM for Vermentino (Table 2).
In general, all the results that used SPA were acceptable. After inspecting the results from the best given models for all types of grapevines, we can deduce that the 520-600-650-690-730-750-800 nm bands are the most discriminating for all grapevines varieties. The wavelengths selected are, indeed, related to characteristic points (peaks, valleys, shoulders, inflections) in the spectra.
The results are promising; the band selection was proven to be successful for the discrimination between healthy and diseased spectra. The chosen bands reflect the ground-truth data; indeed, they are in direct relation with the effects of the FD on leaves, which means how the FD affects the leaf content. The first and second bands (520 and 600 nm) mark the beginning and the end of the green peak. The third and fourth (650 and 690 nm) bands define the beginning and the end of the red absorption band (the last one reveals also the beginning of the red-edge). The fifth and sixth bands (730 nm and 750 nm) define respectively the inflexion and the end of the red edge and the final one (800 nm) reveals the near-IR plateau.
Conclusions
The overall project had the objective to develop a specific solution for the automatic detection of FD diseases using low altitude-micro-UAV imagery. In terms of imagery, a high-resolution multispectral camera is in development to identify the occurrence of infected leaves, and the associated processing. Accurate and early disease detection is a crucial way of research in viticulture since it allows the winegrowers to reduce their use of phytosanitary products. This study confirmed the feasibility of choosing some specific spectral bands to characterize infected zones in vines. The best models were function of the type of grapevines and they had a performance of more than 94% (data not shown) with specific chosen bands approximately around: 530-600-650-690-730-750-800 nm.
The bands were selected using a contact probe, however the target sensor is for a non-contact sensor. This will introduce some further complications associated with a change of scale and distance that may degrade the accuracy of discrimination. To offset this, further work is being done on the coupling of spectral data with texture and/or morphological information.
Chosen wavelengths (nm) by DA and SVM classification on variables selected with SNV pre-processing.

Acknowledgements
We would like to thank Alice Dubois and Sylvain Bernard from the Regional Federation of Defense against Pests of Provence Alpes Côtes Azur, Corinne Trarieux and Jocelyn Dureuil from the Interprofessional Office of Burgundy Wine for their expertise. We also would like to thank the funders of the DAMAV project (Automatic Detection of Grapevine Diseases) and of course the winegrowers for their cooperation.