1. INTRODUCTION
Demographic transition is a phenomenon associated with changes in the age structure of a population due to a simultaneous decline in mortality and fertility. This phenomenon begins with a decline in mortality, followed by a fall in the birth rate. The majority of developed countries are at a very advanced stage of their demographic transition, whereas most African countries are at the beginning.
During this process, the working-age population temporarily increases faster than the number of the young and elderly. This change in the age structure has implications for a nation's economic variables. Indeed, as people of working age are more productive than those outside this age group, an increase in their proportion contributes to higher savings rates, thus, freeing up resources for investment in economic development and families’ well-being. This mechanism is called the “demographic dividend.”
For many developing countries, especially African countries, the demographic transition is a great opportunity to accelerate economic growth and reduce poverty. Using the approach developed by Bloom and Canning (Reference Bloom and Canning2003), Dramani (Reference Dramani2016) evaluates the contribution of demographic changes, including changes in age structure, to the economic performance of African countries between 1990 and 2013. Several aspects of this approach, which is based on the demographic support ratio and widely used in the economic literature, have been criticized (Hammer et al., Reference Hammer, Prskawetz and Freund2015). Indeed, the fixed productive age limits—i.e., 15–64 years—do not take into account current demographic, economic and social circumstances. For example, life expectancy is increasing worldwide, and a significant portion of the population aged 15–25 years is still in school and, therefore, inactive.
In this paper, we use the approach developed by Mason and Lee (Reference Mason and Lee2006, Reference Mason and Lee2012) and d'Albis and Moosa (Reference d'Albis and Moosa2015) to measure the support ratio and to assess the effects of changes in a population's age structure on economic growth in African countries. We find that incorporating the estimated economic life cycle into the analysis of the support ratio allows for a more refined estimate of these effects and provides the means to assess how economic policies can influence the support ratio and the magnitude of the first demographic dividend.
We explore the economic implications of changing demographic conditions in Africa using National Transfer Accounts (NTA) approach. In a similar analysis of developing countries, Mason and Lee (Reference Mason and Lee2012) include four African countries—Kenya, Senegal, Nigeria, and South Africa. Dramani and Ndiaye (Reference Dramani and Ndiaye2012) also estimate the first demographic dividend for Senegal using the NTA approach. In this article, we extend this previous work by using the NTA analysis for 16 African countries. We show that, despite the unfavorable demographic situation on the continent, a window of opportunity for the first dividend is open in most of the surveyed countries, except for Niger, which will see its window open in 2030, according to population projections based on the assumption of medium fertility.
This paper is structured as follows: In Section 2, we present the material and methods used to explore the economic implications of changing demographic conditions in Africa. In Section 3, we present and discuss the empirical results. Section 4 discusses the challenges facing NTA researchers in Africa, and Section 5 concludes with a summary and policy implications.
2. METHODS AND DATA
This study uses the theoretical and basic accounting framework of the NTA system, explained in detail in Lee and Mason (Reference Lee and Mason2011) and the NTA (2013) manual. The NTA approach is based on flow identity that captures economic resources by age. With the life cycle deficit, we trace the dynamics of these economic resources through three distinct periods of individuals’ lives. The support ratio is then used to analyze the economic impact of changes in the population's age structure.
2.1. Life Cycle Deficit
The NTA flow identity is an aggregate budget constraint for individuals of age x. The equation of this identity is as follows:
 $$\begin{equation}
\underbrace {{Y^l}(x) + {\tau ^ + }(x) + {Y^k}(x) + {Y^{p + }}(x)}_{{\rm{Inflows}}} = \underbrace {C(x) + {\tau ^ - }(x) + {Y^{p - }}(x) + S(x)}_{{\rm{Outflows}}},
\end{equation}$$
where Yl (x) is labor income received for age x; τ+(x) is inflow transfer; τ−(x) is outflow transfer; Yk (x) is capital income; and Y p+(x) and Y p−(x) are property income inflows and outflows, respectively, at age (x).
The flow identity in equation (1) can be rearranged to highlight the economic life cycle (LCD) and the mechanisms used to reallocate resources across age. The economic life cycle, which is a key concept in the NTA approach, is represented on the left-hand side by the LCD, the difference between consumption and labor income (C(x) − Yl (x)). Consumption includes households’ public and private consumption of various goods and services, and labor income encompasses employees’ earnings, including fringe benefits and self-employment and unpaid family workers’ incomes. On the right-hand side of the equation, the reallocation system consists of two economic mechanisms: net transfers (τ+(x) − τ−(x)) and asset-based reallocations, (YA (x) − S(x)), where asset income, YA (x), is equal to capital income plus property income, YA (x) = Yk (x) + Y p+(x) − Y p−(x):
 $$\begin{equation}
\underbrace {C(x) - {Y^l}(x)}_{{\rm{Life\hspace*{2pt} cycle\hspace*{2pt} deficit }}} = \underbrace {\underbrace {{\tau ^ + }(x) - {\tau ^ - }(x)}_{{\rm{Net\hspace*{2pt} Transfers }}}\,{+}\,\underbrace{{Y^A}(x) - S(x)}_{\hspace*{-2pt}{\rm{Asset\hbox{-}based\hspace*{2pt} Reallocations }}}}_{{\rm{Age\hspace*{2pt} Reallocations}}}
\end{equation}$$
The features of the LCD are combined with the population's age structure to calculate the economic support ratio.
2.2. Economic Support Ratio and the First Demographic Dividend
The NTA approach uses the support ratio as a standard tool to measure the economic effects of a population's changing age structure. The support ratio is defined as the ratio of the effective number of producers (L) to the effective number of consumers (N). Following Mason and Lee (Reference Mason and Lee2006), the support ratio at time (t) can be given by the following formula:
 $$\begin{equation}
{\rm{SR}}(t) = \frac{{L(t)}}{{N(t)}} = \frac{{\sum\limits_x {\varphi (x) \times P(x,t)} }}{{\sum\limits_x {\gamma (x) \times P(x,t)} }},
\end{equation}$$
where φ(x)is an age-specific weight that captures age variation in consumption related to physiological needs, culture, preferences, etc.; γ(x)is an age-specific weight that captures age variation in labor force participation, hours worked, unemployment, and productivity; and P(x, t) is the population of age x in year t. In equation (3), the numerator is the number of effective producers calculated by using the estimated labor income profile. Individuals aged 30–49 years are counted, on average, as one effective worker. Those at each single year of age are counted as one, less than one, or more than one effective worker, depending on the average labor income at that age relative to the average labor income of persons aged 30–49 years.
A similar approach is used to calculate the effective number of consumers: using the per capita consumption profile, we can construct a consumer equivalence scale. On average, those in the 30–49 age group are counted as one effective consumer. Those in each single-year age group are counted as one, less than one, or more than one effective consumer, depending on per capita consumption at that age relative to the average consumption by the 30–49 age group. The labor income and consumer weights are calculated for a base year and used in conjunction with population by age, historical estimates and projections to calculate the effective number of consumers and producers in each year.
The support ratio is then used to determine how changes in the population's age structure affect the economy. First, income per effective consumer,y(t) = Y(t)/N(t), can be written as a function of two multiplicative factors:
 $$\begin{equation}
y(t) = {\rm{SR}}(t) \times {y_l}(t),
\end{equation}$$
where SR(t) = L(t)/N(t) is the ratio of the number of effective workers to the number of effective consumers, andyl (t) = Y(t)/L(t) is the average income per worker. The support ratio SR(t) captures how changes in age structure influence the concentration of the population in the relative productive ages (30–49 years old). The average income per worker can be influenced by the level of technology, human capital, physical capital, the strength of political and economic institutions, natural resources, income earned on assets invested abroad, among other factors.
The growth rate in income per effective consumer, gr[yl (t)], is the sum of the rate of growth of the support ratio, gr[SR(t)], and rate of growth in income per worker, gr[yl (t)]:
 $$\begin{equation}
{\rm{gr}}\left[ {y(t)} \right] = {\rm{gr}}\left[ {{\rm{SR}}(t)} \right] + {\rm{gr}}\left[ {{y_l}(t)} \right].
\end{equation}$$
The growth of the support ratio, known as the first demographic dividend, equals the growth rate of effective labor less the growth rate of the number of effective consumers:
 $$\begin{equation*}
{\rm{gr}}\left[ {{\rm{SR}}(t)} \right] = {\rm{gr}}\left[ {L(t)} \right] - {\rm{gr}}\left[ {N(t)} \right].
\end{equation*}$$
The first dividend is positive when the effective number of producers is growing more rapidly than the effective number of consumers. In a similar fashion, the standard of living is measured by total national consumption per effective consumer, C(t)/N(t) (Mason and Lee, Reference Mason and Lee2012). This standard of living can be expressed as a function of consumption produced by each worker ((1−s)Y/L) and the support ratio (L/N).
 $$\begin{equation}
\frac{{C(t)}}{{N(t)}} = \frac{{(1 - s)Y(t)}}{{L(t)}} \times \frac{{L(t)}}{{N(t)}},
\end{equation}$$
where s is the savings rate and Y(t) is the total income. This is the amount of output produced beyond that which is saved and invested. A variety of important factors influence the output produced by each worker, Y(t)/L(t); these include physical capital per worker, human capital, natural resource availability, institutions, and so forth. For the moment, however, our interest is exclusively in the final term of the equation, the support ratio. Given consumption per worker, a higher support ratio translates directly into a higher standard of living. The effect of an increase in the support ratio on C(t)/N(t), measured in absolute terms, depends on the net productivity of workers. The effect in percentage terms does not, however. A one-percentage-point increase in the support ratio yields a one-percentage-point increase in consumption per equivalent consumer, as:
 $$\begin{equation}
{\rm{gr}}\left[ {C(t)/N(t)} \right] = {\rm{gr}}\left[ {(1 - s)Y(t)/L(t)} \right] + {\rm{gr}}\left[ {L(t)/N(t)} \right],
\end{equation}$$
where gr[X] is the growth rate of the argument X. Thus, the dividend associated with the demographic transition provides an opportunity to accelerate economic growth in Africa and alleviate poverty by raising standards of living.
Constructing NTA profiles relies on various data sources. First, we need household survey data that are reliable and nationally representative and that contain the variables of interest. These survey data provide detailed information on individuals, such as their age, the different categories of their private consumption of goods and services, work status, number of hours worked, sources and sums of private income for all activities, amount of taxes paid, kind of transfers received and given, and so on. Second, extended administrative records are necessary for the public-sector profile and should include public spending on education, health, and other public goods and services. Third, NTA profiles require data on the national accounts for the survey year to calculate the macro controls used to adjust the per capita profiles. Fourth, to calculate the aggregate profiles by age and to project the support ratios from 1950 to 2050, we use population data from the UN Population Division that count the number of individuals by single age.
Household survey data from each country are used to estimate the per capita profiles for the private sector. Before estimating private consumption profiles, households’ total consumption is categorized by distinguishing among private consumption of education, private health consumption and private consumption of others goods and services. Private consumption of education is attributed to those who were still going to school during the survey year. Similarly, private health consumption is attributed to those who were ill during the survey period. An equivalence scale is used to allocate consumption from the household level in the survey to the individual level. The scale begins at 0.4 for children aged 4 years or younger, increases linearly until the age of 20 to reach 1.0 and is held constant thereafter.
To estimate the labor income profiles, we use the households’ survey data, which include individuals’ information on their work status, sources and amount of income, and frequency of earning. Workers are separated in two categories according to their work status in the labor market: wage workers and self-employed. We construct estimates separately for both wage workers and self-employed workers using the methodology described in detail in the 2013 NTA manual. Following this methodology, NTA profiles are constructed by the Centre de Recherche en Economie et Finances Appliquées de Thiès (CREFAT). The other NTA profiles are taken from the NTA websites for Asian and Latin America countries and six African countries—namely, South Africa, Ethiopia, Ghana, Nigeria, Mozambique, and Kenya. The 2011 NTA profiles for Benin are provided by the Benin NTA team. The empirical results are presented below.
3. EMPIRICAL RESULTS AND DISCUSSION
3.1. First Demographic Dividend
The first demographic dividend has two possible interpretations: the per capita income growth rate due to changes in population age structure OR the effect on consumption of the changing age structure while holding constant work effort, interest rate, assets, saving and net transfers from the rest of the world. As the first dividend is influenced by the features of the economic life cycle and population age structure, we begin by analyzing the components of the LCD.
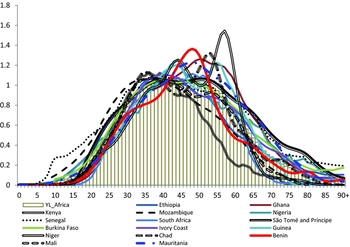
Figure 1 presents the per capita income profile for the 16 African countries in our analysis. To account for the level of development of each country, the per capita labor income profiles by age were divided by the average labor income of 30–49-year-olds in each country. The average observed values are the simple averages of the labor income profiles relative to the average labor income of the prime-aged adults in each country. Analysis of this graph shows that, compared to other NTA countries, children in African countries start working earlier.
Per capita labor income by age for 16 countries in Africa. Source: CREFAT, calculated by authors.

On average, labor income begins at age 6 and slowly increases as the individual approaches age 19. From age 20 onward, labor income grows rapidly, reaches its peak at around age 44 and gradually declines thereafter. In some African countries, average labor income by age, as a proportion of the average labor income of those aged 30–49 years—which can be interpreted as the relative productivity of labor by age—is higher than Africa's average. Thus, some countries, such as Senegal, Ethiopia, Burkina-Faso, and Mozambique, have relatively high labor productivity. In contrast, Nigeria, Mauritania, Guinea, and Benin are less productive than average. Similarly, average labor productivity for those younger than 35 is lower in Africa than in Asia and Latin America (Figure 3). Because the population is concentrated in those age groups in Africa, the number of effective workers in the entire population will be lower in Africa compared to Asian, Latin American, or high-income countries. Therefore, Africa will present the lowest support ratios in the world.
Another feature of the labor income profile in Africa is that the elderly (60 and over) are still active. In contrast, NTA estimates in high-income countries indicate that labor income declines rapidly after reaching its peak at around age 45. The absence of a general pension system and the importance of the informal sector explain, in part, why the elderly in Africa are still active in the labor force.
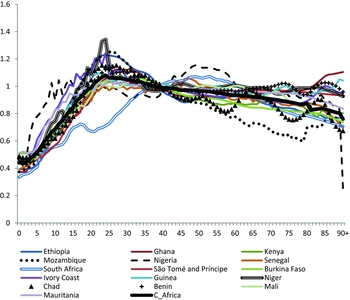
Figure 2 illustrates age variation in consumption. The variation in consumption by age reflects the physiological needs at each age; the importance of health and education spending on children and youths; whether or not a social security system or health care program exists for the elderly; and so on. The number of effective consumers will vary according to the population's age structure and the consumption behavior across the life cycle. Per capita consumption by age, relative to the consumption of the reference group—30–49-year-olds—is shown in Figure 2. The observed values for Africa are simple averages of the values for each of the 16 countries.
Per capita consumption by age for 16 African countries. Source: CREFAT, calculated by authors.

On average, children and the elderly consume less than adults aged 30–49 years. For example, individuals aged 20 years and under consume, on average, 70% of the average consumption of those aged 30–49 years. However, Figure 2 shows that consumption by age varies widely among the African countries observed. For example, in some countries, such as Niger, Ivory Coast, Mauritania, and Mozambique, those aged 20 years and under have above-average consumption, whereas Senegal and South Africa show below-average consumption by that age group. A comparison of Africa's consumption rates with those of Asia and Latin America show that children consume less in Africa (Figure 3). In addition, Africa's children consume less than children do in high-income countries. These observed differences between children's consumption in Africa and in high-income countries can be explained by the importance of education and health spending in high-income countries. In Africa, those who are 60 years or older consume less than those in the 30–49 age group, whereas it is the opposite in high-income countries (Mason and Lee, Reference Mason and Lee2012).
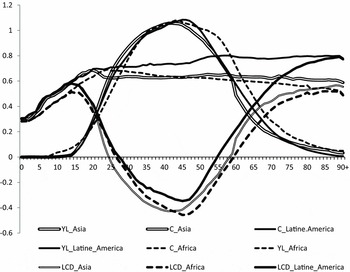
Life cycle deficit in Africa compared with Asia and Latin America. Source: CREFAT, calculated by authors.

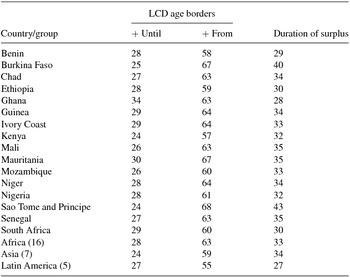
Figure 3 shows the life cycle deficit for Africa, Asia, and Latin America, expressed as the percentage of average labor income of those aged 30–49 years. Consumption exceeds labor income at the beginning and the end of life. When individuals reach working age, they produce more than they consume. Therefore, a surplus (the difference between consumption and labor income at each age) is generated among this working-age group for more or less 30 years. Although this pattern is remarkably similar among countries in which such data have been analyzed, we see differences between countries in terms of size and duration of the LCD. In Africa, surpluses are generated, on average, for 33 years. But in Latin America, the span of the surplus is 27 years, less than that observed in Africa and Asia (34 years). Thus, the young become economically independent earlier in Asia (25 years old) than in Africa and Latin America.
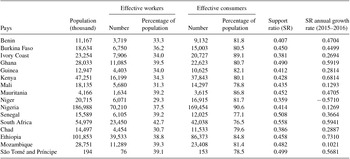
Using the NTA estimations, Table 1 reports the 2016 support ratios and their components for the 16 observed African countries. The first three columns show the population, the effective workers, and the effective consumers for each country in 2016. For the calculations, using estimates of the population for 2016, we estimate the economic life cycle of each country for a given year but not necessarily 2016. In Africa, the number of effective workers is between 29% and 43% of the total population for Niger and South Africa, respectively. The number of effective workers is relatively low in Africa compared to other countries, according to NTA data. These results highlight the fact that in Africa, the population is young, and the young are less productive than adults in the 30–49 age group.
Effective number of workers, consumers, and support ratio for 16 African NTA economies in 2016

Source: CREFAT, calculated by authors.
The number of effective consumers is between 77% and 91% of the total population in 2016, whereas in high-income countries that number is closer to 100%. The lower number of effective consumers in Africa reflects the higher concentration of younger people in the population and the weakness of their consumption relative to that of adults in the 30–49 age group (Figure 2).
The small number of effective workers in Africa is reflected in the support ratios calculated for the 16 countries in 2016. The number of effective workers per 100 consumers is between 35 and 56 for Niger and South Africa, respectively. In 2016, Senegal has 50 effective workers for 100 effective consumers. In Niger, growth of the support ratio is still negative, which shows that the structure of the population is not favorable to economic growth in this country. The weakness of Africa's support ratio is due primarily to low labor income by age (Figure 3).
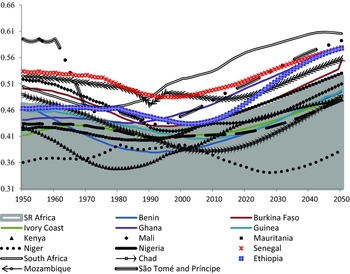
Figure 4 displays the recorded and predicted support ratios for the NTA African economies from 1950 to 2050. Since 1950, the African support ratio has declined and reached its lowest level in 1991. This decline in the support ratio is the consequence of the decline in child mortality, which has led to an increase in the proportion of children relative to the total population. As of 1992, the economic support ratio, on average, started to increase in Africa, thus, opening the window for the first dividend. But this common support ratio pattern conceals some disparities among the African economies. Although the support ratio began to increase at different times and for varying durations, every country in the sample is experiencing an increase, except for Niger, where the support ratio is expected to start rising in 2030. Only South Africa will peak within the next 30 years. The other countries will experience a prolonged increase in their support ratios through 2050.
Recorded and projected trends in the support ratios in Africa, 1950–2050. Source: CREFAT, calculated by authors from NTA data.

3.2. Second Demographic Dividend
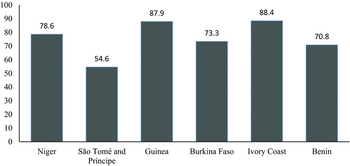
During the demographic transition, when the resources previously devoted to supporting a large, dependent population are shifted to spending on physical and human capital, economic growth can be enhanced. This phenomenon is known as a second demographic dividend and refers to the growth of output per worker. The burden of the working-age population is measured by the total net cost of children, which is the gap between the consumption and labor income profiles of those under the age 25, expressed as a proportion of total labor income of those aged 25 years and over (Figure 5). The results show that outside São Tomé and Príncipe, the child deficit is at least 70% of the total labor income of those aged 25 years and over. In Guinea, for example, of every 100 francs earned by adults, about 88 are spent to support children. Thus, there are very few resources to invest in creating new businesses or expanding existing businesses.
Total net cost of children in six countries in Africa as percentage of total labor income of adults aged 25 and over. Source: CREFAT, calculated by authors.

In African countries, children still represent a significant burden for adults because they represent a high proportion of the total population. The fertility decline that led to the first demographic dividend in several African countries should make more resources available for the investments required to achieve the second demographic dividend. The resources freed during the first demographic dividend can, indeed, be used to increase the stock of physical capital or be invested in the health and education of children. To achieve the second demographic dividend, investment in the human capital of children is crucial (Mason and Lee, Reference Mason and Lee2006; Bloom et al., Reference Bloom, Canning, Günther and Finlay2009).
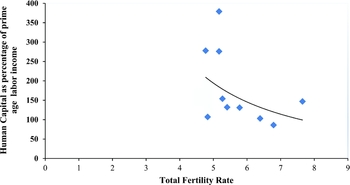
In a sub-sample of 10 African countries, spending on human capital per child ranges from 103% to 379% of the average labor income of 30–49-year-olds (Figure 6). On average, human capital spending per child increases when the fertility rates declines, thus, demonstrating that there is a quantity–quality trade-off. This trade-off has implications for the use of resources earned during the first phase of the demographic dividend. In principle, these resources could be used to increase the standard of living of the current generation (adults) and, at the same time, to invest in the education and health of the next generation (children). Under these conditions, the fertility decline will not only lead to the first demographic dividend, but also to a second demographic dividend by investing in human capital that will improve living standards over the long term. Mason and Lee (Reference Mason and Lee2012) estimate that the elasticity of human capital with respect to the total fertility rate is −0.83. This means that a 10% reduction in the average number of children per woman will have an 8% increase in human capital spending per child. These investments will increase the productivity of the next generation of workers, as well as the resources that will be available to finance consumption by the elderly (Mason and Lee, Reference Mason and Lee2010).
Human capital and the total fertility rate in selected African countries. Human capital (percentage of annual labor income, 30–49 years). Source: CREFAT, calculated by authors.

4. CHALLENGES NTA RESEARCHERS FACE IN AFRICA
NTA methodology contributes to understanding how changes in the population's age structure during a demographic transition can impact the broader economy. In addition, in high-income countries, NTA helps researchers to understand the impact of aging. In contrast to developed countries, in sub-Saharan countries, the NTA methodology can be used both to understand the issues related to the care of dependent youths and to anticipate future issues arising from an aging population. This is particularly important in Africa, where most of the sub-Saharan countries are just in the earliest stages of the demographic transition. As Mason and Lee (Reference Mason and Lee2012) argue, issues regarding aging must be addressed when the support ratio begins to rise.
d'Albis and Moosa (Reference d'Albis and Moosa2015) analyze the typical NTA limitations and challenges that researchers face when constructing labor income and consumption age profiles. Here, below are some limitations and challenges NTA researchers face in Africa.
First, NTA profiles are a cross-sectional analysis. This can limit the extent to which they can be used to forecast economic behavior for future generations. Indeed, age profiles change over the years due to different economic and non-economic conditions. For example, the age profiles for Benin in 2011 are not the same as the 2007 profiles. We also find that NTA profiles are sensitive to the business environment, to economic reform and to social crises (Ivory Coast and Mali for example).
Second, the estimated age profiles in Africa are cross-sectional and not frequent because there is not a long tradition of household survey data. Most household surveys began only in 1990s, when such data were needed to track poverty alleviation following the implementation of the Structural Adjustment program. Up until now, only Benin and Senegal have had estimations of NTA age profiles for two different years, 2007 and 2011 for Benin and 2005 and 2011 for Senegal. In the NTA approach, with no household decision-making models that can quantify how age profiles change over time, researchers must find ways to gather the relevant data from the country in question in order to update the age profiles every five or seven years.
Third, even if the data are representative at the national level, surveys are not always representative of older age groups, and this can limit the generalizations that are drawn. This creates a challenge for national statistical agencies or institutes in Africa to resolve this data problem.
Fourth, estimating how the LCD is financed in sub-Saharan African countries and taking into account household domestic production also create another big challenge for Africa countries. Nowadays, a few countries employ time-use surveys. For example, when the Counting Women's Work (CWW) project was launched in 2013, only South Africa, Kenya, Senegal, and Ghana had data available to engage in the project. Incorporating households’ domestic production in NTA is another big challenge in Africa, where more than half of the population is of women. A large percentage of the female population in Africa performs domestic activities that are not included in national accounts. In most African countries, women devote a lot of domestic time to educating children and building human capital. A deeper understanding of the allocation of domestic versus market time will help to build a new generation of policies that take gender equity into account—policies that acknowledge women's contribution to the economy.
Many of the NTA challenges in Africa can be overcome by collecting more accurate and frequent survey data, including data on the variables of interest for NTA analysis.
5. CONCLUSION
The aim of this paper was to explore the economic implications of demographic changes in Africa using the National Transfer Accounts approach. Based on the estimated economic life cycle of 16 African countries, we have shown that the growth of the economic support ratios has begun to rise in most African countries. This growth creates opportunities to accelerate economic growth and reduce poverty on the continent. In analyzing the results, it is also clear that support ratios are low in Africa compared to the ratios observed in East Asia, Latin America, and the Caribbean.
Also, spending on human capital is, on average, higher in countries with low fertility rates. This second result highlights a trade-off between the quantity and quality of children. This quantity–quality trade-off, if continued, will reinforce the benefits of the first dividend to generate a second dividend that will be more durable than the first.
We also find that young Africans are less productive than their counterparts in Latin America and Asia. This has resulted in low support ratios in Africa because effective workers represent only about 40% of the total population. The small number of effective workers on the continent is due primarily to low labor income by age. To benefit the first dividend in Africa, countries need to raise labor income for young people.
To benefit from the second dividend, countries should make efforts to invest in the education and health of children; improve infrastructure; and encourage active generations to accumulate savings to prepare for retirement.
APPENDIX A
Ages of entry into and exit from life cycle deficit/surplus and surplus year-span by country or group of countries

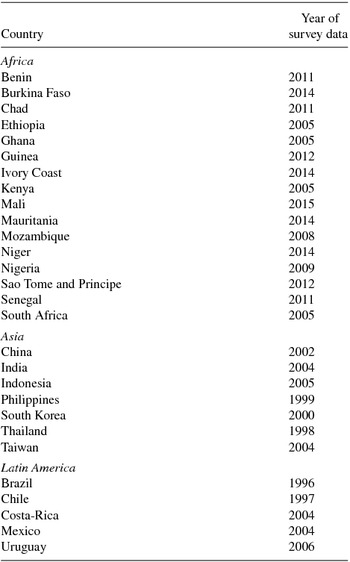
Country names and year of survey data