Clostridioides difficile infection (CDI) is the most common hospital acquired infectionReference Magill, Edwards and Bamberg1 and is problematic for infection prevention. Infection prevention efforts targeting this organism are multipronged, encompassing environmental cleaning, patient isolation, hand hygiene, and antimicrobial stewardship. These approaches highlight the complexity of CDI as an interplay between environmental, pathogen, and host factors.
Infection control and diagnosis of C. difficile disease is further complicated by asymptomatic colonization, which can range from 2.5% within the general population to over 50% in residents of long-term care facilities.Reference Morgan, Leekha and Croft2 Highly sensitive molecular testing likely overdiagnoses CDI by erroneously labeling colonization as disease.Reference Polage, Gyorke and Kennedy3 Public reporting based on positive laboratory tests magnifies these issues such that many centers are now looking at ways to restrict testing to cases with high pre-test probability of true C. difficile colitis,Reference Yen, Holtom, Butler-Wu, Wald-Dickler, Shulman and Spellberg4,Reference Madden, German Mesner and Cox5 or at adopting multistep testing algorithms hopefully more specific for CDI.Reference Culbreath, Ager, Nemeyer, Kerr and Gilligan6
Bundled interventions are successful in decreasing rates of CDI at some institutionsReference Abbett, Yokoe and Lipsitz7,Reference Weiss, Boisvert and Chagnon8 ; however, review of expert guidelines reveals that overall evidence for commonly used CDI control strategies remains low.Reference McDonald, Gerding and Johnson9,Reference Dubberke, Carling and Carrico10 Recent articles question the extent to which CDI is preventable.Reference Perencevich and Thom11,Reference Daneman, Guttmann, Wang, Ma, Gibson and Stukel12 These findings parallel those of large whole-genome sequencing studies documenting a remarkable diversity of C. difficile isolates, which suggest that much of our “nosocomial” CDI is likely caused by C. difficile isolates brought into healthcare institutions from community reservoirs.Reference Eyre, Cule and Wilson13
Various interventions aimed at decreasing CDI rates have been sequentially introduced at our institution since public reporting of LabID diagnoses began in 2013. We employed an interrupted time series (ITS) analysis to assess the impact of various CDI control mechanisms over the last 6 years in our institution.
Methods
This study was performed at a tertiary-care, academic, 865-bed medical center of from January 2013 through January 2019. The medical center includes an inpatient oncology unit, a bone marrow transplant unit, a solid-organ transplant unit, 6 intensive care units, and pediatric units (103 of 865 beds are pediatric beds). Hospital-onset C. difficile infection (HO-CDI) was defined as an NHSN reportable laboratory-identified (LabID) event.14 Organizational NSHN standardized infection ratios and rates per 10,000 patient days are as follows: For 2013, the standardized infection rate (SIR) was 0.718 and the rate per 10,000 patient days was 0.64. For 2014, the SIR was 1.098 and the rate was 1.00. For 2015, the SIR was 1.283 and the rate was 1.15. For 2016, the SIR was 1.212 and the rate was 1.09. For 2017, the SIR was 1.367 and the rate was 1.07. For 2018, the SIR was 1.101 and the rate was 0.86. For 2019, the SIR was 0.902 and the rate was 0.62. Community-associated CDI (CA-CDI) cases were defined as combined NHSN community onset (CO-CDI) and community-onset healthcare-associated (COHA-CDI) events.14
Rates of HO-CDI were calculated per 10,000 patient days by month. CA-CDI rates were calculated per 10,000 inpatient and outpatient visits by month. Patient visits to both inpatient and outpatient sites were used as a surrogate for all patients ‘at risk’ for C. difficile testing in our institution.
Interventions
A list of chronological interventions targeting CDI is shown in Table 1. Notably, the antimicrobial stewardship program, which performs both postprescription review and antibiotic restriction, expanded in 2010, and the laboratory has used molecular polymerase chain reaction assays for CDI diagnosis since 2011. In addition, chlorhexidine bathing was initiated in 2007 across intensive care units, and since 2012, it has been in place in all adult inpatient units. Contact precautions for endemic vancomycin-resistant Enterococcus and methicillin-resistant Staphylococcus aureus were stopped in 2013, but they remain in use for CDI. A 2-step cleaning process in which an initial quaternary ammonium product was followed with a 10% bleach for daily and terminal cleaning of rooms of CDI patients was enacted in February of 2014 (intervention 1). A UV-C device was purchased for use in terminal cleaning of rooms of CDI patients in March 2015. However, initial fidelity, as measured by room capture rates, did not reach >80% until August 2015. Capture has been consistently reliable since that time, and August 2015 was considered to be the complete implementation date (intervention 2). In June of 2016, a C. difficile–specific form of contact precautions was implemented as “contact plus” precautions. “Contact plus” isolation was maintained for the duration of the hospital stay and required providers to perform hand hygiene with soap and water rather than alcohol rub after providing care. It also assisted environmental services (EVS) in identifying rooms requiring 2-step cleaning and terminal UV-C device cleaning (intervention 3). In response to growing concerns of environmental contamination from asymptomatic carriers, the 2-step cleaning process specific for rooms of CDI patients was abandoned in June 2017 and was replaced with a sporicidal cleaner composed of peroxyacetic acid and hydrogen peroxide in all patient areas hospital-wide (intervention 4). Late in 2017, it was revealed that inpatient providers were ordering, on average, ~300 C. difficile tests per month (Appendix 1, year 2017) and that 25% of tests were performed on patients actively (within 24 hours) receiving laxatives.Reference Doll15 An electronic medical record (EMR) decision support tool was developed and implemented in March 2018 to assist providers in determining the appropriateness of C. difficile testing for all inpatients (intervention 5). The decision support tool asked providers to verify that at least 1 of the following clinical criteria was met: antibiotics within 30 days, fever >38°C in 48 hours, abdominal pain or tenderness present, white blood cell count >15 × 109/L, or <4 × 10⁹/L within 48 hours, or discharge from a healthcare facility in the past 30 days. Providers were then informed if the patient lacked 3 or more documented loose stools or if the patient had received laxatives in the last 24 hours. Providers were urged to cancel the test if the patient lacked the above signs or symptoms or had recently received laxatives. This intervention applied only to patients with inpatient and emergency room locations; outpatient sites did not receive decision support.
Major Intervention Impact on Hospital-Onset C. difficile Infection (HO-CDI) Rates

Note. CI, confidence interval; UV-C, ultraviolet C light; EMR, electronic medical record.
Compliance with interventions
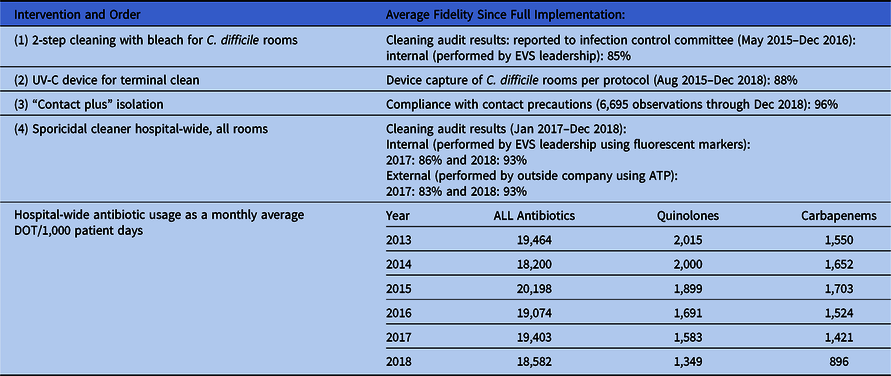
Cleaning audits, tracking of UV-C room capture, and assessments of compliance with contact precautions were performed monthly by infection prevention and environmental services team members throughout the study period. These data were reported back to stakeholders at a monthly infection control committee (Table 5).
Statistical analysis
We performed a segmented regression ITS analysis to estimate changes in monthly incidence rates of CDI before and after each intervention while taking into account preintervention trends. We adjusted for serial autocorrelation using the Durbin-Watson statistic and for seasonality and stationarity using the Dicky-Fuller unit root test.
Because the number of overall tests performed for C. difficile were suspected to be a major confounder in NHSN-defined HO-CDI rates, we attempted to control for testing volume in 2 ways. First, we created a separate model of the volume of inpatient testing performed before and after each intervention, with testing volume defined as the number of inpatient tests per 10,000 patient days. This denominator was chosen to allow for direct comparison to the HO-CDI model analysis.
We subsequently revised our initial model of HO-CDI rates to include test volume as a predictor. Within the adjusted HO-CDI model, the test volume was defined as the number of inpatient tests per 1,000 inpatient visits. This denominator for patient volume was chosen over patient days because the patient “risk” for C. difficile testing is similar for each admission but not for each inpatient day. Providers are discouraged from repeat testing for admitted patients.
Community-associated CDI rates defined as (CO-CDI +CAHO-CDI cases)/(inpatient + outpatient visits) by month were also compared over the same time period in a separate control model. The interventions targeting inpatients were not expected to affect the rate of C. difficile of possible or probable community origin. All statistical analyses were performed using SAS Proc Autoreg version 9.4 software (SAS Institute, Cary, NC). Normal distribution of the monthly rate data was confirmed with Kolmogorov-Smirnov, Cramer-von Mises, and Anderson-Darling goodness-of-fit tests using SAS software.
Safety of diagnostic stewardship
Interventions aimed at decreasing inappropriate testing for C. difficile are criticized as potentially unsafe in that diagnosis of true CDI may be delayed or not recognized leading to more severe disease. Safety of diagnostic stewardship strategies in this study was evaluated by reviewing colectomy procedures to treat severe CDI. All colectomy procedures as defined by current procedural terminology (CPT) codes included in the NHSN COLO category16 that were performed in our institution from January 2017 to January 2019 were matched against a composite list of positive C. difficile test results from October 2016 through January 2019. Any colectomy in which the patient had tested positive for C. difficile was evaluated by manual chart review by 2 infectious disease physicians (B.R., M.D.) for evidence confirming colectomy was done for severe CDI. Rates of colectomy for severe CDI were compared before and after the intervention that potentially limited testing for C. difficile. Opportunities for earlier diagnosis based on manual chart review were also documented if present.
Results
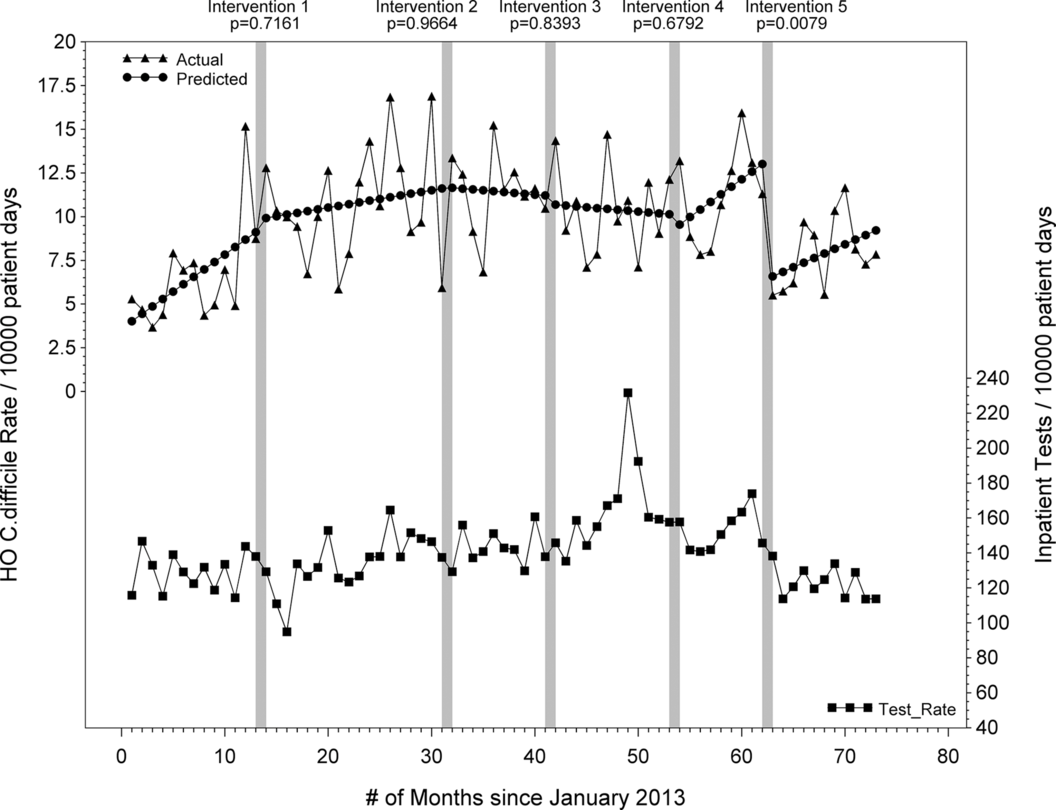
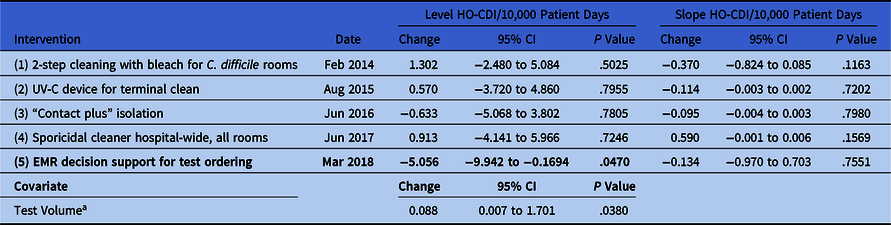
Interventions 1–4 failed to produce significant decreases in C. difficile rates over the 6-year study period (Fig. 1). Although the HO-CDI rate increased after the 2-step cleaning intervention, the rate of increase was decreasing, both nonsignificantly (Table 1). The other interventions focusing on infection control (interventions 2–4) similarly resulted in nonsignificant changes in both level and trends of rates throughout the study period. EMR decision support to limit testing did significantly decrease the HO-CDI rate by 6.7 cases per 10,000 patient days (P = .0079). The slope of the trends did not change before or after the diagnostic stewardship intervention (Fig. 1, top).
Interrupted time series (ITS) of hospital-onset C. difficile infection (HO-CDI) rates, January 2013–January 2019. The top graph corresponding to the left vertical axis shows the rate of HO-CDI during the study period (from results shown in Table 1). Interventions are depicted by horizontal lines. The significance of each intervention on HO-CDI rate is shown on the center of the lines. The bottom graph corresponding to the right axis shows the rate of inpatient tests performed for C. difficile using the same denominator of 10,000 patient days (from results shown in Table 2).

As a control, community-associated CDI rates were also compared over the same time period using ITS analysis (Table 2). No differences in levels or trends of these rates were detected with any of the interventions primarily targeting HO-CDI rates over the 6-year study period.
Major Intervention Impact on Control Outcome: Community-Associated C. difficile Infection (CA-CDI) Ratesa

Note. CI, confidence interval; UV-C, ultraviolet C light; EMR, electronic medical record.
a Community-associated rates defined as NHSN Community-Acquired plus Community-Onset Healthcare Associated cases
b Patient visits include inpatient, observation, and outpatient visits
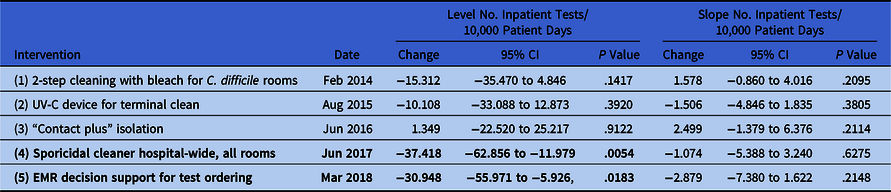
The raw number of molecular C. difficile tests per month fluctuated widely throughout the study period but reflected an overall increasing trend (Appendix 1 online). The ITS analysis of testing volume before and after each intervention demonstrated similar results to those of the analysis of HO-CDI rates (Table 1): nonsignificant declines in testing rates after interventions 1 and 2, a nonsignificant increase after intervention 3, and a significant decrease in the rate of testing for C. difficile after the EMR decision support intervention 5 (Fig. 1, bottom). Intervention 4 also produced a significant decrease in the testing rate in contrast to having no effect on the HO-CDI rate (Table 3).
Major Intervention Impact on Control Outcome: C. difficile Testing Volume

Note. CI, confidence interval; UV-C, ultraviolet C light; EMR, electronic medical record.
Inserting testing volume as a control variable in the original ITS model for HO-CDI resulted in decreasing the effect of intervention 5 on HO-CDI. In this adjusted model, the effect fell to 5.1 fewer cases per 10,000 patient days (compared to 6.7 cases in the unadjusted analysis) with some loss of statistical significance (Table 4). Testing volume was a predictor of CDI rate in this adjusted model (P = .0380).
Major Intervention Impact on C. difficile Hospital Onset Rates, Adjusted for Test Volumea

Note. CI, confidence interval; UV-C, ultraviolet C light; EMR, electronic medical record.
a Defined as the number of inpatient tests per 1,000 inpatient visits.
Organizational Performance in Key Infection Prevention Interventions

Note. CI, confidence interval; UV-C, ultraviolet C light; EMR, electronic medical record; EVS, environmental services; ATP, adenosine triphosphate; DOT, days of therapy.
Six colectomies for fulminant C. difficile colitis were completed in the 12 months prior to the diagnostic stewardship intervention, and 4 colectomies for the same indication were performed in the 9 months after the decision support intervention. Manual review of the 10 patients with fulminant C. difficile colitis in this cohort did not reveal any opportunities for earlier diagnosis or treatment.
Average performance for each intervention across the study period is shown in Table 4. Greater than 80% adherence was achieved for all infection prevention interventions 1–4. Hand hygiene, though not an intervention, was monitored with relatively stable rates of provider compliance; the annual overall compliance averages were 87% (2013), 83% (2014), 86% (2015), 88% (2016), 90% (2017), and 88% (2018). Fidelity to an evidence-based testing protocol did improve after intervention 5, as previously reported.Reference Fleming, Hess and Albert17
Discussion
We employed an ITS analysis to assess the impact of multiple interventions in a CDI reduction strategy at a tertiary-care medical center. Despite high-fidelity implementation of widely recommended infection prevention interventions to decrease CDI in hospitals, rates at our institution were not impacted by any major infection control intervention; rates only decreased with EMR decision support to limit inappropriate testing and thus decrease overall testing volume. This intervention led to a 27% decrease in raw numbers of C. difficile tests as previously reported.Reference Fleming, Hess and Albert17 In this study, testing rates (to account for monthly patient volumes) similarly decreased with the EMR decision support. HO-CDI–rate models adjusted for testing rates demonstrated a lessening effect of intervention 5 compared with unadjusted models, suggesting that the decrease in reported HO rates is driven by lower testing volume rather than by tangible infection prevention benefit.
Whether the impact of EMR-based decision support is sustainable remains unclear. The significant decrease in rate was sustained up to 6 months after implementation; however, underlying increasing rate trends did not change in the before and after periods (Fig. 1). Over time, provider behavior and rates may revert toward our original baseline.
Enthusiasm for diagnostic stewardship and other interventions that limit testing for C. difficile is growing in the setting of harsh penalties for hospitals who are not competing favorably against peer institutions in driving the reported rates of CDI lower and lower. This study provides further caution that diagnostic stewardship, while potentially sparing patients from overdiagnosis and overtreatment of CDI, is not actual infection prevention. When the denominator of testing rates is inserted into the equation, decreases in CDI rates erode. True hospital to hospital comparisons should incorporate the missing denominator of test volume; otherwise the data may be deceptive.
Although reducing unnecessary testing and treatment of patients is a noble goal, clinicians are concerned that barriers to testing are effectively reducing both necessary and unnecessary testing, particularly in automatized, EMR-based interventions that are not driven by clinical cases. The safety of diagnostic stewardship is difficult to ascertain. In evaluating cases of severe CDI resulting in colectomy at our institution over the last 2 years, we found similar rates of colectomies performed after initiating diagnostic stewardship, but cases numbers were too low to conclude that increasingly stringent testing is without harm. Providers at the bedside should retain some autonomy over administrators in determining which patients require testing.
This study has several limitations. The generalizability of this study is limited by its single-center design. Nap 1 strains were not specifically analyzed although they are detected in our molecular testing platform; these strains accounted for a minority of our cases (12%–24% of all positive results between 2014 and 2017). The potential colonization with C. difficile mislabeled as CDI in earlier months of this study may contribute to a lack of power to detect effects of infection control interventions 1–4. However, interventions 1–4 would be expected to impact both colonization and CDI at the hospital level. Antimicrobial stewardship is considered one of the strongest modifiable risk factors for CDI,Reference Dingle, Didelot and Quan18 and specific ASP interventions were not included in this study. Although the ASP program grew in scope and resources over the study period, a pre-existing robust program focused on both restriction and prior authorization of clinically high-risk agents. Agents purported to be higher risk for C. difficile, including fluoroquinolones and cephalosporins,Reference Kazakova, Baggs and McDonald19 are not specifically discouraged due to concerns about increasing use of broader-spectrum agents such as carbapenems. Carbapenems were restricted during the study period in January of 2018. Carbapenem restriction thus may be a confounder in the rate decrease around intervention 5. However, the mediating effect of test volume on this rate decrease would not be expected if antibiotic restriction were driving the rate reduction.
The importance of antibiotic use at an institutional level driving CDI rates was recently solidified in a large population-based study.Reference Kazakova, Baggs and McDonald19 However, to truly move the mark on CDI rates, an institution must slash its total antimicrobial usage by up to 30%.Reference Kazakova, Baggs and McDonald19 Thus, depending on the institution’s needs for antimicrobials to support various clinical programs, a robust antimicrobial stewardship program may not be enough to reduce the CDI rate.
The strengths of this study include longitudinal ITS design encompassing 6 years with a consistent molecular testing platform, high fidelity to performance of targeted interventions, and relatively stable background infection prevention practices.
This 6-year experience with aggressively implemented infection control interventions targeting CDI demonstrated a disappointing impact on endemic CDI rates. This study adds to existing data that outside of an outbreak situation, and traditional infection prevention guidance for CDI prevention has little impact on endemic rates.Reference Kazakova, Baggs and McDonald19 Diagnostic stewardship successes appear to be driven by a decrease in testing volume rather than prevention of actual disease. CDI is an epidemiologically complex problem without easily demonstrable solutions. Because there are opportunity costs to every intervention, stakeholders in public health should question at what point increasingly low CDI targets may compromise overall or competing patient safety goals.
Acknowledgments
None.
Financial support
No financial support was provided relevant to this article.
Conflicts of interest
All authors report no conflicts of interest relevant to this article.
Supplementary material
To view supplementary material for this article, please visit https://doi.org/10.1017/ice.2020.247