Clostridium difficile is the most common cause of healthcare-associated infection (HAI) and has drawn widespread attention from state legislation.Reference Magill, Edwards and Bamberg 1 In 2011, California became the first state to mandate statewide reporting of HA-CDI using National Healthcare Safety Network (NHSN) data. Importantly, such mandates assume that reported rates can and should be compared. However, publicly reported rates have not previously accounted for factors known to influence HA-CDI.Reference Kachrimanidou and Malisiovas 2 While other publicly reported HAIs are risk-adjusted at the hospital-level, similar methods are lacking for HA-CDI. 3 Prior work evaluating hospital-level predictors of C. difficile infection has been limited by the use of diagnosis codes to identify HA-CDI.Reference Ricciardi, Harriman, Baxter, Hartman, Town and Virnig 4 We sought to identify hospital-level predictors of HA-CDI across all California hospitals using NHSN data and to evaluate the impact of risk adjustment on interhospital comparisons.
METHODS
We conducted a retrospective cohort study of all California acute care hospitals to evaluate hospital-level factors associated with HA-CDI rates between April 1, 2010, and March 31, 2011. We used 2010 mandatory line-item hospitalization data and publicly available data to summarize patient population and hospital characteristics. 5 Consistent with prior work evaluating publicly reported HAIs and C. difficile colitis,Reference Ricciardi, Harriman, Baxter, Hartman, Town and Virnig 4 , Reference Tehrani, Phelan and Cao 6 we determined hospital type (eg, teaching, community, LTAC, pediatric), the number of licensed beds, and the percentage of admissions with select characteristics including age, gender, race, insurance, length-of-stay, admission and discharge location, surgery, and administrative codes involving any infection as a surrogate for antibiotic use.Reference Donnelly, Baddley and Wang 7 , Reference Polgreen, Yang, Bohnett and Cavanaugh 8 Comorbidities were assessed using the Romano score, a validated comorbidity index.Reference Romano, Roos and Jollis 9 We evaluated the percent of inpatients living in zip codes with the lowest quartile of education attainment and income and the highest quartile of poverty (% living below federal poverty level), overcrowding (occupied housing units with >1 person per room), and unemployment compared to the statewide range for the selected attribute using the 2006–2010 US Census American Community Survey. Hospital-specific HA-CDI incidence rates and C. difficile testing methods were obtained from NHSN data through the California Department of Public Health. 10
To evaluate hospital-level factors associated with HA-CDI rates, we used least absolute shrinkage and selection operator (LASSO) linear regression with 10-fold cross validation for initial variable selection. This method selects variables based on prediction criteria that guard against overfitting. Variables selected through LASSO were then entered into a Poisson regression model. To obtain adjusted hospital rates of HA-CDI based upon our final multivariate model, we fit a Poisson-Gamma hierarchical generalized linear model with saturated random effects.Reference Lee, Nelder and Pawitan 11 We used Kendall’s τ concordance statistics to compare the rank order of crude and adjusted HA-CDI rates. Additionally, we used crude and adjusted rates to group hospitals into performance categories based on the California ranking system for HA-CDI. This methodology involves the creation of an exact Poisson 95% confidence interval (CI) based on HA-CDI rates and determining whether the statewide HA-CDI mean rate was above (superior), within (average), or below (poor) the 95% CI at each hospital. We then assessed the agreement between crude and adjusted performance categories using Cohen’s (weighted) κ. This statistic is scaled from 0 to 1, with 0 meaning complete disagreement and 1 meaning complete agreement. All analyses were performed with SAS, version 9.3 (Cary, NC) and R, version 3.0.3 (Vienna, Austria).
RESULTS
A total of 366 acute care hospitals reported HA-CDI data through NHSN during the study period. One hospital was excluded due to an HA-CDI incidence rate nearly 7 times the state mean. Overall, 21 teaching hospitals (6%), 19 LTAC hospitals (5%), and 10 pediatric hospitals (3%) were included in this study. Of the 366 hospitals, 4 pediatric hospitals were also teaching hospitals, and 319 community hospitals were also identified. A total of 138 of hospitals (38%) used polymerase chain reaction for HA-CDI detection. Across all hospitals, the median number of beds was 172 (interquartile range [IQR], 93–313 beds), and the median number of annual admissions was 7,933 (IQR, 2,805–15,725 admissions). The median of the mean length-of-stay was 4.4 days (IQR, 3.7–5.7 days), and the median of the mean age was 49.4 years (IQR, 42.7–58.3 years). Patients with zip codes outside of California (<2% of all admissions) were excluded from summary socioeconomic descriptors.
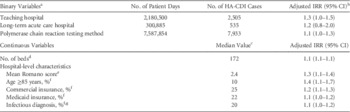
Table 1 shows final hospital-level characteristics selected for prediction of HA-CDI incidence rates. Antibiotic use as measured by the proportion of admissions with infection diagnoses was predictive of HA-CDI rates, whereas zip code socioeconomic factors were not.
Factors Associated with Publicly Reported Hospital-Associated C. difficile Infection (HA-CDI) Incidence Rates in California, 2010–2011, in a Multivariate Model.

NOTE. IRR, incidence rate ratio; CI, confidence interval.
a Compared with hospitals without the specified characteristic, hospitals with the characteristic have the estimated fold increase in HA-CDI incidence rate.
b Confidence intervals shown do not have conventional interpretations because variables were initially selected using linear regression testing and subsequently fit into Poisson regression models.
c Reflects the overall median of the specified variable; eg, the median percent of annual admissions of Medicaid-insured patients across all hospitals was 22%.
d Per 100-bed increase in the number of hospital beds, there was an estimated 1.1-fold increase in the HA-CDI incidence rate.
e Per unit-increase in mean Romano score across annual admissions, there was an estimated 1.3-fold increase in the HA-CDI incidence rate.
f Per 10% increase in annual admissions involving patients with the specified characteristic, there was an estimated fold increase in HA-CDI incidence rate.
g Included as a surrogate for antibiotic use.
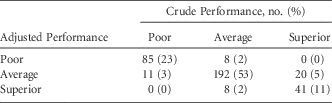
When comparing the rank order of crude and adjusted rates, concordance between ranks was 0.45 (95% CI, 0.39–0.50). For any given pair of hospitals, 27% of hospitals switched their relative ranking following adjustment. Adjustment for hospital-level factors shifted performance categories in teaching hospitals (5 of 21; 24%), community hospitals (40 of 319; 13%), and LTAC hospitals (2 of 19; 11%), but not pediatric (0 of 10; 0%) hospitals (Table 2). Agreement between crude and adjusted ranks was as follows: teaching hospitals (κ=0.73), community hospitals (κ=0.80), and LTAC hospitals (κ=0.80). The κ value for pediatric hospitals was not evaluated due to the small number of hospitals.
Comparison of Performance Categorization Using Crude and Adjusted Values for Hospital-Associated Clostridium difficile Incidence Rates in California Hospitals

DISCUSSION
Hospital-level risk factors for HA-CDI remain poorly understood, and publicly reported rates are based on unadjusted data. Providing adjusted rankings that account for hospital-level risk factors would enable more accurate and fair interhospital comparisons. We have identified multiple hospital-level predictors of publicly reported HA-CDI, many of which are nonmodifiable (eg, case mix). Furthermore, adjustment for these factors would change publicly reported performance categories in 13% of statewide hospitals.
Unsurprisingly, HA-CDI rates at each hospital are driven, in part, by the proportion of patients admitted with high-risk attributes. We found that hospital-level factors that predict higher HA-CDI rates are similar to known patient-level risk factors, including age and comorbidities.Reference Kachrimanidou and Malisiovas 2 Additionally, we found that hospital type and C. difficile testing methods affected HA-CDI rates. While we did not find that HA-CDI rates were impacted by a higher proportion of patients from poor zip codes, hospitals serving a higher proportion of commercially insured patients had higher HA-CDI rates. This may relate to the association between commercial insurance and greater antibiotic use.Reference Zhang, Steinman and Kaplan 12 , Reference Eng, Marcus and Hadler 13
Even though we have shown a reasonable correlation between crude and adjusted rates (κ~0.8), the remaining inconsistencies are highly meaningful to patients and providers in the 47 hospitals that move into or out of outlier categories after risk adjustment. Importantly, nearly half of these hospitals were categorized as superior in HA-CDI performance but were no different than average hospitals following adjustment. Furthermore, adjustment particularly affected teaching hospitals, with 25% shifting performance categories.
Our study has several limitations. First, we could not assess hospital infection prevention measures that may have influenced HA-CDI rates, but these are generally considered modifiable factors and are excluded from risk adjustment methods. Second, hospital characteristics were derived from administrative datasets subject to variability in billing and reporting practices. These data lacked information regarding many potential risk factors. Finally, because patients with infections were a surrogate for antibiotic use, we could not assess the type and duration of antibiotics used.
In summary, we used widely available, standardized electronic data to show that hospital-level characteristics predict HA-CDI and should be accounted for in hospital benchmarking. Public reporting of crude HA-CDI rates may be misleading to patients and providers, particularly those serving a greater proportion of older, chronically ill populations. Public health officials may consider using mandatory state hospitalization datasets to adjust for nonmodifiable hospital-level factors and may enable rate comparisons to focus upon hospital performance based on modifiable prevention strategies.
Acknowledgments
Financial support: This study was funded by the Department of Medicine, University of California Irvine School of Medicine.
Potential conflicts of interest: All authors report no conflicts of interest relevant to this study.