


The socioeconomically advantaged view the American dream as more attainable than the disadvantaged, with both race (Kinder and Sanders Reference Kinder and Sanders1996) and class (Newman, Johnston, and Lown Reference Newman, Johnston and Lown2015) profoundly coloring perceptions of economic, social, and political opportunities. Such perceptions are well founded. Those at the top of the socioeconomic ladder have significantly more political influence than those at the bottom (Bartels Reference Bartels, Jacobs and King2003, Reference Bartels2008; Carnes Reference Carnes2013; Gilens Reference Gilens2012; Page, Bartels, and Seawright Reference Page, Bartels and Seawright2013; Putnam Reference Putnam2015). Because income inequality depresses political interest and participation among those at the bottom of the ladder (Solt Reference Solt2008), the gap between the rich and poor, which continues to widen with each passing year (Keeley Reference Keeley2015; Saez Reference Saez2013), will tend to undermine representational equality, a key feature of democracy (Dahl Reference Dahl1971).
The advantaged will not remove the obstacles that disadvantaged Americans face unless they recognize that these obstacles exist (Putnam Reference Putnam2015). Such recognition requires that one group see the world from the other’s perspective, what scholars call “perspective-taking.” Are there mechanisms by which the “haves” can see the world from the lens of the “have nots”?Footnote 1 Might national service, an experiment used by many democratic societies to cultivate the values and norms of healthy democracies (James Reference James1910), be one such mechanism? Since President John. F. Kennedy famously challenged Americans—“Ask not what your country can do for you, ask what you can do for your country”—national service programs have multiplied with over 1.25 million Americans answering Kennedy’s call to serve.Footnote 2 More recent political leaders, regardless of political party, have trumpeted service programs, believing “citizen service changes people for the better” (Clinton Reference Clinton2001; Corporation for National and Community Service 2014). Such programs were not only created to assist communities in need, they were also designed to help promote a better understanding of the communities they serve.
If serving in a national service program can cultivate an understanding of the perspectives of the disadvantaged communities they work in, then it may reduce prejudice as well. Indeed, scholars have shown that knowledge gains, increased perspective-taking, and empathy for the out-group are central to reducing prejudice (Pettigrew and Tropp Reference Pettigrew and Tropp2008).Footnote 3 As such, a durable “real-world” intervention in which the advantaged segment of the population gains the perspective of the disadvantaged should also reduce prejudice toward the poor, and the racial and ethnic minorities who are disproportionately poor. This is significant given that social scientists know very little about specific policies and programs that have the capacity to decrease prejudice. A recent meta-analyses of research on prejudice reduction found a paucity of internally valid research; only 11 percent of prejudice reduction studies test the causal effects of real-world interventions (Paluck and Green Reference Paluck and Green2009; Paluck Reference Paluck2016; Paluck, Green, and Green Reference Paluck, Green and Green2018).
Studying the effects of national service programs and the intergroup contact that is at the core of these programs, however, has been elusive due to problems of selection bias. When an individual participates in a national service organization, does that individual already see the perspectives of the “have nots”? Or does participation in a service experience alter perceptions of social justice? Our study overcomes this selection bias problem. Teach For America (TFA) is a prominent national service organization that focuses on inequality. It recruits top college graduates and integrates them into low-income communities for two years. Crucially, TFA began in 2007 to implement a selection process that lends itself to a quasi-experimental regression discontinuity design (RDD). Having a threshold admission score allows us to compare the attitudes and belief systems of applicants who fell just short of the acceptance threshold score (and were not accepted to TFA) against those who fell just past the threshold score (and were accepted into the program) to make causal claims. We collect responses from over 32,000 TFA applicants across nine cohorts of applicants between 2007 and 2015 in an original survey, and combine this data with over 120,000 TFA applicant files with admissions scores. The scope of the data and the nature of the program being studied provides us with novel leverage over a research question of enduring interest that has proven difficult to answer.
Our results suggest that service in TFA has had a strong impact on participants’ attitudes and beliefs that reflect greater empathy and perspective-taking toward disadvantaged communities. Relative to nonparticipants, participants are more likely to believe that the economic, social, and political status quo in the United States is unfair. Ceteris paribus, participation catalyzes beliefs that systemic injustices are more to blame for the positions of disadvantaged Americans than their positions being a natural consequence of the individuals’ own decisions and merit. In addition, participation lessens prejudice toward disadvantaged populations and increases amity toward these groups. The effects we find are both substantively large and durable. These findings provide insight on the impact of national service programs, which is significant given the amount of public and private investments made in creating and maintaining such programs both domestically and globally. More broadly, these results have implications for understanding the impact of intergroup contact on perceptions of social justice in American society and prejudice reduction.
DIVISIONS BY CLASS AND COLOR
Income inequality has increased in the United States since the 1970s (Keeley Reference Keeley2015; Saez Reference Saez2013), and the proportion of Americans believing that the United States is stratified into groups of “haves” and “have nots” has grown in concert (Newport Reference Newport2015). With wealth and power increasingly concentrated among those in the top income brackets, scholars have noted a development of two Americas, with the rich and poor lacking common experiences. Worse, those who reside in the more privileged America do not even realize a different America exists for others, which may perpetuate inequality (Putnam Reference Putnam2015). At a minimum, the “haves” and “have nots” perceive the world differently. Research into the antecedents of beliefs about poverty has found that persons of higher socioeconomic status point to the ostensible fairness of the economic, social, and political system, emphasizing the centrality of hard work to achieve their privileged positions. In contrast, low-income Americans increasingly doubt the veracity of the American dream in which prosperity and success can be acquired through hard work alone (Kreidl Reference Kreidl2000; Kluegel and Smith Reference Kluegel and Smith1986; Newman, Johnston, and Lown Reference Newman, Johnston and Lown2015).
A similar divide about the fairness of the status quo and the opportunity gap exists along racial lines. White Americans view the economic system as notably more just than black Americans (Newport Reference Newport2015; Sigelman and Welch Reference Sigelman and Welch2009) and Hispanic Americans (Hunt Reference Hunt1996). Kinder and Sanders (Reference Kinder and Sanders1996) found a similar racial cleavage relative to the role of government in providing assistance to African Americans to remedy structural racial inequality. Although minority groups recognize that individualistic factors like hard work are key, they are more inclined than white Americans to believe that such factors are not enough in light of an unfair system. In contrast, the average white American feels no such structural remedies are necessary, instead tending to blame victims of poverty and their perceived deficiencies (Lipset Reference Lipset1996; Ryan Reference Ryan1971). The same is true of the criminal justice system. Most white Americans believe that the criminal justice system is fundamentally fair, while most African Americans do not (Hurwitz and Peffley Reference Hurwitz and Peffley2005). Perceptions of the criminal justice system are crucial, as people who believe the criminal justice system to be unfair tend to evaluate the entire political system more negatively (Lind and Tyler Reference Lind and Tyler1988).
Attitudes regarding the economic realm are deeply intertwined with racial attitudes in the United States. Since the mid-1960s, the coverage of poverty in the media has strengthened the association of racial minorities with the “undeserving poor” (Gilens Reference Gilens1999). As a result, Americans have increasingly viewed poverty through a racial lens (Gilens Reference Gilens, Schram, Soss and Fording2003). Indeed, many white Americans perceive poor individuals as members of a different group than themselves, creating the perception of the poor as “others,” rather than as in-group members (Alesina, Glaeser, and Sacerdote Reference Alesina, Glaeser and Sacerdote2001). As such, when considering the opinions of advantaged Americans about economic position and class, race is often consciously or unconsciously part of their calculations. In other words, any inquiry about the advantaged and disadvantaged socioeconomic segments of our population must examine racial animus.
THE PROMISE OF CIVILIAN NATIONAL SERVICE
Civilian national service programs have aspired not only to benefit the populations they serve, but to influence the beliefs, values, and careers of those that serve, through prolonged meaningful contact with vulnerable populations and a social ill. The hope is that when advantaged citizens work with disadvantaged citizens to advance their well-being, they will become better able to understand the perspective and life situations of the marginalized. William James (Reference James1910), for one, argued that national service could serve the interests of a healthy nation calling for universal national service to form “the moral equivalent of war” to “redeem the society from a dull existence built upon a ‘pleasure economy’ of insipid consumerism.” He described the youths of a “pleasure economy” in peace-time as “gilded youths,” and argued that they ought to be “drafted off” to do some form of civilian national service “to get the childishness knocked out of them, and to come back into society with healthier sympathies and soberer ideas.” His essay rallied Americans behind service in the interest of the nation, ultimately contributing to the creation of organized national service like depression-era Civilian Conservation Corps, and later, the Peace Corps and AmeriCorps.
Subsequent studies of national service and small-scale service learning programs provide preliminary indications that national service can, in fact, trigger “healthier sympathies and soberer ideas.” Numerous descriptive and qualitative explorations of service programs have found suggestive evidence that service learning results in heightened social awareness (Conway, Amel, and Gerwien Reference Conway, Amel and Gerwien2009; Yorio and Ye Reference Yorio and Ye2012), increased amity toward the community they service (Lee et al. Reference Lee, Olszewski-Kubilius, Donahue and Weimholt2007; Seider, Gillmor, and Rabinowicz Reference Seider, Gillmor and Rabinowicz2012), reduced reliance on stereotypes about marginalized groups (Greene Reference Greene1995), and higher appreciation for diversity and tolerance (Astin and Sax Reference Astin and Sax1998; Primavera 1999). Relative to AmeriCorps volunteers, specifically, Einfeld and Collins (Reference Einfeld and Collins2008) argue that not only did many participants increase their awareness of inequality but they also developed increased empathy, attachment, trust, and respect for those they worked with. Similarly, Giles and Eyler (Reference Giles and Eyler1994) observed that participants of a college service program became less likely to “blame social service clients for their misfortunes,” and more likely to stress a need for equal opportunity (p. 327).
THE POTENTIAL OF EXTENDED CONTEXTUALIZED INTERGROUP CONTACT
A crucial mechanism by which many nonmilitary national service programs purport to foster understanding, tolerance, and bridge-building is intergroup contact between advantaged and disadvantaged communities. Service in TFA typically involves integrating a high-achieving college-educated adult into a predominantly poor and minority neighborhood to teach for two years. Does this type of service-oriented contact that occurs between an advantaged group with a disadvantaged population result in added perspective-taking and prejudice reduction?
Extant research has shown that intergroup contact does not always foster bridge-building. In fact, contact can lead to greater polarization. In the face of economic class heterogeneity, advantaged high-income individuals are more likely to uphold a meritocratic ideology than those residing in more economically homogeneous contexts, and believe that their hard work rather than luck and privilege facilitated their more ideal circumstance (Newman, Johnston, and Lown Reference Newman, Johnston and Lown2015). Meanwhile, disadvantaged low-income individuals who see inequality are more likely to reject meritocratic ideology. In other words, intergroup proximity along economic lines has been found to lead to contrasting views around fairness and the justness of the status quo by income status, increasing class-based polarization. Similarly, previous research on “racial threat” (e.g., Key Reference Key1949; Blalock Reference Blalock1967; Goldman and Hopkins Reference Goldman and Hopkins2015) suggests that concentrated geographic racial diversity can catalyze more negative racial attitudes. Putnam (Reference Putnam2000) found that virtually all measures of civic health (e.g., voting, volunteering, and trust) are lower in more diverse settings. What emerged in more racially diverse communities was an unpropitious picture of civic desolation, negatively affecting everything from political engagement to the state of social ties.
But, under the right circumstances, intergroup contact can accomplish a great deal in fostering understanding and prejudice reduction. Early studies on desegregation revealed encouraging trends. After the U.S. military began desegregating, Brophy (Reference Brophy1945) found that the more deployments white seamen had with black seamen, the more positive their racial attitudes became. Similarly, white police officers who had worked with black police officers later objected less to teaming with and taking orders from black officers (Kephart Reference Kephart1957).
While the formulation of intergroup contact theory in Allport (Reference Allport1954) has inspired extensive research over the past half century to determine whether intergroup contact can increase perspective-taking and reduce intergroup prejudice, it is perhaps not surprising that the effects of contact have been mixed given the range of what “contact” can mean (Amir Reference Amir1969; Ford Reference Ford1986; Hopkins, Reicher, and Levine Reference Hopkins, Reicher and Levine1997; McClendon Reference McClendon1974). So what are the conditions for propitious intergroup contact? Allport’s (Reference Allport1954) formulation of intergroup contact theory maintained that ideal contact between groups requires four optimal conditions: equal status between the groups within the situation; common goals; intergroup cooperation; and support of authorities, law, or custom. National service programs like TFA foster contact that largely meet these conditions. With an aim to assist communities in need, the goals of participants are not in conflict with the goals of the community members, and there is no intergroup competition. As evident in the history of prominent national service programs like the Peace Corps, TFA, and AmeriCorps, national service programs are supported by political elites, the law, and custom. One might argue that the status between groups is not necessarily equal, as the advantaged group could be in a position of authority (e.g., teachers) in relation to the disadvantaged population (e.g., students and their parents). However, Allport emphasized status within situations as opposed to status generally. In a national service context, participants of the program are evaluated based upon the conditions of the community they are serving. As such, participants may not view themselves as having higher status within the service situation. With that said, contact theory research suggests that while Allport’s scope conditions facilitate prejudice reduction, all of them are by no means necessary (Pettigrew and Tropp Reference Pettigrew and Tropp2006).
Meta-analyses on intergroup contact has highlighted the import of Allport’s scope conditions (Paluck and Green Reference Paluck and Green2009; Paluck, Green, and Green Reference Paluck, Green and Green2018); however, are there other conditions that could help foster optimal intergroup contact? Two additional conditions that have the potential to increase the likelihood of engendering empathy and reducing prejudice are as follows: (1) extended contact with regards to duration and depth and (2) contact within a service context.
Research examining the potency of cross-group friendships in reducing prejudice demands a fifth condition for the contact hypothesis: the contact situation must provide participants with the opportunity to form an intimate relationship, like friendship. Living in a neighborhood with an out-group member that one might bump into is quite different from contact with a roommate or workmate with whom you have to regularly interact. Having an opportunity to closely see the life of an individual and their families, hear their stories, and develop a causal understanding of their life history can be a more powerful form of contact (Amir Reference Amir and Katz1976; Patchen Reference Patchen1999; Pettigrew Reference Pettigrew1998; Pettigrew and Tropp Reference Pettigrew and Tropp2006). Contact with diversity has been found to be a more positive and cohesion-enhancing experience with both greater depth of exposure (regular direct contact)—which allows for personal relationships to form—as well as the duration of exposure (contact over time), as prolonged contact allows for greater opportunities for individuals to learn about the out-group, change their own behavior, develop affective ties, and re-appraise their in-group (Pettigrew Reference Pettigrew1998). Theoretically, greater perspective-taking toward disadvantaged Americans could take hold when advantaged Americans “walk a mile in someone else’s shoes” rather than a meager step by having extended and meaningful interactions with disadvantaged Americans. The TFA two-year service experience, in which the participant is tasked to interact with the “out-group” as a full-time teacher in their school meets both criteria of potentially cohesion-enhancing intergroup contact: duration and depth.
Additionally, the particular context in which intergroup contact occurs matters profoundly. Institutional and societal norms structure the form and impacts of contact situations (Kinloch Reference Kinloch1981, Reference Kinloch1991). Indeed, Allport (Reference Allport1954) noted the importance of a supportive environment in which there is authority sanction and a cooperative context. For instance, consider the effects of living in a racially mixed neighborhood in South Africa with the apartheid policy of racial segregation. The context of state-condoned systemic discrimination was found to poison intergroup contact, as interactions between white and black South Africans were neither cooperative nor discouraged (Russell Reference Russell1961). Beyond a context of cooperation and authority sanction, what if contact with the out-group occurred with a service-orientation toward the out-group? Consider the effects of contact between nurses and patients in hospitals that not only condone but commit to serving low-income communities. Redman and Clark (Reference Redman and Clark2016) examined the case of preservice nurses in low-income areas and observed that as these nurses interacted with low-income individuals in the context of being a service provider, they critically reflected on the social justice issues of their patient population and “began to grapple with causes and explanations of the disproportionate share of social and health risks concentrated in particular segments of society”; they thus “experienced” rather than solely “intellectualized” inequality and social injustice (p. 446). As such, it matters if intergroup contact occurs in a setting where both the structures in which people are disadvantaged and remain disadvantaged are more likely to be visible to the advantaged, and the social norms in which the interaction occurs have a mission to help advance the disadvantaged out-group.
Deep prolonged contact, which is contextualized in a service context where inequality is a salient problem that needs to be tackled, can lead to enhanced understanding that has advantaged individuals see the world more through the lens of the disadvantaged segment of society. We hereafter refer to this form of context as extended contextualized intergroup contact. Extant research on perspective-taking over the last five decades indicates that perspective-taking translates to real shifts in attitudes and beliefs, as “the representation of the target comes to resemble the perspective-taker’s own self-representation” (Galinsky and Moskowitz Reference Galinsky and Moskowitz2000, p. 709). Namely, perspective-takers make the same attributions for others that they would have made if they had found themselves in that situation. In this study, the “perspective-takers” are advantaged Americans and the “targets” are disadvantaged Americans.
While extended contextualized intergroup contact is with a set of individuals, perspective-taking generalizes to an entire out-group. Specifically, contact that leads to more positive evaluations of individuals one interacts with leads to more positive evaluations of those individuals’ most salient group category (e.g., racial group and class). According to rich research on perspective-taking, these positive evaluations include a decrease in the denial of discrimination, which is the tendency to believe that intergroup disparities do not stem from institutional and individual-level discrimination (Todd, Bodenhausen, and Galinsky Reference Todd, Bodenhausen and Galinsky2012), engendering more positive attitudes toward social policy designed to redress intergroup inequalities. Given the target group becomes more “selflike” with enhanced perspective-taking, there should also be a reduction in “actor-observer bias”—a tendency to attribute one’s own actions to the particular situation and attribute another person’s actions to the actor’s overall disposition rather than to situational factors (Jones and Nisbett Reference Jones and Nisbett1971). Thus, if perspective-taking occurs, the following two predictions should come into fruition.
Prediction 1: Decrease in “denial of discrimination” increasing perceptions of injustice. Extended contextualized intergroup contact through national service will cause advantaged Americans to question the fairness of the status quo and see economic, political, and social systems as more unfair.
Prediction 2: Decrease in “actor-observer bias” enhancing perceptions of out-group victimization. Extended contextualized intergroup contact through national service will cause advantaged Americans to shift their beliefs for why low-income individuals and racial minorities are in a lower socioeconomic position to be more external. Participants will increase their focus on structuralistic as opposed to individualistic explanations of poverty.
Additionally, if there is greater perspective-taking, then prejudice reduction should also take hold. An increase in perspective-taking for a particular group is a meaningful mechanism by which prejudice for that particular group declines (Pettigrew and Tropp Reference Pettigrew and Tropp2008). Moreover, in viewing an out-group in more “selflike” terms, increased perspective-taking should translate to increased identification with the targeted out-group (Todd, Bodenhausen, and Galinsky Reference Todd, Bodenhausen and Galinsky2012). As such, if predictions 1 and 2 hold, we should see the following.
Prediction 3: Decrease in prejudice and increase in identification with the out-group. Extended contextualized intergroup contact through national service will cause advantaged individuals to have decreased levels of prejudice and increased levels of positive affect toward the disadvantaged groups with which they interact.
THE CASE OF TEACH FOR AMERICA
TFA is a prominent civilian national service program, established in 1990 with a mission “to enlist, develop, and mobilize as many as possible of our nation’s most promising future leaders to grow and strengthen the movement for educational equity and excellence.”Footnote 4 TFA was created with a two-pronged theory of change. In the short-term, TFA aspires for its teachers or corps members to affect positive change in the classroom in their two years of service. In the longer term, TFA aspires for its corps members to be so transformed by their experiences in the classroom that they would lead systemic change from their positions of power after their service in TFA (Foote Reference Foote2008). In 1993, TFA became a charter program of AmeriCorps, an organization created by the federal government to expand national service, and in 2004, TFA began receiving direct appropriations from the federal government. Over the last 25 years, more than 50,000 Americans have participated in TFA, working with 10 million children in 52 regions within 36 states. And TFA has become an attractive opportunity for recent college graduates and one of the most visible national service programs; over 50,000 individuals applied to TFA’s 2015 corps alone.Footnote 5 At more than 130 U.S. colleges and universities, over 5 percent of the senior class applied to TFA.Footnote 6
TFA is a strong case to consider the effects of nonmilitary national service on perspective-taking between advantaged and disadvantaged communities for a number of reasons. First, TFA attracts a large group of high socioeconomic status Americans. A college degree is an eligibility requirement to join TFA.Footnote 7 With only 34 percent of Americans holding a college degree (DOE 2014), TFA admits can be considered advantaged members of America’s social fabric from the fact that they are all college graduates. TFA admits can also be considered advantaged as most participants have college-educated parents (93 percent of alumni survey respondents), and educational attainment is a key factor in the reproduction of socioeconomic inequality (Black, Devereux, and Salvanes Reference Black, Devereux and Salvanes2005; Rouse and Kane Reference Rouse and Kane1995). Over 80 percent of our alumni survey respondents are from the middle or upper economic class, with nearly half noting they are at least from the upper middle class. Moreover, 64.2 percent are white, and to the extent that “white privilege” exists (Roithmayr Reference Roithmayr2014), this is another indicator that the average TFA participant is part of a more advantaged class.Footnote 8
Second, TFA places their participants in the lowest income schools in America. Over 80 percent of the students taught by TFA corps members qualify for free or reduced-price lunch (FRPL) and are either African American or Hispanic.Footnote 9 The socioeconomic make-up of the student population is intentional, as TFA seeks “partnership with communities where there is a disparity in educational opportunity along lines of race and class,” and all partner schools have “at least 60 percent of students eligible for FRPL, a common proxy for need.”Footnote 10
Third, extended contextualized intergroup contact between advantaged and disadvantaged populations occurs. As full-time teachers charged to help address education inequality for two years, TFA corps members are actively in contact with low-income students and their families for an extended period. Participants have the opportunity to view their students’ well-being and level of achievement in light of their familial, school, community, and societal context, which gives them a more nuanced view of the realities under which systemic inequalities might form. Moreover, their interactions with disadvantaged communities are contextualized within a social and institutional service context to advance the economic success of low-income students.
Finally, TFA is nearly ideal from the standpoint of teasing out causality. In 2007, TFA instituted a selection process with a cutoff threshold that enables us to implement a quasi-experimental regression discontinuity analysis. Our identification strategy exploits the fact that TFA admission is a discontinuous function of an applicant’s selection score, which represents TFA’s assessment of how effective the applicant will be in the classroom. The ability to leverage a selection process that enables causal inference, coupled with the visibility and attractiveness of TFA as a national service program for advantaged individuals to come into extended contextualized intergroup contact with disadvantaged individuals, makes TFA a strong case to consider in this study.
DATA AND MEASUREMENT
TFA selection data and an original national survey of TFA applicants are employed to test our predictions. Exact question wordings and coding schemes of each of our measures are provided in Online Appendix F. Unless noted otherwise, questions were recoded to be between 0 and 1 so that treatment effects can be interpreted in percentage point terms.
Selection Data
TFA maintains detailed selection data (e.g., contact information, application year, selection score, admissions decision, matriculation decision, placement information, and demographic characteristics), and we utilize this information for all applicants who made it to the final round of interviews in the application process for the 2007–2015 application cycles. While over 380,000 applied to TFA during this period, we restrict our focus to the third of applicants who were finalists for admission, and hence, at least close to being admitted. This amounts to a sample size of 120,417. Our primary focus is on alumni starting from the 2007 cohort because a selection process that involved the creation of an admission cutoff score was instituted in 2007. Since at the time of data collection, the 2014 and 2015 cohorts were still participating in TFA, they have not fully been “treated,” and are excluded from the main analyses. For the 2007 to 2013 cohorts, we have data on 91,752 applicants (see Online Appendix A for a detailed description of the final sample size).
Survey Data
Data Collection
On October 1, 2015, we emailed applicants invitations to participate in an online survey.Footnote 11 The survey stayed active for six months, closing on March 31, 2016.Footnote 12 Of the 91,752 TFA applicants from the 2007–2013 cohorts that were targeted, 27.2 at least started the survey and 21.1 percent completed the survey.Footnote 13 Among the 31,376 TFA alumni (2007–2013 corps members), 33.8 percent at least started the survey and 27.1 percent completed the survey. Of the 60,376 applicants who did not participate in TFA, 23.8 percent at least started the survey and 17.9 percent finished the survey. The survey completion response rate (AAPOR RR1 response rate) and partial response rate (AAPOR RR2 response rate) information by application cycle are shown in Figure A.1a and Figure A.1b in Online Appendix A, respectively. There are no notable differences in response rates by application year.
The average participant in our survey is 29 years old, has a college GPA of 3.52, and went to a selective undergraduate school (see Table B.2 in Online Appendix B). A minority received a Pell Grant in college (31.0 percent). Approximately 70 percent of the study sample are female (72.5 percent) and white (69.8 percent), and 94.1 percent of study participants have parents with a post-secondary education. Over half of the participants identify with a religion (58.1 percent), and nearly half of the study participants are upper class or upper middle class Americans (49.0 percent). Allaying concerns of survey response bias, we find that our participant population is generally representative of the overall TFA applicant population that made it to the final stage of the application process on each of the demographic characteristic in the application file, apart from race, alongside selection score and application year. Our participant sample skews somewhat more white; however, the skew is similar for both our admitted and nonadmitted survey sample (see Online Appendix B for additional details).
Outcome Measurement
There are four batteries that were asked to capture whether there is enhanced perspective-taking for disadvantaged populations with respect to class and race: (1) systemic injustice, (2) class-based injustice, (3) the relationship between class and education inequality, and (4) racial injustice. These questions map onto our three predictions: (1) reduction in “denial of discrimination,” (2) reduction in “actor-observer bias,” and (3) reduction in prejudice levels and increased identification with disadvantaged populations. Table B.3 in Online Appendix B provides summary statistics of each of our outcome measures.Footnote 14
Systemic Injustice: We measured attitudes around systemic injustice with two measures from a political support index (Booth and Seligson Reference Booth and Seligson2009) that assess the level of respect an individual has for U.S. political institutions (response options: 0 = not at all → 1 = a lot) and the extent to which citizens’ basic rights are protected by the U.S. political system (response options: 0 = not at all → 1 = a lot). We also consider an index of these two measures (system support index); the Cronbach’s alpha score is 0.71, which is acceptably high.
Class-Based Injustice: We considered four questions from the World Values Survey that center on blaming those who are poor for being poor as opposed to an external entity (e.g., government) or force (e.g., misfortune or lack of fairness), which have been found to be strongly predictive of support for government welfare policies (Alesina, Glaeser, and Sacerdote Reference Alesina, Glaeser and Sacerdote2001). For instance, if people perceive the poor as lazy, then individuals are less likely to support redistributive policies. Namely, we provided the respondent with four pairs of statements and assess which statement in each pair individuals agree with more: (1) “We need larger income differences as incentives for individual effort” (coded as 0) versus “Incomes should be made more equal” (coded as 1); (2) “People should take more responsibility to provide for themselves” (coded as 0) versus “Government should take more responsibility to ensure that everyone is provided for” (coded as 1); (3) “In the long run, hard work usually brings a better life” (coded as 0) versus “Hard work doesn’t generally bring success-it’s more a matter of luck and connections” (coded as 1); and (4) “People are poor because of laziness and lack of willpower” (coded as 0) versus “People are poor because of an unfair society” (coded as 1). We also consider an index of these four measures, which we call the class-based injustice index; the Cronbach’s alpha score is 0.77.
Class-Based Education Inequality: To capture beliefs on whether education inequality is due to individual effort or the system, we assessed three questions. We measured beliefs on whether poor families do not value education as much as richer families, and whether systemic injustices perpetuating inequity throughout society “are contributors to the inequality in educational achievement in the US” (response options: 0 = not a contributor/does not occur → 1 = main contributor). Additionally, we assess the extent to which a respondent believes that “students from low income backgrounds have the same educational opportunities as students from high income backgrounds” (response options: 0 = strongly disagree → 1 = strongly agree).
Racial Injustice: The racial injustice battery included four questions from the standard racial resentment or symbolic racism measures forwarded by Kinder and Sanders (Reference Kinder and Sanders1996) and Henry and Sears (Reference Henry and Sears2002).Footnote 15 Additionally, we asked “How much racial discrimination do you feel there is in the US today, limiting the chances of individuals from particular racial groups to get ahead?” (response options: 0 = none at all → 1 = a great deal). We also considered an index of this discrimination measure and the four racial resentment measures, which we refer to as the racial resentment index, given the Cronbach’s alpha score is 0.86.
We also asked a series of questions about the respondent’s level of satisfaction with the treatment of each of the of the following minority groups (response options: 0 = very dissatisfied → 1 = very satisfied): Asians, Hispanics, blacks, Muslims and immigrants. We consider each measure separately, and as a simple index, which we refer to as the discrimination index given high internal consistency of these measures; the Cronbach’s alpha score is 0.85.
Racial Prejudice: We employed two measures to capture prejudice. First, we implemented a skin-tone Implicit Association Test (IAT), a method for gauging unconscious antipathy toward various groups. The IAT has commonly been used in psychology (Greenwald, McGhee, and Schwartz Reference Greenwald, McGhee and Schwartz1998; Greenwald, Nosek, and Banaji Reference Greenwald, Nosek and Banaji2003), and increasingly in political science to predict political behavior (Arcuri et al. Reference Arcuri, Castelli, Galdi, Zogmaister and Amadori2008; Mo Reference Mo2015) and policy judgments (Malhotra, Margalit, and Mo Reference Malhotra, Margalit and Mo2013; Pérez Reference Pérez2010). The IAT is a method designed to capture the strength of associations linking social categories (dark skin color versus light skin color) to evaluative anchors (good versus bad).
The difference in categorization performance is argued to capture “implicit” (system 1) attitudes that are automatic, as opposed to “explicit” (system 2) attitudes that are effortful and conscious (Kahneman Reference Kahneman2003). The IAT effect is a D score, which ranges from −2 to 2, where negative (positive) numbers indicate an implicit bias favoring darker (lighter) skin tones over lighter (darker) skin-tones and 0 indicates neutrality (see Online Appendix C for additional details on the IAT).
Second, we asked about feelings of closeness to minority groups. We assessed this by asking, “Here is a list of groups. Please read over the list and check the box for those groups you feel particularly close to—people who are most like you in their ideas and interests and feelings about things.” We are interested in whether individuals check that they feel close to “blacks” and “Hispanics” given over 80 percent of the communities TFA serves in are African American and Hispanic. We also considered two additional groups to act as placebo checks; namely, our treatment should have no effect on how close they feel toward “the elderly” and “Christians.”Footnote 16 These questions translate to four dichotomous measures, where 1 indicates whether the respondent noted that he/she feels particularly close to the group in question.
IDENTIFICATION STRATEGY
To measure the causal effect of participating in TFA on its program participants, we employ a quasi-experimental method that exploits the fact that acceptance into TFA is a discontinuous function of an applicant’s selection score. This type of design allows for an identification strategy that compares the outcomes of those who fall just short of the threshold score (and are not accepted) against those who fall just above the threshold score (and are accepted into the program).
This is important because of selection bias concerns. Consider the following model:
 $$\begin{equation}
y_{i}=\alpha +\tau D_{i}+\epsilon _{i},
\end{equation}$$
where i represents the individual, y i is our outcome measure of interest, D i denotes receipt of the treatment (serving in TFA), εi is measurement error, and τ is our parameter of interest—the relationship between serving in TFA and our outcome measures of interest. If individuals select into service organizations because of unobserved determinants of later outcomes, which is plausible, direct estimation of τ by estimating model Equation (1) would be biased.
Say that each individual receives an application score X i as part of the admission score, and c is the cutoff score for admission. We can overcome this bias if the distribution of unobserved characteristics of individuals just shy of being admitted and not receiving the treatment, and the distribution of those just above the bar for admission and receiving the treatment, are essentially drawn from the same population. The following indicator variable for whether an individual scored above the cutoff can then act as an instrumental variable for receipt of the treatment (D i):
 $$\begin{equation}
D_{i}= \left\lbrace \begin{array}{@{}l@{\quad }l@{}}1, & \text{if}\ X_{i} \ge c \\[6pt]
0, & \text{if}\ X_{i} < c. \end{array}\right.
\end{equation}$$
Namely, if participating in TFA is based upon a cutoff score and the distribution of unobservable determinants of future outcomes is continuous at the selection threshold, our parameter of interest, τ, can then be identified without bias through an RDD. TFA participation is indeed based upon a cutoff score, and as we will show below, pretreatment characteristics are continuous at the cutoff. Note that as the cutoff differs for each TFA cohort, and we consider seven cohorts, we standardize the cutoff for each cohort to be zero (c = 0).
However, TFA does not employ a sharp cutoff strategy. While a cutoff score is employed in the admissions process, admission (rejection) into TFA is not necessarily guaranteed if an applicant scores above (below) the application score cutoff; rather, the probability of admission dramatically increases (decreases) if an applicant receives an admission score that is higher (lower) than the cutoff, as those close to the threshold score are reevaluated to ensure that the admissions recommendation based on the score should be upheld. Moreover, while the vast majority of admitted applicants decide to matriculate into the program, take-up of the program is imperfect. For the 2007–2013 application cycles, the matriculation rate was 83.20 percent. As such, we employ a fuzzy RDD, which does not require a 100-percent jump in the probability of receiving the treatment at the cutoff, and only requires the following to hold:
 $$\begin{equation}
\lim _{\Delta \downarrow 0} Pr[D=1|X=c+\Delta ] \ne \lim _{\Delta \uparrow 0} Pr[D=1|X=c+\Delta ].\end{equation}$$
As the probability of treatment jumps by less than one at the threshold, the jump in the relationship between outcome Y and the score X can no longer be interpreted as an average treatment effect. As in an instrumental variable setting, however, the treatment effect can be estimated by dividing the jump in the relationship between Y and X at c (the reduced form estimate) by the fraction induced to take up the treatment at the threshold (the first-stage estimate). Thus, our treatment effect τF for outcome Y is the following:
 $$\begin{equation}
\tau _{F}= \frac{\lim _{\Delta \downarrow 0} E[Y|X=c+\Delta ] - \lim _{\Delta \uparrow 0} E[Y|X=c+\Delta ]}{\lim _{\Delta \downarrow 0} E[D|X=c+\Delta ] - \lim _{\Delta \uparrow 0} E[D|X=c+\Delta ]},
\end{equation}$$
where we assume the distribution of unobserved characteristics is continuous at c, Equation (3) holds, and the F subscript refers to the fuzzy RDD.
Per Lee and Card (Reference Lee and Card2008), potential concerns that the admission score is coarse, due to the score being discrete rather than continuous, is addressed by clustering our standard errors at the admission score level. We control for each application year to allow for differences in averages by cohort year. Finally, the choice of bandwidth for the RDD estimator follows Imbens and Kalyanaraman (Reference Imbens and Kalyanaraman2011), which is a conservative estimate for fuzzy RDD estimates.
An important threat to a causal interpretation of our estimates is the possibility of response selectivity. Namely, the response rate of nonadmits might be lower than admits, creating imbalance in unobserved characteristics at the cutoff. Figures A.2a and A.2b in Online Appendix A plot the completion response rate (AAPOR RR1 response rate) and partial response rate (AAPOR RR2 response rate), respectively. There is no significant difference in the response rates at the cutoff (p = 0.104 for RR1, and p = 0.294 for RR2; see Table A.1 in Online Appendix A).
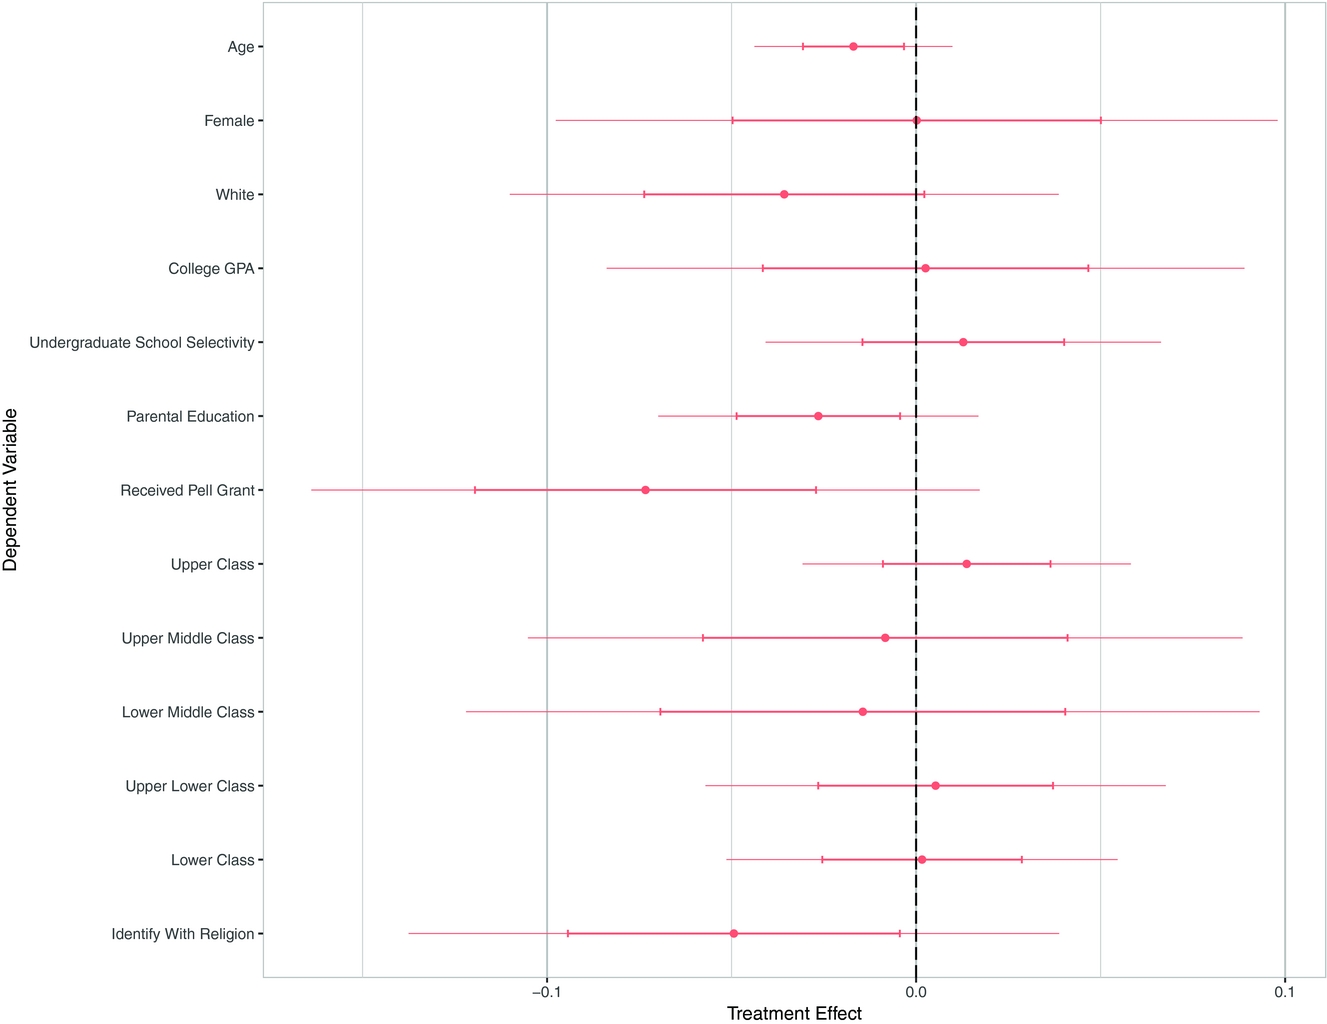
Response selectivity bias can still hold if there is a discontinuous difference in respondent characteristics around the score threshold. We test for this by assessing whether observable pretreatment measures of the study participants trend smoothly at the cutoff. TFA provided detailed selection data of all applicants to enable this exercise, which included demographic data on whether applicants qualified for financial aid when applying to college, college GPA, and the applicant’s undergraduate institution’s school selectivity. Additionally, we consider a number of pretreatment demographic characteristics that were collected in our survey: age, sex, race, whether a parent received postsecondary education, socioeconomic class while growing up, and identification with a religion. When we conduct a fuzzy RDD analysis for each of these demographic characteristics, there is not one measure that is significantly different at the cutoff (see column (3) of Table E.6 in Online Appendix E, where each coefficient is visualized in Figure 1).Footnote 17 The assumption that there are no meaningful differences in pretreatment measures at the cutoff holds.Footnote 18
Two-Stage Least Squares (2SLS) Estimates—Baseline Pretreatment Characteristics

Another threat to causal interpretation is if applicants and interviewers can manipulate the admission score. This is theoretically impossible because neither the applicants nor the interviewers are aware of the cutoff score. For further verification of nonmanipulation at the cutoff, we test the null hypothesis of continuity of the density of the forcing variable—the admission score—at the cutoff. Reassuringly, we find that there is no discontinuity at the cutoff in the density function of the admissions score (p = 0.27).
RESULTS
First we verify that being above the cutoff is an appropriate instrument for admission into and participating in TFA. This assumption is indeed robust; at the cutoff, there is a 28.7 percentage point (p < 0.001) bump in the admission rate and a 24.9 percentage point (p < 0.001) increase in TFA participation (see Figures A.3(a) and A.3(b), respectively, and Table A.1 in Online Appendix A).
Overall, we find strong evidence that, ceteris paribus, participation in TFA increases perspective-taking.Footnote 19 We detect (1) an increase in perceptions of systemic injustice against the disadvantaged per prediction 1; (2) a decrease in both class-based and racial resentment—increased beliefs that situational or environmental factors are the root cause of outcomes for those who are disadvantaged rather than the disposition of disadvantaged individuals per prediction 2; and (3) a decrease in prejudice and an increase in identification with disadvantaged minorities per prediction 3.Footnote 20
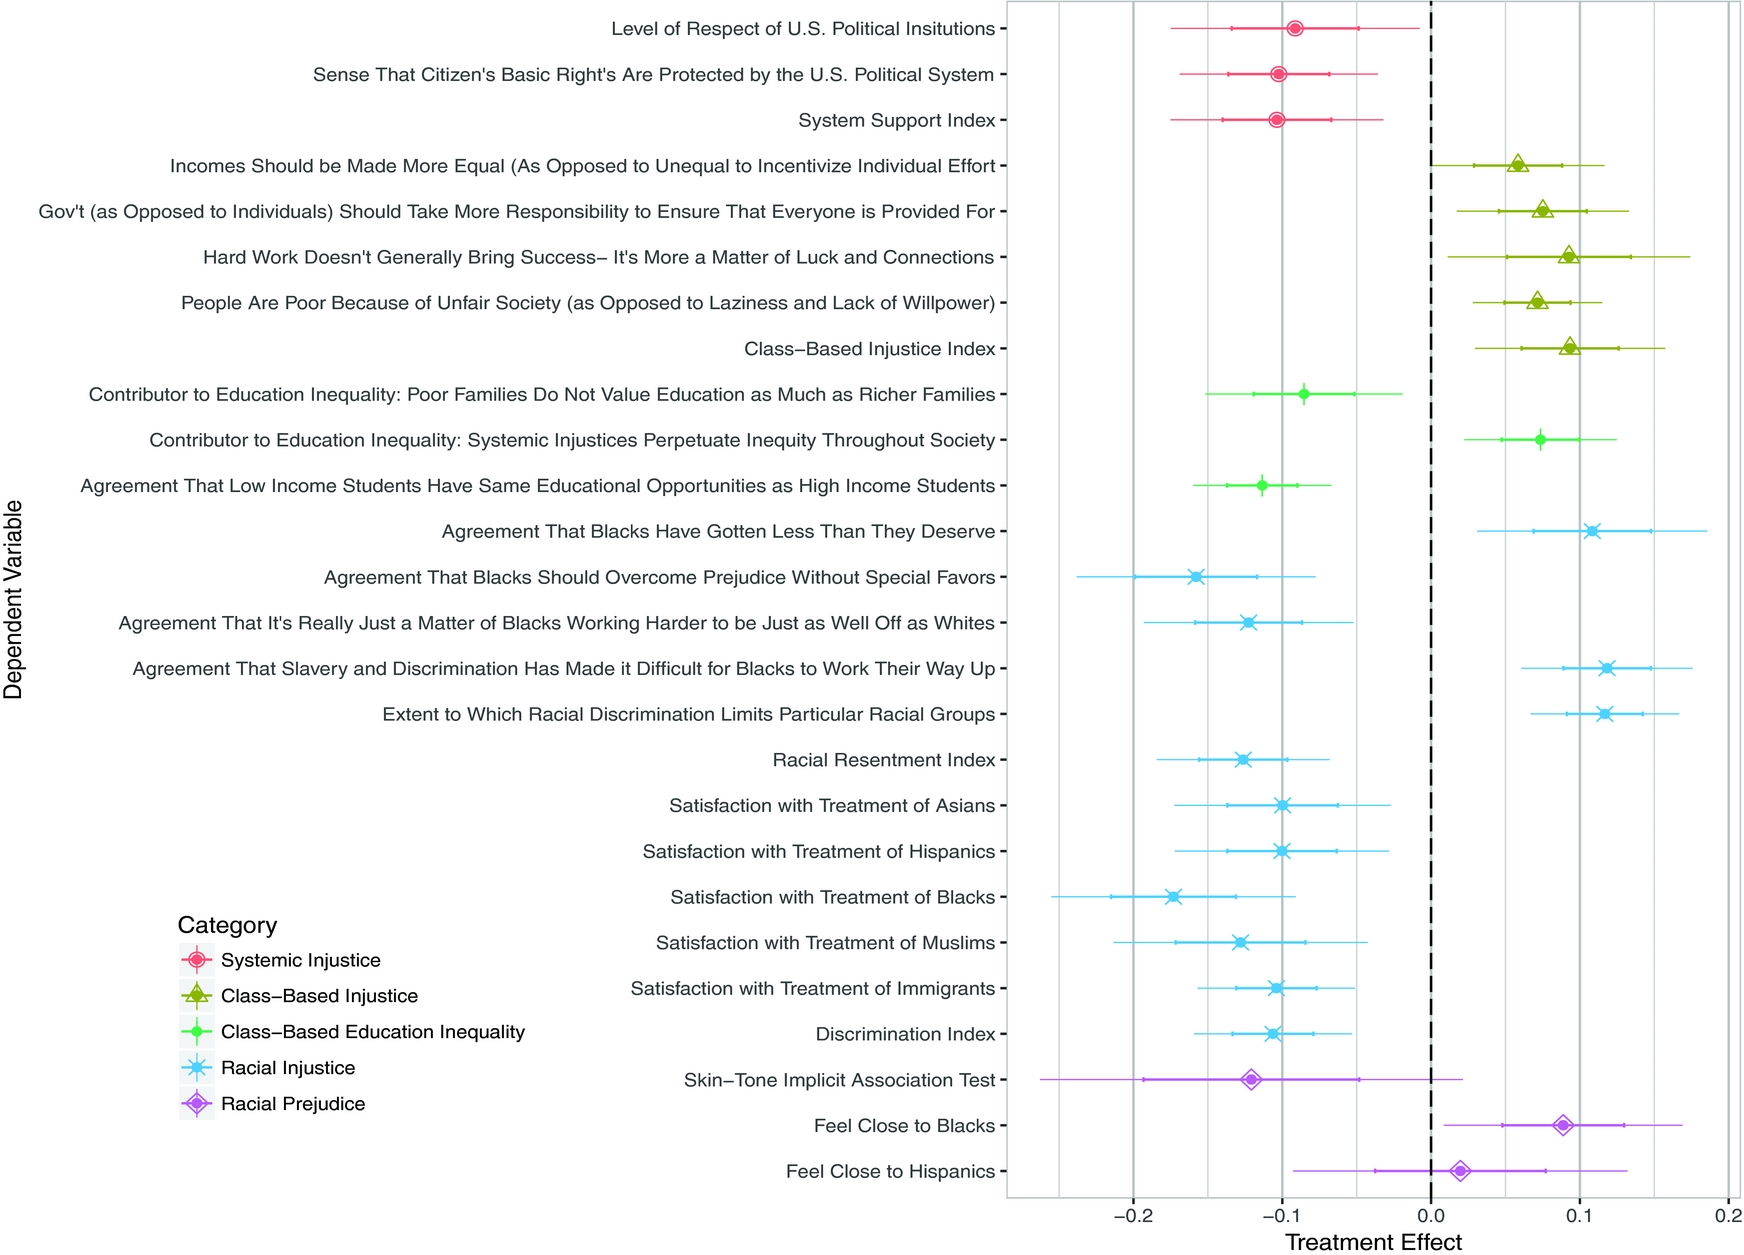
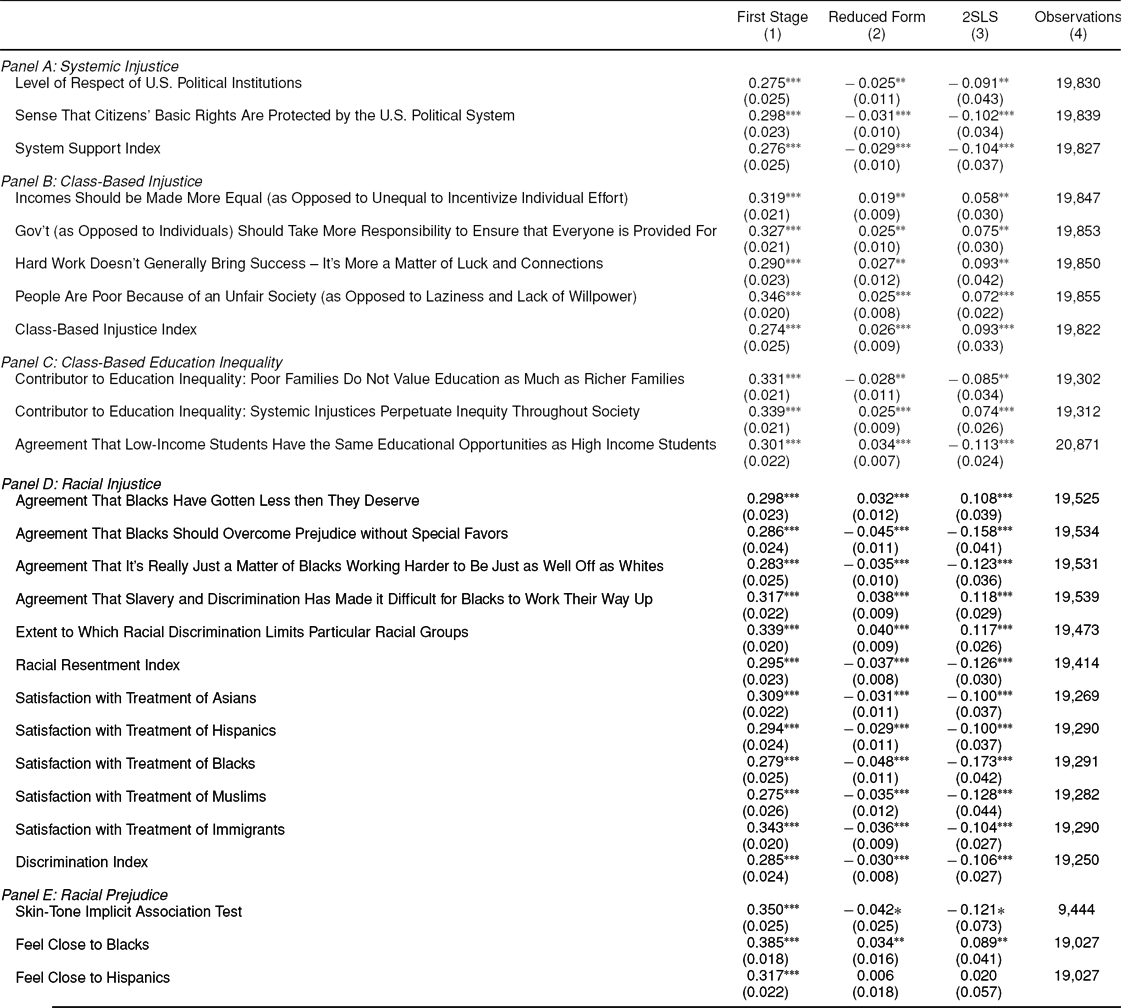
We implement the quasi-experimental estimation strategy described above.Footnote 21 The causal effect estimates from a fuzzy RDD analyses are reported in column (3) of Table 1 and visualized in Figure 2.Footnote 22 All our findings reported below are based on optimum bandwidth calculations according to Imbens and Kalyanaraman (Reference Imbens and Kalyanaraman2011) unless stated otherwise; however, the significance of the RDD results are generally not sensitive to alternative bandwidths (see Table E.7 in Online Appendix E).
2SLS Estimates—Complier Average Causal Effects of National Service
Complier Average Causal Effects of National Service—Fuzzy Regression Analyses

Notes: The table reports first stage, reduced form, and two-stage least square (2SLS) estimates. The 2SLS estimates instruments for Teach For America participation using an indicator for scoring above the cutoff. All specifications include controls for cohort year. Standard errors are clustered at the selection score level. *p < 0.10, **p < 0.05, ***p < 0.01.
Broadly, our results indicate that TFA participants are much more likely to lose faith in political institutions than the nonadmit “control” group, indicating a sense that the political status quo is not fair—a decrease in “denial of discrimination.” On our index of systemic injustice measures, we find that participating in TFA decreases an individual’s support for the current political system by 10.4 percentage points (p = 0.005). Specifically, participants are 9.1 percentage points (p = 0.032) less likely to respect “the political institutions of the United States” and are 10.2 percentage points (p = 0.003) less likely to feel that “citizens’ basic rights are well protected.” These drops are quite large. Let us consider our results against Haiti, a country that has consistently had among the lowest levels of political system support in the Americas over the last decade. We see that the decrease in system support due to TFA participation, as measured by our index, is nearly equivalent to the difference in political system support between the United States and Haiti (86 percent; see column (7), row (3) of Table E.9 in Online Appendix E).Footnote 23
Participation in TFA is also linked to a greater perception of class-based injustice, and participants are more likely to attribute poverty to underlying systemic issues and other external factors than to a lack of individual effort. We detect a 9.3 percentage point (p = 0.004) increase in participants’ support of pro-poor policy perspectives (class-based injustice index), which represents a 20-percent increase relative to the mean value of this measure for nonadmits (see Table B.4 in Online Appendix B for the mean value of each outcome measure by admission and participation status: (1) nonadmit, (2) nonmatriculants, and (3) matriculants). Specifically, TFA participants are more likely to argue for greater income redistribution (5.8 percentage points, p = 0.049) and greater government responsibility to ensure everyone is provided for (7.5 percentage points, p = 0.011). To understand the magnitude of these effects, we benchmark our effect sizes against the German population, as Americans tend to prioritize individualism over the role of the state, whereas Germans tend to prioritize state interference over individualism (Pew Research Center 2011). These two effects are equivalent to 30 percent and 37 percent, respectively, of the difference between how the average American answers these questions compared to the average German (see column (7), rows (4)–(5) of Table E.9 in Online Appendix E).Footnote 24 Further, TFA participation is linked to an increase in the belief that having a “better life” is more closely linked to “luck and connections” than to hard work alone (9.3 percentage points, p = 0.026) and that “poor people are poor due to an unfair society” as opposed to “laziness and lack of willpower” (7.2 percentage points, p = 0.001).
This general dissatisfaction with the broader political system and external blame attribution is detectable when we consider attitudes around the education system. We find that TFA participants are 7.4 percentage points (p = 0.005) more likely to feel that “systemic injustices that perpetuate inequity throughout society” contribute to the income-based education achievement gap, which represents an 11-percent increase relative to the mean value of nonadmits. Participants more frequently disagree that “students from low-income backgrounds have the same opportunities as those from high-income backgrounds”; there is an 11.3 percentage point differential (p < 0.001), which represents a substantial 24-percent decrease relative to the mean value of nonadmits. Likewise, TFA participants are less likely to attribute blame to the poor for class divisions in educational achievement. For example, we find that participants are 8.5 percentage points (p = 0.012) more likely to disagree that poor families “do not value education as much as richer families,” which represents a 13-percent decrease relative to the mean value of nonadmits.
Accompanying decreased blaming of poor communities, TFA participants are less likely to blame minority groups. We find that TFA participation results in a decrease of 12.6 percentage points (p < 0.001) in our racial resentment index, which represents a sizable 58-percent decrease relative to the mean value of nonadmits. To further put this effect in context, the reduction in racial resentment index is 72 percent of the difference between how black and white Americans answer these questions in the 2008 ANES (see column (7), row (12) of Table E.9 in Online Appendix E). Unpacking this index, we see that participants are more likely to attribute racial inequality in this country to systemic and historical factors than to lack of agency or effort on the part of black Americans. Participants are 12.3 percentage points (p = 0.001) more likely to disagree with the statement that “if blacks would only try harder they would be just as well off as whites,” and are 15.8 percentage points (p < 0.001) more likely to disagree with the statement that blacks should “(overcome) prejudice and (work) their way up. . .without any special favors.” From the perspective of societal injustice, they are also more likely to attribute any difficulty in upward social mobility on the part of black Americans to “generations of slavery and discrimination” (11.8 percentage points, p < 0.001) and racial discrimination in today’s society (11.7 percentage points, p < 0.001).
Further, compared to the control group, TFA participants are 10.6 percentage points (p < 0.001) less satisfied with the treatment of minority groups in our society as a whole, which represents a 27-percent decrease relative to the mean value of nonadmits. When considering the assessment of discrimination against various minority groups separately, the degree of this dissatisfaction differential ranges from approximately 10 percentage points for Asian Americans, Hispanics, and immigrants (p = 0.000–0.007) to 17.3 percentage points (p < 0.001) for black Americans.
We also find evidence of prejudice reduction through our measure of implicit bias toward darker skin color—the skin-tone IAT. We find that TFA participants score on average 0.121 points (p = 0.096) lower than the control group on this measure.Footnote 25 This difference is economically meaningful, as it represents 40 percent of the mean value of nonadmits. However, this difference is only weakly significant at the optimal bandwidth. As the IAT test was a supplement to the survey, and thus subject to a smaller sample size, and the optimal bandwidth recommended by Imbens and Kalyanaraman (Reference Imbens and Kalyanaraman2011) is a conservative estimate for a fuzzy RDD, we extend the bandwidth measures to twice the optimal value and find that the impact of TFA participation on the IAT score is a decrease of 0.087 points (p = 0.038). To place this result in context, we consider the level of skin-color-based prejudice for white, Hispanic, and black Americans, as intergroup bias research suggests that skin color-based prejudice would be lower for those of darker skin color (Fu et al. Reference Fu, Tarnita, Christakis, Wang, Rand and Nowak2012; Billig and Tajfel Reference Billig and Tajfel1973). We find that our treatment effect is roughly equivalent to the 0.109 point difference in skin-tone-based prejudice between white and Hispanic Americans and a third of the 0.319 point difference in skin-tone-based prejudice between whites and African Americans (see column (3), rows (13)–(14) of Table E.9 in Online Appendix E).Footnote 26 The fact that we see an effect on the IAT is notable, as the IAT is a measure of automatic and unconscious attitudes, which are difficult to shift (Rydell and McConnell Reference Rydell and McConnell2006).Footnote 27
Finally, not only does TFA participation result in a decrease in certain measures of prejudice, but participants are also more likely to report feelings of “particular closeness” (in “ideas, interests, and feeling about things”) to both African Americans and Hispanics, the two most-served minority populations within the organization. In the 2014–2015 academic year, 48 percent of the student population at TFA placement schools were African American, while 35 percent were Hispanic.Footnote 28 Specifically, compared to nonparticipants, participants report feeling 8.7 percentage points (p = 0.030) closer to African Americans and 2.0 percentage points (p = 0.731) closer to Hispanics, though the latter effect is not statistically significant.
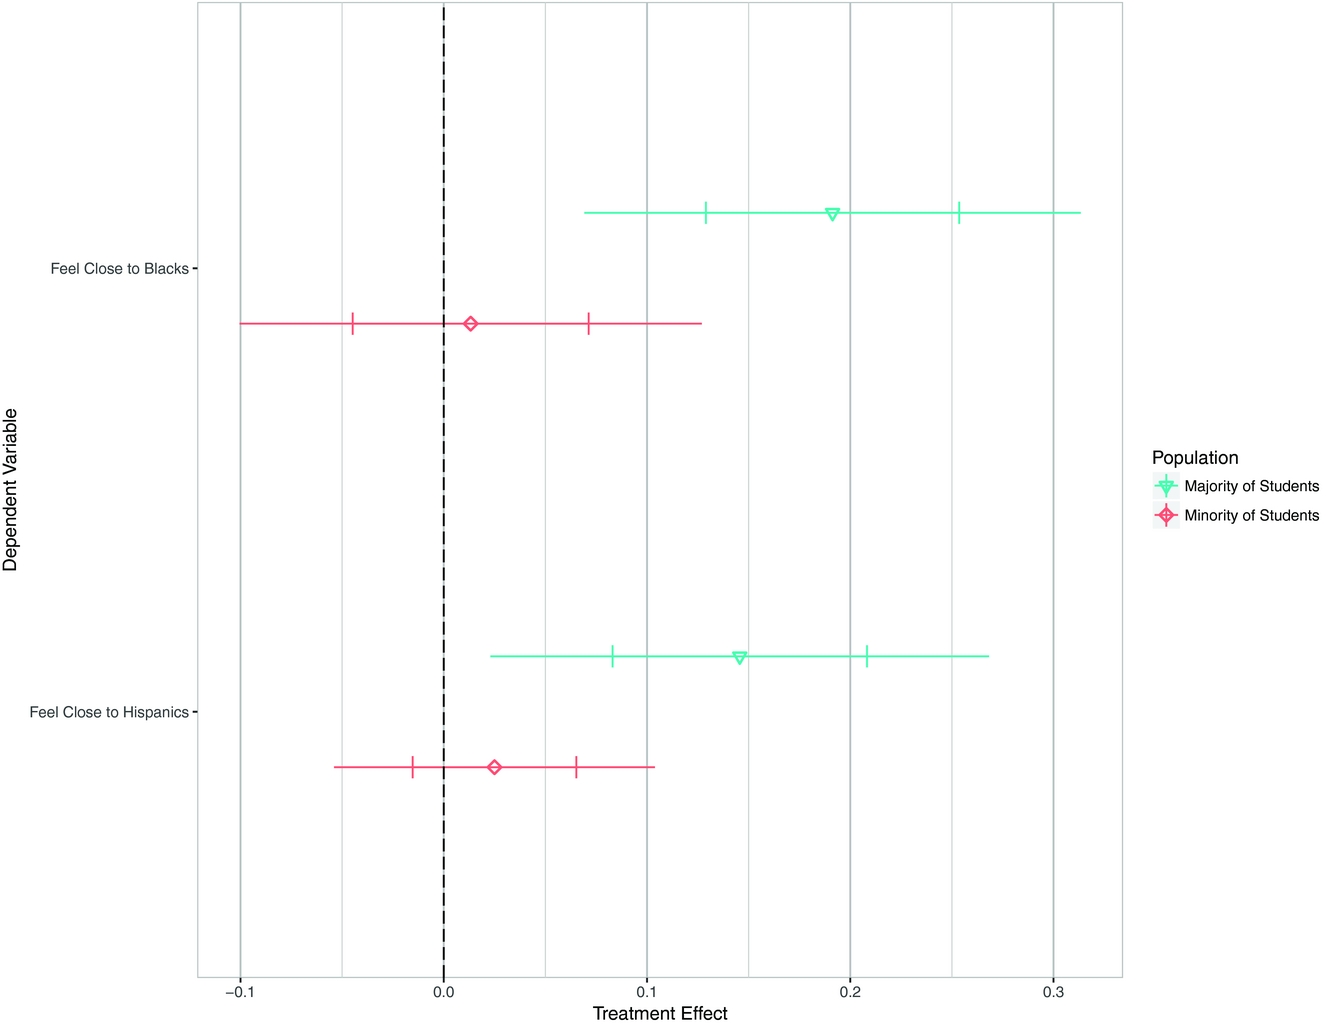
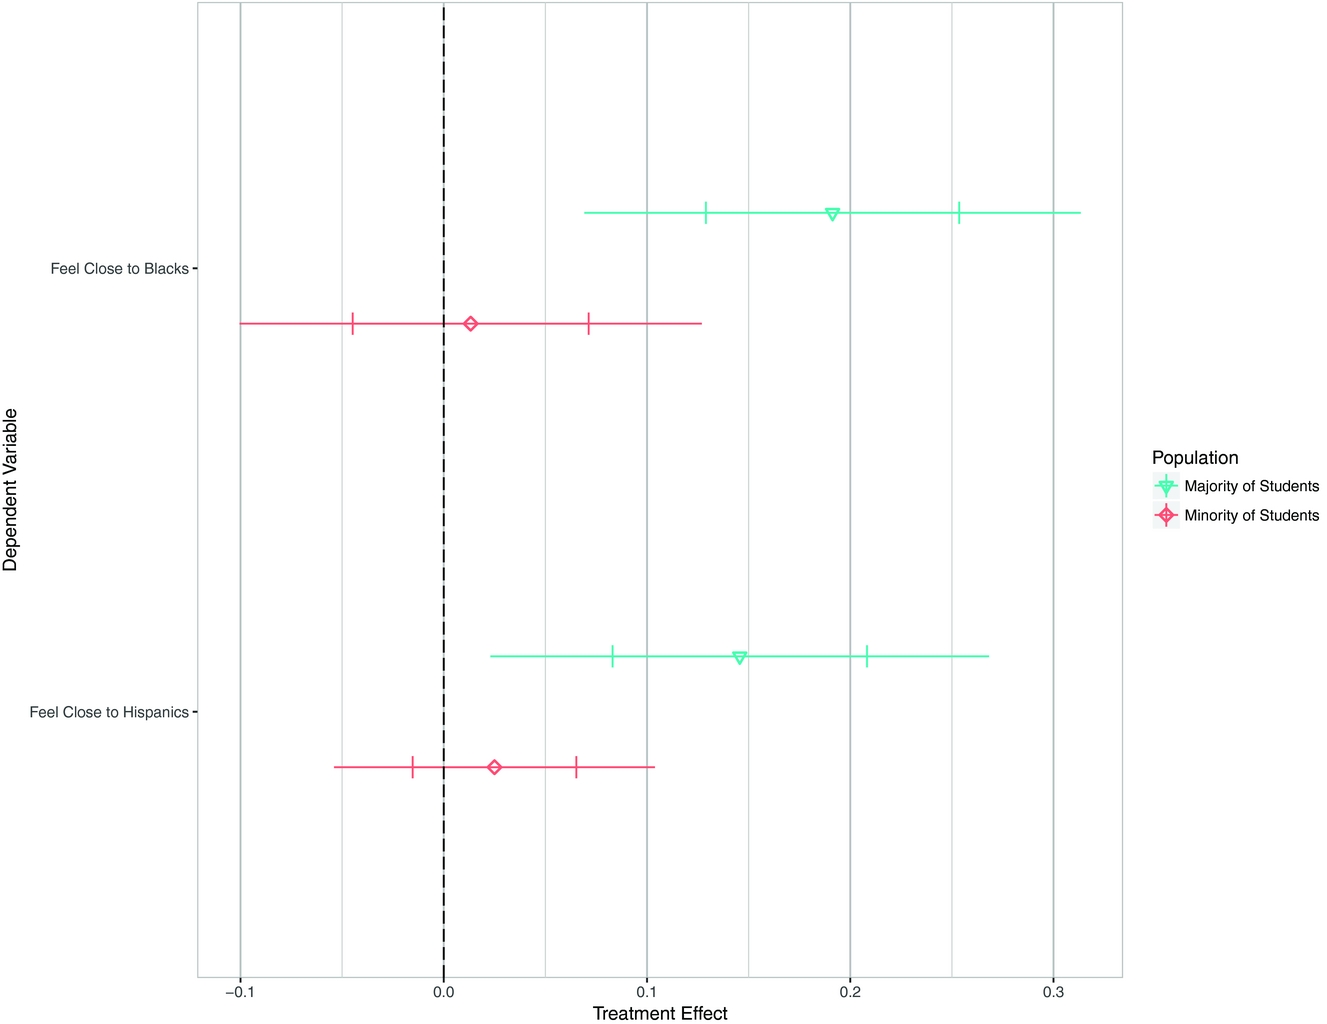
In interpreting these closeness measures, however, if intergroup contact incites change, we expect there to be differential effects on closeness depending on the racial demographic group with which TFA participants comes into contact. We leverage the fact that the student population a TFA participant serves varies by their regional placement. In some regions, nearly all of the students in the TFA placement schools are black (e.g., 94 percent of students in Mississippi). In other regions, nearly all of the students in the TFA placement schools are Hispanic (e.g., 97 percent of student in the Rio Grande Valley).Footnote 29 Feelings of closeness to the black and Hispanic community should change most among participants who served in communities with a predominantly black and Hispanic student population, respectively. This is indeed what we observe (see Figure 3).Footnote 30 When more than half of the student population is black, the causal effect of participating in TFA on feelings of closeness to black individuals is 19.1 percentage points (p = 0.002). However, if the minority of the student population is black, the effect size shrinks to 1.3 percentage points (p = 0.819), and the difference between the effects on closeness to black individuals by student population is statistically meaningful (p < 0.001). When the dominant student population is Hispanic, compared to nonparticipants, participants report feeling 14.6 percentage points closer to the Hispanic community (p = 0.020). As expected, this effect size decreases substantially when the minority of the student population is Hispanic (2.5 percentage points, p = 0.535).Footnote 31 Again, the difference between the effects on closeness to Hispanics by student population is statistically meaningful (p < 0.001).
2SLS Estimates—Closeness by Student Population
Our results also indicate that these effects are long-lasting, given that the estimated effects are the average effects for participants six months to seven years after the completion of TFA service, and the robustness of our effects are not sensitive to the exclusion of more recent cohorts. For example, when we examine the cohort-by-cohort effects of our racial injustice measure, we find that the impact of participation in TFA on the reduction of racial resentment ranges from 6.4 to 15.4 percentage points in magnitude (see Figure E.8(a) in Online Appendix E). The largest effect is for the 2013 cohort; however, we do not see strong evidence of a decay effect. Notably, when we examine the Skin-Tone Implicit Association Test, we see that the reduction in implicit racial prejudice becomes slightly stronger over time (see Figure E.8(b) in Online Appendix E).Footnote 32 As noted by Paluck (Reference Paluck2016) in her meta-analyses of prejudice research, while there are very few studies of real interventions that reduce prejudice, there are even fewer that examine long-term effects, where even just three months is considered long-term. By examining the impact of service on participants at least six months after program participation, we contribute to a relatively scant but important body of causal research on the long-term effects of interventions on prejudice reduction.
ROBUSTNESS CHECKS
To assess the robustness of our findings, we conduct a number of tests. We begin by reexamining the racial prejudice questions on closeness. First, there is no reason to believe that participation in a service program like TFA, which focuses on education, would have any impact on attitudes toward the elderly community or Christian community. As a placebo test, we included “the elderly” and “Christians” as groups in the battery of questions of what groups with which an individual feels “particularly close.” Reassuringly, TFA participation does not alter feelings of closeness to the elderly (−3.49 percentage points, p = 0.249) or Christians (−0.17 percentage points, p = 0.969; see Figure E.9 in Online Appendix E).
While it is highly unlikely that applicants right below the cutoff and applicants right above the cutoff meaningfully differed at the pretreatment stage on ideological perspectives that correlate with our outcome measures, we conduct four robustness checks to address concerns that our fuzzy RDD approach results are biased. First, we examined the average causal effects when we conducted an intent-to-treat (ITT) analysis in Table E.8 in Online Appendix E. In other words, when the treatment assignment is based upon admission, the “treatment” group also includes those that were assigned to receive the treatment but did not. If participation causes shifts in attitudes and beliefs on the dimensions we are interested in, we would expect the inclusion of nonmatriculants to result in an attenuation of our effects. Indeed, when we look at the ITT effect sizes rather than the treatment-on-the-treated (TOT) or complier average treatment effect sizes, each of the ITT effect sizes are smaller than the TOT effect sizes by 0.20 to 1.8 percentage points. However, with the majority of those assigned to the “treatment” group receiving the treatment, statistical significance (or insignificance) for each outcome never changes.
Second, we focused on those who were admitted into TFA only, and compared matriculants to nonmatriculants. If applicant scores are such that you need to have particular ideological preconceptions to be admitted, by focusing on those who were admitted into the program, our study population only contains those who have these preconceptions. We conducted regression analyses of each outcome measure on the admitted applicant’s matriculation decision with controls for the applicant’s selection score, all observable demographic characteristics, and application year. We find that the relationship between matriculation and each outcome measure of interest is identical to what we see in our RDD analyses. Moreover, these relationships are statistically meaningful for 25 of the 26 outcome measures (see Figure E.10 in Online Appendix E).
Third, we leverage the fact that we have access to one component of the overall selection score that is likely correlated with perspective-taking: demonstrating “respect for individuals’ diverse experiences and the ability to work effectively with people from a variety of backgrounds.”Footnote 33 Reassuringly, we find that there is no meaningful difference in this score between those who were barely admitted and barely rejected (p = 0.804).
Fourth, we take advantage of the data we have on current participants to assess whether the observed are detectable at the outset. While there is no data on participants before they begin the two-year program, we can take advantage of data we have on individuals who have participated in the program for fewer than six months—the 2015 cohort between the months of October and December. As shown in Figure E.11 in Online Appendix E, when we examine the effect size of TFA participation for those who received a smaller “dose” of the program, we see evidence that the effects that we see did not exist pretreatment.Footnote 34 For those who only began receiving the treatment, effect sizes are never statistically meaningful. One could note that this is an issue of statistical power. However, apart from two questions out of the 26 outcomes we consider, differences between participants and nonparticipants are either closer to 0 and/or of an opposite direction than our treatment effects. The fact that we see two questions in which effect sizes are comparable is not particularly concerning, as we expect that some attitude shifts may not require the full dose of program participation.Footnote 35
This last analysis comparing effects by dosage can also give us leverage on an alternative hypothesis. What if the differences we see are entirely driven by the perspectives and socialization imparted by TFA to participants? TFA training is concentrated at the start of the program. Before participants step into the classroom, they are required to attend an intensive summer training program.Footnote 36 After attending TFA’s summer institute, the participant receives an orientation in his/her assigned region in the late summer and/or early fall. By focusing on first-year participants in October through December, we assess individuals who have essentially received a full dosage of TFA’s training curriculum, have had concentrated interactions with TFA staff and other TFA participant teachers, and have had fewer than three months in the classroom. In finding null effects in 24 of the 26 outcomes we consider, we have some reassurance that the perspective and socialization imparted to participants by TFA organizers are not sufficient to account for the documented differences.
Finally, one may be concerned that effect sizes are overestimates if nonadmits generally pursued work in sectors that may socialize individuals to harbor greater racial resentment and believe that systemic injustices and other external factors are secondary to individualistic explanations for poverty. However, they could also be underestimates if nonparticipants systematically worked in low-income schools or a service program aside from TFA. To explore this question, we examine the job sectors of nonparticipants since 2007, the first cohort year in our study. As seen in Figures H.20– H.22 in Online Appendix H, over a third of nonparticipants pursued work in the education sector. The next two most represented sectors are the nonprofit and legal sectors. Nearly half of nonparticipants entered the legal, nonprofit, and education sectors, and there is no theoretical reason that these three sectors would lead to attitudinal shifts that run orthogonal to that of national service programs. Moreover, if we restrict our nonparticipant sample to those who have worked in the legal, nonprofit, and education sectors since 2007, we see effects that are nearly identical to our analysis of all nonparticipants (see Figure E.17 in Online Appendix E). As such, it is unlikely that we overestimate the effect of TFA due to the career trajectory of nonparticipants.
Exploring External Validity
What is the domain of applicability of our findings? The majority of applicants to service programs like TFA and Peace Corps are young adults. Would we see similar effects if mid-career adults or retirees participated in these programs? Defining “youths” as those between the ages of 15 and 24 years, we find that over 20 percent of TFA applicants are “nonyouths.”Footnote 37 When we assess the impact of participating in TFA by youth status, we find that the patterns of effects for “youths” and “nonyouths” are largely similar (see Figure E.12 in Online Appendix E). However, given a smaller sample and/or more variability, the standard errors are much larger for the nonyouth population, affecting statistical power. This analysis provides preliminary evidence that mid-career and retiree populations can also be affected by the treatment. This finding is of importance as there are no studies that assess effects of contact on prejudice among people over 25 (Paluck, Green, and Green Reference Paluck, Green and Green2018).Footnote 38
What if participants have personally experienced some disadvantage? Are effects of extended contextualized intergroup contact in a service context limited to the most privileged? We can exploit the fact that some TFA applicants qualified for financial aid to attend college in the form of a Pell Grant.Footnote 39 When we look at effects for these two groups separately, we see that the patterns of effects are similar. In fact, effect sizes appear to be larger among those who received a Pell Grant; however, as standard errors are larger for this group, we cannot conclusively state that financial need moderates effects. This analysis offers some evidence that personal experience with financial need does not preclude the effects we document from occurring (see Figure E.13 in Online Appendix E). We can also leverage the fact that approximately a third of TFA applicants are racial minorities.Footnote 40 Are effects constrained to those who are not racial minorities? We examine effects among white Americans and nonwhite Americans separately, and see that patterns are similar for the two groups (see Figure E.14 in Online Appendix E).
Could effects be restricted to those who identify with a particular party? One could argue that some of the class-based injustice measures tap into more liberal ideology, and hence, Democrats may be more likely to display the effects we observed than Republicans. While we do not have a pretreatment party identification measure, we find that there are no posttreatment differences in party identification at the cutoff (p = 0.353). Using our measure for political party, we find that effects among Democratic Party identifiers are consistent with the reported main effects. The pattern of effects is identical for nonparty identifiers for the class-based injustice measure, the assessment of whether education opportunities are equivalent for low-income and high-income students, racial resentment, and satisfaction with the treatment of minorities. Effects are null for other measures. Among Republican Party identifiers, we see the same pattern for the measure assessing the equality of education opportunities by income status and satisfaction with the treatment of minorities. Effects on all other measures are not statistically different from zero. In sum, the pattern of effects is similar for those who identify with the Democratic Party, the Republican Party, and neither party; however, effects are not as pronounced among those who do not identify with the Democratic Party (see Figure E.15 in Online Appendix E). But with a minority of the sample not identifying with the Democratic Party, further exploration is necessary to definitively conclude that effects differ meaningfully by party identification.Footnote 41
Finally, the majority of TFA applicants are female (72.5 percent of survey respondents and 70.2 percent of applicants), and we assess whether results are restricted to women (see Figure E.16 in Online Appendix E). Again, patterns are similar for both males and females. Effects appear slightly larger for males; however, with fewer males, standard errors are much larger in this restricted sample. As such, we cannot conclusively state that gender moderates the effects we see.
DISCUSSION
Using an original survey that we administered to over 32,000 TFA applicants and TFA’s selection data, we find robust causal evidence that participation in TFA translates to increased perspective-taking. TFA participants, who are all advantaged from the perspective of being high-achieving college-educated adults, take on attitudes that are closer to those of the “have nots” regarding the fairness of the economic, social, and political status quo, and key beliefs that are predictive of how people view redistribution.Footnote 42 They are more likely to view disadvantaged populations as victims of external barriers to advancement, and attribute economic success to external versus personal explanations. Gilens (Reference Gilens1999) found that when poverty was racialized, support for welfare decreased. When there is extended contact with low-income communities, and poverty is contextualized in a service framework, we see increased support for welfare assistance. Blame for what keeps some individuals in a lower socioeconomic position is also attenuated. Per the basic predictions of contact theory and research on perspective-taking, increased empathy also translates to both explicit and implicit prejudice reduction toward disadvantaged populations. Further, there is evidence of greater identification with disadvantaged groups. Powerfully, these effects are economically and statistically meaningful. Moreover, these shifts in attitudes have far greater permanence than the short-term effects commonly reported from laboratory or survey experiments.
The scope of the TFA application data and the nature of this civilian national service program provide us with novel and important leverage over the question of whether advantaged Americans can see the world through the lens of the disadvantaged, and allows us to contribute to an important but thin field of experimental literature on contact theory (Paluck and Green Reference Paluck and Green2009). Future research should look at how these attitudinal and belief shifts translate to behavioral changes. For instance, are participants more likely to vote and be active in civic life?Footnote 43 What is the career trajectory of these participants? Does the perception that there is greater social injustice translate to greater activism and efforts to build a sturdier economic and social ladder for disadvantaged individuals to climb? A recent study of the 2007 TFA cohort suggests that participants are more likely to pursue careers in education and that they are optimistic that the achievement gap is solvable (Fryer and Dobbie Reference Fryer and Dobbie2015). Further inquiry is also necessary to determine to what degree intergroup contact must be extended and contextualized in order to affect change. For instance, TFA requires participants to be in the classroom for two years. Would we see these enduring and substantively large effects after a shorter “treatment”? Additional research is also necessary to assess the significance of the service mission. In other words, if this type of intergroup contact occurred without the institutionalized service mission, would these effects be muted?
Future research is needed to explore questions of external validity. While we established that our effects are not necessarily restricted to youth populations, individuals with no exposure to disadvantage, those who identify with a particular political party, or a particular gender, it is possible that effects are more pronounced among some groups. Further, those who apply to national service programs differ from the general population in important ways.Footnote 44 For instance, if the general population is less eager to learn about others than the subset of the population that seriously considers national service and/or is eligible for these programs, the results that we see may be smaller in the general population. Conversely, our estimates may be underestimates when one considers the possibility that among TFA applicants, racial resentment may already be lower and sensitivity to social injustice may already be higher than the national population, as all applicants are opting into participating in an organization that aims to address education inequality.Footnote 45 Additionally, would we see similar effects with other service programs in which advantaged and disadvantaged communities have extended contextualized intergroup contact? For instance, what if the disadvantaged individuals are not children? TFA places its participants in schools, and children are clearly not at fault for their individual circumstances.Footnote 46
The notion of meritocracy is often deemed a centerpiece of American political ideology and the keystone principle of the belief system referred to as the “American dream” (Hochschild Reference Hochschild and Hochschild1995), “American creed” (Huntington Reference Huntington1981), or “American ethos” (McCloskey and Zaller Reference McCloskey and Zaller1984). In an increasingly unequal economic and social environment, Americans are seeing themselves more and more as “haves” and “have nots,” and the “have nots” see the American dream as much more illusory than the “haves.” This divergence is consequential as the United States is increasingly diversifying, and civic trust is decreasing as a result (Putnam Reference Putnam2000). Moreover, affluent Americans have disproportionate influence on policies (Bartels Reference Bartels2008; Carnes Reference Carnes2013; Gilens Reference Gilens2012; Page, Bartels, and Seawright Reference Page, Bartels and Seawright2013; Putnam Reference Putnam2015). Our research on service points to a pathway for meaningfully increasing perspective-taking among advantaged Americans. These findings have important implications for our broader understanding of the mechanisms by which perceptions of social justice and prejudice can be altered.
SUPPLEMENTARY MATERIAL
To view supplementary material for this article, please visit https://doi.org/10.1017/S0003055418000412
Replication materials can be found on Dataverse at: https://doi.org/10.7910/DVN/VTUSLV.




Comments
No Comments have been published for this article.