

1. Introduction
Bilateral and regional preferential trade agreements (PTAs) are proliferating across the globe, fundamentally altering the governance of world trade. From 1948 to 1999, a total of 155 of these agreements – averaging around three agreements per year – were notified to the General Agreement on Tariffs and Trade (GATT) or to its successor organization, the World Trade Organization (WTO). At the end of 2006, this number stood at 221 agreements per year – implying an average of around 9.5 notifications per year during the 2000–2006 period.Footnote 1
There are various reasons why governments seek bilateral or regional trade agreements. Foreign policy considerations often play an important role. Improving trade relations may be a vehicle to strengthen strategic ties between nations or to overcome historical animosities. Economic considerations are another driving force behind the conclusion of PTAs. Trade agreements can enhance commercial opportunities abroad for domestic businesses, while offering a vehicle for anchoring home-grown policy reforms. Multilateral trade negotiations have in recent years not been successful in fostering an exchange of market opening commitments. Despite more than five years of negotiations, there has been no conclusion to the WTO's Doha Development Agenda (DDA). For countries ready to commit to market opening, a bilateral or regional forum may deliver quicker results.
Many of the recently concluded PTAs are comprehensive in their coverage, seeking not only the dismantling of barriers to traditional trade in goods but also the liberalization of trade in services. The widening of the scope of PTAs reflects underlying economic forces. Technological progress and the trend towards private and competitive provision of infrastructure services have enabled international commerce in a wide range of service activities that were previously considered non-tradable. From 1980 to 2006, world exports in commercial services have grown at an average annual rate of 8.1% – faster than the 7.1 growth rate for world merchandise exports.Footnote 2
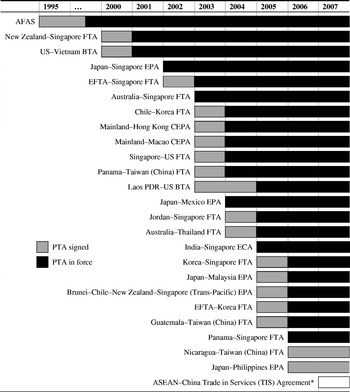
This paper offers an assessment of the new generation of services agreements that have been concluded in the East Asia region. Until recently, this region has been hesitant in entering into bilateral or regional arrangements. As of 2003, there were only two PTAs per country in East Asia, compared to a world average of five (World Bank, 2005). However, the region is catching up fast. Figure 1 lists the existing East Asian PTAs that have a services component.Footnote 3 Until 2000, the only trade agreement in services in the region was the ASEAN Framework Agreement on Trade in Services (AFAS). Since 2000, 24 agreements have been signed with at least one party in East Asia. Additional agreements are being negotiated, suggesting an even more prominent role of PTAs in shaping East Asian countries' trade policies in the future.
East Asian PTAs with a services component

Specifically, this paper focuses on the liberalization content of East Asian PTAs in services and their compliance with WTO rules on regional integration. In a companion paper, we analyze some of the key architectural elements of these agreements.Footnote 4
Our analysis is divided into two main parts. The first part, presented in Section 2, evaluates to what extent the 25 PTAs shown in Figure 1 have offered liberalization undertakings that go beyond those to which countries are committed under the WTO's General Agreement on Trade in Services (GATS). It draws on a database in which we recorded the value added of PTA liberalization undertakings relative to pre-existing GATS commitments. This database expands on similar quantification exercises in the literature in comprehensively covering all four modes of service supply and in considering a number of recent agreements not analyzed elsewhere.Footnote 5 We use this database to empirically assess the effect of the scheduling approach on the depth and breadth of liberalization undertakings – an exercise not performed in the previous literature. In addition, we evaluate whether countries' market opening commitments to different PTA partners have been alike or dissimilar.
The second part, presented in Section 3, seeks to shed light on whether the 25 East Asian services PTAs are compatible with GATS Article V on regional integration. While a number of authors have commented on the disciplines of this Article, few studies have confronted specific agreements with these disciplines.Footnote 6 Even though compliance with GATS Article V can ultimately be established only through WTO dispute settlement proceedings or through the evaluation mechanisms established at the WTO, our analysis points to a number of considerations that are likely to be relevant in assessing compliance.
More broadly, the proliferation of PTAs raises the question of whether PTAs are building blocks or stumbling stones towards further multilateral integration. In the concluding section, we briefly discuss what our findings can say in support or opposition of either camp.
2. Where and how far have East Asian PTAs gone beyond the GATS?
Like the GATS, PTAs in services adopt a wide definition of trade in services, covering four modes of service supply: cross-border trade (mode 1), consumption abroad (mode 2), commercial presence/investment (mode 3), and the movement of natural persons (mode 4).Footnote 7 The liberalization content of agreements is spelled out in detailed commitment schedules (or reservations lists).Footnote 8
In this section, we seek to assess to what degree the commitment schedules of the 25 East Asian PTAs with a substantial services component have led to wider and deeper trade undertakings relative to the state of play in the GATS. Such an assessment is of interest for several reasons. First, it attests to the economic significance of the recent wave of services agreements in the region. Second, it provides evidence on the extent to which East Asian countries have been willing to commit to market opening in services, which could eventually be harvested at the WTO. Finally, as discussed in Section 3, it is relevant for evaluating the compliance of PTAs with GATS Article V.
At the core of our assessment is a database in which we identified the ‘value added’ of PTAs for each of the 154 sub-sectors and four modes of supply identified under the GATS. In particular, we classified the resulting 616 entries per PTA schedule into four categories:
(i) Sub-sectors and modes for which only a GATS commitment exists or a PTA does not offer any improvement (GATS only);
(ii) Sub-sectors and modes for which a partial GATS commitment exists and a PTA relaxes or eliminates one or more remaining trade-restrictive measures (PTA improvements);
(iii) Sub-sectors and modes for which no GATS commitment is available, but a PTA commitment is made (PTA new sectors); and
(iv) Sub-sectors and modes for which neither a GATS nor a PTA commitment exists (Unbound).
In addition, for categories (i), (ii), and (iii), we further distinguished between partial and full commitments, with the latter defined as not listing any remaining trade-restrictive measures.
Our detailed methodology for classifying commitments into the four categories is described in Appendix 1. Several important methodological elements are worth pointing out here. First, we define trade-restrictive measures as all measures that are inconsistent with GATS-style market access and national treatment disciplines. In recording trade-restrictive measures, we did not separately identify market access and national treatment measures. Thus, a partial commitment corresponds to a commitment that maintains at least one trade-restrictive measure in either the market access or national treatment category; a full commitment corresponds to a commitment that does not list any trade-restrictive measure in either of these two categories.
Second, we treated horizontal commitments (undertakings that apply to all service sectors) in PTAs schedules as if they were inscribed in each scheduled sub-sector. This treatment of horizontal commitments appears most appropriate from a legal perspective and directly follows the scheduling guidelines under the GATS. However, it departs from similar quantification exercises performed in the previous literature.Footnote 9 In comparison to those studies, we thus obtain a smaller number of full commitments – especially for mode 3 where most countries have scheduled horizontal limitations. Third, commitments that did not list any trade-restrictive measure, but excluded certain activities falling within a given sub-sector (as defined under the GATS) were classified as partial commitments.
Quantifying services commitments in the way described above allows for meaningful comparisons. At the same time, our approach has a limitation that is inherent to any analysis of services trade policy. Even though we may record that a PTA improves in a certain sub-sector relative to the GATS, we do not measure the depth of the underlying improvement. For example, a country may raise in one PTA the foreign equity ceiling in the banking sector from 40% to 45% and in another PTA eliminate a prohibition on branch banking; we would classify both commitments as partial improvements even though the latter is arguably more far-reaching than the former.
Ideally, we would like to measure the tariff-equivalent of services trade liberalization: trade barriers fall from x to y percent of the import value. However, trade protection in services is exercised through a variety of non-tariff measures and empirically assessing their de facto restrictiveness remains a fundamental challenge.Footnote 10
A second caveat is that we do not evaluate whether trade commitments imply actual market opening or merely bind services policies at or above the existing status quo. For example, domestic services policy in ASEAN countries is often more liberal – on a most-favored nation basis – than the commitments negotiated under the ASEAN Framework Agreement on Services.Footnote 11 By contrast, the bulk of China's commitments under the Mainland-Hong Kong and Mainland-Macao Closer Economic Partnership Agreements (CEPAs) imply new market opening.Footnote 12 Carefully evaluating to what extent the East Asian PTAs provide for de novo liberalization was beyond the scope of this study.
2.1 Aggregate assessment
In what follows, we use our database to analyze the liberalization content of the 25 East Asian PTAs. We first focus on the set of 25 agreements as a whole, then investigate the effect of the scheduling approach on the depth and breadth of liberalization undertakings, and finally assess the contribution of PTAs at the level of individual countries aggregate assessment.
There are 14 East Asian countries that participate in at least one of the 25 PTAs that form the basis of our analysis, for a total of 48 schedules of commitments.Footnote 13 The ambition of liberalization undertakings varies considerably. At one end of the spectrum, the commitments by Cambodia and Vietnam under the ASEAN–China Trade in Services (TIS) Agreement do not offer any valued added relative to multilateral commitments. The commitments of other countries under this agreement show few improvements over GATS commitments and only a small number of new sub-sectors and modes. The value added offered by ASEAN members' commitments under the AFAS shows somewhat greater ambition, but is still limited in breadth and depth.Footnote 14 Similarly, Malaysia's and the Philippines' commitments in their respective Economic Partnership Agreements (EPAs) with Japan and Thailand's commitment under the Australia–Thailand Free Trade Agreement (FTA) do not go substantially beyond the GATS.
At the other end of the spectrum, most of the commitments made by Japan, Korea, Singapore, and Taiwan (China) in their PTAs offer substantial value added vis-à-vis the GATS. In addition, Laos' undertakings under the Lao PDR–US Bilateral Trade Agreement (BTA) show a high level of ambition. In particular, Laos subscribed to full national treatment and full market access in a large number of sectors – including professional, telecommunications, construction, distribution, financial, health, and education services.Footnote 15 Since Laos is not yet a member of the WTO, its bilateral commitment breaks new ground in binding services policies under international law.
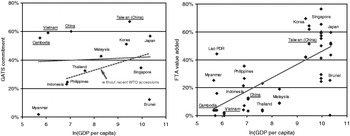
Figure 2 plots the share of sub-sectors and modes covered by countries' GATS and PTA commitments against their GDP per capita. In the left-hand chart, every dot represents a country. Taking the group of East Asian WTO members as a whole, there is no clear relationship between a country's level of economic development and the scope of its GATS commitment. However, if we exclude recent accessions to the WTO – Cambodia, China, Taiwan (China), and Vietnam – a positive relationship emerges: richer WTO members make more extensive commitments. The difference in the relationship between the two subsets is due to the non-reciprocal nature of WTO accession negotiations. History has shown that acceding countries have made substantially wider and deeper commitments compared to existing WTO members at similar levels of development.
GATS/PTA commitments and GDP per capita

In the right hand chart of Figure 2, every dot represents a PTA schedule. There is a clear positive relationship between a country's level of economic development and the value added offered by its PTAs. At the same time, GDP per capita does not explain all of the variation in the ambition of PTA liberalization undertakings. For example, Laos' commitment under the Lao PDR−US BTA is well-above what would be predicted by its level of economic development. There is also substantial variation in the ambition of PTA undertakings among the agreements negotiated by the same country – as illustrated by the wide range of PTA value added offered by Singapore in its 12 PTAs.
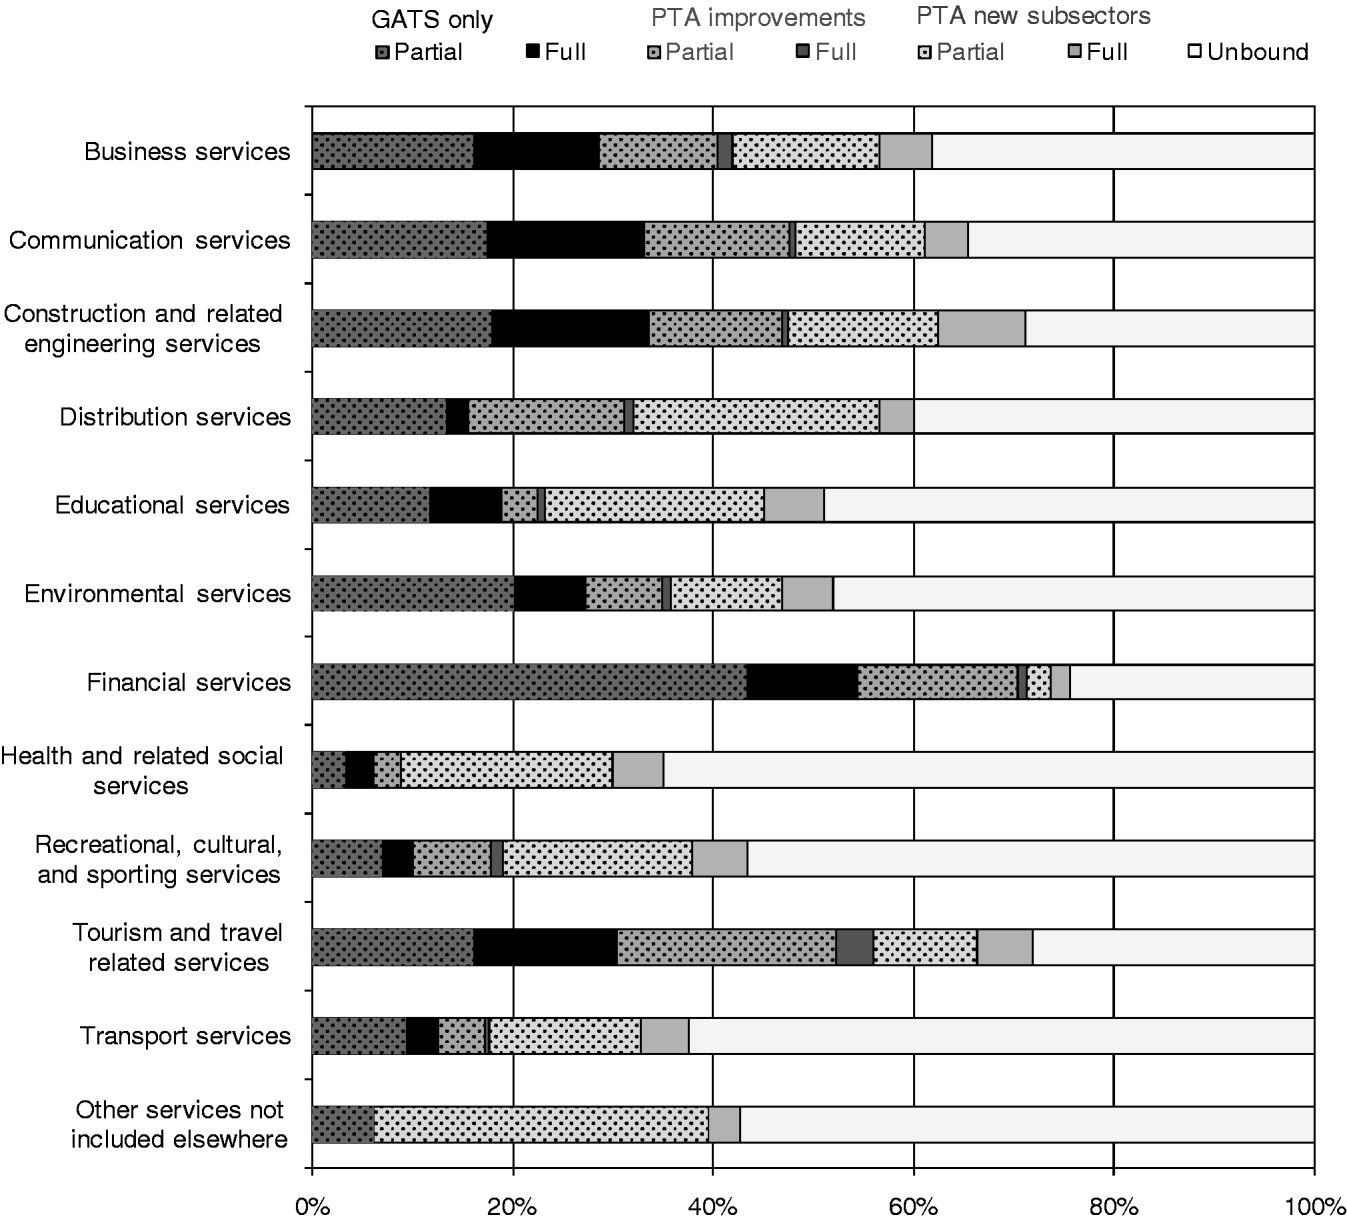
Are the contributions of PTAs evenly spread across sectors and modes of supply or are there specific areas in which PTAs seem more likely to make progress? To answer this question, we computed the aggregate (unweighted) liberalization content of all the 48 schedules in our database. Figure 3 depicts the results of this exercise broken down by the 12 main service sectors. The bars for the four liberalization categories are relative to the total number of sub-sectors and modes in a given sector. (The number of sub-sectors ranges from 4 for environmental services, health-related and social services, and tourism and travel-related services to 46 for business services.)Footnote 16 Several patterns can be observed. First, the contributions of East Asian PTAs are not limited to particular sectors. PTAs offer improved and new commitments in all of the 12 main service sectors.
Aggregate liberalization content by sector
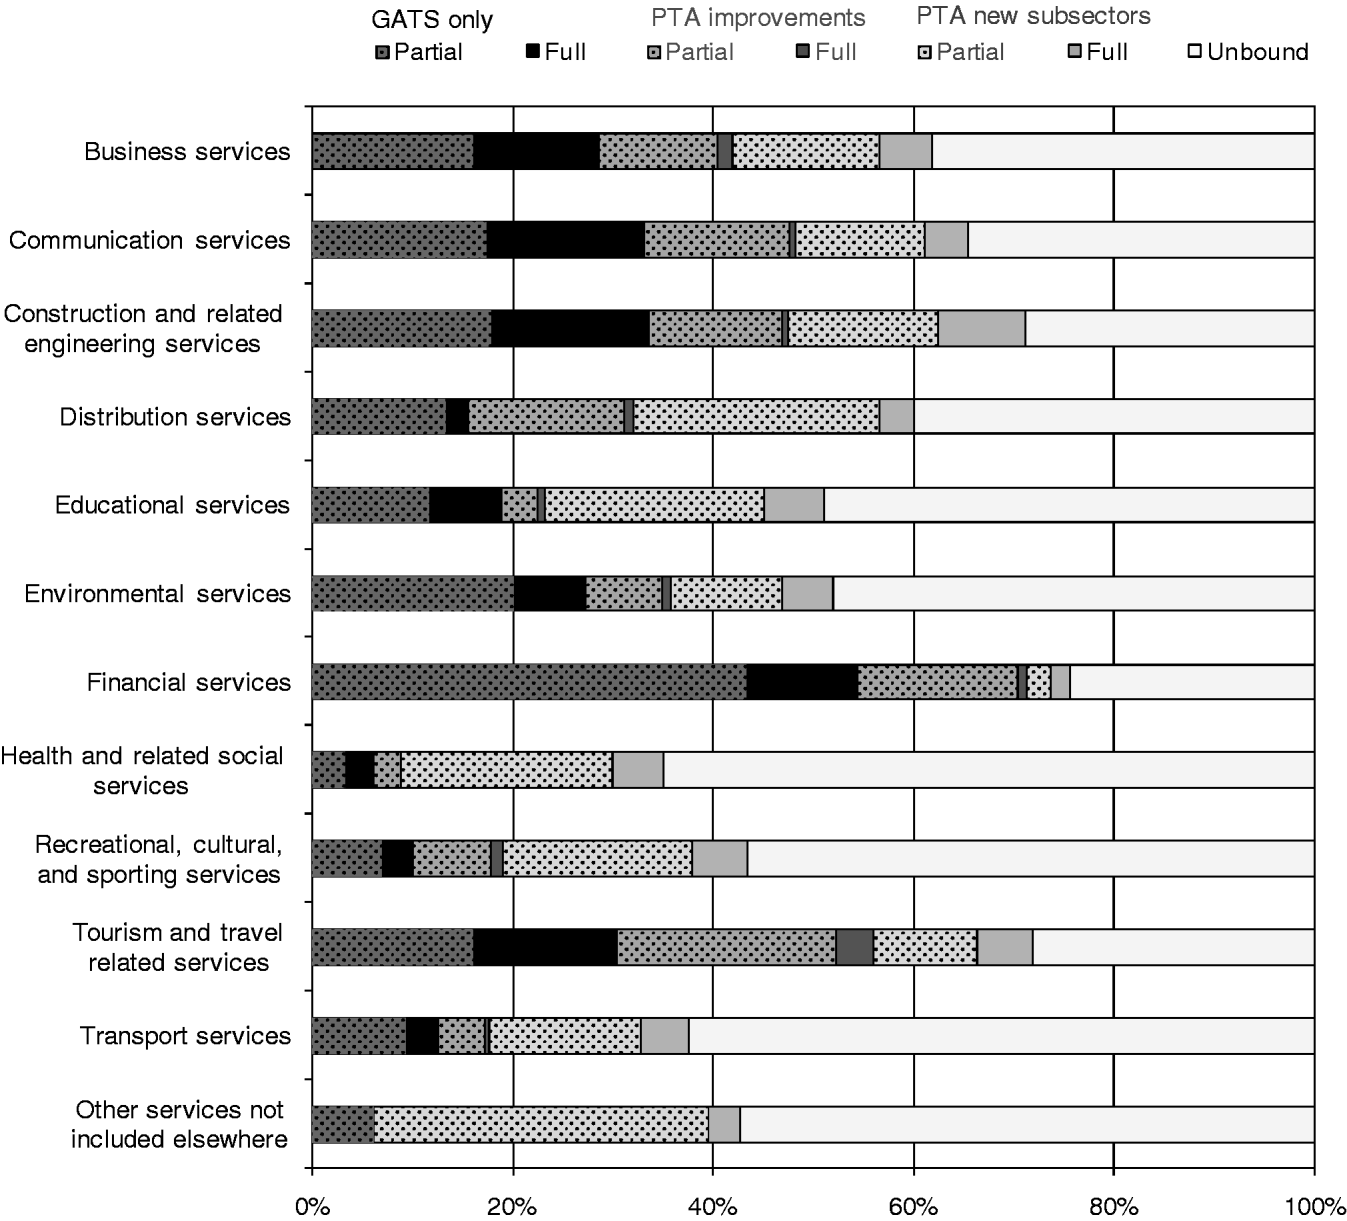
Second, construction and tourism have received the most attention in PTAs, with more than 40% of sub-sectors and modes showing improved or new PTA commitments. This is followed by recreational, business, communications, and education services, with 30–40% of sub-sectors and modes showing a PTA value added. The smallest contributions are found in environmental, health, transport, and financial services, with only 20–30% of sub-sectors and modes showing improved or new PTA commitments. This result confirms the well-known sensitivities towards liberalization in these sectors, even though PTAs were still able to make some inroads towards greater openness. In the case of financial services, the comparatively modest contribution of PTAs may also be due to the already wide coverage of GATS commitments – an outcome of the post-Uruguay Round financial services negotiations in 1997.
Third, the overwhelming share of PTA commitments are still of a partial nature. While this may to some extent reflect our strict criterion for classifying a commitment as ‘full’ (see above), it is apparent that PTAs do not provide for immediate free trade across the board, but only offer a step in that direction.
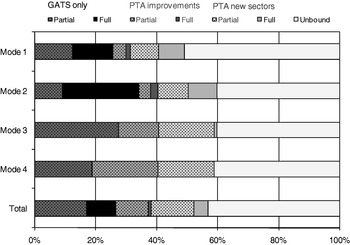
Figure 4 shows the same aggregate liberalization content but this time broken down by the four modes of supply. Again all bars are in relative terms. Two patterns bear brief discussion. First, mode 4 has seen the greatest share of improved or new PTA commitments (40%), followed by mode 3 (32%), mode 2 (25%), and mode 1 (23%). However, in most cases the value added offered by PTAs in the area of temporary labor movement is small, consisting mostly of minor expansions in the types of individual service providers and measures covered by the agreement. Few of the PTAs provide for expanded quotas for individual service providers or the elimination of economic needs tests. Second, the share of full PTA commitments is substantial for mode 1 (10%) and mode 2 (12%). As in the GATS, this pattern reflects the absence of horizontal limitations for cross-border supply and consumption abroad in most PTAs and the fact that trade restrictions for these two modes are less pervasive. The share of full commitments for mode 3 is less than 1% and solely attributable to the commitments made by Laos under the Lao PDR-US BTA.Footnote 17 No PTA has offered a full commitment for mode 4 in any of the 154 sub-sectors.
Aggregate liberalization content by modes of supply

2.2 Investigating the effect of the scheduling approach on PTA liberalization undertakings
In our companion paper, we analyze the different scheduling approaches adopted by the 25 East Asian PTAs. We distinguish between two basic scheduling approaches. First, negative lists whereby services trade is unrestricted except for the reservations listed for specific sectors and measures. Second, positive lists whereby market opening only applies to the sectors listed in the commitment schedule. Within the group of positive list agreements, we further distinguish between three methods of scheduling trade restrictive measures. The most common method is the ‘hybrid’ scheduling approach adopted in the GATS, whereby commitment schedules for the most part identify the remaining trade restrictions in the listed sectors on a negative list basis. Two agreements – China's CEPAs with Hong Kong and Macao – depart from this method in specifying the kind of foreign participation allowed in the listed sectors. We label this approach as the ‘pure’ positive list. Finally, as a special case, the Lao PDR–US does not list any trade restrictive measures. Laos is committed to full national treatment and market access in the listed sectors.Footnote 18
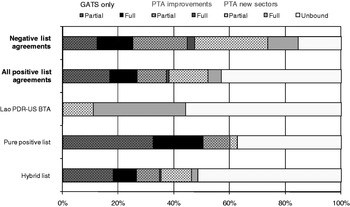
The previous literature presumes that a negative list approach offers incentives for the scheduling of more liberal commitments.Footnote 19 Is this presumption borne out for East Asian PTAs? At first glance, the answer appears to be ‘yes’. Figure 5 depicts the aggregate liberalization content for negative list agreements, all positive list agreements, and the three different types of positive list agreements. As can be seen, the group of negative list agreements has unleashed a greater share of improved or new commitments (60%) than positive list agreements (30%).Footnote 20
Aggregate liberalization content by scheduling approach

At the same time, the relationship between the scheduling approach and the ambition of liberalization undertakings is not straightforward. The case of the Lao PDR-US BTA illustrates that far-reaching liberalization can also be achieved through a positive list of sectors. Even comparing PTAs negotiated by the same country, negative list agreements do not always provide for wider and deeper coverage. For example, we find that Singapore's schedule under the positive list Japan–Singapore EPA shows more improved and new commitments than Singapore's schedule under the negative list Australia–Singapore FTA.Footnote 21
In addition, the empirical patterns depicted in Figure 5 do not permit concluding that a negative list approach causes the scheduling of more liberal commitments. Causality may well run in the opposite direction. Countries that are prepared to offer or demand greater openness in services may be more likely to seek a negative list for scheduling commitments. To discern the effect of the scheduling approach, we would ideally need to compare the outcome of a positive list negotiation and a negative list negotiation, involving the same countries negotiating under identical circumstances. Of course, such a ‘natural experiment’ does not exist.
However, our database on East Asian trade commitments allows us to explore the contribution of negative list agreements in an econometric setting. In particular, we investigate what determines the share of commitments with a PTA value added for the 12 main service sectors and 4 modes of supply across the schedules in our database. Our corresponding dependent variables distinguish between three types of PTA value added: (i) improvements relative to existing GATS commitments; (ii) the scheduling of new sub-sectors and modes not listed in the GATS; and (iii) the total contribution of PTAs, defined as the sum of (i) and (ii). In constructing the three dependent variables, we did not make any distinction between partial and full commitments.
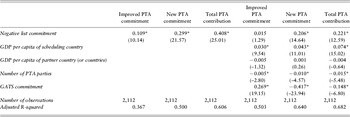
The first set of regressions explains the PTA value added by a dummy variable that is 1 if the commitment was scheduled under a negative list and 0 otherwise, and fixed effects for the 12 service sectors and 4 modes of supply. The results are shown in the first three columns of Table 1. Coefficients were estimated by ordinary least squares.Footnote 22 The dummy variable for negative list commitments is always positive and statistically significant at the 1% level. This result is not surprising and merely confirms what can be seen in Figure 5: negative list PTAs are associated with deeper and wider commitments.
Results of econometric investigation

Notes: Ordinary least squares estimates; t-statistics are in parenthesis; * indicates statistical significance at the 1% level. Data on GDP per capita are for 2002, were taken from the World Bank's World Development Indicators, and were converted to natural log values. Brunei and Myanmar were dropped from the analysis, because no GDP per capita data were available. That leaves 44 schedules of commitments with observations for 12 sectors and 4 modes of supply, explaining the total of 2,112 observations.
To address the possibility of reverse causality, we included four additional variables in our regressions: the GDP per capita of the scheduling country, the GDP per capita of the PTA partner(s), the number of PTA parties, and the share of subsectors and modes committed under the GATS.Footnote 23 Our underlying premise is that countries' ‘natural’ propensity to commit to liberal trade policies is first and foremost determined by their level of economic development. Richer economies with more competitive service sectors will have greater confidence in binding their own policies under international law and will pursue market opening abroad more aggressively. The number of PTA parties serves as a proxy for free-rider effects in trade negotiations that may lead countries to hold back from making commitments. We expect this variable to show a negative coefficient – the larger the number of players, the greater the potential for free-riding. Finally, the share of GATS commitments will affect the scope for PTAs to add value. We expect a larger share of (partial) GATS commitments to increase the scope for PTA improvements but to reduce the scope for scheduling new sub-sectors and modes of supply.
The results of the second set of regressions are shown in columns 4 to 6. As before, the dummy variable for negative list commitments is positive and statistically significant at the 1% level for new PTA commitments and the total PTA contribution. The value of the estimated coefficients is somewhat smaller than before, suggesting that the GDP per capita variables indeed work to reduce the effect of negative listing. In addition, the negative list dummy variable is not any more statistically significant for improved PTA commitments.
At their face value, our results suggest that negative listing does not hold any advantage in deepening GATS commitments, but that they induce the scheduling of new sub-sectors and modes of supply. This finding accords with intuition. Most positive list agreements included in our analysis are hybrid list agreements, for which the level of openness is to a large extent determined by measures inscribed on a negative basis. In other words, the distinguishing characteristic of negative list agreements is the way in which sectors are listed and this seems to have an effect on the negotiating outcome.
As expected, GDP per capita of the scheduling country has a positive effect on the PTA value added. Interestingly, GDP per capita of the partner country (or partner countries) was statistically not significant for all three dependent variables. This latter result seems surprising. One would expect richer countries to exert stronger pressure on PTA partners to make wider and deeper commitments. Yet such pressure – if it exists – does not appear to be reflected in the negotiating outcome. As expected, the number of PTA parties works to reduce the PTA value added, pointing to the existence of free-rider effects in PTA negotiations with more than 2 parties. Finally, the share of GATS commitments has a positive effect on improved PTA commitments and a negative effect on new PTA commitments – again, as expected. The net impact on the total PTA contribution is negative, suggesting that the latter effect dominates the former.
2.3 Country-level assessment
Most East Asian countries have concluded more than one PTA. The aggregate liberalization content shown in Figures 2–5 use individual commitment schedules as the unit of analysis. Since countries may make the same or similar commitments to more than one trading partner, it is also interesting to aggregate agreements at the country level. In particular, we identified the most liberal commitment a country has made across all of its PTAs for each of the 154 sub-sectors and 4 modes described above. This exercise has practical relevance. As explained in our companion paper, several PTAs feature non-party most-favored nation (MFN) clauses. Parties to such agreements guarantee their PTA partners the most liberal treatment ever committed in any PTA, creating possibly far-reaching dynamic linkages between different negotiating forums. At the same time, it is worth noting that in many cases the reach of the MFN obligation is weakened by sectoral exemptions and special carve-outs for PTAs with non-parties.Footnote 24 In any case, even for a country not bound by a non-party MFN clause, it is instructive to ask how far it has been willing to go across all of its PTAs.
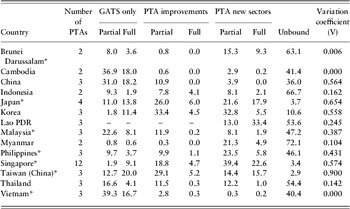
Table 2 lists for each country the number of PTAs and the total maximum liberalization content in the four liberalization categories (expressed as percentage shares of 616 total entries per country). The numbers shown for Korea, Japan, Singapore, and Taiwan (China) indicate that these four high-income countries have made extensive use of PTAs to subscribe to greater openness in services. Singapore stands out in this group, with 86% of sub-sectors and modes showing improved or new commitments across its 12 PTAs. For Korea, Japan, and Taiwan (China), this share stands at 76, 71, and 64%, respectively. Substantial PTA value added is also found for Laos (46%) and the Philippines (40%). In addition, in the case of Laos, the majority of PTA undertakings are full commitments, reflecting the ambition of the Lao PDR–US BTA. For the remaining eight countries, the share of sub-sectors and modes with an improved or new PTA commitment lies somewhere between 3 and 30%.
Maximum liberalization content by country

Notes: Commitment counts are based on the maximum of commitments across all PTAs concluded by a country. In other words, if an improved commitment or new sub-sector/mode relative to a country's GATS schedule is found in at least one PTA, the relevant sub-sector is classified as ‘improved’ or ‘new’ in the table's PTA columns. Countries marked with an asterisk are parties to at least one PTA featuring a non-party MFN clause. Figures in the four liberalization categories are expressed as a percentage share of 616 total entries per country. The PTA variation coefficient is calculated as explained in the text.
Finally, it is interesting to ask whether the commitments offered by one country to two or more PTA partners are alike or dissimilar. We investigate this question by calculating a variation coefficient, V, which we define as follows

where
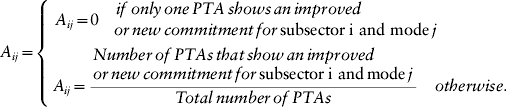
Intuitively, our variation coefficient measures the number of matching PTA commitments as a share of all improved or new PTA commitments. It ranges from 0 to 1, with 0 indicating perfect incongruence among a country's PTAs and 1 suggesting perfectly matching PTAs. In calculating V, we make no distinction between partial and full commitments. We also do not directly compare PTA commitments. Thus, even though two PTAs may show improved or new commitments for the same sub-sector and mode, the respective commitments may still differ.
The calculated values of our variation coefficient are shown in the last column of Table 1. V is 0 in the case of Cambodia and Vietnam, due to the fact that these two country's commitments under the ASEAN–China TIS Agreement do not offer any value added relative to the GATS.Footnote 25 The limited PTA value added for these two countries partly reflects the ambitious nature of their WTO accession commitment – as pointed out above. The coefficient is highest in the case of Taiwan (China), as its three PTA schedules show a high degree of similarity. For Japan, Korea, and Singapore, V lies in the 0.5–0.7 range, which suggests that these countries have a common set of commitments that they are prepared to offer to all negotiating partners, but reserve some commitments for certain trading partners – possibly responding to trading partners' market opening requests. The coefficient for China also lies in this range, but the explanation is different. China's commitments in its CEPAs with Hong Kong and Macao are almost identical, but those commitments have little in common with China's undertaking under the ASEAN–China TIS Agreement.Footnote 26
For the remaining countries, V lies somewhere between 0 and 0.5. As it turns out, all countries with a V coefficient in this range are ASEAN member countries. The relatively lower coefficient values partly reflect dissimilarities in these countries' undertakings under the AFAS and the ASEAN–China TIS Agreement. In other words, ASEAN members have gone further at the regional level compared to what they have offered to China in their ‘super-regional’ agreement.
3. Are East Asian PTAs compatible with WTO rules on economic integration?
The analysis presented so far has shown how much bilateral and regional agreements have led to market opening in services beyond existent multilateral commitments. The 25 East Asian PTAs examined feature different degrees of ambition – ranging from agreements with broad sectoral coverage and deep liberalization undertakings to agreements that add only limited value to existing GATS commitments.
These findings are not only of academic interest. The WTO has rules on the conclusion of economic integration agreements (EIAs). Preferential agreements in services entail an exception to the general principle of non-discrimination between WTO Members, enshrined in the MFN obligation of the GATS. Like its goods alter ego – GATT Article XXIV – GATS Article V prescribes a series of conditions that treaties on economic integration in services must fulfill in order to constitute a lawful deviation from the MFN principle.
Observance of WTO rules on economic integration is not only a matter of respect for the multilateral trading system. Compliance of a PTA with GATS Article V falls under the jurisdictional capacity of the WTO's dispute settlement system. Thus, should a preferential agreement involving WTO members be found not to comply with the requirements of the GATS, trade preferences under such an agreement would have to be ‘multilateralized’ to the entire WTO membership.Footnote 27
The requirements of GATS Article V involve a substantive element and a procedural element. The substantive element establishes obligations on the sectoral coverage and depth of PTAs as well as on the treatment of non-parties.Footnote 28 The main procedural element is the prompt notification of a PTA to the WTO Council for Trade in Services (CTS), which may initiate an examination of the agreement in light of the substantive requirements of Article V and issue recommendations to the parties. In December 2006, WTO members added a new ‘transparency mechanism’ to this procedure on a provisional basis.Footnote 29
Do East Asian PTAs live up to these standards? While the precise meaning of WTO rules in this area is subject to a number of interpretational difficulties, examining current practice by East Asian PTAs can shed some light on the degree of observance of GATS disciplines.Footnote 30
3.1 Notification
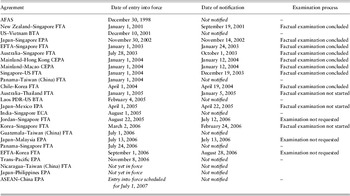
Fourteen of the 25 East Asian PTAs have so far been notified to the WTO (see Table 3). Typically, notification occurs within a few weeks or months after entry into force of the PTA, sometimes even shortly before that date. The longest time lag between entry into force and notification has been 11 months (for the Jordan–Singapore FTA). If the ‘prompt’ notification requirement applies from the date of entry into force of a PTA, it appears that notifications have for the most part been made according to GATS Article V obligations.Footnote 31
East Asian PTAs notified to the WTO

Source: WTO (http://www.wto.org/english/tratop_e/region_e/region_e.htm, as of January 31, 2007).
As of January 2007, 11 East Asian PTAs have not been notified to the WTO. In the case of some of these agreements, non-notification may be due to their recent vintage.Footnote 32 There are two agreements which have been in force for more than three years and for which non-notification is not due to an apparent reason – the ASEAN Framework Agreement on Services and the Panama–Taiwan (China) FTA.Footnote 33
3.2 Substantial sectoral coverage
The first of the four substantive requirements relates to substantial sectoral coverage. GATS Article V spells out that this concept is to be understood in terms of number of sectors, volume of trade affected and modes of supply. However, the precise application of these criteria remains unclear. Several questions immediately arise. What precisely is meant by the ‘volume’ of services trade (as opposed to the ‘value’ of such trade)? At what level of disaggregation should the count of sectors be made? Can entire sectors be excluded from the agreement? If so, at which point would an exclusion of a sector reduce the volume of trade to a non-substantial level?Footnote 34 The lack of sufficiently disaggregated data on trade in services further complicates the task of determining whether or not a PTA meets a certain threshold value above which sectoral coverage could be considered substantial.
The analysis presented in the previous section has shown that no East Asian PTA provides for universal sectoral coverage. Having said this, the lack of universal coverage does not immediately imply non-substantial coverage. Looking at the number of sub-sectors, we note that some East Asian PTAs, such as the Japan–Singapore FTA or the Chile–Korea FTA, provide for wide sectoral coverage, averaging commitments in well over 70% of all service sub-sectors. By contrast, a great number of East Asian PTAs feature commitments in less than half of all 154 sub-sectors.Footnote 35 Without implying any judgment on the definition of sectors to be counted, it seems fair to conclude that current commitments under PTAs do not manifestly provide for substantial sectoral coverage.
Furthermore, it is worth pointing out that certain agreements carve out service activities that are known to be associated with substantial trade flows – air and maritime transport services and financial services.Footnote 36 Again, it is not obvious to what extent the exclusion of such sectors reduces the volume of trade covered to non-substantial levels.
As far as modes of supply are concerned, GATS Article V makes clear that there should be no a priori exclusion of any mode of supply. Thus, an agreement that features commitments in all service sectors, but excludes one or more modes of supply would still fail the substantial sectoral coverage test. None of the 25East Asian PTAs formally excludes any mode of supply from its coverage.Footnote 37 Most negative list agreements exclude mode 3 from the scope of the services chapter, but cover commercial presence in the investment chapters of these agreements.Footnote 38 Indeed, all agreements analyzed offer some commitments in each of the four modes of supply.
3.3 Elimination of substantially all discrimination
The second of the four substantive conditions of GATS Article V calls for the elimination of substantially all discrimination, with explicit reference to the national treatment article of the GATS. In other words, PTAs are allowed to maintain all non-discriminatory measures that fall exclusively under the market access discipline, but they are supposed to substantially do away with measures inconsistent with national treatment.Footnote 39
As the first substantive condition, the requirement to eliminate substantially all discrimination raises a number of interpretative questions. To begin with, Article V requires that the absence of substantially all discrimination be achieved through the elimination of existing discriminatory measures ‘and/or’ the introduction of a stand-still commitment with regard to discriminatory restrictions. Does a PTA that features the prohibition to introduce new or more discriminatory measures – but which does not reduce any discrimination – immediately comply with this requirement? Cottier and Molinuevo (Reference Cottier, Molinuevo, Wolfrum, Stoll and Feinäugle2008) argue that the answer should be ‘no’, because Article V:1(b) specifically calls for the ‘absence or elimination’ of discrimination between the PTA parties. In order to live up to this obligation, the PTA must, accordingly, abolish discriminatory measures where they exist and prohibit the future introduction of discriminatory policies in those sectors or sub-sectors where no discriminatory policies are maintained at the time of the conclusion of the PTA.
Other questions seem more difficult to answer. Which measures could still be maintained so that the level of remaining discrimination can be considered ‘non-substantial’? Would the value or volume of trade in a particular sub-sector play a role in this assessment? As discussed in Section 1, quantifying the restrictiveness of trade barriers in services – for example, in the form of tariff-equivalents – is a challenging task. For methodological and data reasons, a rigorous empirical assessment of the depth of PTA liberalization undertakings appears elusive.
Our database of the value added of PTA liberalization undertakings discussed in Section 2 did not separately record market access and national treatment commitments. Still, a few impressionistic observations are possible.
• First, none of the East Asian PTAs provides for full national treatment across all sectors and modes.
• Second, where sub-sectors have been scheduled, modes 1 and 2 are for the most part subject to few explicit discriminatory measures. Having said this, in several PTAs, parties require the establishment of a commercial presence or the registration with local professional bodies as a prerequisite for supplying services. Even if such restrictions are de jure non-discriminatory and are inscribed as market access limitations, they may be considered de facto discriminatory and thus be taken into account in an assessment of whether substantially all discrimination is eliminated.
• Third, most agreements feature horizontal limitations for mode 3. In several cases, these limitations are relatively far-reaching and allow for the maintenance of significant discriminatory measures.Footnote 40
As described in Section 2, even though there are many PTA liberalization undertakings that offer wider and deeper commitments under mode 4, the value added of these commitments relative to the GATS is typically minor. Most PTA commitments, like the GATS, are limited to high-skilled professionals and intra-corporate transferees. Measures affecting low-skilled workers and independent service providers are usually not covered in commitment schedules.
Finally, PTAs that do not provide for the elimination of substantially all discrimination at their entry into force can still be consistent with Article V, if further negotiations lead to the achieving that result within a reasonable timeframe. While most East Asian PTAs incorporate provisions that call for further liberalization through successive negotiations, it is an open question whether the pace of liberalization in those agreements is sufficient for the elimination of substantially all discrimination within a timeframe that can be deemed ‘reasonable’.Footnote 41
3.4 Overall level of trade barriers
The first two substantive requirements concern the ‘internal’ breadth and depth of a PTA. The final two conditions focus on the treatment of non-parties. In particular, the third condition calls for a PTA not to raise the ‘overall level of barriers to trade in services within the respective sectors or subsectors’, as faced by WTO members outside the agreement. Once more, a number of interpretative questions emerge. What is meant by ‘barriers’ – national treatment measures, market access measures, both, or neither type of restrictions?Footnote 42 Does the concept of overall level of trade barriers allow for higher barriers in certain sub-sectors, as long as some weighted or unweighted average of sub-sectoral barriers is not raised? Alternatively, does the wording ‘within the respective sectors or subsectors’ suggest that the obligation applies to each individual sector and sub-sector? Even if these questions were answered, it would appear difficult to translate this requirement into practice. Given the quantification challenges outlined previously, it does not seem feasible to calculate the overall level of barriers in effect prior to the formation of a PTA and compare that level to the post-PTA counterfactual.Footnote 43
The requirement not to raise the level of protection faced by outsiders applies only to trade policy changes that emanate from obligations under an EIA. In reviewing the texts of the 25 East Asian FTAs, we did not find any provision that implies the express creation of new trade barriers vis-à-vis third parties. From this narrow view, it would appear that all East Asian FTAs are compliant with this substantive requirement of GATS Article V.Footnote 44 In theory, ‘barriers’ to third parties could also arise from the implementation of PTA obligations. However, a thorough review of the pre- and post-PTA regulatory frameworks of the East Asian countries and their trade restrictiveness towards third parties was beyond the scope of this study.
3.5 Rule of origin
The fourth substantive condition also concerns the treatment of non-parties. It requires the establishment of a liberal rule of origin for juridical persons. In particular, trade preferences negotiated under a PTA need to be extended to juridical persons of any other WTO member that are constituted under the laws of a party and are engaged in substantive business operations in the territory of the parties.Footnote 45 Compared to the other three substantive requirements, the rule of origin condition poses the least interpretative difficulties. Still, several uncertainties remain. Does the concept of constitution under the laws of a party encompass non-incorporated entities such as branches or representative offices?Footnote 46 What threshold needs to be surpassed for business operations to qualify as substantive?
Notwithstanding these uncertainties, several observations can be made in relation to the East Asian PTAs. As discussed in Fink and Molinuevo (Reference Fink, Mattoo, Stern and Zanini2008), most agreements feature a rule of origin that, indeed, entitles non-party service suppliers that are constituted or otherwise organized under the laws of a party and that engage in substantive business operations to the benefits of PTAs.Footnote 47 However, several agreements allow the parties to deny trade benefits to at least some service suppliers from other WTO member countries that are legally constituted and engaged in substantive business operations in the territory of the parties:
• the services chapter of the Australia–Thailand FTA allows the denial of benefits when a party ‘establishes that the service supplier is owned or controlled by persons of a non-Party’;
• some agreements allow the denial of benefits to service providers from non-parties with which a party does not maintain diplomatic relations or where certain trade sanctions apply.Footnote 48
It is not immediately obvious how the denial of benefit provisions of these agreements comply with GATS Article V.Footnote 49
GATS Article V:6 introduces an element of special and differential treatment (SDT) in the application of this requirement. Agreements involving developing countries only may adopt a more restrictive rule of origin, which limits trade preferences to service suppliers that are owned or controlled by natural persons of the parties. A source of uncertainty in the interpretation of this SDT provision stems from the fact that non-LDC WTO members can decide for themselves whether they are to be considered ‘developed’ or ‘developing’ countries.
Only two agreements have established a rule of origin with an ownership and control criterion like the one permitted by Article V:6 – the Australia–Thailand FTA and the India–Singapore Economic Cooperation Agreement (ECA). Since Australia is unlikely to be considered a developing country in the WTO, it is not obvious how the rule of origin of the former agreement complies with Article V – as pointed out above. Compatibility of the rule of origin of the latter agreement with GATS requirements seems to depend on whether Singapore would be considered a developing country under WTO law.
4. Conclusion
PTAs involving East Asian countries are proliferating at a mind-boggling pace. In light of their large and fast-growing markets, many countries in the region are seen as attractive partners for a PTA. Most recently, the European Union, which has so far not entered into a PTA with an East Asian country, has identified agreements with ASEAN, India, and Korea as priorities in its new trade policy strategy.Footnote 50 If current trends continue, the bulk of international commerce in the East Asia region will be governed by the rules and commitments of such agreements. Indeed, many future commercial transactions may be governed by more than one PTA. New Zealand and Singapore, for example, have already entered into two PTAs – a bilateral agreement and a regional agreement involving Brunei and Chile. A third common PTA is under negotiation as part of the ASEAN–New Zealand partnership.
This paper reviewed the liberalization accomplishments of existing East Asian agreements and confronted these agreements with WTO rules on regional integration. As to the former, we found that there is substantial variation in the ambition of PTAs. Many PTAs offer only limited value-added relative to multilateral services commitments, traveling only a short distance on the long journey towards free services trade. A few agreements show greater ambition, if measured by the number of new and improved commitments. Yet even those agreements often fail to do away with far-reaching limitations found in countries' multilateral services schedules.
Our econometric investigation of the effects of the scheduling approach on the liberalization outcome suggests that negative lists appear to induce wider but not deeper PTA commitments than positive lists. Having said this, in our companion paper we argue that recent innovations in selected East Asian PTAs have diluted many of the architectural differences traditionally associated with positive and negative lists. Even though the choice of scheduling approach still appears to matter for negotiating dynamics, appropriately crafted reservations will allow governments to inscribe far-reaching limitations using either approach.
As for compliance with WTO rules on regional integration, our analysis points to a number of elements that might be relevant in assessing compatibility with GATS Article V. A case can be made that many of the East Asian PTAs currently do not comply with the requirements of substantial sectoral coverage and elimination of substantially all discrimination. If ever these agreements are legally tested by the WTO, much will depend on what is considered a ‘reasonable’ time-frame for achieving these requirements. It is doubtful, however, whether the WTO will ever exert greater legal scrutiny of PTAs, as the same members that would request their examination are party to one or more of these agreements.Footnote 51
Regardless of their compliance with GATS Article V, a broader question is whether the proliferation of bilateral and regional PTAs will act as ‘building blocks’ or ‘stumbling stones’ to further multilateral liberalization? This question has been heavily debated by economists.Footnote 52 Even though most of this debate has focused on trade in goods, a number of arguments apply directly to the services context. In particular, proponents of the ‘building blocks’ view advance the following arguments:
• PTAs offer inroads towards more open markets, even if liberalization occurs only with respect to certain trading partners. As such, countries may be more willing to liberalize, for two reasons. First, there may be less resistance form vested interests that already face some foreign competition. Second, if the outcome of preferential liberalization proves successful, the support for multilateral market opening may be strengthened.
• PTAs may spur a process of competitive liberalization. Businesses in countries left out by PTAs may feel that they are harmed by not having preferential access to a foreign market. They may thus lobby their own government to enter the PTA game. The rapid increase in the number of PTAs suggests that this force may be at work in the East Asia region.Footnote 53 Once a country has concluded PTAs with all of its major trading partner, it might as well ‘multilateralize’ its level of openness.
Followers of the ‘stumbling stones’ view respond with the following arguments:
• PTAs are discriminatory in nature, leading to the diversion of trade. As such, there may be businesses that would see their preferences eroded from MFN-based liberalization. Those businesses can become a powerful voice against further multilateral integration. Indeed, concerns about preference erosion have been a source of contention in the DDA's negotiations on non-agricultural market access.
• PTAs divert scarce negotiating resources. Many countries in East Asia are negotiating five or more PTAs at the same time. While there are substantial spillovers from negotiating in different trade fora, each individual agreement requires its own share of preparation, consultation, coordination, and travel. There is therefore the risk that devotion of negotiating resources towards PTAs comes at the expense of reduced engagement at the WTO.
Is there anything special about the services component of East Asian PTAs that would strengthen either the ‘building block’ or ‘stumbling stone’ forces? Two arguments can be made in support of the ‘building block’ camp. First, most East Asian PTAs have adopted liberal rules of origin (see Section 3.5), reducing the discriminatory nature of trade preferences in services. Service providers from non-parties that have substantial business operations in the territory of a party typically benefit from the greater levels of openness available under PTAs. While this treatment still falls short of MFN treatment, it arguably generates less resistance to further multilateral liberalization from vested interests worried about preference erosion as in the goods case. From this view, one might argue that the obligation under GATS Article V to provide for liberal treatment of non-party service providers has laid the foundations for ‘WTO-friendly’ PTAs.
Second, positive spillover effects from PTA to WTO negotiations may be more important in services than in goods. Services negotiations are more information-intensive, requiring a resource-intensive stock-take of domestic laws and regulations that might be considered measures affecting services trade. Governments that have carried out a comprehensive stock-take in the course of PTA negotiations may be better prepared for services negotiations at the WTO. In other words, the East Asian services PTAs may play a useful role in overcoming ‘informational’ obstacles to further multilateral integration.
At the same time, there are also considerations that may lead East Asian PTAs in services to become a stumbling stone towards progress at the WTO. The United States, the European Union, Japan, and several other WTO members consider greater engagement in the WTO's services negotiations as a quid pro quo for committing to trade reforms in agriculture – currently the key sticking point for unlocking the DDA negotiations. One of the key trade policy measures in agriculture – domestic subsidies – by nature cannot be reduced on a preferential basis. Many East Asian countries would stand to gain from agricultural trade reforms at the WTO and, at the same time, are the targets of liberalization requests in services. If the ‘demandeurs’ in services are able to advance their offensive interests through PTAs, important bargaining chips may be removed from the multilateral negotiating table. By the same token, private sector interests may have less of an incentive to lobby for a successful conclusion of the DDA, if their market opening demands can be fulfilled in PTAs.
In addition, it is worth emphasizing that East Asian countries arguably have much to gain from engagement in the DDA's services negotiations. First, important commercial relations are not covered by PTAs – for example, Japan–Korea, China-Japan, or Japan–United States. The negotiation of PTAs between these trading partners cannot be ruled out, but does not appear likely in the foreseeable future. Improved GATS commitments offer the only realistic vehicle for wider and deeper policy bindings in these cases. Second, the WTO arguably offers the most credible mechanism for settling trade disputes between governments.
Finally, from an economic perspective, non-discriminatory liberalization ensures access to the world's most efficient service providers. Since performance in the service sector has emerged as a critical determinant of a country's export competitiveness and attractiveness to foreign investment, preferential arrangements may prove costly in the long term. Equally, a non-discriminatory trading system offers the greatest transparency and lowest transaction costs for modern service suppliers that are active in many countries, operate international networks, and frequently move staff from one location to another.
Appendix 1: Methodology for quantifying services commitments
This appendix describes the methodology for compiling the database of services commitments that forms the basis of the analysis in Section 2.
Our database identifies the ‘value added’ of PTAs for each of the 154 sub-sectors and four modes of supply identified under the GATS. In particular, we classified the resulting 616 entries per PTA schedule into four categories:
(i) Sub-sectors and modes for which only a GATS commitment exists or a PTA does not offer any improvement (GATS only);
(ii) Sub-sectors and modes for which a partial GATS commitment exists and a PTA eliminates or relaxes one or more remaining trade-restrictive measures (PTA improvements);
(iii) Sub-sectors and modes for which no GATS commitment is available, but a PTA commitment is made (PTA new sectors); and
(iv) Sub-sectors and modes for which neither a GATS nor a PTA commitment exists (Unbound).
For categories (i), (ii), and (iii), we further distinguished between partial and full commitments, with the latter defined as not listing any remaining trade-restrictive measures.
Trade-restrictive measures
We defined trade-restrictive measures as all measures that are inconsistent with GATS-style market access and national treatment disciplines. The additional classes of measures found in negative list agreements – local presence, performance requirements, and senior managers and boards of directors – are implicitly captured by these two disciplines. Local presence requirements are limitations on the provision of services through mode 1 of the GATS (non-conforming and future measures in negative list agreements do not distinguish between different modes of cross-border trade in services). Performance requirements and limitations on the nationality or residency of senior managers and boards of directors are discriminatory measures that would otherwise be covered by the national treatment discipline.
In recording trade-restrictive measures, we did not separately identify market access and national treatment measures. Thus, a partial commitment corresponds to a commitment that maintains at least one trade-restrictive measure in either the market access or national treatment category; a full commitment corresponds to a commitment that does not list any trade-restrictive measure in either of these two categories. In adopting this approach, we avoided classifying measures into the national treatment or market accesses domains – an issue for which PTAs establish different rules and which has been subject to conflicting legal interpretations (see Mattoo, Reference Mattoo1997).Footnote 54
Horizontal commitments
We treated horizontal commitments in GATS-style schedules as if they were inscribed in each scheduled sub-sector. In doing so, we adopted the following rules, following GATS scheduling guidelines:Footnote 55
• If a sectoral commitment indicates ‘unbound’, the relevant sector is fully excluded from a country's schedule and the horizontal commitment does not apply.
• If there is a partial sectoral commitment which can be read harmoniously with the horizontal commitment, both commitments apply.
• If there is a partial sectoral commitment which is mutually contradictory with the horizontal commitment, the former overrides the latter.
• If the sectoral commitment indicates ‘none’, horizontal limitations still apply unless expressly mentioned otherwise.
Definition of sectors
Our definition of sectors corresponds to the GATS Services Sectoral Classification List – also known as the W120 list.Footnote 56 In allocating commitments to the 154 sub-sectors, we adopted the following conventions:
• Commitments without any trade-restrictive measures that did not cover the full sub-sector (as defined under the GATS) were classified as partial commitments. In line with this approach, all commitments applying to residual categories – ‘other services’ within a particular sector or the overall ‘other services not included elsewhere’ category – were recorded as partial commitments, unless a whole residual category was expressly scheduled.
• Where a commitment covered two or more sectors, it was separately recorded in the relevant W120 categories.
• Where two or more commitments applied to the same W120 sector, we read the commitments jointly. A partial commitment was recorded whenever at least one of the relevant commitments listed remaining trade-restrictive measures.
• In selected cases, the description of service activities did not correspond to the W120 sector identified in the commitment. In those cases, we allocated the commitment to the W120 sector that we saw as most appropriately matching the description of activities.
These conventions apply equally to positive and negative list agreements. However, for negative list agreements, we started by assuming full commitments across all 154 sub-sectors and then reduced or eliminated commitments in line with the non-conforming and future measures listed.
Recording of commitments
In determining whether to record commitments as partial or full commitments, we ignored superfluous entries in commitments that did not constitute a limitation on market access or national treatment. These include, for example, references to non-discriminatory licensing requirements or non-discriminatory prudential measures, often found in the horizontal section of GATS-style commitment schedules.
As described above, we only counted a PTA commitment as an improvement over an existing GATS commitment if at least one trade-restrictive measure was relaxed or eliminated. In a number of cases, an entry in a PTA schedule was identical to – or effectively the same as – the corresponding GATS entry. In principle, the replicated PTA commitment still offers value added – for example, by making a policy binding subject to the PTA's dispute settlement understanding. However, since the focus of our analysis was on the liberalization content of PTAs, we allocated the relevant sub-sectors and modes to the ‘GATS only’ category.
Reflecting the definition of cross-border trade in services in negative list agreements, reservations under this heading were recorded as restrictions affecting modes 1, 2, and 4. In the case of mode 4, database entries took into account commitment made in horizontal chapters on the movement of natural persons.
Finally, in selected cases, we felt that there was legal ambiguity on the sectoral allocation or the level of openness. We resolved those cases by adopting the most liberal interpretation of the description of service activities or the trade-restrictive measures. For example, consider Japan's GATS commitment for certain legal services under mode 1. In the market access column, Japan's entry includes the limitation ‘Commercial presence is required’. At the same time, Japan has a ‘none’ entry under national treatment. Since the cross-border supply of legal services, by definition, cannot take the form of commercial presence in Japan, one may interpret Japan's commitment as a full prohibition of the supply of legal services under mode 1. In this case, Japan's national treatment commitment would seem irrelevant. However, we still recorded a partial commitment in this case. Even if Japan's commitment were to amount to a de facto prohibition, the actual policy regime in Japan could be – or could become – more liberal. If some cross-border supply of legal services was allowed, the guarantee of full national treatment would be of value to foreign service providers.
Fortunately, the number of cases with legal ambiguity was small and a more restrictive interpretation would not alter any of the conclusions drawn in Section 2.Footnote 57