1. Introduction
As part of the current revision of the Brazilian tax code, and the World Bank’s Public Expenditure Review on Greening Fiscal Policy for Brazil (World Bank, 2022), an important issue is how improved fiscal policy can better foster efficiency and sustainable and inclusive growth in Brazil. A key aspect of our work on this topic is how road fuel pricing and carbon pricing, more generally, fit into Brazil’s overall fiscal and climate policy framework, which currently is highly complex and in need of overhaul.
This paper focuses on fuel taxes for road transport in Brazil. At least four main reasons can be given for emphasis on this topic:
1. Reforming the taxation of fossil fuels could be a first step towards a more systematic and complete internalization of externalities related to greenhouse gas emissions in Brazil. Reforming road fuel taxes constitutes an important part of this work.
2. Reforming the existing Brazilian fossil fuel subsidy and tax expenditure policies is also a necessary condition for the implementation of a fully efficient emission trading system in Brazil. Road fuels represent about half of the aggregate fossil fuel consumption in Brazil. Taxation of these fuels is therefore an important element in Brazil’s climate policy and in Brazil’s tax framework.
3. Brazil has historically stood out in global comparisons for the complexity of its tax system. An important part of the ongoing tax reform is to contribute to the updating and simplification of the Brazilian tax system.
4. Brazil is the Latin America and the Caribbean (LAC) region’s largest country, both in land area and population, is largely natural resource-based and has large emissions from the land use, land use change and forestry sector, but a small energy-related carbon footprint. It appears as natural for Brazil to go ahead as a climate policy leader for LAC, by showcasing good policies for managing the ongoing transition to reach a global net zero carbon emission level by around 2050. A current climate policy leadership role of Brazil is even more relevant as Brazil is the sponsor of COP-30, which will be held in Belém in late 2025.
While optimal taxes on fuels for road transport have a clear climate-related component and are considered as part of Brazil’s climate policy, such taxes have several rationales and objectives that are not climate-related. Road transport leads to various externalities that may require fuel taxation for their correction, including the followingFootnote 1:
1. Climate-related externalities from carbon emissions when fuels are burned.
2. Road fuel consumption may contribute to oil import dependence, in particular since road fuels for many countries comprise a very large fraction of these countries’ oil consumption.
3. Damages due to air quality impacts: emissions from motor vehicles have damaging effects on human health, as well as on other natural and built-up objects.
4. Congestion effects: overloading of road transport systems leads to congestion with time delays, which leads to welfare losses. A large fraction of these costs is not considered by individual drivers and therefore represents externalities.
5. Externalities related to road accidents, which lead to persons killed and injured in traffic, and material costs. Much of these costs are not considered by drivers and are thus external.
6. External costs of road maintenance, much of which is due to road traffic.
7. Noise from road traffic: damage and nuisance from such noise can be fully considered as negative externalities.
Among these components, only the first two are directly related to fuel consumption. Components 4–7 are related to driving and not to fuel consumption as such: these components would, for example, be treated in the same way for electric vehicles (EVs), which do not use fuels, as for vehicles with internal combustion engines (ICE vehicles). Component 3 is related to both fuel consumption and driving length and can be reduced, e.g., through cleaner engines and emissions, and improved fuel efficiency of vehicles. In terms of optimal control of driving externalities, motor vehicle use should to a large extent be taxed according to the amount of driving and not the amount of fuel consumed. For example, congestion should (ideally) be taxed for driving in congested areas and conditions (e.g., by local and time-differentiated road tolls or contingent kilometre charges). Accidents should best be taxed by charging for road accident risks (depending, e.g., on the quality of the driver, driving speeds and risk behaviour, and kilometres driven; and/or be reflected in drivers’ insurance premia which in principle could substitute for much of this tax component). In reality, such practices are however not used, nor planned to be used, in Brazil today or in the immediate future. Taxing road fuels then represents the simplest and most practical way to tax motorized road driving activity in Brazil. But we need consideration for the imperfections of this instrument.
Elements 2 (import dependence) and 7 (noise) are not considered in our calculations. First, Brazil has a more than sufficient domestic motor fuel supply. Secondly, from other related studies (including the fuel tax evaluation for Chile by Parry and Strand (Reference Parry and Strand2012a)), the externality cost of traffic noise has been found to be negligible (contributing less than US$0.01 per litre to optimal fuel taxes) and is here dropped.
Road fuel taxation has a high potential for raising tax revenues, in Brazil and elsewhere. A question is whether there should be a pure revenue-raising component behind the justification and level of road fuel taxes, apart from the externality-correcting components mentioned. We do not consider any such pure (fiscal and distributional) role behind our proposed road fuel taxes. We will, however, assume that all fuel tax components (also elements imposed for efficiency purposes) are subject to, and marked up with, the Brazilian general value-added tax (VAT). This tax today is 17 per cent, but is currently set to be increased to approximately 26.5 per cent by 2027, as part of the Brazilian tax reform.Footnote 2 This rate will be imposed on those transport elements that are considered as final consumption. This ‘levels the playing field’ between different final goods, which all should, in principle, be subject to the VAT.
Several types of fuels are used for road transport in Brazil. This study considers the three most important ones: gasoline, diesel and ethanol. We ignore other fuels, including biodiesel which has an increasing importance in Brazil today.Footnote 3 These fuels are currently taxed via the VAT and at the state level, but with hardly any other federal taxes. The current tax on standard gasoline C (containing 27 per cent ethanol) is 1.57 Brazilian Reals (BRL) or US$0.27 per litre; the tax on diesel is BRL1.44 or US$0.25 per litre; and the tax on ethanol is BRL1 or US$0.17 per litre.Footnote 4
Regarding our own optimal fuel tax assessments, gasoline and ethanol are blended with alternative blending shares (with a standard ethanol share of 27 per cent in gasoline C) and used for lighter vehicles (all cars and motorcycles, and most light trucks and SUVs). Diesel is used for heavier vehicles, by far the most for heavy-haul trucks and buses. Diesel is more energy dense and weighs about 10 per cent more than gasoline.Footnote 5 The energy density per litre of ethanol is about two-thirds of that of gasoline.Footnote 6 The number of kilometres a given vehicle can drive on 1 l of fuel is then highest for diesel, and lowest for ethanol. This is important for our fuel tax calculations where several externalities are based on kilometres driven (and not on fuel consumption), such as congestion, accidents and road damage.
Ours is the first international assessment of optimal taxes for ethanol used for road transport. Brazil is the country with the highest share of ethanol (and other biofuels) in total motor fuel consumption worldwide.Footnote 7 There has long been a view in Brazil that ethanol, being a ‘clean’ fuel, ought to be subject to very low or even zero taxation, with no excise taxes to correct for externalities. This is incorrect for several reasons. First, since optimal fuel taxes in our framework to a large extent depend on distance driven per unit of fuel (as for congestion and accidents), and not on fuel consumption as such, ethanol ought to be subject to taxation of these components albeit at a lower rate than gasoline (since, as noted, ethanol is less energy dense than gasoline and diesel: a motor vehicle drives fewer kilometres on 1 l of ethanol than on 1 l of gasoline, creating lower externality costs per litre). Secondly, ethanol is not necessarily ‘climate neutral’. There can be a significant climate component in the optimal fuel tax of ethanol. This is due to at least two factors. First, producing sugar cane, the main feedstock for ethanol production in Brazil, is land intensive and leads to tropical forest losses in Brazil, resulting in positive carbon emissions.Footnote 8 Secondly, sugarcane production consumes fossil fuels, mostly due to its heavy machinery and fertilizer use.
Brazil also produces and consumes other fuels for road vehicles, among them biodiesel (about 6.8 million tons in 2021), but these are less significant than the three fuels focused on here and will not be discussed further.
2. Background for calculating optimal fuel taxes for Brazil
No detailed study of optimal road fuel taxes has yet been carried out for Brazil. Rough estimates of optimal gasoline and diesel taxes have, however, been made as part of work on global energy subsidies by the International Monetary Fund (IMF); see Parry et al. (Reference Parry, Heine, Li and Lis2014), Parry et al. (Reference Parry, Black and Vernon2021) and Black et al. (Reference Black, Liu, Parry and Vernon2023a).Footnote 9 Central in the IMF’s work are two concepts, ‘explicit’ and ‘implicit subsidies’. ‘Explicit subsidies’ represent the standard subsidy concept, namely fiscal outlays for consumption or production of fossil fuels making them cheaper to the public. More relevant to us are ‘implicit’ energy subsidies, found by calculating the ‘optimal’ (externality-correcting) taxes on energy products and subtracting the (positive or negative) tax actually levied.
‘Optimal’ gasoline and diesel taxes have been assessed by the IMF for about 170 countries (Parry et al., Reference Parry, Black and Vernon2021, Black et al., Reference Black, Liu, Parry and Vernon2023a), among them Brazil.Footnote 10 Under the IMF’s principle, a VAT rate for the entire economy is usually added to derive the economy-wide optimal fuel tax.
These IMF fuel tax calculations are imprecise, based on global models and descriptions, including data from the World Health Organization’s Global Burden of Disease project, and applying the GAINS model from the International Institute for Applied Systems Analysis in Vienna. Our objective is to produce more precise fuel tax assessments for Brazil, based on the best available and original Brazilian data.
We here first introduce a simple modelling framework for assessing an ‘optimal’ fuel tax, which encompasses all externality components. Parry et al. (Reference Parry, Walls and Harrington2007) present the following formula for optimal (Pigouvian) fuel taxes (where VAT rates are assumed to be built in):
 \begin{equation}t = {E_F} + {E_D}\beta F.\end{equation}
In equation (1), t is the Pigouvian fuel tax per litre, EF is the direct externality cost per litre of fuel consumption (mainly the climate and air pollution costs), while ED is the cost per litre of fuel consumption for distance-related externality components (such as congestion, accidents and road wear). F is a factor converting driven distance into fuel consumption: the more kilometres driven on 1 l of fuel (or alternatively, the better a vehicle’s fuel economy), the larger is F. β expresses the fraction of the reduction in fuel consumption due to the tax that follows from reduced driving (as opposed to improved fuel economy). The idea behind this factor is that if the fuel tax reduced fuel consumption only by improving the fuel economy (e.g., by moving to more efficient vehicles), no gains would be reaped in terms of reduced congestion or accidents; such gains are reaped only when an increased fuel tax leads to reduced driving.
β is likely to differ between gasoline-/ethanol-driven and diesel-driven vehicles. For the former vehicle category, personal choices of vehicle weight make this choice much more ‘endogenous’ than for the latter vehicle type where much more of the choice of vehicle weight will be independent of fuel costs, as these are largely professional and much less private vehicles. This is likely to make β higher for diesel than for the other fuels.
In equation (1), it is assumed that the appropriate VAT components are built into the individual externality elements. While gasoline and ethanol are final consumption elements, full VAT needs to be added for these elements. For diesel, it is different: diesel is used by far the most by heavy trucks (92 per cent) and buses (8 per cent), and (in the case of heavy trucks) for commercial purposes for which diesel is an intermediate input, where the VAT cost is credited against any VAT charged on sales, and refunded given an excess credit position at the end of the accounting period. No net VAT cost generally follows when fuels are a direct business expense. As a result, a much lower VAT element will be included in the optimal diesel tax.
Trying to find an ‘optimal’ level of t is with caveats. Importantly, the externality elements can vary substantially across time and by vehicle, and differ dramatically by location (both by urban region and even more between urban and rural areas). Substantial welfare gains could be reaped by differentiating t by region, city and time (in particular as the congestion element can be very high at rush hour times, but virtually zero when traffic volumes are low). Parry and Small (Reference Parry and Small2005) and Parry et al. (Reference Parry, Walls and Harrington2007) have also shown that charging a tax on driving that depends on distance instead of on fuel consumption can yield large welfare gains. This may be a policy for future revisions, but cannot be considered here. Note also that vehicles with better fuel economy (larger F) will, everything else equal, require a higher optimal Pigouvian tax (since they travel a longer distance, causing more distance-related externalities, on a given amount of fuel).
3. Some basic data relevant to this study
3.1. Numbers of motor vehicles in Brazil
Table 1 shows that there are about 67 million gasoline-powered four-wheel vehicles in Brazil (assuming that half of the vehicles in the minivan/SUV category, many of which are commercial vehicles, run on gasoline and ethanol, and half on diesel). There are also almost 32 million motorcycles and mopeds. All private vehicles (not running on diesel) can be fuelled by alternative combinations of gasoline and ethanol, while buses and heavy trucks all run on diesel. We assume that at least 95 per cent of the gasoline and ethanol consumption is by four-wheelers. The share of plug-in EVs is today negligible and will be ignored.
Numbers of motor vehicles in Brazil by main type, in millions, November 2022

Table 1 Long description
The table reports counts of motor vehicles in Brazil by main vehicle type, with totals in millions and each type’s share of the overall fleet for November 2022. Cars are the largest category with 60.5 million vehicles, representing 52.6% of the total 115.1 million. Motorcycles are the second-largest group at 26.2 million, or 22.8%. Minivans account for 9.1 million, 7.9%, while SUVs total 5.5 million, 4.8%, and mopeds total 5.4 million, 4.7%. Other vehicles make up 4.7 million, 4.1%, and heavy trucks total 3.0 million, 2.6%. Buses are the smallest listed category at 0.7 million, 0.6%. Percent shares are parts of the stated total and may not reflect finer subcategories beyond the main types shown.
Source: SENETRAN.
There are about 0.7 million buses and 3 million heavy trucks in Brazil, all of which run on diesel. About 92 per cent of the road diesel consumption is by heavy and some light trucks, according to IMF data (see Parry et al., Reference Parry, Black and Vernon2021), making us focus on that market segment.
3.2. Road fuel consumption in Brazil in recent years
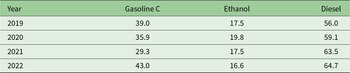
The consumption of gasoline, diesel and ethanol used as road fuels in Brazil for 2019–2022, from Empresa de Pesquisa Energetica (EPE), is displayed in table 2.Footnote 11
Road fuel consumption in Brazil, annual values, 2019–2022, in billion litres

Table 2 Long description
Annual road fuel consumption in Brazil is listed for 2019 through 2022, in billion litres, for Gasoline C, ethanol, and diesel. Diesel is the largest fuel in every year and increases steadily from 56.0 in 2019 to 59.1 in 2020, 63.5 in 2021, and 64.7 in 2022. Gasoline C declines from 39.0 in 2019 to 35.9 in 2020 and reaches its low point at 29.3 in 2021, then rebounds sharply to 43.0 in 2022. Ethanol peaks at 19.8 in 2020 and then falls to 17.5 in 2021 and 16.6 in 2022, ending below its 2019 level of 17.5. Overall, diesel shows consistent growth, gasoline shows a dip followed by a strong recovery, and ethanol trends downward after 2020. Values are annual totals and do not indicate seasonal variation or per-vehicle efficiency.
Source: Empresa de Pesquisa Energética.
What is called ‘Gasoline C’ in Brazil is gasoline with an average ethanol content of 27 per cent, maintained since 2015 until today (see US Department of Agriculture, 2023). This means that the pure total gasoline (ethanol) consumption in 2019 was 28.5 (28.0) billion litres; while in 2022 it was 31.4 (28.2) billion litres. This results in gasoline-equivalent common fuel consumption of gasoline and ethanol in the amount (28.5 + 28 × 2/3 =) 47.3 billion litres in 2019, and (31.4 + 28.2 × 2/3 =) 50.3 billion litres in 2022.
Different data sources, however, provide different measures of road fuel consumption in Brazil.Footnote 12 This is revealed in table 3. Figures from different sources diverge substantially, which raises questions about the individual data sets and their reliability. We have chosen the EPE data as this institution has high trust in Brazil, and the figures appear overall very plausible.
Different assessments of road fuel consumption in Brazil, 2019, in billion litres

Table 3 Long description
The table compares four sources’ estimates of Brazil’s 2019 road fuel consumption, reported in billion litres for gasoline C, ethanol, and diesel. EPE gives the highest volumes among the litre-based sources: 39 for gasoline C, 17.5 for ethanol, and 56 for diesel. SINDICOM reports much lower figures: 24 gasoline C, 12.1 ethanol, and 22.4 diesel. A compiled dataset is lower still for gasoline C and ethanol at 21.4 and 11.8, while diesel is 34.3. The US Energy Information Administration lists gasoline as about 50 and provides shares for ethanol and diesel rather than litre totals, so those two entries are not directly comparable to the other rows. Overall, diesel is the largest fuel in the litre-based estimates, but the spread between sources is substantial, indicating methodological or coverage differences.
Source: Author’s calculations.
The amount of diesel fuel consumed in Brazil seems high relative to gasoline and ethanol consumption, when compared to other similar countries, as diesel in Brazil is hardly used for private passenger transport. A reason for the high diesel consumption is that a very large share, 66 per cent, of goods transport in Brazil is done by trucks. Such transport and its related fuel consumption are massive due to large distances and poor road quality in many Brazilian regions. This means that goods transport is more fuel intensive in Brazil than in most other countries.
3.3. Calculation of distances driven by four-wheeled motor vehicles in Brazil
We next compute total annual driving lengths for vehicles running on gasoline/ethanol and on diesel. Such calculations are necessary for the assessment of congestion externalities per litre of fuels consumed and to some degree for computing externality measures related to road accidents. Both these externalities are related to driving distance and not to fuel consumption.
From the International Energy Agency (IEA) website, we find that the average fuel efficiency of gasoline- and ethanol-fuelled motor vehicles in Brazil is 13.3 km per litre of gasoline. With a total (gasoline-equivalent) fuel consumption of 50 billion litres (as of 2019), this corresponds to a total driving length of (13.3 × 50 billion =) 665 billion km for all vehicles running on such fuels. This calculation implies that the average annual driven distance for gasoline- and ethanol-fuelled vehicles in Brazil is approximately 10,000 km.
Next, consider diesel. Three million heavy trucks, each of which covers about 50,000 km per year, have an average fuel efficiency of about 3.5 km per litre of diesel burnt. There are also about 700,000 buses, also assumed to travel about 50,000 km per year, with the same fuel efficiency as trucks.Footnote 13 This corresponds to total driving by heavy trucks and buses of 185 billion km per year. Many lighter commercial vehicles also run on diesel. We estimate the number of these at 2 million, and their average driving distance per year (also here using the São Paulo table) is approximately 20,000 km. This adds 40 billion annually driven km, making the total driving by diesel-fuelled vehicles 225 billion km per year. The fuel consumption of these vehicles is calculated at 64.3 billion litres, very close to the EPE data used (64.7 billion litres). This also corroborates our assumptions about average annual travel distances and vehicle fuel efficiencies.
3.4. Values of statistical life and time in Brazil
We have in this study adopted a modified value of statistical life (VSL) for pollution-related deaths by taking 15 per cent of the US$10 million value currently used by the US Environmental Protection Agency, thus US$1.5 million. For traffic-related deaths, we use 15 per cent of the value used by the US Department of Transportation (which is US$12.5 million), thus US$1.85 million.Footnote 14
Estimates of the value of time (VOT) for Brazilians are used to calculate congestion externalities in road traffic. A traditional way to account for VOT is to use observations on net average wages and adjust these by a fixed factor below unity (typically, between one-half and two-thirds).
The average hourly wage in Brazil (by the end of 2022) is BRL16, or about US$3.20. Sixty per cent of this value is approximately US$1.90. Sixty per cent is the percentage value used by Parry et al. (Reference Parry, Black and Vernon2021) and will be used also here; see also FGV Cidades (2022).
4. Road fuel taxes in Brazil by externality components
4.1. Global climate change
Gasoline and diesel consumption lead to carbon emissions. The optimal road fuel tax charge must include an element representing this emission rate and its global cost. Gasoline engines emit 2.3 kg of CO2 per litre of gasoline consumed. For diesel, this ratio is 2.7 kg of CO2 per litre of diesel. We apply a carbon price of US$60/ton CO2, the midpoint of the range (US$40–80) proposed for the World Bank for 2020–2030 by the High-Level Commission on Carbon Prices (2017).Footnote 15 This implies carbon charges of US$0.138 per litre for gasoline, and US$0.162 per litre for diesel.
For ethanol, deforestation related to sugarcane production required to supply the ethanol industry leads to carbon emissions (as sugarcane is the feedstock for about 80 per cent of all ethanol production in Brazil, with corn representing 20 per cent). The land use implications of this sugarcane expansion, including induced deforestation, are however highly uncertain. According to Valdes (Reference Valdes2011), the land use by the sugarcane industry was about 10 million hectares in 2010. In that year, the ethanol production in Brazil was about 27 billion litres, which was grown on 55 per cent of the total land area for sugarcane production (5.5 million hectares). Assume that 14 per cent of the sugarcane land leads to deforestation in Brazil, as indicated in Souza Ferreira Filho (Reference Souza Ferreira Filho2014).Footnote 16 Ethanol production then leads to 0.8 million hectares of deforestation in Brazil, which (given 500 tons of CO2 per hectare lost to deforestation) leads to a carbon loss of 400 million tons CO2, resulting from sugarcane production as an input into making ethanol. This results in an aggregate discounted cost of US$24 billion, assuming a carbon price of US$60 per ton CO2. This cost must be annualized. Given a (conservative) discounting interest rate of 3 per cent, the annual climate cost is ($24 billion × 0.03 =) $0.72 billion. Divided by the Brazilian ethanol consumption in 2010 (27 billion litres), this leads to a cost of (US$0.6 billion/27 billion litres =) US$0.027 per litre.
More recent calculations by Souza Ferreira Filho (verbal communication) indicate that these numbers could represent an overestimate of the carbon impact of the required sugarcane expansion. Sant'Anna (Reference Sant'Anna2021), however, indicates that the forest loss due to sugarcane expansion in Brazil may be larger. This issue is currently not settled. We here choose to rely on the number derived earlier as our central estimate.
Higher deforestation and CO2 emission rates due to ethanol production in Brazil could, however, occur as about 6 billion litres of ethanol, or about 20 per cent of the current total ethanol production in Brazil, now are being sourced using corn as the feedstock, mainly in the states of Mato Grosso and Mato Grosso do Sul.Footnote 17 Corn production could imply a greater burden on deforestation than sugarcane production. Assume that the land use per ton of ethanol production is the same for corn and sugarcane and that the deforestation impact of increased corn production is 50 per cent of the land area used. The carbon cost of ethanol from corn in Brazil is then US$0.096 per litre, and the average carbon cost per litre of ethanol production is (2.7 × 0.8 + 9.6 × 0.2 =) US$0.041 per litre.Footnote 18
Sugarcane and corn production in Brazil lead to carbon emissions also due to the use of heavy machinery and fertilizers in these sectors. This impact is, however, small, not yet quantified, and will not be accounted for in the current study.
4.2. Air pollution externalities
Motor vehicles running on gasoline or diesel emit substances that can be damaging to human health, other biological life and materials. Substances harmful to humans are carbon monoxide, lead, nitrogen oxides, ground-level ozone, particles (in the following ‘particulate matter’) and sulphur oxides. Among these, particulate matter, mainly PM2.5,Footnote 19 nitrogen oxides (NOx) and ground-level ozone (O3) are the most harmful; these pollutants are typically included in studies of the impacts of gasoline and diesel emissions. There is no scientific consensus regarding harmful emissions due to ethanol consumption, except that they are less severe than those due to gasoline.Footnote 20
Air pollution from road vehicles causes various damages. But most studies indicate that increased mortality to humans typically represents between 75 and 80 per cent of the total monetized damages.Footnote 21 We will use mortality data as the basis for our damage assessments, accordingly adjusted upward.
A Brazilian government report (Brazilian Ministry of Health, 2019) provides detailed data on mortality due to different causes, including air pollution for 2016, and is here used for calculating the magnitude of air pollution externalities due to road traffic in Brazil.Footnote 22 These data cover all causes of air pollution, indoors and outdoors. An advantage is that they are based on data for all of Brazil. They are also official, collected and approved by the Brazilian government. In our fuel tax estimations, these data will be applied.
All pollution-related road traffic deaths in Brazil are assumed to be related to outdoor air pollution (none to indoor pollution), which constitutes about half of the total mortality due to air pollution in Brazil. The share of air pollution mortality attributed to road traffic is 37 per cent for PM2.5 (the most important pollutant). We assume that this share is the same for other outdoor air pollution.
The table on page 316 of the Brazilian Ministry of Health (2019) report tells us that the average mortality from air pollution in Brazil in 2016 (considering all pollution sources) was 24.3 deaths per 100,000 of population, or about 50,000 deaths for the entire Brazilian population in that year. About half (25,000) died due to outdoor pollution, and half due to indoor pollution. Thirty-seven per cent of the outdoor pollution-related deaths in Brazil, about 9,250 persons, were then due to road traffic.
Applying our preferred VSL value for pollution-related deaths, US$1.5 million, the total cost due to increased mortality in Brazil is US$1.5 million × 9,250 = US$13.9 billion.
Assume that the cost shares allocated to gasoline and diesel are the same as in Leiriao’s (Reference Leirião2023a, Reference Leirião2023b) calculations for PM2.5. A share of 8 per cent of the total number of road-related air pollution deaths in Brazil are then due to gasoline, 92 per cent to diesel and a zero share to ethanol. This implies a total national mortality cost of US$1.1 billion for gasoline, and US$12.8 billion for diesel.
Assume that the 2016 fatality numbers are representative also for 2022 air pollution fatalities and that mortality impacts represent 75 per cent of the total social costs of air pollution (see Parry et al., Reference Parry, Walls and Harrington2007). The total air pollution costs caused by gasoline and diesel consumption would then be US$1.47 billion and US$17 billion, corresponding to externality costs of US$0.047 per litre for gasoline, US$0.263 per litre for diesel (given 31.4 billion litres of gasoline and 64.7 billion litres of diesel consumed in 2022) and zero for ethanol.
4.3. Valuation of road accident externalities and their contribution to optimal fuel tax rates
Externalities related to road accidents are a function of distance driven (in km) and not fuels consumed. When driven distance cannot be taxed directly, motor vehicles can instead be taxed for their accident externalities by taxing the fuels consumed, using formula (1).
We seek to derive the optimal fuel tax components for accident externalities for gasoline and diesel. For ethanol, we use the gasoline estimate multiplied by 0.655 (the energy density of ethanol relative to gasoline). One litre of ethanol permits driving only 0.655 of the distance driven on gasoline, resulting in only 0.655 of the accident externality for gasoline, assuming that ethanol and gasoline are used by vehicles with the same fuel economy on average.
In valuing road accident externalities, road fatalities usually represent about 75–80 per cent of external accident costs related to driving, focusing then on this cost category.
From table 4, the number of road fatalities in Brazil in 2016 (the last year for which we have good such data) was 41,000, a very high number considering the amount of driving on Brazilian roads.Footnote 23 Perhaps surprisingly, only 34 per cent of fatalities are four-wheel vehicle occupants (drivers or passengers of cars, SUVs, buses and trucks). An equal number of fatalities occurred among motorbike riders, and almost as many among pedestrians. Most of the costs, by far, related to fatalities (here, counting only VSL values, at US$1.875 million per fatality) can be considered as external.Footnote 24
Numbers and cost figures, fatal traffic accidents in Brazil, 2016 (assuming a Brazilian VSL of US$1.875 million)

Table 4 Long description
The table summarizes fatal road traffic accidents in Brazil in 2016 by road user type, listing fatalities, share of total deaths, total cost, and externality cost in billions of US dollars. Total fatalities are 41,000, with an estimated total cost of 76.9 billion and externality cost of 58.6 billion. Vehicle occupants account for 14,000 deaths, 34 percent of fatalities, 26.3 billion in cost, and 13.1 billion in externality cost. Motorbike riders account for 13,800 deaths, also 34 percent, 25.9 billion in cost, and the largest externality cost at 20.8 billion. Pedestrians and others account for 11,500 deaths, 27 percent, and 21.5 billion in both total and externality costs. Bicycle riders have 1,700 deaths, 4 percent, and 3.3 billion in both total and externality costs. Costs are estimates based on an assumed value of a statistical life, so figures depend on that valuation and should be interpreted as approximate.
Source: https://www.roadsafetyfacility.org/country/brazil/: Global Road Safety Facility and the World Bank.
In terms of optimal taxation of road driving (including fuel taxation), an essential aspect is whether costs are external (and should be subject to a corrective tax) or internal (taken into account by the driver, and do not need a corrective tax). For occupants of cars and trucks, concern for one’s own life and passengers can be considered as internal, while concern for persons in other vehicles, and others being injured or killed on the road (motorcyclists, bicyclists, pedestrians and bystanders), is usually considered as external. The reason is that in most cases the car or truck driver will not be held legally responsible, and not punished, for a death caused in a collision with their vehicle. The car or truck driver then has no strong reason to take extraordinary measures to reduce the probability of fatal accidents. For vehicle occupants killed in collisions between vehicles, it is common to consider half of the resulting damage as external and half as internal (Parry et al., Reference Parry, Walls and Harrington2007; Small and Verhoef, Reference Small and Verhoef2007); this is also assumed here. Fatalities among bicyclists and pedestrians, and most motorbike riders, are considered as external. We then find a total fatality cost for Brazil of US$76.9 billion, with an externality component of US$58.6 billion.
To allocate these externality costs to gasoline/ethanol and diesel, assume that the fatality numbers for 2023 are the same as in table 4 (despite traffic being somewhat higher in 2023 than in 2016). We then also need to indicate how these costs are distributed between cars/SUVs and trucks/buses. We do not have access to such distributional data. We will assume that all driven kilometres (by cars or trucks) lead to the same accident risks, and correct the estimates by possibly different externality shares.Footnote 25
We do not have data for other externality costs due to road accidents in Brazil. We assume that these costs can be added summarily, by scaling up the externality cost figures in table 4 by a factor of 1.25 (which corresponds to the procedure for Chile in Parry and Strand (Reference Parry and Strand2012a, Reference Parry and Strand2012b); see also De Palma et al. (Reference De Palma, Kilani and Lindsay2008)). This gives a total annual externality cost of road accidents in Brazil equal to US$73.3 billion.
Considering our estimates of vehicle kilometres for vehicles driven by gasoline/ethanol and diesel, 665 and 225 billion km, respectively, the shares of the externality cost attributable to gasoline/ethanol and diesel vehicles are then approximately 75 and 25 per cent, respectively. This means that US$55 billion of the total accident-related externality cost is attributable to gasoline-/ethanol-driven vehicles, and US$18.3 billion to diesel-driven vehicles, respectively.
The next question is how these costs impact taxes for the three fuels considered. This depends also on the parameter β in equation (1): the fraction of the reduction in fuel consumption due to reduced driving, as opposed to improved fuel economy. This share is less than one in the medium and long run relevant here. We choose β = 0.4 for gasoline/ethanol, corresponding to the choice for Chile by Parry and Strand (Reference Parry and Strand2012a).Footnote 26 β is likely higher for diesel, for which we choose β = 0.6 (60 per cent of the reduction in fuel consumption due to the carbon tax results in reduced driving, and only 40 per cent results in an altered vehicle choice, with less weight and/or higher fuel efficiency).Footnote 27 This gives the following estimates for the tax per litre of the respective fuels, related to accident externalities (before adjustment for VAT)Footnote 28:
For gasoline: (US$55 billion divided by 50.3 billion × 0.4 =) US$0.437.
For ethanol: (gasoline tax component × 0.655 =) US$0.286.
For diesel: (US$18.3 billion divided by 64.7 billion × 0.6 =) US$0.17.
4.4. Congestion externalities
The social costs related to congestion externalities from road traffic primarily consist of added time costs for drivers and passengers due to reduced driving speeds in congested conditions. A much used and tested specification of the relationship between travel time and congestion (from Small and Verhoef, Reference Small and Verhoef2007) is as follows:
 \begin{equation}T = TF(1 + \alpha {V^\theta }).\end{equation}
T is time per distance travelled, and TF is travel time for free-flowing traffic. The last term in the parentheses represents increased travel time due to congestion. α and θ are estimated parameters. Subtracting TF from equation (2) and dividing by V gives the average delay per kilometre, DEL(av):
 \begin{equation}DEL(av) = \frac{{T - TF}}{V} = TF\alpha {V^{\theta - 1}}.\end{equation}
The marginal delay per kilometre of travel DEL(m) is found by differentiating (2) with respect to V:
 \begin{equation}DEL(m) = \frac{{dT}}{{d\theta }} = \theta TF\alpha {V^{\theta - 1}}.\end{equation}
This yields the following ratio:
 \begin{equation}\frac{{DEL(m)}}{{DEL(av)}} = \theta .\end{equation}
A standard estimate for θ is 4 (used for road congestion calculations in the USA by the US Bureau of Public Roads; see also Maerivoet and De Moor (Reference Maerivoet and De Moor2008)). The average delay caused by road congestion, which we assume is internalized by drivers, must then be multiplied by a factor of 4 to find the (average) marginal delay.Footnote 29 The pure externality related to traffic congestion (not internalized by drivers) is then the marginal minus the average delay, which is (4 – 1 =) 3 times the measured average delay. This share is not internalized by drivers themselves and needs correction through the fuel tax.
To calculate the congestion component of the optimal road fuel taxes for gasoline, diesel and ethanol, we need several types of data. One is the annual consumption of gasoline, ethanol and diesel in the São Paulo region. The consumption levels for gasoline and diesel in São Paulo were 3,580 and 3,220 million litres in 2019, respectively (Leirião, Reference Leirião2023a). Adjusting the gasoline number for a gross ethanol consumption of 1,500 million litres in that year and adjusting ethanol consumption down by the efficiency factor of 0.655, the effective gasoline and ethanol consumption (in gasoline units) was 4,570 million litres in 2019.
FGV Cidades (2022) provides an estimate of time lost due to congestion in road traffic in São Paulo, namely 68 million minutes = 1.13 million hours per day or 414 million hours per year, when each motor vehicle has only one occupant. Assume that 90 per cent of the congested time is experienced by cars and SUVs fuelled by gasoline and ethanol, with on average 1.3 adult occupants. Then these vehicles experience 484 million adult person-hours of congestion delays per year.
Additional congestion time is experienced by occupants of buses and trucks running on diesel. 56,000 buses operate in São Paulo, each driven about 50,000 km per year, with fuel efficiency of about 3.5 km per litre. This translates into a diesel consumption of 800 million litres by São Paulo’s buses in 2019. From similar calculations, about 2,400 million litres of diesel is consumed by trucks in São Paulo. Assuming the same fuel efficiency of trucks and buses, trucks are driven three times as many kilometres as buses in São Paulo.
Assume (conservatively) that buses have on average 15 adult passengers (for which congestion costs are counted) including the driver. Trucks are assumed to have 1.3 adult occupants on average. This translates into an average of 4.7 (adult) occupants of diesel-driven vehicles in São Paulo. As assumed earlier, 10 per cent of vehicle traffic delays (out of total annual traffic delays of 414 million hours in São Paulo) occur among trucks and buses. This translates into (48 million × 4.7 =) 226 million person-hours lost per year to congestion for adults in diesel-driven vehicles in São Paulo.
The total number of person-hours per year lost to traffic congestion in São Paulo is then (484 + 226 =) 710 million hours for adult occupants of all motor vehicles.
We next calculate the shares of hours lost due to congestion delays attributable to gasoline- and ethanol-driven vehicles, and to diesel-driven vehicles, respectively. For diesel-driven vehicles, this fraction is determined by total fuel consumption, times fuel efficiency (indicating the number of kilometres driven per litre of diesel fuel by such vehicles), multiplied by a congestion-causing factor set at 2.5 (a bus or truck causes 2.5 times the amount of congestion caused by a car on average).Footnote 30 Fuel efficiency of buses and trucks, relative to the fuel efficiency of gasoline-/ethanol-fuelled vehicles, is assumed to be (3.5/13 =) 0.27 (the number of kilometres driven by a given amount of diesel is 0.27 times the number of kilometres driven by the same amount of gasoline). Out of the total amount of congestion caused by all motor vehicles in São Paulo, a fraction of 0.678 is then caused by gasoline and ethanol-fuelled vehicles, and a fraction of 0.322 by diesel-fuelled vehicles.Footnote 31 Among the 710 million hours lost to congestion, 484 million hours are then lost due to gasoline-/ethanol-driven vehicles, and 226 million hours are lost due to diesel-driven vehicles. These are the same values as found based on the FGV Cidades (2022) data, performed earlier. Time losses are valued at a social cost of US$1.90 per hour lost for adults in Brazil, from section 3.4.
4.4.1. Congestion element in optimal gasoline and ethanol taxes for Brazil
As derived for the São Paulo region earlier, the marginal externality cost of driving in congested conditions for vehicles fuelled by gasoline and ethanol is three times the average congestion cost, or (484 × 3 =) 1,452 million person-hours attributable to gasoline/ethanol. This gives a total externality cost (valued at US$1.90 per hour) of US$2,760 million for the São Paulo urban area.
We still assume that β, from (1), equals 0.4 for such vehicles. Dividing by the amount of (gasoline-equivalent) fuel consumed in the São Paulo region (in 2019) gives an optimal fuel tax component of US$0.242 per litre of gasoline, and US$0.158 per litre of ethanol.
4.4.2. Congestion element in optimal diesel tax
Driving by diesel vehicles in the São Paulo region leads to 226 million hours lost due to congestion annually. Multiplied by 3 (to derive the marginal congestion costs) and by the average hourly value of US$1.90, this gives a total congestion externality cost of US$1,290 million.
We assume as before that β, in equation (1), equals 0.6 for diesel. With a total diesel consumption of 3,220 million litres for road transport in São Paulo in 2019, this gives a congestion component in the optimal fuel tax for diesel equal to US$0.240 per litre.
4.4.3. Congestion impacts for São Paulo relative to other urban areas in Brazil
How representative is São Paulo in terms of the overall congestion on Brazilian roads? To evaluate this, we first need to assess the share of total driving that takes place in urban areas.
We next evaluate how representative São Paulo is for urban driving in Brazil. About 85 per cent of the Brazilian population lives in metropolitan areas. Outside of urban areas, road traffic congestion is likely much less serious, both in rural residential areas and for highways through rural areas.
We do not have data showing the amount of driving or traffic congestion in rural residential areas or on highways through rural areas. We simply assume that 15 per cent of driving on Brazilian roads is unaffected by congestion, while 85 per cent of driving is subject to the average urban congestion level.
From table 5, São Paulo has less relative congestion than Recife and Rio, and only slightly more than Salvador, Fortaleza, Belo Horizonte and Porto Alegre. This could indicate that the São Paulo data on congestion are relatively representative of the wider set of urban areas in Brazil.Footnote 32
Increases in travel time due to congestion in major Brazilian cities, %

Table 5 Long description
The table reports the average percentage increase in travel time caused by congestion across seven major Brazilian urban regions. Recife ranks highest with a 40% increase, followed by Rio de Janeiro at 36% and São Paulo at 31%. Salvador and Fortaleza are tied at 29%, with Belo Horizonte slightly lower at 28%. Porto Alegre has the smallest increase at 27%. Overall, the values range from 27% to 40%, indicating notable variation in congestion impacts between cities. These figures are averages and do not show differences by time of day, route, or season.
Source: Statista (https://www.statista.com/statistics/889551/south-america-traffic-rush-hour/).
On this basis, we assume that the average congestion cost for all of Brazil is 85 per cent of the value for São Paulo. This sets the externality values of congestion at (85 per cent of US$0.242, 0.240 and 0.158 = US$0.206, 0.204 and 0.134) per litre for gasoline, diesel and ethanol, respectively (assuming that 85 per cent of each of the fuels is consumed in urban areas).
4.5. Road maintenance cost externalities and their contribution to optimal fuel taxes
Road maintenance costs in Brazil have, on average over recent years, been about BRL8.5 billion per year. We assume that two-thirds of this cost is due to road wear by motor vehicles, almost all by heavy trucks. This is because road damage is close to a third-power function of vehicle weight (Newbery, Reference Newbery1988; Small et al., Reference Small, Winston and Evans1989). This corresponds to a road maintenance cost of about US$1.14 billion per year attributed to driving (given 5 BRL per 1 US$). All this cost can be viewed as external, since road users do not pay for it and have no incentive to minimize it.
All road maintenance costs can then be attributed to diesel consumption. Total diesel consumption by motor vehicles per year in Brazil is 56 billion litres, when adapting the figure for 2019 in table 2. This leads to a diesel tax component of US$1.14 billion/56 billion litres = US$0.020 per litre for road damage. Using a β coefficient of 2/3 for diesel, this translates into a fuel tax component of US$0.014 per litre of diesel consumed.
5. Summing up the optimal fuel tax analysis for Brazil
Table 6 sums up the main calculations from our analysis. These calculations are highly uncertain but are the best we have been able to produce given our data limitations.
Summing up the estimated components behind optimal road fuel taxes in Brazil, by elements and in total for each fuel (in US cents per litre of fuel consumption)

Table 6 Long description
The table breaks down estimated components of an optimal road fuel tax in Brazil, reported in US cents per litre of fuel consumed, for gasoline, diesel, and ethanol. Totals are highest for gasoline at 103.9, followed by diesel at 85.4 and ethanol at 58.3. For gasoline, accidents are the largest component at 43.7, with added VAT at 21.9 and congestion at 20.6 also substantial. For diesel, air pollution dominates at 26.3, while carbon emissions are 16.2 and accidents are 17.0; diesel is the only fuel with a road damage component, at 1.4. Ethanol has the lowest carbon emissions at 4.1 and no air pollution or road damage component, but still has notable accident costs at 28.6 and congestion at 13.4. Overall, gasoline’s higher total is driven mainly by accident and tax components, while diesel’s profile is shaped by air pollution; values are estimates and should be interpreted as modeled components rather than direct measurements.
Source: Author’s calculations.
The greatest uncertainty here seems to be related to the air pollution and congestion cost estimates. For congestion, a limitation is that fuel tax components have been estimated only for São Paulo.
Our assessed optimal road fuel taxes for Brazil are higher for both gasoline and diesel than those in Parry et al. (Reference Parry, Black and Vernon2021) and Black et al. (Reference Black, Liu, Parry and Vernon2023a), which were based on the CPAT tool developed by the World Bank and the IMF. The differences between those calculations and ours (which are all calculated based on original Brazilian data, differently from the CPAT data) are largely due to one single component, namely that accident externalities are much higher in our calculations. The other tax assessment components are quite similar.
In addition to gasoline and diesel tax estimates, we have produced the first estimates of an optimal fuel tax for ethanol used in road transport. The optimal tax for ethanol is substantial, but far lower than for gasoline and diesel. No air pollution component is included in our ethanol tax. Many of the other differences between the optimal taxes for gasoline and ethanol are related to energy density: a more energy-dense fuel (gasoline) lets you travel more kilometres on each litre of fuel, causing more (accident and congestion) externalities per litre of fuel consumed. There is a positive carbon tax component for ethanol, due mainly to increased land use and deforestation in Brazil when ethanol production is expanded. This component is small but highly uncertain. More investigation is needed to estimate this component precisely.
The simple sums of the individual fuel tax components (before imposing VAT) are about the same for diesel as for gasoline. The optimal gasoline tax is still substantially higher than the optimal diesel tax, since the added VAT component is much higher for gasoline. Full VAT (26.5 per cent) needs to be added to the consumer prices of gasoline and ethanol, which are final consumption goods. Most of the diesel is instead used by commercial trucks for which fuel is a productive input and for that reason not subject to VAT. We assume that all diesel consumed by heavy trucks, and three-fourths of the diesel consumed by light trucks, are VAT exempt; these components together make up about 80 per cent of the total road diesel consumption in Brazil. Diesel subject to VAT is largely used by buses, as bus rides can be viewed as the final consumption of transport services. Only 20 per cent of the diesel consumption on roads in Brazil is then considered final consumption and subject to VAT. We have assumed an average VAT rate for diesel at (26.5 × 0.2 =) 5.3 per cent.
Supplementary material
The supplementary material for this article can be found at https://doi.org/10.1017/S1355770X25100090.
Acknowledgements
The author thanks two anonymous referees for very helpful comments that have substantially improved this paper. He also thanks the following persons for helpful comments and discussions: Cornelius Fleischhaker, Marek Hanusch, Gabriela Mundaca, Heron Marcos Teixeria Rios, Daniel Navia Simon, Guilherme Vianna and Nate Vernon.
Competing interests
The author declares none.