


Introduction
Cognitive decline is a common pathophysiological process associated with aging, but the degree of cognitive deterioration varies greatly across individuals. Understanding the pathological basis of cognitive decline in general populations is essential to mitigate the increasing public health burden of disorders related to cognitive decline, including Alzheimer's disease and other types of dementia. However, the influential factors that contribute to the process of cognitive deterioration are still not fully understood. Inflammatory mechanisms have long been hypothesized to contribute to the neuropathophysiological cascade that leads to cognitive decline, which eventually leads to dementia and results in a poor quality of life and heavy economic burden for families and society (Jones, Reference Jones2001). Accumulating evidence from observational studies suggests that there is a possible link between elevated levels of peripheral inflammatory markers and cognitive impairment and dementia (Mangiafico et al. Reference Mangiafico, Sarnataro, Mangiafico and Fiore2006; Noble et al. Reference Noble, Manly, Schupf, Tang, Mayeux and Luchsinger2010). It is thought that peripheral inflammatory cytokines may access the brain through a set of humoral, neural, and cellular pathways, impacting upon neuroendocrine functioning and cognitive-relevant neurotransmitters, ultimately leading to cognitive impairment and dementia.
C-reactive protein (CRP), composed of five 23 kDa subunits, is an acute-phase inflammatory molecule that has a critical role in the human immune system and has been widely used to study various inflammatory states (Gabay & Kushner, Reference Gabay and Kushner1999; Du Clos, Reference Du Clos2000). Recently, the relationship between peripheral CRP concentration and cognitive function has been investigated by several observational studies. However, the results are inconsistent, with some reporting a modest or borderline association (Teunissen et al. Reference Teunissen, van Boxtel, Bosma, Bosmans, Delanghe, De Bruijn, Wauters, Maes, Jolles, Steinbusch and de Vente2003; Komulainen et al. Reference Komulainen, Lakka, Kivipelto, Hassinen, Penttila, Helkala, Gylling, Nissinen and Rauramaa2007; Laurin et al. Reference Laurin, David Curb, Masaki, White and Launer2009; Marioni et al. Reference Marioni, Stewart, Murray, Deary, Fowkes, Lowe, Rumley and Price2009; Noble et al. Reference Noble, Manly, Schupf, Tang, Mayeux and Luchsinger2010; Jefferson et al. Reference Jefferson, Massaro, Beiser, Seshadri, Larson, Wolf, Au and Benjamin2011; Weinstein et al. Reference Weinstein, Lutski, Goldbourt and Tanne2017), and others revealing negative results (Dik et al. Reference Dik, Jonker, Hack, Smit, Comijs and Eikelenboom2005; Jordanova et al. Reference Jordanova, Stewart, Davies, Sherwood and Prince2007; Schram et al. Reference Schram, Euser, de Craen, Witteman, Frolich, Hofman, Jolles, Breteler and Westendorp2007; Alley et al. Reference Alley, Crimmins, Karlamangla, Hu and Seeman2008). Furthermore, a large proportion of the previous studies have focused more on individual cognitive function at a specific point in time, rather than looking at cognitive changes over a long period of time (Weuve et al. Reference Weuve, Ridker, Cook, Buring and Grodstein2006; Tegeler et al. Reference Tegeler, O'Sullivan, Bucholtz, Goldeck, Pawelec, Steinhagen-Thiessen and Demuth2016). Only a few prospective studies have explored circulating CRP as a predictor of cognitive decline in the general population (Yaffe et al. Reference Yaffe, Lindquist, Penninx, Simonsick, Pahor, Kritchevsky, Launer, Kuller, Rubin and Harris2003; Jordanova et al. Reference Jordanova, Stewart, Davies, Sherwood and Prince2007; Laurin et al. Reference Laurin, David Curb, Masaki, White and Launer2009). Those studies, with either limited sample sizes or relatively short duration of follow-up, reported controversial results. The English Longitudinal Study of Ageing (ELSA), with its large community-based population and multiple phases of cognitive assessments, offers a golden opportunity to explore the association between peripheral CRP levels and the trajectory of subsequent cognitive decline. In addition to this, ELSA employed a high-sensitivity assay, which is capable of producing a more precise result than standard CRP assays when measuring baseline concentrations in normal healthy individuals (Graig et al. Reference Graig, Deverill, Pickering, Spronston and Mindell2006). Therefore, by using data from ELSA, the present study aimed to examine whether higher peripheral high-sensitivity CRP (hs-CRP) levels were associated with poorer cognitive performance cross-sectionally and faster cognitive decline over a 10-year follow-up in a large cohort of over 5000 older English adults.
Methods
Study population
This study employed data from wave 2 (June 2004–July 2005), wave 3 (May 2006–August 2007), wave 4 (May 2008–July 2009), wave 5 (June 2010–July 2012), wave 6 (May 2012–June 2013), and wave 7 (May 2014–June 2015) of the ELSA study, which is a prospective and nationally representative cohort of men and women living in England aged 50 and over (Marmot et al. Reference Marmot, Oldfield, Clemens, Blake, Phelps, Nazroo, Steptoe, Rogers, Banks and Oskala2017). A detailed description of the goals, design, and methods of the ELSA has been published elsewhere (Steptoe et al. Reference Steptoe, Breeze, Banks and Nazroo2013). The online Supplementary Fig. S1 shows a flow chart of inclusion of this study population. A total of 9432 participants attended the wave 2 survey of ELSA. Of these, 1766 individuals were excluded from this study because they did not undergo a nurse visit (clinical assessment). In addition, 1799 individuals were excluded because of missing laboratory results (n = 1767), not completing all of the cognitive tests (n = 17), or with self-reported diagnosis of dementia and/or Alzheimer's disease (n = 15) at baseline (wave 2). An additional 610 individuals were excluded because they were lost to follow-up from waves 3 to 7. The remaining 5257 participants (2369 men and 2888 women) with complete baseline data and at least one reassessment of cognitive function (waves 3–7), were included in the analyses reported here.
The ELSA study was approved by the London Multicentre Research Ethics Committee (MREC/01/2/91) and informed consent was obtained from all participants.
Cognitive assessments
The memory function of each participant was measured with immediate and delayed recall of 10 unrelated words. Both immediate and delayed recall scores ranged from 0 to 10, with higher scores indicating better memory performance. Immediate and delayed recall tests have been shown to have good construct validity and consistency (Baars et al. Reference Baars, van Boxtel, Dijkstra, Visser, van den Akker, Verhey and Jolles2009). A composite memory score was created by summing the scores of the individual memory tests. Executive function was assessed by a verbal fluency task, in which individuals were required to orally name as many animals as they could in 60 s, was administered to all participants. Due to the well-documented reliability and validity of this task, it has already been used as a solid indicator of executive function within the ELSA population (Dregan et al. Reference Dregan, Stewart and Gulliford2013). The total score for the animal-naming test was the total number of words produced, excluding repetitive words and non-animal words. Orientation with scores ranging from 0 to 4 was assessed by asking four date questions (one point each for day of month, month, year, and day). A global cognitive score was created by summing the individual scores on the memory, executive function, and orientation. Generally, higher scores indicate better cognitive function.
Laboratory assays
In wave 2, blood samples were collected and sent to the Biochemistry Department at the Royal Victoria Infirmary for laboratory analysis (Graig et al. Reference Graig, Deverill, Pickering, Spronston and Mindell2006). Circulating hs-CRP was assessed using the N latex CRP mono immunoassay on the Dade Behring Nephelometer II Analyzer and conducted in line with the quality control guidelines specified in the Health Survey of England technical report (Graig et al. Reference Graig, Deverill, Pickering, Spronston and Mindell2006). Total cholesterol (Cholesterol Oxidase assay method), high-density lipoprotein cholesterol (direct method), and triglyceride (enzymatic method) levels were measured using the Olympus 640 analyzer calibrated to the center for disease control guidelines (Graig et al. Reference Graig, Deverill, Pickering, Spronston and Mindell2006). Total glycated hemoglobin (HbA1c) was carried out by the Haematology Department using the Tosoh G7 analyzer (Graig et al. Reference Graig, Deverill, Pickering, Spronston and Mindell2006).
Covariates
Blood pressure was measured by the nurse on the right arm of each participant while they were in a sitting position, using the Omron HEM-907 (Graig et al. Reference Graig, Deverill, Pickering, Spronston and Mindell2006). Five minutes elapsed before the first reading was taken. The mean value of three consecutive blood pressure readings was used in our analyses. Hypertension was considered as a systolic blood pressure of ⩾140 mm Hg and/or a diastolic blood pressure of ⩾90 mm Hg, or if the participant was currently using anti-hypertensive drugs. Participants were split into two groups: non-smokers (never smoked or ex-smokers) and smokers (current smokers). Standing height was measured with a portable stadiometer, with participants standing in the center of the base plate looking straight ahead, and weight was measured using a portable electronic scales (Graig et al. Reference Graig, Deverill, Pickering, Spronston and Mindell2006). Body mass index was calculated with the following formula: weight (kg)/height2 (m2). Diabetes was defined as HbA1c ⩾6.5%, fasting blood glucose ⩾7.00 mmol/L, or current use of anti-diabetic therapy. Depressive symptoms were measured with the eight-item version of the Center for Epidemiologic Studies Depression Scale, a widely used self-report measure of depressive symptoms, used to identify people at risk of depression in population-based studies. As in previous studies, we used a score of ⩾4 to define cases of elevated depressive symptoms (Hamer et al. Reference Hamer, Batty and Kivimaki2012). Measures of chronic disease included lifetime self-reported physician diagnoses of coronary heart disease (angina and heart attack), stroke, chronic lung disease, and asthma.
Statistical analysis
The results are presented as percentages for categorical variables or mean ± standard deviation for continuous variables with a normal distribution. Hs-CRP and triglyceride levels are shown as medians with interquartile ranges because their distribution was highly skewed.
To allow for interpretation on a relative scale, and to account for skewed distributions, hs-CRP levels were natural log-transformed. Then, regression coefficient (β) is the expected change in cognitive scores when hs-CRP increases by 172%. The cross-sectional associations between hs-CRP (natural log-transformed) and cognitive scores at baseline were tested using multiple linear regression models. The first model only included depression symptoms. The second model additionally adjusted for baseline age and sex. The third model further adjusted for total cholesterol, high-density lipoprotein cholesterol, triglycerides, body mass index, education, marital status, current smoking, alcoholic drink, hypertension, diabetes, coronary heart disease, stroke, chronic lung disease, and asthma.
Longitudinal associations between baseline hs-CRP (natural log-transformed) and cognitive scores over time were estimated by using linear mixed models, after adjustment for baseline depressive symptoms, age, sex, total cholesterol, high-density lipoprotein cholesterol, triglycerides, body mass index, education, marital status, current smoking, alcoholic drink, hypertension, diabetes, coronary heart disease, stroke, chronic lung disease, asthma, and duration of follow-up. Linear mixed models use all available data over the follow-up, take into account the fact that repeated measures on the same participant are correlated with each other, and can handle missing data. In these models, both the intercept and the slope were fitted as random effects to account for interindividual differences at baseline and different rate of change of cognitive function over the follow-up.
We also ran longitudinal analyses using quartiles of hs-CRP with the lowest quartile as the referent. The first model included quartile, time (year since baseline), time × quartile interaction, age, and sex. The time × quartile interaction term indicated differential change by quartile from baseline to the end of study (waves 2–7). The second model additionally adjusted for baseline total cholesterol, high-density lipoprotein cholesterol, triglycerides, body mass index, education, marital status, depression symptoms, current smoking, alcoholic drink, hypertension, diabetes, coronary heart disease, stroke, chronic lung disease, asthma, and duration of follow-up.
We also did sensitivity analyses to evaluate the robustness of our main results. There were: removing 370 participants with hs-CRP >10 mg/L from the main analysis to evaluate the effect of current infection on the estimates; using a multiple imputation, chained-equations method to replace missing data for cognitive assessments during follow-up (waves 3–7), and using all available data from 5867 participants in the sensitivity analyses. Variables used to impute the missing values of cognitive scores included participants’ baseline information (age, gender, education, marital status, depressive symptoms, body mass index, current smoking, alcoholic drink, diabetes, and stroke) and baseline cognitive scores. For each longitudinal analysis, we created 20 imputed data sets and combined the results using the MIANALYZE Procedure.
Statistical analyses were performed using SAS software, version 9.4 (SAS Institute Inc., Cary, NC, USA). All analyses were two-sided, with an α value of 0.05 considered as the threshold for statistical significance.
Results
Baseline characteristics and sample size
The mean age of the 5257 participants was 65.4 ± 9.4 years, and 54.9% of the participants were women. Circulating hs-CRP levels ranged from 0.2 to 210.0 mg/L, and the distribution of hs-CRP levels in the population was positively skewed (see online Supplementary Fig. S2; median: 2.0 mg/L, interquartile range: 0.9–4.1 mg/L). As shown in Table 1, age, high-density lipoprotein cholesterol, triglycerides, body mass index, systolic blood pressure, diastolic blood pressure, global cognitive scores, memory scores, executive function scores, and the percentages of women, high education, living alone, depressive symptoms, current smoking, drinking, hypertension, and diabetes were all linearly related to hs-CRP quartiles.
Characteristics of the study participants at baseline (wave 2), according to baseline high-sensitivity C-reactive protein (hs-CRP) quartiles

The results are presented as mean ± s.d., median (quartiles 1–3), or n (%).
a Calculated by using a linear regression analysis or χ2 test for trend.
Cognitive function was assessed at baseline (wave 2) and reassessed biennially at waves 3–7. The cohort size was 5257, 5036, 4436, 4105, 3787, and 3309 at waves 2–7. The mean follow-up duration was 8.1 ± 2.8 years, and the mean number of cognitive assessment was 4.9 ± 1.5.
Baseline hs-CRP levels and cognitive scores (cross-sectional analyses)
Linear regression analyses found that natural log-transformed hs-CRP was significantly associated with baseline global cognitive scores, memory scores and executive function scores after adjustment for age and sex, but these associations lost their significance after further adjustment for total cholesterol, high-density lipoprotein cholesterol, triglycerides, body mass index, education, marital status, depression symptoms, current smoking, alcoholic drink, hypertension, and diabetes (Table 2). In both models, the association between natural log-transformed hs-CRP and orientation scores was not significant (Table 2).
Linear associations between baseline high-sensitivity C-reactive protein (hs-CRP, natural log-transformed) and cognitive scores: cross-sectional analyses using multiple linear regressions

a Model 1: adjusted for baseline depressive symptoms.
b Model 2: adjusted for baseline depressive symptoms, age, and sex.
c Model 3: further adjusted for baseline total cholesterol, high-density lipoprotein cholesterol, triglycerides, body mass index, education, marital status, current smoking, alcoholic drink, hypertension, diabetes, coronary heart disease, stroke, chronic lung disease, and asthma.
Baseline hs-CRP levels and cognitive decline (longitudinal analyses)
Table 3 shows the longitudinal associations between hs-CRP (natural log-transformed) and rate of change in cognitive scores. After multivariable adjustment, a one-unit increment in natural log-transformed hs-CRP was associated with faster declines in global cognitive scores [−0.048 points/year, 95% confidence interval (CI) −0.072 to −0.023], memory scores (−0.022 points/year, 95% CI −0.031 to −0.013), and executive function scores (−0.025 points/year, 95% CI −0.043 to −0.006), but not associated with the rate of orientation scores.
Association between baseline high-sensitivity C-reactive protein (hs-CRP, natural log-transformed) and rate of change in cognitive scores (points/year): longitudinal analyses using linear mixed models

a Adjusted for baseline depressive symptoms, age, sex, total cholesterol, high-density lipoprotein cholesterol, triglycerides, body mass index, education, marital status, current smoking, alcoholic drink, hypertension, diabetes, coronary heart disease, stroke, chronic lung disease, asthma, and duration of follow-up.
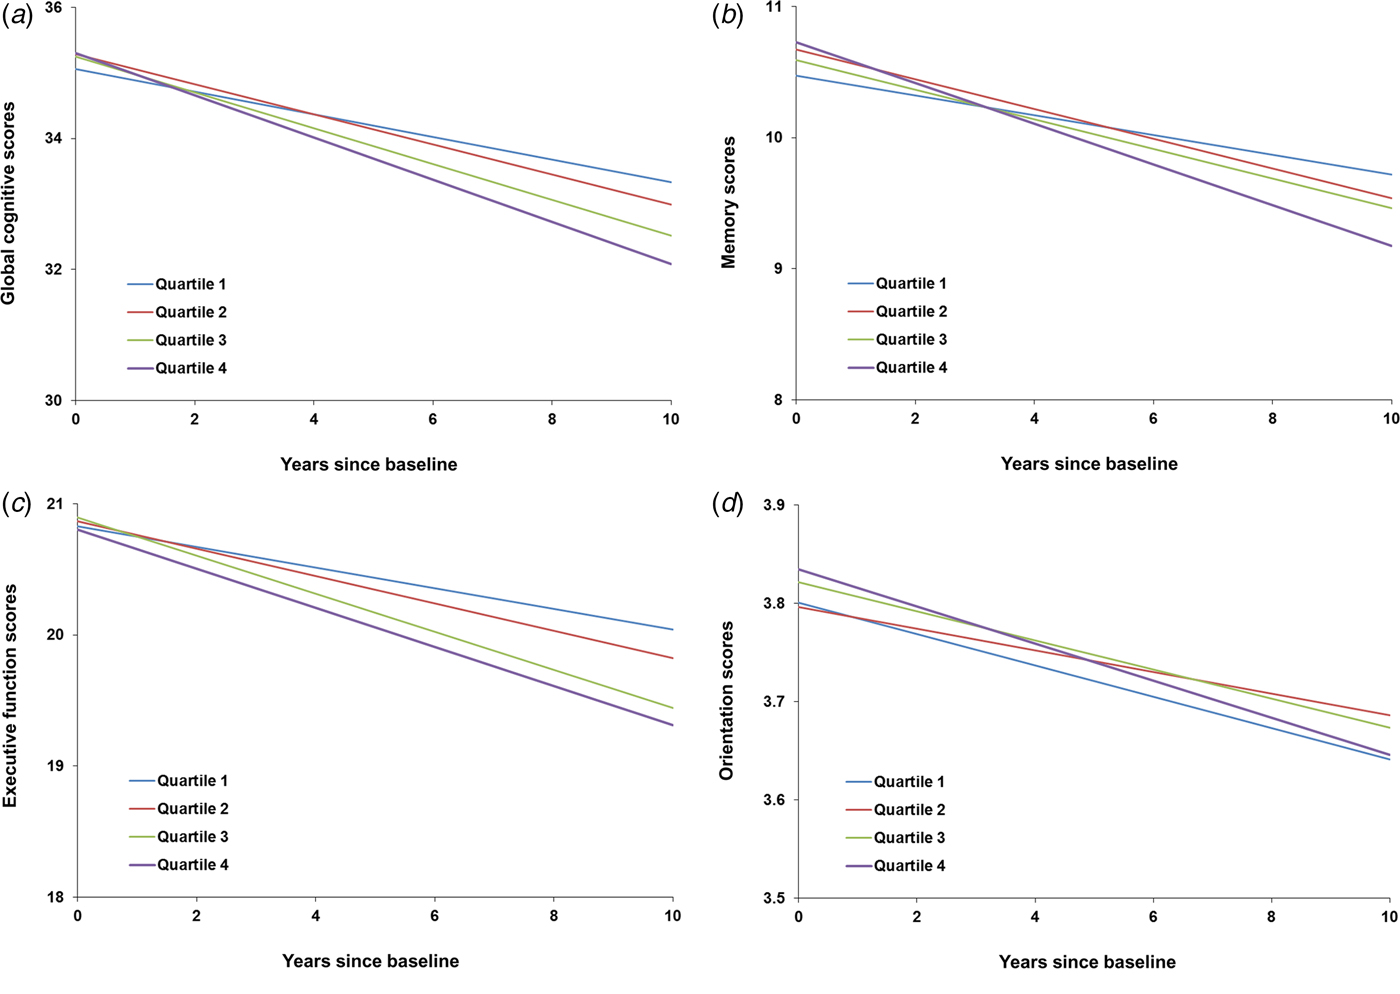
Figure 1 shows the trajectories of cognitive scores by baseline hs-CRP quartiles from waves 2 to 7 (2004–2005 to 2014–2015). Compared with the lowest quartile of hs-CRP, the multivariable-adjusted rate of global cognitive decline associated with the second, third, and highest quartiles was faster by −0.043 points/year (95% CI −0.116 to 0.029), −0.090 points/year (95% CI −0.166 to −0.015), and −0.145 (95% CI −0.221 to −0.069), respectively (p for trend <0.001, Table 4). Similarly, memory and executive function also declined faster with increasing quartiles of hs-CRP levels (Table 4). Compared with the lowest quartile of hs-CRP, the multivariable-adjusted rate of memory decline associated with the highest quartile was faster by −0.064 points/year (95% CI −0.092 to −0.036), and the same rate of executive function decline was faster by −0.070 points/year (95% CI −0.127 to −0.013). We did not find a significant association between hs-CRP quartiles and orientation decline (Table 4).
The trajectories of cognitive scores by baseline high-sensitivity C-reactive protein (hs-CRP) quartiles, adjusted for baseline depressive symptoms, age, sex, total cholesterol, high-density lipoprotein cholesterol, triglycerides, body mass index, education, marital status, current smoking, alcoholic drink, hypertension, diabetes, coronary heart disease, stroke, chronic lung disease, asthma, and duration of follow-up.
Mean difference in rate of change in cognitive scores (points/year) comparing quartiles of baseline high-sensitivity C-reactive protein (hs-CRP): longitudinal analyses using linear mixed models

a Model 1: adjusted for baseline depressive symptoms.
b Model 2: adjusted for baseline depressive symptoms, age, and sex.
c Model 3: further adjusted for baseline total cholesterol, high-density lipoprotein cholesterol, triglycerides, body mass index, education, marital status, current smoking, alcoholic drink, hypertension, diabetes, coronary heart disease, stroke, chronic lung disease, asthma, and duration of follow-up.
Non-response analyses
A total of 3565 individuals (38%) were excluded from this study due to incomplete baseline data or confirmed diagnosis of dementia and/or Alzheimer's disease. This group of excluded participants had higher percentages of women, living alone, depressive symptoms, and smoking, had lower percentages of high education and drinking, and had worse cognitive function (see online Supplementary Table S1). An additional 610 individuals (6%) excluded due to loss to follow-up also had higher levels of the major risk factors and worse cognitive function (see online Supplementary Table S2).
Sensitivity analyses
As shown in Tables S3 and S4 in the online Supplementary Material, the results were much the same (even stronger) when 370 participants with hs-CRP >10 mg/L were removed from the main analyses. Longitudinal results using imputed data (n = 5867) were similar to those from the main analyses (see online Supplementary Tables S5 and S6). Thus, the impact of current infection and missing data on our main findings was likely to be small.
Discussion
The present study showed a relationship between peripheral hs-CRP concentration and decline of cognitive function (specifically in the domains of memory and executive function) over a follow-up period of 10 years, based on data collected from the ELSA cohort. Significant differences were observed in cognitive decline, both global and domain-specific, between those in the highest compared with the lowest quartile of hs-CRP. Therefore, elevated hs-CRP level could be a useful biomarker to identify individuals who are at increased risk of developing cognitive impairment and dementia.
One of our principle findings is that the baseline hs-CRP concentration predicts poorer cognitive performance over the 10 years of follow-up in elderly adults. To the best of our knowledge, this is the largest cohort conducted in general population to investigate the association between hs-CRP level and cognitive decline over a long time period. In fact, few studies have explored this association with more than 10 years of follow-up. Komulainen et al. showed that high hs-CRP concentration predicted poorer memory at a follow-up of 12 years, in a relatively small sample of just 97 elderly women (Komulainen et al. Reference Komulainen, Lakka, Kivipelto, Hassinen, Penttila, Helkala, Gylling, Nissinen and Rauramaa2007). The Whitehall II study, with a much larger sample size, reported a significant association between CRP level and cognitive decline between phases 5 and 7 over approximately 5 years of follow-up (Gimeno et al. Reference Gimeno, Marmot and Singh-Manoux2008). Other studies, however (although with much shorter periods and fewer samples), have reported results that support an association between hs-CRP levels and cognitive decline (Teunissen et al. Reference Teunissen, van Boxtel, Bosma, Bosmans, Delanghe, De Bruijn, Wauters, Maes, Jolles, Steinbusch and de Vente2003; Marioni et al. Reference Marioni, Stewart, Murray, Deary, Fowkes, Lowe, Rumley and Price2009; Jefferson et al. Reference Jefferson, Massaro, Beiser, Seshadri, Larson, Wolf, Au and Benjamin2011). There are also some negative results with regard to the association between CRP concentration and cognitive decline. However, these studies have certain limitations: some used a relatively small sample size (Jordanova et al. Reference Jordanova, Stewart, Davies, Sherwood and Prince2007; Alley et al. Reference Alley, Crimmins, Karlamangla, Hu and Seeman2008), while others are based on changes in cognitive function over a relatively short time period (Dik et al. Reference Dik, Jonker, Hack, Smit, Comijs and Eikelenboom2005; Schram et al. Reference Schram, Euser, de Craen, Witteman, Frolich, Hofman, Jolles, Breteler and Westendorp2007), regardless of the representativeness of the study population. Furthermore, different cognitive tests have different psychometric properties like measurement sensitivity and precision to detect impairment in individual cognitive domains, which makes it difficult to compare results taken from different tasks. By consideration of three commonly used tests of global cognitive function, including the Mini-Mental State Examination (MMSE), Modified Mini-Mental State (3MS), and Clinical Dementia Rating (CDR) scale, Yang et al. conducted a meta-analysis in which they concluded that CRP had a marginal role in cognitive decline (Yang et al. Reference Yang, Fan, Pan, Xie, He, Li and Wang2015). Crucially, the previous studies that have assessed the relationship between hs-CRP and cognitive decline are very heterogeneous in terms of the study populations used (general or non-general), cognitive assessments used, length of follow-up periods, outcome measurements, and reporting of results, all of which could be responsible for the controversial results of the association between hs-CRP and cognitive decline. In the present study, based on the cognitive deterioration of the ELSA cohort over a 10-year follow-up, we are confident to conclude a correlation of peripheral hs-CRP concentration with long-term cognitive change in general population.
Another important finding is that significantly steeper cognitive decline was observed in participants in the highest quartile of hs-CRP, but not in participants in the second and the third quartiles, compared with those in the lowest quartile, along with a significant trend of increasing cognitive decline across quartiles. Similar patterns have been observed previously, although with varied definitions of CRP categories (Yaffe et al. Reference Yaffe, Lindquist, Penninx, Simonsick, Pahor, Kritchevsky, Launer, Kuller, Rubin and Harris2003; Tilvis et al. Reference Tilvis, Kahonen-Vare, Jolkkonen, Valvanne, Pitkala and Strandberg2004; Laurin et al. Reference Laurin, David Curb, Masaki, White and Launer2009). Taken together, these findings suggest that hs-CRP could have an elevated impact on cognitive decline as its peripheral concentration increases. It is reasonable to assume that interventions to ameliorate cognitive decline or inflammatory processes would be more effective when applied during an early stage, or even years before the onset of cognitive decline. This is compatible with initial results from the Alzheimer's Disease Anti-Inflammatory Prevention Trial, in which non-steroidal anti-inflammatory drugs did not improve cognitive function in older adults (Group et al. Reference Group, Martin, Szekely, Brandt, Piantadosi, Breitner, Craft, Evans, Green and Mullan2008). However, a recent re-analysis of these results suggested that these anti-inflammatory drugs did in fact show a beneficial effect for a subgroup of patients in the early, asymptomatic phases of dementia (Breitner et al. Reference Breitner, Baker, Montine, Meinert, Lyketsos, Ashe, Brandt, Craft, Evans, Green, Ismail, Martin, Mullan, Sabbagh and Tariot2011).
Notably, after adjusting for potential confounders, compared with individuals in the lowest quartile of hs-CRP, individuals in the highest quartile had 106% more memory errors over time, and 89% worse executive functions over time. However, no significant deteriorations on orientation were found. This may suggest that cognitive decline related to high peripheral hs-CRP levels could be more specific to dysfunction of brain regions or subcortical pathways involved in memory and executive function. Another possible explanation is the orientation test, consisting of only four questions and a score ranging from 0 to 4, is insensitive to small cognitive decline induced by high hs-CRP. Another intriguing finding is that, although a longitudinal association was observed, no baseline correlation was shown. The negative result was consistent with previous studies reporting no cross-sectional association between CRP and cognitive function (Dik et al. Reference Dik, Jonker, Hack, Smit, Comijs and Eikelenboom2005; Alley et al. Reference Alley, Crimmins, Karlamangla, Hu and Seeman2008). Unlike longitudinal association, which was determined by repeated measures of cognitive function and reflected cognitive deterioration over a period, baseline correlation relies on the status of cognitive function at one time point, which could be easily affected by factors other than hs-CRP. Therefore, this interesting finding may imply that the high hs-CRP is likely to be a risk factor of subsequent cognitive decline rather than a manifestation of cognitive deterioration. As no causal relationship could be inferred from observational studies like the present one, further studies are warranted to determine the causal relationship.
Several underlying mechanisms have been proposed for the involvement of CRP in the process that leads to cognitive impairment and eventually dementia. As an acute-phase reactant produced by the liver, CRP is well-accepted as an indicator of systemic inflammation (Gabay & Kushner, Reference Gabay and Kushner1999). Taking this into consideration, the biological mechanism linking hs-CRP to cognitive decline could be explained, at least in part, by the inflammatory process known to affect the central nervous system integrity. Accumulating evidence suggests that CRP, rather than just acting as an inflammatory marker, is an active element, negatively affecting vasculature, including disturbances to endothelial cell regulation, alterations in vascular smooth muscle and monocyte/macrophage function, changes in matrix biology, and promotion of coagulation, in addition to its direct neurotoxicity (Kuo et al. Reference Kuo, Yen, Chang, Kuo, Chen and Sorond2005). Indeed, a large number of immunohistochemical studies have repeatedly shown widespread immunoreactivity to CRP in the brains of patients with Alzheimer's disease (Duong et al. Reference Duong, Nikolaeva and Acton1997, Reference Duong, Acton and Johnson1998). Moreover, evidence from neuroimaging studies of individuals without dementia suggests that structural brain changes, including alterations in total brain volume, gray matter and hippocampal volume, and white matter and microstructural integrity, are also associated with CRP concentration (Jefferson et al. Reference Jefferson, Massaro, Wolf, Seshadri, Au, Vasan, Larson, Meigs, Keaney, Lipinska, Kathiresan, Benjamin and DeCarli2007; Satizabal et al. Reference Satizabal, Zhu, Mazoyer, Dufouil and Tzourio2012). This is consistent with the diverse neuropsychological associations observed in the current study and prior studies given that the specific cognitive functions observed that are related to CRP concentration are subserved by multiple, distinct neuroanatomical structures.
A major strength of the present study is that this is the largest general population-based study exploring the relationship between hs-CRP and cognition over a long-term follow-up of 10 years. Another strong point is that we have repeated measured cognitive function over a long period of time, which is a more robust measurement of cognitive deterioration, rather than predicting cognitive decline from a specific time point. This rich study design enabled us to use an advanced method to better capture the cumulative burden and chronicity of estimates of long-term trajectories of cognitive decline. Nevertheless, the present findings should be considered in the context of some potential limitations. The most important limitation is inherent to all observational studies: to what extent are we able to infer any causal relationships between hs-CRP concentration and cognitive decline? It has been argued that even longitudinal designs cannot completely assuage this criticism. However, our findings specifically show that high hs-CRP levels were not independently related to poorer cognitive function at baseline, but to a greater longitudinal cognitive decline, thus implying that poor cognition is a corollary of high hs-CRP levels, but not vice versa. A further limitation is that, as in many other studies, our present findings are based on a baseline measure of hs-CRP. Although hs-CRP levels are prone to large fluctuations in the presence of acute inflammatory conditions, the average level may change little over time (Macy et al. Reference Macy, Hayes and Tracy1997). Nevertheless, interpretation of the present results should be made with caution. Thirdly, in the present study we used just one inflammatory marker. It remains unclear as to whether there are more relevant inflammatory markers in relation to cognitive function. Moreover, only 56% of participants who attended the wave 2 survey were eligible for this study, which may lead to selection bias. Non-response analyses show that this study's population were healthier than the original ELSA population, which is a threat to the internal validity of estimates and may limit generalization to English population. Besides, it is worth noting that, although we have excluded individuals with self-reported diagnosis of dementia and/or Alzheimer's disease at baseline, those with mild cognitive impairment and are likely to display faster cognitive decline have been included. Finally, although we adjusted for a number of potential confounders, the possibility of residual confounding cannot be ruled out.
In conclusion, the present study demonstrated a significant association between peripheral hs-CRP concentration and long-term cognitive decline. Our data suggest that hs-CRP might serve as a biomarker for cognitive decline, and even as the basis for early intervention to prevent further cognitive deterioration. Future studies are required to confirm the causality of the association.
Supplementary material
The supplementary material for this article can be found at https://doi.org/10.1017/S0033291717003130.
Acknowledgements
The authors thank the original data creators, depositors, copyright holders, the funders of the Data Collections, and the UK Data Archive for the use of data from English Longitudinal Study of Ageing: waves 0–7, 1998–2015. The original data creators, depositors, or copyright holders bear no responsibility for the current analysis or interpretation.
Contributors
WX obtained access to the data of English Longitudinal Study of Ageing from the UK Data Service. FZ and WX conceived and designed the study. WX performed the statistical analysis. FZ drafted the manuscript. All authors contributed to the data interpretation, manuscript writing, and final approval of the manuscript.
Funding
This study was funded by the National Natural Science Foundation of China (project no. 81601176) and the Newton International Fellowship from the Academy of Medical Sciences (project no. P56804). The funders had no role in the study design, data collection, analysis, decision to publish or preparation of the manuscript.
Declaration of interests
None.



