


INTRODUCTION
Classic research on children's acquisition of phonology has advocated for “the primacy of lexical items in phonological development” (Ferguson & Farwell, Reference Ferguson and Farwell1975, p. 437). In this context and as used herein, phonology refers to the phones, phonemes, phonotactics, and rules of the sound system of the input language as realized in production. The early thought was that children's mastery of the sound system followed from their acquisition of words. Recently, this view has received renewed attention due, in part, to insights about the developing mental lexicon and its organization into neighborhoods. A neighborhood consists of words that differ by 1-phoneme substitutions, deletions, or additions, e.g., rat has neighbors cat, wrap, wrote, at, drat, among others (Luce, Reference Luce1986). Neighborhoods are described as dense when comprised of many words that overlap in phonological form and as sparse when comprised of few words that overlap in phonological form. Empirically, the distinction between dense and sparse neighborhoods has been shown to differentially affect phonological acquisition by children with typical (e.g., Stoel-Gammon, Reference Stoel-Gammon2011) and delayed (e.g., Gierut & Morrisette, Reference Gierut and Morrisette2012b) development. In this paper, we add to this line of investigation by exploring hypotheses about the mechanism of learning behind the observed neighborhood effects specifically for children with phonological delay (PD).
By way of background, we begin with a review of neighborhood effects in typical development and consider two hypotheses advanced in the literature to account for the data: one appeals to long-term auditory word priming, and the other to phonological working memory. We then summarize the findings of Demke, Graham, and Siakaluk (Reference Demke, Graham and Siakaluk2002) as a specific test of these proposals. The relevance of that research for children with PD is outlined as motivation for the present studies.
Typical phonological development
Stoel-Gammon (Reference Stoel-Gammon2011) published an exhaustive review with commentary on the relationship between phonological acquisition and the lexicon. A key observation to emerge was that children's mastery of phonology is aided by dense neighborhood structure: similar sounding words in the lexicon are aligned with better phonological skills. To illustrate, Sosa and Stoel-Gammon (Reference Sosa and Stoel-Gammon2012) reported that toddlers produce sounds with greater accuracy and less variability when these occur in words from dense (as opposed to sparse) neighborhoods. Comparable effects have been reported for nonwords: toddlers and preschoolers imitate sounds with greater accuracy when nonwords resemble real words from dense neighborhoods (Beckman & Edwards, Reference Beckman, Edwards, Broe and Pierrehumbert2000; Zamuner, Gerken & Hammond, Reference Zamuner, Gerken and Hammond2004). Dense neighborhoods not only facilitate production accuracy, but, presumably, they are the basis from which children extract generalizations about the inherent phonological structure of a language (Pierrehumbert, Reference Pierrehumbert2001). Dense neighborhoods support the broad extension, transfer, and representation of sound patterns across lexical items and contexts (Beckman, Munson & Edwards, Reference Beckman, Munson, Edwards, Cole and Hualde2007; Edwards, Beckman & Munson, Reference Edwards, Beckman and Munson2004). Evidence for the dense neighborhood advantage appears to be robust, with convergence of descriptive phonetic (Sosa & Stoel-Gammon, Reference Sosa and Stoel-Gammon2012), acoustic phonetic (Munson, Reference Munson2001), computational (Storkel Reference Storkel2004a), experimental (Storkel, Reference Storkel2002), metalinguistic (De Cara & Goswami, Reference De Cara and Goswami2003), and cross-linguistic (Stokes, Bleses, Basbøll, & Laberstein, Reference Stokes, Bleses, Basbøll and Lambersten2012) studies.
In account of the observed effects, Stoel-Gammon (Reference Stoel-Gammon2011), like others (Walley, Reference Walley1993), suggested that dense neighborhoods trigger the emergence of segmental structure and phonemic contrast in words that start out as holistic or fuzzy in phonological make-up. Because dense neighborhoods consist of many words that overlap in phonological form, this forces a child to build finer-grained phonological representations as reflected behaviorally in their accurate production of new sounds and new contrasts. Notice that this account describes the kinds of phonological gains to result from dense neighborhoods, i.e., new phonemic distinctions; yet it does not also describe how those changes take place. Namely, what is the learning mechanism responsible for enriched phonological structure that arises from dense neighborhoods?
Two complementary hypotheses
Church and Fisher (Reference Church and Fisher1998) proposed that a child's routine exposure to words of the input acts like a naturalistic case of long-term auditory word priming, which is defined as the presentation of experimental stimuli similar to a set of test stimuli for the purpose of facilitating a behavioral response (Zwitserlood, Reference Zwitserlood, Grosjean and Frauenfelder1997). Motivation for their proposal came from the observation that priming affords a child many of the same opportunities that are needed in the construction of phonological representations. Priming bolsters the mapping of sound patterns of words, provides input (contextual) variability, emphasizes similarity of phonological form, and facilitates the differentiation of phonological form among neighbors. The hunch was that priming serves a threefold purpose: it helps a child encode new words, builds the representation of the sound patterns of those words, and serves as the “link between repeated perception and production of particular sound patterns and subsequent processing of identical or similar items” (Church & Fisher, Reference Church and Fisher1998, p. 538). In a series of studies, Church and Fisher (Reference Church and Fisher1998) demonstrated that children as young as age two more accurately identified words that were primed compared to words that were not. The effects were independent of word meaning, attributed instead to the internal representation of sound patterns. Overall, their results were consistent with the general developmental view that priming creates a precise “linguistic experience contributing to learning, changing (strengthening, expanding) linguistic representations” (Savage, Lieven, Theakston & Tomasello, Reference Savage, Lieven, Theakston and Tomasello2006, p. 29).
Demke and colleagues (2002; also Merriman & Marazita, Reference Merriman and Marazita1995) carried the hypothesis a step further by employing auditory word priming as a tool for lexical learning. They reported two studies, which are detailed herein as the springboard for the present research. In one study, preschoolers were exposed to dense forms prior to training novel lexical items. This was the pre-exposure condition characteristic of priming. In a second study, preschoolers were exposed to dense forms after training novel items. This was the post-exposure condition because, extending Church and Fisher's (Reference Church and Fisher1998) reasoning, similar-sounding words in the input can occur before or after a child's exposure to novel items.
Within each study, Demke et al. (2002) manipulated the kind of dense forms that were presented. In one manipulation, dense forms were neighbors of the novel items to be learned in that they shared the same rhyme; e.g., plane, rain, train were affiliated with the novel item tane. In a second manipulation, dense forms were phonologically unrelated to the novel items in that there was no rhyme overlap; hence, they were non-neighbors. Thus, neighbor status (neighbor vs. non-neighbor) and timing of exposure (before vs. after training) were the independent variables.
The instructional protocol developed by Demke et al. (Reference Demke, Graham and Siakaluk2002) consisted of series of story vignettes, with one story for each novel item that was trained. Stories provided a child with multiple exposures to neighbors or non-neighbors depending on experimental assignment. These were visually depicted, and a child viewed the pictures while hearing the stories live voice. In training, the examiner labeled visual referents corresponding to the novel items and a child was to imitate. Then, in a delayed test phase, a child recalled the novel items as the dependent variable.
Demke et al. (Reference Demke, Graham and Siakaluk2002) found no difference in recall of novel items when children were exposed to neighbors versus non-neighbors in the pre-exposure condition; this was at odds with the predicted effect of priming. By comparison, there was greater recall of novel items in the post-exposure condition, but only when neighbors were presented. In account of the results, Demke et al. (Reference Demke, Graham and Siakaluk2002) appealed to Baddeley's model of working memory (Baddeley, Gathercole & Papagno, Reference Baddeley, Gathercole and Papagno1998), with attention to the phonological loop. According to the model, the phonological loop is a module of working memory specific to the encoding, maintenance, and use of auditory linguistic information. The phonological loop is conceived as a temporary buffer for novel words as representations are assembled for eventual storage in long-term memory. To achieve this, the phonological loop must be continually refreshed because the details of novel words decay rapidly when held in the phonological loop. Extending these premises of Baddeley's model, Demke et al. (Reference Demke, Graham and Siakaluk2002) reasoned that post-exposure to neighbors helped a child retain novel items in the phonological loop. During post-exposure, phonological representations of neighbors were activated in the mental lexicon. Because neighbors were familiar words known by children, their representations were already entrenched in long-term memory. This thereby established a link between novel newly trained items, which were temporarily held in the phonological loop, and neighbors, which were represented and stored in long-term memory. Demke et al. (Reference Demke, Graham and Siakaluk2002) advanced that post-exposure to neighbors refreshed the phonological loop in this way. They further advanced that post-exposure to neighbors was “used to ‘fill in’ the representation of the novel words in the phonological loop, leading to enhanced recall” (p. 389). By their account, phonological working memory was introduced as an alternative to auditory word priming as the mechanism behind the dense neighborhood advantage in typical development. Thus, two complementary hypotheses emerged. In the present studies, we aimed to evaluate these by replication and extension to children with PD.
Phonological delay
Children with PD present a unique opportunity to assess the impact of dense neighborhoods given their symptomology, etiology, need for treatment, and asymmetries in learning. To begin, the defining characteristic of PD is a severely reduced consonantal inventory relative to age-matched peers. Children with PD who are acquiring English tend to produce nasals, stops, and glides to the exclusion of other sounds. Sounds that are excluded from the repertoire are described linguistically as phonotactic constraints (Dinnsen, Reference Dinnsen, Elbert, Dinnsen and Weismer1984), which restrict the occurrence, distribution, and use of sounds at phonemic and phonetic levels. The result is homonymy and a collapse of phonemic distinctiveness among words, rendering unintelligible speech.
Beyond this primary deficit, some subsets of children with PD present with co-occurring deficits. The risks do not apply uniformly within or across children, but two are worth mentioning in light of the hypotheses under consideration. Shriberg and Kwiatkowski (Reference Shriberg and Kwiatkowski1994) found that some children with PD have reduced vocabularies, suggesting a link between phonological and lexical learning. Shriberg, Lohmeier, Campbell, Dollaghan, Green, and Moore (Reference Shriberg, Lohmeier, Campbell, Dollaghan, Green and Moore2009) also found that some with PD perform poorly on nonword repetition tasks, suggesting a link between phonological learning and phonological working memory.
While there is no known cause of PD, a recurring view is that the problem lies in the way children represent the phonological properties of words (Dinnsen, Reference Dinnsen, Elbert, Dinnsen and Weismer1984; Macken, Reference Macken1980; Stoel-Gammon, Reference Stoel-Gammon2011). This follows from linguistic accounts of typical and atypical development, which claim that acquisition of the sound system requires change (Dinnsen, Reference Dinnsen, Elbert, Dinnsen and Weismer1984), elaboration (Rice & Avery, Reference Rice, Avery and Archibald1995), and/or reorganization (Gnanadesikan, Reference Gnanadesikan, Stringfellow, Cahana-Amitay, Hughes and Zukowski1996) of the phonological structure of lexical representations. For children with PD, modifications in phonological structure require explicit treatment. Treatment conventionally targets new phonemic distinctions and is typically administered as a single-subject experiment (Baker & McLeod, Reference Baker and McLeod2011). Sounds excluded from the inventory are trained in production as the independent variable and generalization to treated and untreated (erred) sounds is measured as the dependent variable. The ultimate goal is to induce the broadest system-wide change in the phonologies of these children, thereby optimizing treatment efficacy.
To date, three studies have evaluated dense neighborhoods in the treatment of children with PD, yielding mixed results. Two studies found little to no system-wide generalization when sounds were treated in words from dense neighborhoods (Gierut, Morrisette & Champion, Reference Gierut, Morrisette and Champion1999; Morrisette & Gierut, Reference Morrisette and Gierut2002). By comparison, a third study showed the expected dense neighborhood advantage (Gierut & Morrisette, Reference Gierut and Morrisette2012b). When sounds were taught in dense words with convergent cues (i.e., dense words that were also frequent early acquired items), children evidenced the greatest system-wide generalization. In the face of asymmetric results, it is noteworthy that the former studies manipulated density as the sole independent variable, whereas the latter covaried density with other properties of word structure (e.g., frequency, age of word acquisition). It is worthy of further mention that studies of adults and children with typical development (Garlock, Walley & Metsala, Reference Garlock, Walley and Metsala2001; Krull, Choi, Kirk, Prusick & French, Reference Krull, Choi, Kirk, Prusick and French2010; Metsala, Reference Metsala1997) have likewise reported mixed effects when density is manipulated singly versus additively. The literature has appealed to competition models (e.g., MacWhinney, Reference MacWhinney and MacWhinney1987) in account of these observed asymmetries. Competition models claim that a given property of word structure may wax and wane because of cue convergence, collision, or weightings under different scenarios. This account notwithstanding, it remains that the conditions under which dense neighborhoods facilitate (or inhibit) phonological generalization in treatment of PD are not yet fully established or well understood, thus warranting further study.
The purpose was to replicate and extend Demke et al. (Reference Demke, Graham and Siakaluk2002) by documenting the effects of dense neighborhoods on phonological generalization by children with PD enrolled in treatment. In Study 1, children were exposed to words from dense neighborhoods prior to training sound production, whereas in Study 2, exposure followed training sound production. Dense words presented before or after training were either neighbors or non-neighbors of the words that were taught. Following Stoel-Gammon (Reference Stoel-Gammon2011), one prediction was that neighbors would induce greater system-wide generalization than non-neighbors. Following Church and Fisher (Reference Church and Fisher1998), another prediction was that exposure to neighbors prior to production training would result in greater generalization, thereby supporting long-term auditory word priming as a mechanism that drives phonological learning. Following Demke et al. (Reference Demke, Graham and Siakaluk2002), an alternate prediction was that exposure to neighbors following production training would lead to greater generalization, thereby supporting phonological working memory as responsible for the dense neighborhood advantage.
STUDY 1
METHOD
Participants and their phonologies
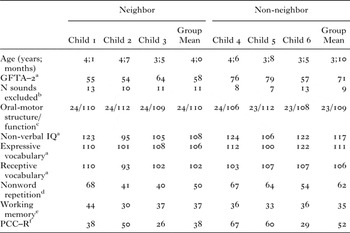
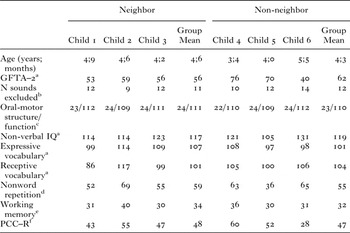
Six preschool children with PD (M = 3;11; range: 3;5–4;7) were recruited by public announcement. To participate, a child scored 1 standard deviation below the normative mean on the Goldman-Fristoe Test of Articulation–2 (Goldman & Fristoe, Reference Goldman and Fristoe2000) and produced at least six sounds in error on this measure across phonetic contexts. Inclusionary criteria required performance within typical limits on diagnostic tests of hearing acuity, oral-motor structure/function, non-verbal intelligence, expressive/receptive vocabulary, nonword repetition, and working memory. Inclusionary criteria further required that children be preliterate, monolingual speakers of English. Children enrolled in concurrent speech and/or language services were excluded from participation. Table 1 reports the diagnostic profiles of individual participants, along with the mean performance by experimental group.
Diagnostic profiles of children enrolled in Study 1, with mean performance by experimental group

notes: Perceptual discrimination of pre-exposure and treated stimuli was not tested. This would have introduced a confound because a child would have been exposed to the relevant stimuli prior to the experimental manipulation.
a Standard scores on the Goldman-Fristoe Test of Articulation–2 (Goldman & Fristoe, Reference Goldman and Fristoe2000), Leiter International Performance Scale-Revised (Roid & Miller, Reference Roid and Miller1997), Expressive Vocabulary Test (Williams, Reference Williams1997), and Peabody Picture Vocabulary Test, 3rd ed. (Dunn & Dunn, Reference Dunn and Dunn1997).
b Sounds excluded from the phonemic inventories of all children of Study 1 were /θ ð ʃ tʃ dʒ r/. Additionally, /ŋ k ɡ f v s z l/ were excluded within and across children's inventories.
c Oral-motor structure/function scores (Robbins & Klee, Reference Robbins and Klee1987).
d Total percent accuracy on nonword repetition task (Dollaghan & Campbell, Reference Dollaghan and Campbell1998; Gathercole & Adams, Reference Gathercole and Adams1993).
e Scaled scores on the Auditory Sequential Memory subtest of the Illinois Test of Psycholinguistic Abilities–Revised (Kirk, McCarthy & Kirk, Reference Kirk, McCarthy and Kirk1968) are interpreted relative to a M = 36 (SD = 6).
f Percentage of Consonants Correct–Revised (Shriberg et al., Reference Shriberg, Austin, Lewis, McSweeny and Wilson1997).
Children who met these criteria contributed a detailed speech sample. An established probe consisting of 293 words (Gierut, Reference Gierut, Dinnsen and Gierut2008b, pp. 44–48) was used to elicit production of all English consonants in all relevant word positions in multiple exemplars. Each consonant was sampled in approximately 17 unique words: 5 eliciting initial position, 7 intervocalic position, and 5 final position depending on the phonotactics of English. The probe also provided for elicitation of minimal pairs as evidence of the contrastive (i.e., phonemic) status of sounds in a child's inventory. The probe was administered using a spontaneous picture-naming task and a child's responses were digitally recorded. A trained listener, blind to the experiment, phonetically transcribed the data and reliability was established as reported below.
Probe data were used to identify the inventory of sounds that a child used phonemically, along with corresponding exclusions. Sounds excluded from the inventory were of particular interest because these were manipulated in treatment and measured as evidence of phonological generalization. Established criteria were applied to identify sounds excluded from the inventory (Gierut & O'Connor, Reference Gierut and O'Connor2002). Specifically, sounds excluded were produced with near 0% accuracy of probe production and were never used phonemically to mark meaning distinctions in minimal pairs.
Experimental design and variables
A staggered multiple-baseline (MBL) across-subjects design was used. The MBL consists of a baseline phase followed by treatment, with the number of baselines increased by 1 as successive children enroll. Baseline performance is expected to remain stable (≤10% accuracy) until the instatement of treatment, thereby establishing cause–effect relationships between instruction and performance.
As applied herein, the baseline was obtained through repeated administrations of the probe. Following baseline, treatment was instated, with children pseudo-randomly assigned to one of two experimental conditions: pre-exposure to dense neighbors versus non-neighbors of the words that were trained in production. Thus, the independent variable was priming neighbors versus non-neighbors.
Children were assigned to an experimental condition in the order they enrolled: a first child was assigned to the pre-exposure neighbor condition, a second to the non-neighbor condition, a third to the neighbor condition, and so on. Assignments were pseudo-random in that treatment was specific to a sound excluded from a given child's phonemic inventory.
The dependent variable was system-wide phonological generalization. Generalization was operationalized as the percent gain in accuracy of production of sounds excluded from the phonemic inventory relative to baseline performance on the probe. On average, ten sounds were excluded from children's inventories (Table 1); these were monitored for generalization. Every sound, treated and untreated, that evidenced positive gain over baseline was factored into the evaluation of generalization.
Generalization was measured longitudinally using the aforementioned 293-word probe. The probe was used exclusively as a test measure. Words of the probe were never taught or introduced in treatment. While the probe tests production of all English consonants, only sounds excluded from the phonemic inventory were monitored for generalization; hence, only relevant probe words were examined. There were approximately 170 probe words evaluated for generalization at each longitudinal point in time for each child (i.e., 10 sounds monitored × 17 probe words per sound).
Probes were administered on a variable schedule of two sessions starting at baseline and continuing to the completion of treatment. A variable schedule is a classic way to reduce the predictability of an event because that event is scheduled around an arithmetic average (Hilgard & Bower, Reference Hilgard and Bower1975). Consequently, a participant's response to the event more closely resembles performance in the natural environment. A variable schedule of probe administration was used herein to best approximate a child's typical productions. Fifteen probe samples were obtained on average for each child over the duration of treatment. These data established generalization as causal to the delivery of treatment. Additional probe samples were collected 2 and 8 weeks after treatment was withdrawn. These data were strictly for descriptive purposes in documenting continued longitudinal gains. Throughout, the procedures outlined above for elicitation, blinded transcription, and reliability of probe data were followed.
Stimuli
Two sets of stimuli were developed: one exclusive to pre-exposure priming and another to training sound production. Words taught in production are described first because their form dictated which words could serve as primes.
Stimuli used in training sound production. Six words were used to teach production of a target sound; ‘Appendix A’ lists the treated words for /s/. The words taught in production met three criteria: (i) they were from dense neighborhoods comprised of ten or more neighbors (Luce, Reference Luce1986); (ii) to the extent possible, they were three segments in length (CVC); and (iii) the treated sound assumed the initial position of the treated words.
Beyond that, there was a general effort to choose words familiar to children based on age-of-word-acquisition norms (Bird, Franklin & Howard, Reference Bird, Franklin and Howard2001; Gilhooly & Logie, Reference Gilhooly and Logie1980). There were further efforts to equate the words based on log frequency (retrieved from <http://neighborhoodsearch.wustl.edu>) and phonotactic probability (retrieved from <http://www.people.ku.edu/~mvitevit/PhonoProbHome.html>). Characteristics of the treated words taught in production are reported in Table 2.
Characteristics of the stimuli used in production training and in exposure to neighbors versus non-neighbors

notes: a Age-of-word-acquisition ratings on a 7-point scale (Bird et al., Reference Bird, Franklin and Howard2001; Gilhooly & Logie, Reference Gilhooly and Logie1980).
b Sum of segment frequency and sum of biphone frequency values represent z-score transformations to control for word length (Storkel, Reference Storkel2004b).
Stimuli used in pre-exposure priming. Consistent with the independent variable, neighbors versus non-neighbors of the treated words were identified. There were forty-eight words of each type, with examples shown in ‘Appendix A’. Following definitions used by Demke et al. (Reference Demke, Graham and Siakaluk2002), neighbors had the same rhyme structure as corresponding treated words, whereas non-neighbors were phonologically unrelated to treated words.
Neighbors met all of the same criteria outlined above with one exception. They too were dense forms, three segments in length to the extent possible, generally familiar to children, and balanced in log frequency and phonotactic probability (Table 2); however, neighbors had unique onsets relative to the corresponding words taught in production. Of note, there was no significant difference between neighbors and words taught in production based on age-of-word-acquisition (t(98) = 0·43, p = ·67), log frequency (t(160) = 1·12, p = ·26), sum of segment frequency (t(160) = 1·87, p = ·060), or sum of biphone frequency (t(160) = 0·54, p = ·59). Thus, neighbors used in pre-exposure priming were on par with the words taught in production.
Non-neighbors met the same criteria, but were phonologically unrelated to corresponding words taught in production. As in Table 2, density, length, familiarity, log frequency, and phonotactic probability were considered in selection. There was again no significant difference between non-neighbors and words taught in production based on age-of-word-acquisition (t(98) = 1·13, p = ·26), log frequency (t(160) = –0·16, p = ·88), sum of segment frequency (t(160) = 1·28, p = ·20), or sum of biphone frequency (t(160) = –0·32, p = ·75). Non-neighbors were thus on par with words taught in production.
For completeness, there was no statistical difference between neighbors and non-neighbors based on age-of-word-acquisition (F(5,170) = 1·12, p = ·32), log frequency (F(5,282) = 2·05, p = ·07), sum of segment frequency (F(5,282) = 0·60, p = ·70), or sum of biphone frequency (F(5,282) = 1·93, p = ·09). The stimuli used in pre-exposure priming were comparable across experimental conditions.
Materials
Two sets of materials were developed: one exclusive to pre-exposure priming and another to training sound production. Materials were kept distinct in the experimental sessions.
Materials used in pre-exposure priming. Following Demke et al. (Reference Demke, Graham and Siakaluk2002), neighbors versus non-neighbors were embedded in stories, as in ‘Appendix A’. There were six stories to prime each of the six treated words. Stories averaged thirty-four words in length. A female talker recorded each story in a speaking style typical of reading to young children. Stories averaged 13·2 s in duration with a 2·1 s ISI between stories. Visual renditions of the stories were created by Sharp Designs & Illustration Inc. (previously Sharp Designs), measuring 7·5 × 10 inches. These were assembled into a PowerPoint slide show and synced with the audio files for random presentation with automatic advancement during the pre-exposure phase of the treatment protocol.
Materials used in training sound production. Pictures were used to elicit children's responses during production training. There was one picture for each treated word. Pictures were retrieved from Google images and arranged in PowerPoint for random and repeated presentation during the production phase of the treatment protocol.
Treatment protocol
Treatment sessions were 1-hour in duration conducted three times weekly. Each session consisted of two sequentially ordered phases: pre-exposure to neighbors (or non-neighbors) followed by training sound production. The treatment protocol was administered by the second author, who is a PhD-level certified speech-language pathologist with 17 years of clinical research experience. Procedures are described below and in ‘Appendix B’.
Pre-exposure phase. A child was seated at a small table in a quiet room of an experimental suite. A desktop computer with 17-inch display and two desktop speakers were on the table. At the start of each treatment session, a child watched the PowerPoint slide show of either the neighbor or non-neighbor stories, depending on experimental assignment. First, a child was instructed to listen to, and watch, the stories; no verbal, physical, or other response was required. Then, the experimenter initiated the PowerPoint slide show. Each of the six pre-exposure stories was presented, with automatic advancement as stated above. Order of the stories was randomized across sessions, also stated above. When the slide show was over, this ended the pre-exposure phase of the session and training sound production immediately commenced.
Production training phase. Each child was taught one sound excluded from, and specific to, his/her phonemic inventory. Sounds that were taught were restricted to the late-8 consonants /s/, /l/, or /r/ (Shriberg, Kwiatkowski & Gruber, Reference Shriberg, Kwiatkowski and Gruber1994). These sounds are commonly in error in typical and delayed populations, thereby affording generalizability of results. Sounds were also restricted for practical reasons. Carefully matched experimental stimuli and professional illustrations had to be prepared well in advance of identifying participants. The decision to teach /s/, /l/, or /r/ increased the likelihood that the prepared stimuli would indeed be relevant to the delayed phonologies of eligible children. Within each experimental condition, one child was taught /s/, one /l/, and one /r/. Treating different sounds within and across experimental conditions is conventional and intended to minimize sound-specific learning effects (Rvachew & Nowak, Reference Rvachew and Nowak2001).
The treated sound was taught using the aforementioned treated words. An established treatment protocol was followed (Gierut, Reference Gierut, Dinnsen and Gierut2008a) using drill play (Shriberg & Kwiatkowski, Reference Shriberg and Kwiatkowski1982). Specifically, each treated word was introduced as a discrete trial. A child was shown a picture of the treated word. The experimenter modeled the word. Following the model, a child imitated production of the word. 1:1 feedback was provided about accuracy of production, with praise for accurate outputs and placement cues for erred outputs. Production training continued in this way, trial after trial, for the duration of the session: a picture of the treated word was displayed, the experimenter modeled production of that word, a child imitated, and 1:1 feedback was provided. A child was dismissed at the end of the 1-hour session (M = 71 trials), only to return the next session for exactly the same instruction, beginning with the pre-exposure slide show followed by training on sound production.
Production training continued in imitation for seven total sessions or until a child imitated the treated words with 75% accuracy over two consecutive sessions, whichever occurred first. When this criterion was met, the response mode shifted to spontaneous production. As before, a child produced the treated sound in the treated words, using the same materials, drill play, and 1:1 feedback. The only difference between imitative and spontaneous response modes was that a child produced the treated sound in the treated words without benefit of a preceding model. Treatment continued in the spontaneous response mode for twelve total sessions or until a child independently produced the treated words with 90% accuracy over three consecutive sessions, whichever occurred first. When criterion was met in the spontaneous response mode, the protocol was completed and treatment withdrawn. Thus, each child received treatment for a maximum of 19 sessions. Each treatment session always began with the pre-exposure slide show followed by production training, first in imitative and then spontaneous response modes, until criterion had been met.
Reliability
Transcription reliability was established for 10% of the probe data collected from each child. Two phonetically trained and blinded judges independently transcribed the samples, and these were compared point-to-point for consonant agreement. Reliability was established at 92% mean agreement (range: 85–97%).
Fidelity was assessed for 5% of the experimental sessions using a checklist procedure (Gierut, Reference Gierut, Dinnsen and Gierut2008a). An independent observer monitored randomly selected sessions to ensure that the protocol was administered as directed and probe data sampled as scheduled. The experimenter was blind to the collection of fidelity data. Fidelity was established at 100%.
RESULTS AND DISCUSSION
Two kinds of data were evaluated, performance during treatment and generalization. Performance during treatment established that children learned what had been taught as the foundation from which generalization could occur as the dependent variable.
Performance during treatment
Time in treatment was documented to establish that children received comparable amounts of instruction. Children in the neighbor condition completed the protocol in an average of fifteen sessions (range: 6–19). Those in the non-neighbor condition required seventeen sessions (range: 13–19) to completion. There was no statistical difference across conditions in the number of sessions in imitative and spontaneous response modes (χ 2(1, N = 4) = 0·09, p = ·76).
Accuracy of production of the treated sound in treated words was also considered. In the neighbor condition, children achieved 72% (range: 50–85%) and 84% (range: 73–98%) mean accuracy in imitative and spontaneous response modes, respectively. In the non-neighbor condition, performance was comparable with mean accuracy of 67% (range: 57–83%) and 86% (range: 71–100%) in imitative and spontaneous modes, respectively.
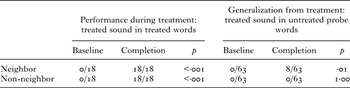
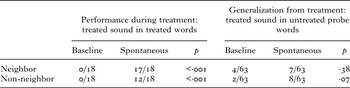
The non-parametric McNemar test for significance of change was computed independently for each condition. The intent was to determine whether improved production accuracy as a consequence of treatment was reliable. Production of the treated sound in treated words was evaluated at baseline and again at completion of treatment. Table 3 reports the number of treated words produced correctly at each sampling point for the neighbor and non-neighbor conditions. Results showed that both conditions were statistically significant (p < ·001). As intended, treatment led to improved production of the treated sound in treated words. As will be shown, this result takes on significance when production of the treated sound in untreated probe words is evaluated as a reflection of generalization. Comparable findings across conditions confirmed that treatment provided an equal scaffold from which differential generalization could take place.
Results of the McNemar test of significance of change associated with pre-exposure to neighbors versus non-neighbors in Study 1

note: Production of the treated sound in treated words during treatment is on the left; generalization of the treated sound to untreated probe words is on the right. Number of accurate productions of the treated sound/total words sampled is reported at baseline and completion of the treatment protocol.
Generalization
Generalization was defined previously as system-wide gains in production accuracy of sounds excluded from children's phonemic inventories relative to baseline performance on the probe. Generalization data were examined in four complementary ways using conventional metrics of description, clinical significance, statistical significance, and practical significance as benchmarks for interpretation (Bain & Dollaghan, Reference Bain and Dollaghan1991; Bothe & Richardson, Reference Bothe and Richardson2011). Description of generalization from treatment is standard to the evaluation of single-subject research. Clinical significance interprets generalization from treatment in a manner that is recognizable by professionals who work with the population of study (Bothe & Richardson, Reference Bothe and Richardson2011, p. 235). Statistical significance establishes that generalization is real and not due to other variables (Bain & Dollaghan, Reference Bain and Dollaghan1991, p. 266). Practical significance is an adjunct to statistical significance in its use of effect size. Practical significance reveals the importance of generalization by capturing the absolute size of the gain for cross-comparisons and meta-analyses (Bain & Dollaghan, Reference Bain and Dollaghan1991, p. 267).
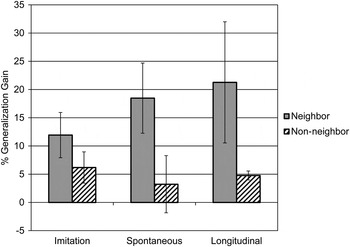
Description. Figure 1 plots the mean percent generalization gain over baseline for the neighbor and non-neighbor conditions, with standard error shown. Three key points in time are plotted, showing gains at completion of treatment in imitative and spontaneous response modes, and longitudinally after withdrawal of treatment.
Mean percent generalization gain over baseline performance on the probe for neighbor versus non-neighbor conditions in Study 1, with standard error shown. Generalization is plotted at completion of treatment in imitative and spontaneous response modes, and longitudinally after withdrawal of treatment. Baseline performance was 1·9% mean accuracy for the neighbor condition and 8·8% mean accuracy for the non-neighbor condition.

By visual inspection, greater system-wide generalization was associated with the neighbor condition at each point in time. In the neighbor condition, gains ranged from 11·9–21·3% relative to baseline performance on the probe. In the non-neighbor condition, gains were in the range of 3·2–6·2% relative to baseline. This was notable because children in the neighbor condition started with lower levels of baseline accuracy on the probe (M = 1·9%) compared to children in the non-neighbor condition (M = 8·8%). Despite less accuracy of production at the start of treatment, children pre-exposed to neighbors evidenced greater generalization.
An established criterion cut-off of 10% gain relative to baseline (Elbert, Dinnsen & Powell, Reference Elbert, Dinnsen and Powell1984) was applied to the generalization data in Figure 1. The 10% cut-off was originally conceptualized as a minimum threshold signaling stable or true generalization gain. The 10% minimum accords with Bain and Dollaghan's view (1991, p. 268) that generalization gain, no matter the size, represents a distinct improvement in the daily functioning of a child with linguistic delays/disabilities. The 10% cut-off is conventionally applied in reference to system-wide improvements in production accuracy, not to individual sounds. As such, the criterion cut-off enables the binary coding of experimental conditions as inducing yes/no generalization. Figure 1 shows that the neighbor condition met the 10% criterion cut-off at each sampling point in time, but the non-neighbor condition did not. By this metric, pre-exposure to neighbors appeared to induce generalization, but non-neighbors did not.
Clinical significance. A conventional index of severity, Percent Consonants Correct–Revised (PCC-R; Shriberg, Austin, Lewis, McSweeny & Wilson, Reference Shriberg, Austin, Lewis, McSweeny and Wilson1997), was applied to aid the clinical interpretation of the aforementioned descriptive data. Established procedures for calculating PCC-R were applied to 53-word samples obtained from each child at baseline, completion of treatment, and longitudinally after withdrawal of treatment. PCC-R is computed by tallying the number of accurate consonant productions relative to the total consonants produced in the sample to derive a percentage. Greater PCC-R scores align with less severe phonological delays.
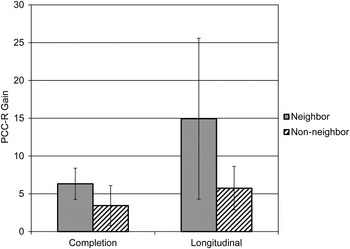
Figure 2 plots the mean gain in PCC-R scores relative to baseline (Table 1) for the neighbor and non-neighbor conditions, with standard error shown. Two points in time are shown: completion of treatment and longitudinally after treatment was withdrawn. Generally, the neighbor condition resulted in greater PCC-R scores than the non-neighbor condition. Children in the neighbor condition improved their PCC-R scores 6·3% at completion of treatment and 14·9% continuing longitudinally. By comparison, those in the non-neighbor condition improved their PCC-R scores 3·4% and 5·7% at completion of treatment and longitudinally, respectively. From a clinical standpoint, pre-exposure to neighbors had a greater (positive) impact on the clinical characterization of severity than non-neighbors.
Mean percent gain in PCC-R scores over baseline performance for the neighbor and non-neighbor conditions in Study 1, with standard error shown. Gain in PCC-R scores are plotted at completion of the treatment protocol and longitudinally after withdrawal of treatment. Baseline PCC-R scores are reported in Table 1.

Statistical significance. Generalization of the treated sound to untreated probe words was evaluated statistically using the McNemar test. This was the direct complement to the aforementioned McNemar test of the treated sound in treated words. The intent was to compare performance during treatment relative to generalization from treatment when the object of learning (i.e., the treated sound) was the same in both cases.
Table 3 shows that, for the neighbor condition, generalization of the treated sound to untreated probe words was statistically reliable and not due to chance (p = ·01). By comparison, in the non-neighbor condition, generalization of the treated sound was not statistically significant (p = 1·00). This finding is of mention because, during treatment, both experimental conditions induced statistically significant change in production of the treated sound in treated stimuli. However, these generalization data show that transfer of the treated sound to other untreated words and contexts was only statistically reliable in the neighbor condition. Pre-exposure to neighbors promoted transfer of the treated sound; non-neighbors did not.
Practical significance. Effect size is a relatively new addition to the single-subject literature that has been introduced with an eye toward meta-analyses of treatment studies (Beeson & Robey, Reference Beeson and Robey2006). Effect size captures the absolute magnitude of generalization gain associated with a given experimental condition, and then values obtained across conditions are compared to identify which is relatively more effective in promoting generalization.
Standard mean difference with correction for continuity (d) was applied herein for consistency with other studies of children with PD (Gierut & Morrisette, Reference Gierut and Morrisette2011, Reference Gierut and Morrisette2012a, Reference Gierut and Morrisette2012b). This statistic is specific to single-subject design (Busk & Serlin, Reference Busk, Serlin, Kratochwill and Levin1992) and not to be confused with effect size for large-N studies (Cohen, Reference Cohen1988). Standard mean difference with correction for continuity is calculated in the following way: mean accuracies are computed at baseline for each child for all sounds excluded from the phonemic inventory under each experimental condition. Likewise, mean accuracies are computed for each child for each longitudinal sample obtained through completion of treatment for all sounds excluded from the phonemic inventory that generalized. The difference between mean baseline and generalization data is then divided by the mean standard deviation of the baseline for the population of study (i.e., all participants) to yield an effect size, d. The standard deviation of the population takes into account individual variability in baseline performance (Glass, Reference Glass1977) and accommodates 0% baselines in computation of effect size (Gierut & Morrisette, Reference Gierut and Morrisette2011). The data for each experimental condition are then aggregated for relative comparison.
While benchmarks for interpretation of effect size have been established (arbitrarily) for large-N studies (Cohen, Reference Cohen1988, p. 532), it is not appropriate to extend these to single-subject research (Beeson & Robey, Reference Beeson and Robey2006, p. 167). Standards that define small, medium, or large effects must be developed empirically for a given population, and to achieve this, effect sizes must first accumulate. To date, treatment studies of PD (Gierut & Morrisette, Reference Gierut and Morrisette2011, Reference Gierut and Morrisette2012a, Reference Gierut and Morrisette2012b), which have used the standard mean difference with correction for continuity, report d values in the range of 2·60 to 16·58 (M = 7·88; Mdn = 5·61). The present study added to this base as a secondary contribution.
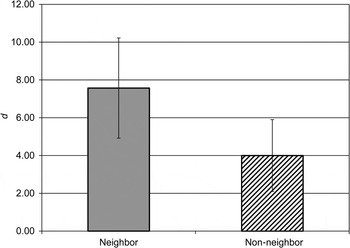
Figure 3 plots the mean effect size associated with neighbor and non-neighbor conditions, with standard error shown. The average d was 7·57 for the neighbor condition compared to 4·00 for the non-neighbor condition. The absolute gain from pre-exposure to neighbors versus non-neighbors was on the order of magnitude of 2:1.
Effect size for neighbor and non-neighbor conditions in Study 1, with standard error shown.

Obtained d values were further aligned with previous reports of effect size for the population of PD cited above. A median split, where d = 5·61 for the population of PD, was used to sort the present data into two categories for interpretation (cf. Estes, Edwards & Saffran, Reference Estes, Edwards and Saffran2011). For the neighbor condition, the obtained d of 7·57 was greater than the median d for the population. For the non-neighbor condition, the obtained d of 4·00 was less than the median d. Thus, pre-exposure to neighbors was affiliated with greater magnitude of gain when taken in the context of the population of PD.
Together, the results of description, clinical, statistical, and practical significance converged in Study 1. Pre-exposure to dense neighbors led to greater and reliable generalization compared to non-neighbors in treatment of children with PD. This finding is consistent with Stoel-Gammon's (Reference Stoel-Gammon2011) description of the relevance of dense neighborhoods to phonological acquisition. As in typical development, improved production accuracy and generalized use of new phonemes in new contexts and lexical items were associated with dense neighborhoods.
The results were also consistent with Church and Fisher's (Reference Church and Fisher1998) hypothesis that long-term auditory word priming bears on the phonological structure of children's representation of words. Here, change in phonological structure was reflected behaviorally in children's production accuracy and generalized use of sounds excluded from the inventory. Thus, long-term auditory word priming may offer a viable account of the dense neighborhoods effects for children with PD.
Study 1 further demonstrated that the treatment paradigm developed by Demke et al. (Reference Demke, Graham and Siakaluk2002) for lexical purposes was equally applicable to the phonological domain and appropriate for children with PD. This notwithstanding, the results obtained herein stand apart from the findings of Demke et al. (Reference Demke, Graham and Siakaluk2002): pre-exposure to dense neighbors aided phonological learning, but not lexical learning, thus motivating Study 2.
STUDY 2
The purpose was to evaluate the effect of exposing children with PD to neighbors versus non-neighbors after training sound production. The goal was to alter the timing of exposure in evaluation of an alternate hypothesis that phonological working memory guides the dense neighborhood advantage in phonological acquisition.
METHODS
Participants
Six children with PD (M = 4;4; range: 3;4–5;5) were recruited following procedures outlined for Study 1. Inclusionary and exclusionary criteria were identical to those described previously, with individual profiles and mean performance by experimental group shown in Table 4.
Diagnostic profiles of children enrolled in Study 2, with mean performance by experimental group

notes: Perceptual discrimination of post-exposure and treated stimuli was not tested. This would have introduced a confound because a child would have been exposed to the relevant stimuli prior to the experimental manipulation.
a Standard scores on the Goldman-Fristoe Test of Articulation–2 (Goldman & Fristoe, Reference Goldman and Fristoe2000), Leiter International Performance Scale-Revised (Roid & Miller, Reference Roid and Miller1997), Expressive Vocabulary Test (Williams, Reference Williams1997), and Peabody Picture Vocabulary Test, 3rd ed. (Dunn & Dunn, Reference Dunn and Dunn1997).
b Sounds excluded from the phonemic inventories of all children of Study 2 were /θ ð ʃ tʃ dʒ r/. Additionally, /ŋ k ɡ f v s z l j/ were excluded within and across children's inventories.
c Oral-motor structure/function scores (Robbins & Klee, Reference Robbins and Klee1987).
d Total percent accuracy on nonword repetition task (Dollaghan & Campbell, Reference Dollaghan and Campbell1998; Gathercole & Adams, Reference Gathercole and Adams1993).
e Scaled scores on the Auditory Sequential Memory subtest of the Illinois Test of Psycholinguistic Abilities–Revised (Kirk, McCarthy & Kirk, Reference Kirk, McCarthy and Kirk1968) are interpreted relative to a M = 36 (SD = 6).
f Percentage of Consonants Correct–Revised (Shriberg et al., Reference Shriberg, Austin, Lewis, McSweeny and Wilson1997).
Experimental design and methods
The design, stimuli, and materials were identical to Study 1. The independent variable was post-exposure to neighbors versus non-neighbors, and the dependent variable was system-wide phonological generalization. The difference between studies was the timing of exposure to neighbors or non-neighbors. Specifically, the order of administration of the treatment protocol was reversed: Study 1 presented neighbors or non-neighbors before training sound production (‘Appendix B’), whereas Study 2 presented neighbors or non-neighbors after training sound production (‘Appendix C’). This can be seen in the comparison of Appendices B and C, which are identical in all respects except for the timing of exposure relative to production training in a given experimental session.
Reliability
As in Study 1, reliability of transcriptions was computed and established as 92% consonant agreement (range: 89–97%) between independent judges. Fidelity was established as 100% conformity in administration of procedures.
RESULTS AND DISCUSSION
Results were analyzed as in Study 1, with attention to performance during treatment and generalization. A comparison of Studies 1 and 2 was also considered.
Performance during treatment
Time and accuracy of production during treatment were documented. With respect to time, children in the neighbor condition required an average of eleven sessions (range: 5–16) to complete the protocol. The non-neighbor group was comparable, requiring an average of twelve sessions (range: 10–14) to completion. There was no significant difference across conditions in the number of sessions in imitative and spontaneous response modes (χ 2(1, N = 4) = 0·06, p = ·81). With respect to accuracy, children in the neighbor condition produced the treated sound in treated words with 85% mean accuracy (range: 80–93%) in imitative and 97% mean accuracy (range: 95–98%) in spontaneous response modes. Accuracy in the non-neighbor condition was similar: children achieved 84% (range: 75–95%) and 95% (range: 93–99%) mean accuracy in imitative and spontaneous response modes, respectively.
Independent McNemar tests for the significance of change in accuracy of the treated sound during treatment are reported in Table 5. The neighbor and non-neighbor conditions each resulted in statistically reliable gains in accuracy of the treated sound in treated words as a direct consequence of treatment (p < ·001). As intended, treatment had comparable effects on children's production of the treated sound across conditions, thereby establishing a foundation for subsequent generalization.
Results of the McNemar test of significance of change associated with post-exposure to neighbors versus non-neighbors in Study 2

note: Production of the treated sound in treated words during treatment is on the left; generalization of the treated sound to untreated probe words is on the right. Number of accurate productions of the treated sound/total words sampled is reported at baseline and completion of the treatment protocol.
Generalization
Description and clinical, statistical, and practical significance were considered in evaluation of system-wide generalization to sounds excluded from the phonemic inventory relative to baseline performance on the probe. Data analyses paralleled Study 1.
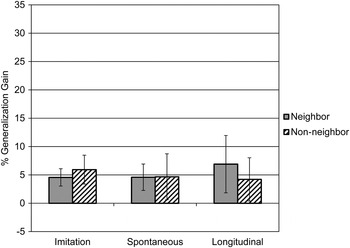
Description. Figure 4 displays the mean generalization gain over baseline performance on the probe for the post-exposure conditions, with three points in time plotted: after completion of treatment in imitative and spontaneous response modes and longitudinally after treatment was withdrawn. Visual inspection revealed little to no difference in generalization gain associated with post-exposure to neighbors versus non-neighbors over time. The neighbor condition resulted in gains in the range of 4·6–6·9% accuracy over baseline. The non-neighbor condition was nearly identical, with gains in the range of 4·2–5·9% accuracy over baseline.
Mean percent generalization gain over baseline performance on the probe for the neighbor versus non-neighbor conditions in Study 2, with standard error shown. Generalization is plotted at completion of treatment in imitative and spontaneous response modes, and longitudinally after withdrawal of treatment. Baseline performance was 4·2% mean accuracy for the neighbor condition and 4·8% mean accuracy for the non-neighbor condition.

The 10% criterion cut-off (Elbert et al., Reference Elbert, Dinnsen and Powell1984) was applied to the data in Figure 4 as a metric to binarily code the occurrence of system-wide generalization. Figure 4 shows that neither post-exposure condition met the minimum 10% cut-off. Thus, in descriptive evaluation, post-exposure to dense neighbors and non-neighbors had undifferentiated and minimal effects on system-wide generalization.
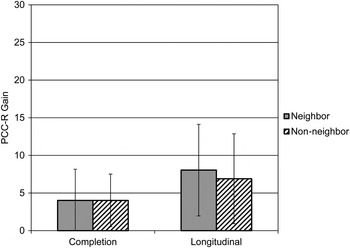
Clinical significance. Figure 5 plots the average gains in PCC-R scores relative to baseline (Table 4) for the neighbor and non-neighbor conditions at two points in time. Recall that PCC-R is a clinical index of severity. Figure 5 shows little to no difference in PCC-R scores across conditions. In the neighbor condition, PCC-R scores improved an average of 4·0–8·0%, and in the non-neighbor condition, 4·0–6·9%. Thus, post-exposure to neighbors and non-neighbors had comparable modest effects on clinical estimates of severity.
Mean percent gain in PCC-R scores over baseline performance for the neighbor and non-neighbor conditions in Study 2, with standard error shown. Gain in PCC-R scores are plotted at completion of the treatment protocol and longitudinally after withdrawal of treatment. Baseline PCC-R scores are reported in Table 4.

Statistical significance. The McNemar test was used to gauge the statistical reliability of generalization of the treated sound to untreated probe words. Recall that the relevant point of interest was performance during treatment versus transfer from treatment when the object of learning (i.e., the treated sound) was the same. Table 5 shows that transfer of the treated sound to untreated probe words was not statistically significant for the neighbor (p = ·38) or non-neighbor (p = ·07) conditions. Neither post-exposure condition promoted reliable generalization of the treated sound, despite reliable gains in accuracy of that same sound during treatment.
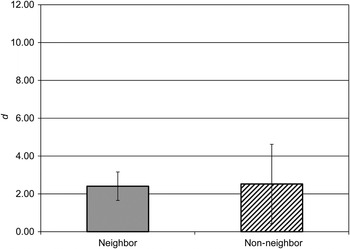
Practical significance. Effect size data are plotted in Figure 6 for the post-exposure neighbor and non-neighbor conditions. The magnitude of system-wide generalization gain was again comparable across conditions, where d = 2·41 for neighbors and 2·52 for non-neighbors.
Effect size for neighbor and non-neighbor conditions in Study 2, with standard error shown.

Obtained d values were examined relative to the population of children with PD. Recall that the magnitude of generalization for the population (reported above) ranged from 2·60 to 16·58 (M = 7·88, Mdn = 5·61). It is notable that the d values for post-exposure to neighbors (2·41) and non-neighbors (2·52) fell below the median (5·61) obtained for the population. In fact, the d values obtained herein are the lowest reported to date for children with PD. Thus, the post-exposure conditions served to reset the effect size minima for the population.
In sum, Study 2 yielded essentially equivalent effects across experimental conditions based on the convergence of descriptive, clinical, statistical, and practical evidence. Generalization following post-exposure to neighbors versus non-neighbors was undifferentiated and modest at best. These findings are of interest for two reasons. First, they did not support the expected dense neighborhood advantage for phonological learning (Stoel-Gammon, Reference Stoel-Gammon2011). Second, they are at odds with the results of lexical learning (Demke et al., Reference Demke, Graham and Siakaluk2002), where differential effects of neighbors versus non-neighbors were observed post-exposure. The asymmetries are perhaps best understood in a comparison of Studies 1 and 2.
Integration of studies
Thus far, the presentation of results emphasized the differentiation of neighbors versus non-neighbors as the independent variable of the respective studies. Study 1 found differential effects, such that pre-exposure to neighbors > non-neighbors in promoting generalization. In contrast, Study 2 found little to no differential effects, with post-exposure to neighbors = non-neighbors. Visual inspection of the figures associated with Studies 1 and 2 further revealed that the amount of generalization observed in pre-exposure was greater than that of post-exposure. This can be seen in comparisons of descriptive data (cf. Figures 1 and 4), clinical data (cf. Figures 2 and 5), and practical data (cf. Figures 3 and 6). Moreover, the results across studies suggested that neighbor status and timing of exposure were coupled: the greatest generalization occurred when exposure to neighbors took place prior to training production. This is a finding wholly consistent with the predictions of auditory word priming.
It is possible to explore the relative contribution of neighbor status and timing of exposure by aggregating effect sizes across studies (Gierut & Morrisette, Reference Gierut and Morrisette2011). This is achieved by blocking effect sizes for a given variable, while setting aside the other. Specifically, in aggregation of Studies 1 and 2 for the neighbor versus non-neighbor manipulation, timing of exposure was set aside. Based on aggregated d values, neighbors promoted greater generalization than non-neighbors on an order of magnitude of 1·2:1 (i.e., d blocked by neighbors = 4·5, non-neighbors = 3·3, following from Figures 3 and 6). Likewise, in aggregation of Studies 1 and 2 for the pre- versus post-exposure manipulation, neighbor status was set aside. Based on aggregated d values, pre-exposure induced greater generalization than post-exposure on an order of magnitude of 2·6:1 (i.e., d blocked by pre-exposure = 5·4, post-exposure = 2·5, following from Figures 3 and 6). This hints that timing of exposure to dense neighbors was indeed critical to generalization.
There is one caveat, however, that must be explored in the comparison of studies as it relates to individual differences. While dense neighbors and pre-exposure have emerged as essential variables, the profiles of individual children must be ruled out as possibly contributing to generalization effects. Correlational analyses were completed to establish whether there was a relationship between effect size and the diagnostic data shown in Tables 1 and 4. Results showed no statistically significant correlation between effect size and chronological age, number of sounds excluded from a child's phonemic inventory, or PCC-R scores at enrollment (all rs < 0·09, all ps > ·79). There was also no correlation between effect size and total number of treatment sessions or number of sessions in imitative and spontaneous response modes (all rs < –0·39, all ps > ·25). There was no correlation between effect size and the results of diagnostic tests of articulation, oral motor structure/function, non-verbal intelligence, expressive vocabulary, receptive vocabulary, nonword repetition, or working memory (all rs < 0·48, all ps > ·14). In all, none of the child-specific variables was predictive of effect size. While it is of course possible that a yet to be determined lurking variable was operative, the data at hand suggest otherwise. Differential generalization within across studies was attributable to the experimental manipulations of neighbor status and timing of exposure.
GENERAL DISCUSSION
Our goal was to evaluate long-term auditory word priming and phonological working memory as possible learning mechanisms behind the dense neighborhood advantage in language acquisition. By replication and extension to the phonological domain for children with PD, results supported the expected benefit of dense neighborhoods, but only under well-defined pre-exposure conditions. In discussion, results are placed in the broader context of phonological acquisition and interpreted in support of priming as a relevant language-learning mechanism. Suggestions for future research are offered to better understand the complementary role of phonological working memory in guiding dense neighborhood effects.
Dense neighborhoods and phonological acquisition
The present work replicated the dense neighborhood effect in phonological acquisition, but only in part. Neighbors did not uniformly enhance generalization for children with PD, but rather, their beneficial effects were incumbent on timing of exposure.
There are several reasons why the coupling of neighbor status and timing of exposure might have been essential for children with PD. First, previous literature has demonstrated that priming dense neighbors has a magnifying effect on the phonemic distinctions of language (De Cara & Goswami, Reference De Cara and Goswami2003; Merriman & Marazita, Reference Merriman and Marazita1995). Recall that a defining trait of children with PD is a reduced phonemic inventory. Thus, pre-exposure to neighbors may have honed in on the problem at hand. Second, when dense neighbors are repeatedly primed, points of segmental overlap among words habituate and novelty of form is brought forward (Merriman & Marazita, Reference Merriman and Marazita1995). In the present research, rhymes receded, and onsets were uniquely spotlighted. Importantly, the phoneme to be learned in treatment was in onset position. Third, priming dense neighbors provided children with the opportunity to experience minimal pairs side-by-side. Children heard stories loaded with minimal pairs (e.g., hail, fail, pail) and then were taught related neighbors of the same minimal pair set (e.g., sail). In typical phonological development, children may not require direct experience with minimal pairs to acquire phonemes (Maye & Gerken, Reference Maye, Gerken, Howell, Fish and Keith-Lucas2000). However, children with PD are highly responsive to minimal pairs, with this being among the efficacious treatments to promote generalization (Baker & McLeod, Reference Baker and McLeod2011). It is possible that priming provided a unique way to expose children with PD to minimal pairs. Finally, minimal pairs are central to the differentiation of meaning among words and meaning is at the heart of the lexicon. Priming dense neighbors may have reinforced the critical association between form and meaning for children with PD. Taken together, the pre-exposure neighbor condition may have afforded an ideal scenario for optimizing phonological acquisition in PD.
Given the potential promise of priming for PD, it is especially important to extend this line of investigation to address limitations of the present studies. In particular, the inherent design of single-subject studies restricts the number of participants. Replications enrolling additional children will lend robustness to the data. Likewise, our treatment protocol was designed to effect change in children's phonemic inventories. While gaps in the inventory are a primary trait of PD, it is well known that children often present with a range of production errors. Replications are needed to test the applicability of priming to other error patterns and other contexts. Further, the treated sounds and experimental stimuli need to be expanded. In the present studies, sounds taught in production were restricted to /s/, /l/, or /r/ for reasons associated with generalizability and feasibility. Future studies are needed to establish a broader base of generalization effects in treatment of other early-, mid-, or late-8 segments. Similarly, the words used in priming and production training were chosen based on adult-referenced norms of neighborhood density. There has been considerable debate in the literature (cf. Charles-Luce & Luce, Reference Charles-Luce and Luce1990; Dollaghan, Reference Dollaghan1994), with no clear resolve about the appropriateness of adult estimates of neighborhood density for developmental studies (but see Storkel, Reference Storkel2013). Replications using child-referenced density norms are needed for completeness.
The present work also adds to the treatment literature, which has been inconclusive about the contributions of dense neighborhoods to generalization in PD. Recall that previous studies yielded mixed results about generalization from treatment of dense neighborhoods (cf. Gierut & Morrisette, Reference Gierut and Morrisette2012b; Morrisette & Gierut, Reference Morrisette and Gierut2002). This notwithstanding, there appears to be an emerging pattern about the conditions under which dense neighborhoods help or hinder generalization. In particular, studies that reported dense neighborhoods as facilitating also carried certain qualifications. Consider that dense neighbors aided generalization herein, but only when presented prior to treatment. Similarly, dense neighbors aided generalization (Gierut & Morrisette, Reference Gierut and Morrisette2012b), but only when input cues converged (i.e., dense words that are frequent and early acquired). In each report of facilitating effects, an added layer of support for learning had been provided. Support came through adjustments in the format of instruction (i.e., priming) and treated stimuli (i.e., convergent input cues). It is possible that these adjustments boosted the utility of dense neighborhoods for children with PD. When such support was absent (Morrisette & Gierut, Reference Morrisette and Gierut2002), dense neighborhoods did not facilitate phonological generalization. Thus, dense neighborhoods seem to be a necessary, but not sufficient, condition of phonological treatment.
This observation gives rise to basic questions about the role of dense neighborhoods for children with PD. To address such questions, future research may need to broaden its scope by appealing to, and integrating complementary data from, spoken word recognition. This is a recent innovation in the study of SLI (Hoover & Storkel, Reference Hoover and Storkel2013), where children's recognition of words from dense neighborhoods is explored for predictive value in treatment. New insights may be gleaned from a parallel approach to PD. Perhaps children's recognition of dense neighbors will inform the success of treatment that employs dense neighbors. Whatever the outcome, the integration of recognition and production is likely to reveal individual differences in the characterization and remediation of PD.
Mechanisms behind phonological learning
The present research weighed in on more general hypotheses about the mechanisms of learning behind dense neighborhood effects in language acquisition. For phonological acquisition, in particular, our findings support long-term auditory word priming as a viable account. From this, it is possible to glean a hypothetical course of phonological acquisition by assembly of the literature: a child starts out by building the lexicon (Ferguson & Farwell, Reference Ferguson and Farwell1975), accumulating similar-sounding words from the input (Jusczyk, Luce & Charles-Luce, Reference Jusczyk, Luce and Charles-Luce1994). Initially, the representation of these words does not fully align with the phonological structure of the input (Dinnsen, Reference Dinnsen, Elbert, Dinnsen and Weismer1984; Macken, Reference Macken1980, Stoel-Gammon, Reference Stoel-Gammon2011); consequently, a child's early productions are often homophonous. Nevertheless, the lexicon increases in size, as more words that overlap in phonological form are added, rendering dense neighborhoods (Charles-Luce & Luce, Reference Charles-Luce and Luce1990). As the lexicon continues to grow, a child repeatedly experiences the same words time and again, akin to a naturalistic case of long-term auditory word priming (Church & Fisher, Reference Church and Fisher1998). With each occurrence, the sound patterns of words from dense neighborhoods are strengthened. The result is change in the representation and use of phonemic distinctions as reflected in production accuracy (Stoel-Gammon, Reference Stoel-Gammon2011). The contextual variability associated with these repeated occurrences further supports generalization (Beckman et al. Reference Beckman, Munson, Edwards, Cole and Hualde2007), such that a child's experience with similarity of form transfers to new phonemes, features, positions, and lexical items, all in an effort to differentiate meaning. Notice that a long-term auditory word priming account of this sort conforms to classic (Ferguson & Farwell, Reference Ferguson and Farwell1975) and contemporary (Beckman et al. Reference Beckman, Munson, Edwards, Cole and Hualde2007) views that the lexicon gives rise to phonology in acquisition. The account delineates what is learned as a consequence of dense neighborhoods, i.e., phonemic distinctions, and how that learning takes place, i.e., priming. While intriguing, empirical validation of the process is essential. Computational studies of longitudinal data might be one way to begin, with the occurrence of neighbors in the input tallied relative to the emergence of specific phonemes.
Although the explanatory power of priming remains to be determined, it appears that, at the very least, priming offers a ripe situation for advancing change in linguistic structure (Savage et al. Reference Savage, Lieven, Theakston and Tomasello2006). Thus far, priming has been used to trigger various aspects of language learning in children with (Leonard, Miller, Grela, Holland, Gerber & Petucci, Reference Leonard, Miller, Grela, Holland, Gerber and Petucci2000) and without (Savage et al., Reference Savage, Lieven, Theakston and Tomasello2003, Reference Savage, Lieven, Theakston and Tomasello2006; Vasilyeva & Waterfall, Reference Vasilyeva and Waterfall2012) language deficits. To our knowledge, the present studies are among the first to apply priming to PD and to phonological treatment (see also Gierut & Morrisette, Reference Gierut and Morrisette2014). As such, the exact conditions of priming that promote generalization warrant elaboration. Rhyme priming was employed herein, but studies of onset priming are needed (Brooks & MacWhinney, Reference Brooks and MacWhinney2000; Merriman & Marazita, Reference Merriman and Marazita1995). This manipulation might involve, for example, exposure to sun, soap, sit as primes followed by training production of /s/ in the word sat. The optimal mode of priming also needs to be considered (Gierut & Morrisette, Reference Gierut and Morrisette2014). Auditory + visual priming was used herein in keeping with Demke et al. (Reference Demke, Graham and Siakaluk2002). However, priming might be presented in the auditory mode only, as in Church and Fisher (Reference Church and Fisher1998), such that children hear neighbor stories in the absence of a corresponding picture. Conversely, pictures might be presented in priming, without corresponding auditory stories. The use of stories in priming is another research need. As priming has been implemented for lexical (Demke et al., Reference Demke, Graham and Siakaluk2002) and phonological learning (herein), children heard stories with prime words embedded. Consistent with the Seuss boost (Read, Macauley & Furay, Reference Read, Macauley and Furay2014), this may have contributed to word recognition, identification, retention, and learning. In future research, it will be necessary to test the effects of priming using citation lists. Predictably, a list format might facilitate phonological learning because a child would be exposed to minimal pairs without intervening or extraneous content. Yet it is equally possible that a list format might be detrimental to phonological learning because the contextual support for meaning would be eliminated. Without meaning, the mapping of phonemic distinctions among words might be more challenging. The amount of priming to induce generalization also needs to be established. Children were exposed to primes a maximum of nineteen times under the current treatment protocol, but less exposure may be equally effective. Through collective research along these lines, the conditions of priming will be better understood as a necessary foundation for community-based studies of priming in applied settings.
The discussion thus far has centered on priming as a mechanism of learning, but the present studies were designed to also evaluate phonological working memory as an alternative. Results failed to show support for this hypothesis: There was limited and no differential generalization following post-exposure to neighbors or non-neighbors. In contrast to Demke et al. (Reference Demke, Graham and Siakaluk2002), the post-exposure conditions did not have an apparent effect on refreshing the phonological loop or filling in sound patterns of words for children with PD. At first blush, it might be tempting to reject the phonological working memory hypothesis, but this is premature.
Consider that exposure to dense neighbors before training production affected phonological learning herein, but exposure to dense neighbors after training novel words impacted lexical learning (Demke et al., Reference Demke, Graham and Siakaluk2002). One implication is that dense neighbors serve different purposes depending on the task at hand. For phonological learning, neighbors promote phonological structure; for lexical learning, they refresh phonological structure. The seemingly asymmetric findings may be simply two sides of the same coin.
In future research, it will be important to jointly measure phonological and lexical learning as dependent variables (Ferguson & Farwell, Reference Ferguson and Farwell1975) in manipulations of dense neighborhoods. This idea takes on added interest in the context of PD. Recall that subgroups of children with PD may have co-occurring deficits in lexical learning (Shriberg & Kwiatkowski, Reference Shriberg and Kwiatkowski1994) or in phonological working memory (Shriberg et al., Reference Shriberg, Lohmeier, Campbell, Dollaghan, Green and Moore2009). In the present studies, enrollment was restricted to PD in the absence of other deficits. Future studies might broaden the inclusionary criteria to enroll children with co-occurring problems as in PD + lexical deficits or PD + phonological working memory deficits. It is possible that the timing of exposure to dense neighbors will differentially affect these subgroups. Predictably, pre-exposure to neighbors might be optimal in cases of PD + lexical deficits. According to Church and Fisher (Reference Church and Fisher1998), pre-exposure assists the encoding of new words (thereby addressing lexical deficits) and the representation of sound patterns in words (thereby addressing PD). Post-exposure to neighbors might be best for those with PD + phonological working memory deficits. According to Demke et al. (Reference Demke, Graham and Siakaluk2002), post-exposure helps retention of words in the phonological loop (thereby addressing phonological working memory deficits) and refreshes the phonological loop to fill in the details of the representation (thereby addressing PD). Research along these lines has the potential to reveal differential recommendations for treatment, with timing of exposure to dense neighborhoods being tailored specifically to the unique profiles of children with PD.
CONCLUSION
This research added to the body of evidence that supports the contributions of dense neighborhoods to phonological acquisition. The findings disambiguated possible accounts of the effects of dense neighborhoods on phonological structure by pointing to long-term auditory word priming as a mechanism of learning. The finding of a conjunction between neighbor status and timing of exposure sets the stage for continued research to establish the priming conditions that optimize generalization for children with PD. The results further motivate the integration of recognition with production data in the joint evaluation of phonological and lexical learning in children with typical and delayed development.
APPENDIX A
Stimuli for /s/

APPENDIX B
Study 1 Pre-exposure treatment protocol
-
1. Administer baseline probe for 2+ sessions based on order of enrollment
-
2. Treatment begins
-
a. Pre-exposure phase starts the session
-
i. Child enters room and is seated
-
ii. Experimenter initiates PowerPoint slide show
-
iii. Child watches show once to completion
-
iv. Pre-exposure phase of session ends
-
-
b. Production training immediately follows pre-exposure in same session
-
i. Experimenter shows Child picture of treated word
-
ii. Experimenter models production
-
iii. Child responds in imitation
-
iv. Experimenter provides feedback about accuracy
-
v. Next trial is initiated; repeat b. i–v
-
vi. Continue for 1-hr, approximately 71 trials
-
-
c. Administer probe as required following VR2 schedule
-
d. Child dismissed until next session
-
-
3. Repeat 2 above for 7 total sessions or until Child achieves 75% accuracy of production of treated sound in treated words over 2 consecutive sessions, whichever occurs first
-
4. After completion of 3 above, administer probe in the next session
-
5. Repeat 2 above in all subsequent sessions, but omit b. ii above (Experimenter model) and require Child to spontaneously produce treated sound in treated words in b. iii
-
a. Continue for 12 total sessions or until Child achieves 90% accuracy of production of treated sound in treated words over 3 consecutive sessions, whichever occurs first
-
-
6. After completion of 5, administer probe in the next session
-
7. Treatment is completed; experiment ends
-
8. Re-administer probe 2 weeks and 8 weeks after treatment is withdrawn
APPENDIX C
Study 2 Post-exposure treatment protocol
-
1. Administer baseline probe for 2+ sessions based on order of enrollment
-
2. Treatment begins
-
a. Production training starts the session
-
i. Child enters room and is seated
-
ii. Experimenter shows Child picture of treated word
-
iii. Experimenter models production
-
iv. Child responds in imitation
-
v. Experimenter provides feedback about accuracy
-
vi. Next trial is initiated; repeat a. ii–v
-
vii. Continue for 1-hr, approximately 71 trials
-
-
b. Post-exposure phase immediately follows production training in same session
-
i. Experimenter initiates PowerPoint slide show
-
ii. Child watches show once to completion
-
iii. Post-exposure phase of session ends
-
-
c. Administer probe as required following VR2 schedule
-
d. Child dismissed until next session
-
-
3. Repeat 2 above for 7 total sessions or until Child achieves 75% accuracy of production of treated sound in treated words over 2 consecutive sessions, whichever occurs first
-
4. After completion of 3, administer probe in the next session
-
5. Repeat 2 above in all subsequent sessions, but omit a. iii above (Experimenter model) and require Child to spontaneously produce the treated sound in treated words in a. iv
-
a. Continue for 12 total sessions or until Child achieves 90% accuracy of production of treated sound in treated words over 3 consecutive sessions, whichever occurs first
-
-
6. After completion of 5, administer probe in the next session
-
7. Treatment is completed; experiment ends
-
8. Re-administer probe 2 weeks and 8 weeks after treatment is withdrawn