




No CrossRef data available.
Article contents
Electrophysiological and pharmacological characterization of K+-currents in muscle fibres isolated from the ventral sucker of Fasciola hepatica
Published online by Cambridge University Press: 18 November 2004
Abstract
Fibres isolated from the ventral sucker of Fasciola hepatica were identified as muscle on the basis of their contractility, and their actin and myosin staining. They were voltage-clamped at a holding potential of −40 mV and depolarization-activated outward currents were characterized both electrophysiologically and pharmacologically. Activation was well fitted by a Boltzmann equation with a half-maximal potential of +9 mV and a slope factor of −14·3 mV, and the kinetics of activation and deactivation were voltage-sensitive. Tail current analysis showed that the reversal potential was shifted by +46±3 mV when EK was increased by 52 mV, confirming that this was a K+-current with electrophysiological characteristics similar to delayed rectifier and Ca2+-activated K+-currents in other tissues. The peak current at +60 mV was inhibited by 76±6% by tetrapentylammonium chloride (1 mM) and by 84±7% by Ba2+ (3 mM), but was completely resistant to block by tetraethylammonium (30 mM), 3,4-diaminopyridine (100 μM) and 4-aminopyridine (10 mM). Penitrem A, a blocker of high-conductance Ca2+-activated K+-channels reduced the current at +60 mV by 23±5%. When the effects of Ca2+-channel blocking agents were tested, the peak outward current at +60 mV was reduced by 71±7% by verapamil (30 μM) and by 59±4% by nimodipine (30 μM). Superfusion with BAPTA-AM (50 μM), which is hydrolysed intracellularly to release the Ca2+-buffer BAPTA, also decreased the current by 44±16%. We conclude that voltage-and Ca2+-sensitive K+-channels are expressed in this tissue, but that their pharmacology differs considerably from equivalent channels in other phyla.
Keywords
Information
- Type
- Research Article
- Information
- Copyright
- © 2004 Cambridge University Press
INTRODUCTION
Fasciola hepatica, or the common liver fluke, is a flatworm, or platyhelminth, belonging to the Class Trematoda. As such, it is both of considerable biological interest as an organism placed phylogenetically somewhere between the lower and higher invertebrates, and of widespread economic and agricultural concern as a common parasite in domestic animals. Parasitic flatworms like F. hepatica use their body musculature both for movement and stabilization within the host animal. It is no surprise, therefore, that many anthelmintic drugs appear to target the neuromuscular system in these parasites (Martin, 1997). A better understanding of the neuromuscular physiology of these organisms should also facilitate the search for new anti-parasitic agents, allowing key differences between host and parasite motor mechanisms to be identified and exploited (Fairweather & Boray, 1999).
The use of the patch-clamp technique has led to a huge growth in our understanding of the ion channels responsible for excitation in mammalian nerve and muscle (for review, see Sakmann & Neher, 1984), but relatively few studies have addressed these issues from an electrophysiological perspective in flatworms (Keenan & Koopowitz, 1981, 1984; Bricker, Pax & Bennett, 1982; Solon & Koopowitz, 1982; Bennett & Kohler, 1987; Blair et al. 1991; Blair & Anderson, 1993, 1994, 1996; Day et al. 1993, 1995; Kim et al. 2002; Cobbett & Day, 2003; Jang et al. 2003). In this paper we describe the isolation and identification of muscle fibres from the ventral sucker of the liver fluke, F. hepatica and summarize the results of voltage-clamp experiments carried out on these cells. The sucker was studied both because it provides a rich source of muscle and contains few other cell-types, and also because it plays an important role in the survival of the adult fluke, acting as an attachment organ which prevents it from being flushed out of the biliary tract of the host animal. This is, to the best of our knowledge, the first such study on muscle from F. hepatica. It is only the second voltage-clamp study on cells of any type from this organism, a non-specific cation current having recently been described in neurons isolated from F. hepatica (Kim et al. 2002), although ion channels from F. hepatica have also been studied in lipid bilayers (Jang et al. 2003). We describe here outward K+-currents evoked during depolarization, along with their unusual pharmacological profile. These characteristics are discussed with an emphasis on how they compare with K+-channels in other species.
MATERIALS AND METHODS
Experimental infections of Fasciola hepatica were maintained in male albino Sprague-Dawley rats which were initially infected under light ether anaesthesia with 20 metacercarial cysts (Veterinary Laboratories Agency, Weybridge, Surrey, UK). Adult flukes at least 12 weeks old were collected from the bile ducts of rats killed by cervical dislocation. All procedures were approved and licensed by the U.K. Home Office Inspector under the provisions of the Animal (Scientific Procedures) Act, 1986. Flukes were stored at 37 °C in commercial sterile culture medium (Sigma) first described by the National Cancer Institute (medium code NCTC-135). This was buffered with NaHCO3 and contained penicillin 50 i.u./ml and streptomycin 50 μg/ml. Flukes were used within 4 h.
Isolation of muscle fibres
A variant on a previously published technique was used and has been described in detail elsewhere (Blair & Anderson, 1994; Kumar et al. 2003). Briefly, the ventral suckers (Fig. 1A) were dissected from 3–4 flukes and incubated for 20 min at 37 °C in nominally Ca2+-free (i.e. no added Ca2+) Hédon-Fleig saline (pH 7·4) containing 0·1% (%=w/v except where indicated) bovine serum albumin (BSA), 5 mM dithiothreitol (DTT) and 0·2% papain. Three washes in papain-free solution were followed by a 40-min incubation at 37 °C in nominally Ca2+-free Hédon-Fleig saline containing 0·1% BSA, 5 mM DTT and 0·2% trypsin. After 3 more washes, there was a final 30-min incubation in nominally Ca2+-free Hédon-Fleig saline, followed by 30–40 triturations using a Pasteur pipette to release individual fibres (Fig. 1C).

Fig. 1. Scanning electron micrographs of ventral sucker muscle from Fasciola hepatica. (A) Micrograph of a ventral sucker treated with potassium hydroxide and collagenase to reveal the muscle fibres in situ. The circumferential orientation of the underlying muscle is clearly seen on the exposed inner face of the sucker (outlined with a box). (B) Enlarged region from within the boxed area in (A) showing muscle fibres (large arrows) and their attached cell bodies (small arrowheads). (C) Individual muscle fibre isolated from the ventral sucker.
Scanning electron microscopy
The relevant techniques have been described fully previously (Kumar et al. 2003). In order to reveal the sucker muscle in situ, the tegument was partially removed using a modification of the method of Murakumo et al. (1995). Suckers were fixed for 4 h at room temperature in 4% glutaraldehyde solution containing 3% sucrose and buffered with 0·1 M sodium cacodylate (pH 7·4). They were then incubated sequentially for 1h each in: 30% aqueous potassium hydroxide (60 °C); 0·1 M phosphate-buffered saline (PBS, pH 7·4); Hédon-Fleig saline containing 0·2% collagenase (Type 1A, Sigma-Aldrich Co Ltd, Poole, Dorset, UK); 0·1 M PBS (pH 7·4); and finally 2% aqueous tannic acid at room temperature (all at 37 °C unless indicated). Subsequently, the suckers were rinsed and processed for scanning electron microscopy (SEM) using overnight fixation in 1% aqueous osmium tetroxide (OsO4) and a 1 h treatment with 0·5% uranyl acetate. The specimens were dehydrated in acetone, critical-point dried in liquid CO2, and coated with gold/palladium in a Polaron E.5000 sputter-coating unit. Images were recorded using a Joel 35-CF scanning electron microscope operated at an accelerating voltage of 10 keV.
Isolated fibres were prepared using a modification of the technique of Lincks et al. (1998). They were transferred onto glass cover-slips and allowed to settle for 30 min at 4 °C before 30-min fixation at room temperature with a 4% glutaraldehyde solution in 0·1 M sodium cacodylate buffer containing 3% sucrose (pH 7·2). They were then washed in buffer and fixed for 1 h in 1% OsO4 in 0·1 M sodium cacodylate buffer (pH 7·2). Following 2–3 washes in buffer, the samples were dehydrated in ascending alcohol solutions. Drying and sputter-coating for SEM were carried out as described above.
Fluorescence microscopy
Actin and myosin were labelled using techniques which have previously been described in detail (Kumar et al. 2003). Actin was labelled using tetramethylrhodamine B isothiocyanate-conjugated phalloidin (TRITC-phalloidin). Ventral suckers were prepared using cryostat sectioning as previously described. The 6–7 μm thick sections were air-dried on glass slides and then fixed for 30 min at room temperature in 4% paraformaldehyde (PFA) dissolved in 0·1 M PBS (pH 7·4). The sections were permeabilized using 0·1 M PBS containing 0·5% (v/v) Triton X-100, 0·1% BSA and 0·1% sodium azide, and then stained with 0·1 M PBS (pH 7·4) containing TRITC-phalloidin (200 ng/ml). Fluorescent images were captured using a confocal scanning laser microscope (MRA-1, Bio-Rad Ltd, Abingdon, UK) with excitation/emission wavelengths set to 514/570 nm. Isolated cells were fixed for 20 min at room temperature using 4% PFA in 0·1 M PBS (pH 7·4), and then permeabilized and stained as described for cryostat sections. Confocal images were processed for presentation using Laserscan (Bio-Rad) and Photoshop 7 (Adobe).
Myosin was labelled using indirect immunofluorescence (Coons, Leduc & Connolly, 1955) with a polyclonal antiserum raised in rabbit against myosin II from T. solium (Ambrosio et al. 1997). This cross-reacts with F. hepatica myosin in Western blots (Kumar et al. 2003). Cryostat sections of ventral sucker and isolated muscle fibres were fixed in methanol for 10 min at −20 °C, washed in 0·1 M PBS (pH 7·4) and incubated in the primary anti-myosin antiserum (1[ratio ]1000 dilution in 0·1 M PBS containing 0·5% (v/v) Triton X-100, 0·1% BSA and 0·1% sodium azide) for 3 h at room temperature. Fluorescein isothiocyanate-(FITC-) conjugated anti-rabbit IgG was used as the secondary antibody (1[ratio ]50; supplied by Dako Ltd, High Wycombe, Bucks, UK). FITC-based fluorescence was imaged using confocal microscopy with excitation/emission wavelengths of 488/530 nm. Control preparations, in which the primary antiserum labelling step was either omitted or substituted with incubation in non-immune rabbit serum (Dako Ltd, High Wycombe, Bucks, UK), showed no fluorescence.
Electrophysiological recordings
Freshly isolated muscle fibres were allowed to settle onto the glass base of a rectangular perfusion chamber on the stage of an inverted microscope (Nikon Instruments, UK) and superfused with 10 mM HEPES-buffered Hédon-Fleig saline at room temperature. The superfusion system allowed rapid bath exchange (<5 s) between control and test solutions. Individual fibres were observed using bright-field illumination (×40 objective) and whole-cell voltage-clamp established using the perforated patch technique (Horn & Marty, 1988). Borosilicate capillary tubes (1·5 mm outer diameter, 1·17 mm inner diameter, Clark Electromedical Instruments, Reading, UK) were pulled to form micropipettes with a tip resistance of 4–5 MΩ (Flaming/Brown puller model P-87, Sutter Instruments Co., USA). The pipettes were dipped in a standard K+-rich pipette solution and then back-filled with solution containing amphotericin B. This forms pores in the underlying cell membrane which allow electrical access to the intracellular space, while limiting dialysis of cytoplasmic macromolecules. Amphotericin B was made up as 60 mg/ml stock in dimethyl sulphoxide (Me2SO) and then diluted in pipette solution to a final concentration of 600 μg/ml (1% (v/v) Me2SO).
A patch-clamp amplifier (EPC 8, HEKA Instruments, Lambrecht, Germany) controlled membrane potential (relative to an Ag/AgCl electrode in the bath solution) and measured membrane currents. Current records were filtered at 1 kHz, digitized at 3 kHz and analysed using WinWCP v. 3.0.1 software (© Strathclyde University). Hyperpolarizing steps from −40 mV to −80 mV were used to estimate capacitance and series resistance after the membrane current recordings had stabilized (Armstrong & Gilly, 1992). Average values for series resistance and cell capacitance were 20·1±2·8 MΩ and 24·7±3·9 pF, respectively (mean±S.E.M.; n=9). Liquid junction potentials were measured using the method of Neher (1992) and were 2–3 mV for all solution combinations used. Series resistance, cell capacitance and liquid junction potentials were all left uncompensated. Experimental protocols were commenced once the current evoked by a depolarizing step to +60 mV had stabilized, usually between 2 and 3 min after seal formation.
Data summary and statistics
For the purposes of data summary, current amplitudes were measured relative to the holding current at −40 mV, with outward currents (upward deflections) regarded as positive. Currents were leak-subtracted using the slope conductance for an incremental series of 10 mV hyperpolarizing steps from −80 mV to −110 mV. Time-constants (τ) for activation, decay and deactivation of currents were obtained by fitting the current records with single exponentials using analysis software in the WinWCP package. This applies an iterative, least-squares minimization algorithm to maximize the goodness-of-fit.
Average data have been expressed as the mean±the standard error of the mean (S.E.M.) and the statistical significance of apparent differences in mean values assessed using either a paired t-test (for comparisons of absolute data values) or the non-parametric Wilcoxon signed-rank test (for comparisons of % changes). Differences between means were accepted as statistically significant at the 95% level (P<0·05). Mean data points were fitted with Boltzmann or exponential equations (see Results section) using MacCurveFit v 1.5.5 (Kevin Rayner Software; www.krs.com.au).
Drugs and solutions
All pharmacological agents were externally applied in Hédon-Fleig saline. The following solutions were used: Hédon-Fleig saline (mM): NaCl (120·7), KCl (4), CaCl2.2H2O (1·8), MgSO4.7H2O (1), NaHCO3 (18·5), glucose (15), HEPES (10), pH set to 7·4 with NaOH. Nominally Ca2+-free Hédon-Fleig was prepared by omitting the CaCl2. PBS (mM): NaCl (145·5), NaH2PO4 (2·5), Na2HPO4 (30·7), pH set to 7·4. Patch pipette electrode solution (mM): KCl (53), KGluconate (80), MgCl2 (1), EGTA (0·5), HEPES (10), pH set to 7·2 with KOH.
Antibody raised against T. solium myosin was the kind gift of Dr J. R. Ambrosio (Department of Microbiology and Parasitology, School of Medicine, National Autonomous University of Mexico, Mexico City, Mexico 04510). BSA, collagenase, DTT, papain, sodium azide, trypsin, Triton X-100 and TRITC-phalloidin were all obtained from Sigma-Aldrich Co Ltd (Poole, Dorset, UK). Sodium cacodylate and OsO4 were obtained from Agar Scientific (Stansted, Essex, UK). All other chemicals were obtained from BDH Laboratory Supplies (Poole, Dorset, UK).
RESULTS
Structural studies of ventral sucker muscle in F. hepatica
Experiments were carried out with a view to establishing that the isolated fibres were indeed muscle. Muscle in the intact sucker was compared structurally with the fibres released during the cell isolation process. Scanning electron microscopy of suckers which had been partially digested to remove the tegument revealed the underlying musculature, whose orientation is clearly circumferential on the inner face of the sucker (Fig. 1A and B). Muscle fibres were arranged parallel with each other and were approximately 3 μm wide (Fig. 1B), but it was impossible to tell what length each fibre was in these images as they were closely apposed in series. Cell bodies were also clearly seen to protrude laterally from the muscle fibres. Isolated individual muscle fibres were similar in width to muscle in situ and were generally 30–50 μm in length (Fig. 1C). Approximately 80% of fibres contracted in response to high [K+] solution (30 mM) or serotonin (1 μM). Both the muscle bundles seen in situ within the suckers and the fibres isolated from them labelled positively for actin (Fig. 2A and B) and myosin (Fig. 2C and D), as assessed using fluorescently tagged phalloidin, and a polyclonal antibody raised against myosin II in T. solium. Since these isolated ‘cells’ were contractile and stained for contractile proteins, it was concluded that they were derived from the muscle of the sucker wall. The term muscle fibre will be used in the rest of this paper to refer to these isolated structures but, since most fibres were no longer attached to their cell body (Fig. 1C), this term should not be taken to be synonymous with a muscle cell. Incompletely digested bundles of fibres, fused to one another centrally but free at either end, were also often observed. Only single fibres, which were completely isolated from their neighbours, were studied electrophysiologically.

Fig. 2. Fluorescent staining for actin and myosin in ventral sucker from Fasciola hepatica. (A) Confocal optical section from ventral sucker stained for actin with TRITC-labelled phalloidin. (B) Confocal image of isolated fibres from ventral sucker labelled with TRITC-labelled phalloidin. (C) Confocal micrograph of a sucker labelled for myosin using a polyclonal antibody raised against type II myosin from Taenia solium and a FITC-conjugated secondary antibody. (D) Confocal images of isolated fibres labelled for myosin using the same antibodies.
Electrophysiological characterization of outward currents
Isolated muscle fibres from F. hepatica were investigated using the perforated patch technique to voltage-clamp the entire fibre at a holding potential of −40 mV. This is believed to be close to the resting potential in flatworm muscle and has been used in studies on muscle fibres isolated from the human blood fluke, Schistosoma mansoni (Day et al. 1995). Depolarizing steps from this potential elicited outward currents (Fig. 3A; capacitance transients have been clipped in this and other figures). The voltage dependence of these currents was characterized by increasing the amplitude of depolarization in 10 mV steps up to a maximum of +60 mV. Outward currents were activated at −20 mV and above (Fig. 3B). An activation curve was plotted for the normalized whole cell conductance (G/Gmax) and fitted with a Boltzmann equation of the form:

where the conductance, G=(Peak Current)÷(Membrane Potential-Reversal Potential), Gmax is the conductance at +60 mV, V=(Membrane Potential-Reversal Potential), V0·5 is the value of V at which G is half-maximal, and k is the slope factor (Fig. 3C). The reversal potential was determined from the voltage-dependence of tail-currents under control conditions, as described below (Fig. 5), and a value of −69 mV was used. This fit gave values of 9 mV for V0·5 and −14·3 mV for k. The activation kinetics of the current were also voltage-sensitive over this range (Fig. 3D). The average value of the activation time-constant (τact), as determined using a single exponential fitted to the rising phase of the current, was reduced e-fold for every 32·1 mV increase in membrane potential, falling from 36·5±8·9 ms at 0 mV to 7·2±1·0 ms at +60 mV (mean±S.E.M.; n=7, P<0·02, paired t-test). None of the current records exhibited the very rapid activation and inactivation kinetics characteristic of an A-type current. It should be noted, however, that the relatively positive holding potential in the voltage protocol used may well have inactivated any such current.

Fig. 3. Step depolarizations from a holding potential of −40 mV evoked sustained outward currents in most muscle fibres studied. (A) Superimposed traces of the currents recorded from a single muscle fibre are shown below the applied voltage protocol. Depolarization was applied at 10 s intervals and increased in 10 mV steps from −40 mV to +60 mV. In this (and all other) records, the broken horizontal line represents zero current. (B) Plot of the mean values (±S.E.M.) of the peak current (filled symbols) and the sustained current (open symbols) at each membrane potential for 7 muscle fibres. (C) Data points represent the mean values of normalized whole cell conductance (G/Gmax) at each membrane potential (see text for details). The solid curve is a Boltzmann equation with half-maximal activation at 9 mV and a slope factor of −14·3 mV (R2 for fit=0·99). (D) Plot of the mean time-constant (τact) for activation of the outward current at each membrane potential used.
In the vast majority of fibres the outward currents were well maintained throughout the 500 ms depolarization and there was an appreciable outward tail-current after repolarization to −40 mV (Fig. 3A and B). At +60 mV the sustained current at the end of the pulse averaged 77±4% of the peak current during the same step (n=7, P<0·05, paired t-test). In 7 out of 83 fibres studied, however, the outward current was more transient in nature, falling by more than 50% during the depolarizing step (Fig. 4A). When the data from these experiments were summarized, however, the activation characteristics of these more transient currents were indistinguishable from those already described for the slowly decaying currents (compare Figs 4B and C with Fig. 3). The Boltzmann fit to the activation curve (not shown) gave values of 8 mV for V0·5 and −13·5 mV for k (R2=0·99). There was an e-fold reduction in τact for every 36·7 mV increase in membrane potential, decreasing from 35·1±5·7 ms at 0 mV to 5·9±0·4 ms at +60 mV (Fig. 4C; P<0·001, paired t-test, n=7). The rate of current decay was much slower than the rate of activation but it was also accelerated with increased depolarization. The mean time-constant for the decay in current (τdecay) fell e-fold for every 52·9 mV increase in depolarization, dropping from 202·1±34·0 ms at +10 mV to 108·8±14·6 ms at +60 mV (n=7; Fig. 4D, P<0·05, paired t-test).

Fig. 4. Step depolarizations evoked more transient outward currents in a small percentage of muscle fibres studied. (A) Superimposed traces of the currents recorded from a single muscle fibre during voltage steps from −40 mV to +60 mV. The initial outward current decayed markedly during the maintained depolarizing step. (B) Plot of the mean values (±S.E.M.) of the peak current (filled symbols) and the sustained current (open symbols) evoked at each membrane potential for 7 fibres in which current decayed by more than 50% during the depolarizing step to +60 mV. (C) Voltage-dependent changes in the mean time-constant of activation (τact). (D) Voltage-dependent changes in the mean time-constant of current decay during depolarization to the potentials indicated (τdecay).
The activation characteristics of the currents described above are very similar to those of delayed-rectifier and Ca2+-activated K+-currents in other cell types. The role of K+ as a charge carrier in muscle fibres from F. hepatica was tested directly by examining the effect of changes in extracellular [K+] ([K+]o) on the reversal potential of the relevant tail-currents. Outward currents were first activated by depolarizing the fibres to +60 mV for 200 ms. Tail-currents were then recorded following repolarization to potentials which were increased in 10 mV steps from −120 mV to −10 mV (Fig. 5A). In the experimental records shown the tail-currents recorded under control conditions, i.e. with [K+]o=4 mM (calculated EK=−89 mV), reversed at a potential close to −70 mV (Fig. 5B). When [K+]o was raised to 30 mM (EK=−37 mV), the reversal potential was shifted in a positive direction, with inwardly directed tail-currents at potentials negative to −20 mV. These inward currents became larger when [K+]o was further raised to 50 mM (EK=−25 mV; Fig. 5B). Data from 6 such experiments were summarized by measuring the tail-current amplitude 6 ms after repolarization. This delay was necessary to avoid contamination by the inward capacitative currents. When the voltage dependence of the mean tail-currents was plotted, the reversal potential was shifted in a positive direction when [K+]o was raised from 4 mM to 30 mM (Fig. 5C). The reversal potential was estimated for each fibre using linear interpolation and the average value was shifted from −69±3 mV in the control solution to −23±1 mV with a [K+]o of 30 mM (n=6, P<0·00005, paired t-test). Thus, a 52 mV positive shift in the calculated EK resulted in a mean shift of 46±3 mV in the reversal potential of the current, evidence that the majority of this current was carried by potassium ions.

Fig. 5. [K+]o-dependence of tail-currents. (A) Muscle fibres were hyperpolarized to −80 mV for 10 ms and then depolarized to +60 mV for 200 ms to activate outward currents (see diagram of voltage-protocol). Repolarization to potentials varying between −120 mV and −10 mV elicited a family of tail-currents, as outlined by the boxes on the current records. All 3 sets of records were obtained from the same fibre at different [K+]o, as shown. (B) Tail-currents from A at higher amplification and on a faster time-base. (C) Mean tail-current (measured 6 ms after repolarization) plotted against membrane potential for 6 fibres exposed to the protocol in A under control conditions ([K+]o=4 mM, ellipsoid symbols; symbol size exceeds S.E.M. if no bar is shown) and with [K+]o=30 mM (rectangular symbols). Tail-current reversal potentials are indicated by arrows 1 and 2. (D) Voltage-dependence of the mean time-constants of deactivation (τdeact) for the tail currents under control conditions (filled symbols) and in high [K+]o (open symbols). No value has been plotted for high [K+]o at −20 mV as there was inadequate tail current under these conditions to allow accurate curve-fitting.
One unusual feature of the voltage dependence of the tail-currents was the apparent outward rectification under control conditions, while the mean amplitude of the inward currents actually decreased at the most negative potentials in 30 mM [K+]o (Fig. 5C). These features are a consequence of the 6 ms delay before the tail-currents were measured. Since the ionic current deactivates on repolarization, this delay will inevitably lead to an underestimate of their size. The deactivation kinetics were voltage-dependent, so that the tail-currents decayed more rapidly at more negative potentials (Fig. 5B). Although this is most obvious from inspection of recordings made in the presence of high external [K+], analysis demonstrated that the voltage-dependence of the rate of deactivation was similar in both normal and high [K+]o (Fig. 5D). Overall, there was an e-fold reduction in τdeact for every 30·5 mV depolarization with normal [K+]o, and for every 30·2 mV depolarization when [K+]o was 30 mM. The mean τdeact fell from 54·8±5·6 ms at −30 mV to 5·9±1·6 ms at −90 mV in control [K+]o (n=6, P<0·0001, paired t-test), and from 62·4±4·9 ms to 10·9±1·5 ms over the same voltage range when [K+]o was set to 30 mM for the same fibres (P<0·001, paired t-test). The increased rate of deactivation means that underestimate of tail-current due to the delay in measurement will be greatest at the most negative potentials, and could thus account for the apparent rectification seen.
Effects of K+ channel blockers on the outward current in F. hepatica muscle fibre
The pharmacological profile of these currents was investigated using a range of externally applied K+-channel blockers. Tetrapentylammonium (TPA+) at 1 mM markedly inhibited the outward current over the entire range of its activation (Fig. 6A). In a series of 5 fibres, the peak current evoked at +60 mV was reduced from an average of 864±48 pA under control conditions to 203±54 pA in the presence of TPA+ (P<0·005, paired t-test), an average inhibition of some 76±6% (Fig. 6D). This blockade was irreversible, with no recovery of current after 15 min of washout (data not shown). In 3 out of the 5 fibres, the sustained phase of the outward current was blocked more rapidly than the early current during wash-in of the drug (Fig. 6B), suggesting that there may have been more than one channel population. A range of other K+-channel antagonists was screened by comparing the peak outward current evoked during a 500 ms step to +60 mV under control conditions with that recorded during an identical voltage step in the presence of the drug. Penitrem A (10 μM), a selective inhibitor of large conductance Ca2+-activated K+-channels (Knaus et al. 1994), reduced the outward current from 659±172 pA to 483±106 pA, an average reduction of 23±5% (n=7, P<0·05, paired t-test; Fig. 6C and D). Superfusion with standard Hédon-Fleig solution to which 3 mM BaCl2 had been added also reduced the average peak current at +60 mV from 767±234 pA under control conditions to 156±89 pA, a reduction of 84±7% (n=4; P<0·05, paired t-test; Fig. 6D). No statistically significant effects were seen with tetraethylammoniuim (TEA+, 30 mM, n=5), 3,4 diaminopyridine (3,4 DAP, 100 μM, n=4) or 4 aminopyridine (4-AP, 10 mM, n=8; Fig. 6D).

Fig. 6. Effects of K+ channel blockers on outward current. (A) Superimposed current records from a single fibre for depolarizations increased in 10 mV steps from −40 mV to +60 mV (see voltage protocol). The currents shown were recorded in control solutions (upper records) and during superfusion with 1 mM TPA+ (lower records). (B) Superimposed records showing the evolution of current blockade for a fibre that was depolarized to +60 mV every 30 s. The time elapsed from the start of TPA+ superfusion (1 mM) is shown. The sustained current was blocked more rapidly than the early current, leaving a residual transient outward current peak e.g., at 60 s. (C) Superimposed current records from a cell showing the current evoked during a step to +60 mV under control conditions and after 90 s superfusion with penitrem A (10 μM). (D) Bar charts summarizing the effects of different K+-channels blockers as assessed using the peak outward current evoked at +60 mV in the presence of the drug normalized to the control current in the same fibres. The concentrations and number of experiments summarized for each drug were as follows: TPA+ (1 mM; n=5), TEA+ (30 mM; n=5), Ba2+ (3 mM; n=4), penitrem A (10 μM; n=7), 3,4,DAP (100 μM; n=4) and 4AP (10 mM; n=8). Asterisks indicate statistically significant changes from paired controls; *P<0·05, **P<0·001 (paired t-test).
Evidence for Ca2+ dependence of outward current
Given that the outward currents recorded from these muscle fibres were partially blocked by penitrem A, further experiments were carried out to test the possible Ca2+-dependence of the current. Verapamil is a phenylalkamine which inhibits Ca2+ channel activity. Addition of verapamil inhibited the outward current during step depolarizations to +60 mV, but only at relatively high drug concentrations. In the record shown the sustained current was considerably more sensitive to blockade than the peak current and the residual current after blockade was less noisy than control (Fig. 7A). In 8 fibres tested the sustained current was maximally inhibited at a drug concentration of 10 μM, but a similar level of inhibition of the peak current was only seen when the verapamil concentration was raised to 30 μM. Thus, at 10 μM the average reduction in sustained current was 83±7% (n=8, P<0·0005, paired t-test versus control) whereas the reduction in peak current was only 52±9% (P<0·02, Wilcoxon signed-rank test versus percentage reduction in sustained current). Inhibition of peak current increased to 71±7% at 30 μM (Fig. 7B). A full current-voltage protocol was also carried out before and during superfusion with 30 μM verapamil. The relatively verapamil-resistant component of current was more obvious at the most positive voltages used (Fig. 7C). In a series of 5 such experiments, 30 μM verapamil markedly reduced the peak outward current at all voltages studied but the percentage inhibition decreased slightly from an average of 94±3% at 0 mV to 82±7% at +60 mV (Fig. 7D) (n=5; P<0·05, Wilcoxon signed-rank test).

Fig. 7. Effects of verapamil on outward currents. (A) Superimposed records from a single fibre depolarized to +60 mV under control conditions and in the presence of increasing concentrations of verapamil. The sustained phase of current was selectively inhibited at the lower concentrations used. (B) Concentration-effect curve showing the mean ratio of the current amplitude at each verapamil concentration to the control current amplitude in the same fibre. Results for the peak and sustained currents are shown and each value represents the mean (±S.E.M.) for 6–8 fibres. (C) Superimposed currents recorded from a single fibre during step depolarizations increasing in 10 mV steps from −40 mV to +60 mV (see voltage protocol). The control currents (upper records) are compared with those recorded from the same cell during superfusion with 30 μM verapamil (lower records). (D) Summary of 5 experiments using the protocol in (C) showing mean values for the peak current at each membrane potential under control conditions (closed symbols) and in the presence of verapamil (open symbols).
Further experiments were carried out using the dihydropyridine drug nimodipine, which is an L-type Ca2+-channel antagonist. This also produced a concentration-dependent block of outward current in which the sustained current was more readily blocked than the early current, but again this required high drug levels (Fig. 8). When increasing concentrations of nimodipine were applied to a series of 7 fibres (Fig. 8A and B), the sustained current evoked by a step to +60 mV was inhibited, on average, by 79±3% at 30 μM, whereas the peak current was only reduced by 59±4% (n=7; P<0·02, Wilcoxon signed-rank test). Full current-voltage relationships were determined for 5 fibres under control conditions and in the presence of 30 μM nimodipine (Fig. 8C and D). In the current records shown, and in 3 of the 4 other experiments carried out, there was a residual peak of unblocked early current at the most positive potentials tested, but the difference in percentage inhibition of the peak current at different membrane potentials was not statistically significant (Wilcoxon signed-rank test). A series of 5 experiments were also carried out using Bay K 8644 (1 μM), a dihydropyridine with Ca2+-channel agonist properties, but this did not produce statistically significant changes in the peak or sustained outward currents (paired t-test; data not shown).

Fig. 8. Effects of nimodipine on outward currents. (A) Current records from a single fibre depolarized to +60 mV under control conditions and in the presence of increasing concentrations of nimodipine. (B) Concentration-effect curve showing the mean ratio of the current amplitude at each nimodipine concentration to the control amplitude in the same fibre. Data for peak and sustained currents are summarized separately and each value represents the mean (±S.E.M.) for 6–7 fibres. (C) Superimposed currents recorded from a single fibre during a series of depolarizations increasing in 10 mV steps from −40 mV to +60 mV (see voltage protocol). The control currents (upper records) are compared with those recorded from the same fibre during superfusion with 30 μM nimodipine (lower records). (D) Summary of 5 experiments using the protocol in (C) showing mean values for the peak current at each membrane potential under control conditions (closed symbols) and in the presence of nimodipine (open symbols).
A small number of fibres were also tested under conditions in which [Ca2+]o had been effectively reduced to zero by omitting CaCl2 and adding 3 mM EGTA, a Ca2+-chelator. These experiments proved difficult to interpret, however, as the leak current became very high in the presence of EGTA due to loss of the seal between the electrode and the cell membrane (data not shown). Experiments were carried out using BAPTA-AM in an attempt to circumvent these technical problems. This agent is cell-permeant and is hydrolysed by intracellular enzymes, releasing free BAPTA to buffer the cytoplasmic [Ca2+]. Superfusion with 50 μM BAPTA-AM inhibited the outward current at +60 mV (Fig. 9). As was the case with verapamil and nimodipine, the sustained current was more completely blocked than the early peak current (Fig. 9A). The onset of action was surprisingly rapid, with maximal inhibition being seen within 30 s of drug exposure in several fibres. On average, 5 min superfusion with BAPTA-AM reduced the peak current by only 44±16% but inhibited the sustained current by 92±6% (Fig. 9B; n=5; P<0·05, Wilcoxon signed-rank test). Overall, the effects of Ca2+-antagonists and BAPTA-AM are consistent with the hypothesis that the outward current has a Ca2+-dependent component, but they must be interpreted with some caution since the possibility of direct inhibitory actions on the K+-channels themselves cannot be ruled out (see Discussion section below).

Fig. 9. (A) Two current records from the same fibre showing the current evoked during a step to +60 mV under control conditions and after 5 min superfusion with 50 μM BAPTA-AM. (B) Bar chart summarizing results from 5 experiments showing the effect of BAPTA-AM on the mean value (+S.E.M.) of the peak and sustained currents. P values indicate statistically significant reductions from control (paired t-test).
DISCUSSION
Fibre characterization
We have taken some care at the outset of this study to establish what cell type we were studying in our digests. This is no trivial matter because, even in an organ as densely packed with muscle as the ventral sucker, there is the possibility that neurones and tegumental cells may also be released by the enzymatic and mechanical disruption procedures. A combination of functional and structural evidence, based on the mechanical responses of the fibres to contractile stimuli and the presence of contractile proteins within them, particularly as indicated by positive staining for myosin, supports the conclusion that these were muscle fibres (Kumar et al. 2003). Cell bodies, which are obvious in situ, were no longer seen in most isolates, however, and any currents carried by channels in the membrane of the cell body will not have been recorded. When incompletely digested cell clumps were excluded (see Fig. 1 in Kumar et al. 2003), only one morphology was identified, with spindle-shaped fibres of variable length and diameter. This contrasts with the variety of cell types identified in similar digests from S. mansoni (Day et al. 1993, 1995). It is possible that there is more than one cell type in the sucker itself, however, and the disruptive nature of the isolation procedure makes it difficult to identify subpopulations of cells reliably on morphological grounds alone. It may be, indeed, that the more rapidly decaying currents seen in a small percentage of fibres reflects the existence of a functionally distinct fibre type.
Electrophysiological characterization of the outward current
The muscle fibres isolated from the ventral sucker were characterized electrophysiologically in what is, to our knowledge, the first voltage-clamp-based study in muscle from F. hepatica and one of only a handful of similar studies in any flatworm tissues (Blair et al. 1991; Blair & Anderson, 1993, 1994, 1996; Day et al. 1993, 1995; Kim et al. 2002). The holding potential of −40 mV is believed to be close to the resting membrane potential in flatworm muscle (Bricker et al. 1982; Day et al. 1995). When the calculated EK was increased by 52 mV, the reversal potential for this outward current was shifted by 46 mV in the same direction, very strong evidence that this is a K+-current. In both normal and 30 mM [K+]o, however, the current reversed at potentials more positive than the calculated EK. Similar deviations have been reported in other studies of K+-currents (Volk, Matsuda & Shibata, 1991). It may be that [K+] in the pipette solution and cytoplasm was not equal, leading to an error in the calculation of EK. Although the perforated patch technique should allow free diffusion of cations between cell and pipette (Horn & Marty, 1988), membrane pumps will play a role in setting [K+], particularly near the cell membrane. One can see how accumulation of additional K+ near the inside of the membrane in high [K+]o conditions could reduce EK from its calculated value. Under those circumstances, however, the difference between measured and calculated values should have been greater in high [K+]o. Another possibility is that an opposing inward current may have shifted the reversal potential positively with regard to EK, with either a chloride (Large & Wang, 1996) or a non-specific cation conductance (Loirand et al. 1991) being possible candidates. A non-specific cation current has recently been identified in neurons isolated from F. hepatica (Kim et al. 2002), while both K+- and Cl−-channels have been identified in lipid bilayer experiments using extracts from homogenized flukes (Jang et al. 2003). Unfortunately, this technique does not allow the tissue of origin to be identified.
The voltage-dependence of the outward K+-current in these fibres would seem to place it within the superfamily of K+-currents carried by delayed-rectifier, A-type and Ca2+-activated K+-channels (for review, see Edwards & Weston, 1995). There was no evidence of a rapidly activating, rapidly inactivating A-type current of the sort clearly present in schistosome muscle (Day et al. 1995), although such a current would be largely inactivated at a holding potential of −40 mV (Thomson, 1977; Day et al. 1995). The presence of a more rapidly decaying current in a small subpopulation of the fibres studied, suggests that more than one type of K+-channel may be present in Fasciola muscle. This was investigated further in an attempt to separate delayed-rectifier and Ca2+-dependent components of current.
Ca2+-dependence of outward K+ current
Several pieces of evidence suggest that at least some of the outward K+-current in these studies was Ca2+-dependent. Of these, the most robust is the finding that penitrem A inhibited the current by 23% at +60 mV. Penitrem A is a fungal mycotoxin which selectively blocks large-conductance Ca2+-dependent channels, also known as maxi-K or BK channels (Knaus et al. 1994; Edwards & Weston, 1995). This drug has not been reported to have any action on delayed-rectifier currents, so the partial blockade seen in the presence of penitrem A is strong evidence that depolarization of F. hepatica muscle activates BK currents, the residual current presumably being of the delayed-rectifier type. Superfusion with BAPTA-AM reduced the peak outward current at +60 mV by 44%. Again, this is consistent with the presence of a Ca2+-dependent K+-current, intracellular BAPTA leading to buffering of [Ca2+] and thus inhibiting K+-current activation. Calcium antagonists from two different classes also inhibited the outward current, further supporting the idea that it had a Ca2+-dependent component. These results must be interpreted with some caution, however, since the Ca2+-blockers were only effective at concentrations considerably higher than those that are normally required to inhibit voltage-activated Ca2+-channels in mammals. Both phenylalkamines (Zhang et al. 1999; Harper et al. 2001) and dihydropyridines (Zhabyeyev et al. 2000; Hatano et al. 2003) can inhibit K+-channels directly at these concentrations and this may explain why blockade with high concentrations of Ca2+-channel blockers was more effective than penitrem A. It should also be noted that at least one report suggests that BAPTA-AM can inhibit K+-currents by a mechanism that is independent of the Ca2+-chelating action of BAPTA itself (Urbano & Buno, 1998). Indeed, a direct inhibitory action, which may not require intracellular hydroylsis of the acetoxymethyl-ester of BAPTA, could help explain the rapid onset of action seen in some of our experiments.
A previous study on isolated muscle fibres from S. mansoni clearly demonstrated a delayed-rectifier current with very similar activation and kinetic characteristics to the conductance described here (Day et al. 1995). That study found no evidence for any Ca2+-dependent outward current, however, despite the fact that Ca2+-sensitive maxi-K channel openings had previously been shown to predominate in recordings from inside-out membrane patches from the same cell type (Blair et al. 1991). The failure of the later study to demonstrate this current may have resulted from the use of the whole-cell patch-clamp technique, in which the membrane beneath the pipette is ruptured to gain electrical access to the cell. This allows large molecules to diffuse into the cytoplasm and, with 10 mM EGTA in the pipette solution, this would strongly buffer intracellular [Ca2+], inhibiting Ca2+-activated currents (Loirand et al. 1991). When the perforated-patch technique is used, as in the current study, there is no additional Ca2+-buffering. As in the experiments on muscle from S. mansoni (Day et al. 1993), no inward ionic current was recorded using our protocols. This does not preclude the possibility that there was appreciable voltage-activated Ca2+-influx, however, as Ca2+-currents are small at room temperature. Calculations based on vascular smooth muscle fibres suggest that currents of less than 1pA may elevate cytoplasmic [Ca2+] considerably (Nelson et al. 1990), especially in the subplasmalemmal region adjacent to the ion channels (Etter et al. 1996). The recent report of a voltage-activated, inward Ca2+-current in muscle from the platyhelminth Dugesia tigrina (Cobbett & Day, 2003) suggests that similar currents may be activated during depolarization of F. hepatica muscle but may be obscured by the larger and outwardly directed K+-currents.
K+-channel pharmacology
The K+-currents in F. hepatica muscle had an unusual pharmacological profile and showed little or no sensitivity to many classical K+-channel blockers. The limited but statistically significant inhibition by penitrem-A has already been discussed as evidence for the activation of Ca2+-sensitive K+-channels. Of the other drugs tested, only Ba2+ and TPA+ were effective. Both agents have also been used as blockers of Ca2+-activated K+-channels, but their selectivity is poor (Hille, 1992). Recordings made during the wash-in period for TPA+ revealed a relative resistance to blockade for the early phase of current. This was also evident in the concentration-dependence of blockade by Ca2+-antagonists and the response to BAPTA-AM. The resulting current-profiles resembled those recorded from a subpopulation of untreated cells, consistent with the notion that the early and late phases of current represent activation of different channels.
Given that 1 mM TPA+ almost completely blocked the outward currents it was somewhat surprising that no block was seen with TEA+ up to 30 mM. Outward currents resistant to blockade by TEA+ have also been reported both in voltage-clamped muscle fibres from S. mansoni (Day et al. 1995), while the presence of such currents has been inferred from action potential recordings in flatworm neurones (Solon & Koopowitz, 1982; Keenan & Koopowitz, 1984). These neuronal currents appear to be sensitive to intracellular TEA+, however, a well-recognized feature of delayed-rectifier currents (Edwards & Weston, 1995). The membrane-permeant K+-channel blocker 4-AP reduced the sustained outward current in schistosome muscle by 50% when applied at 10 nM (Day et al. 1995), but there was no significant current-inhibition with either 4-AP or 3,4 DAP in fibres from F. hepatica. Thus, it appears that there may be pharmacological differences between electrophysiologically similar currents in these closely related organisms.
Overall then, when the voltage-dependence and kinetics of the outward K+-currents in this tissue are considered alongside limited block in the presence of penitrem A, it seems reasonable to conclude that the current was predominantly delayed-rectifier in type, but with an appreciable contribution from large-conductance Ca2+-sensitive channels. The fact that this current was completely resistant to TEA+, 4-AP and 3,4 DAP at concentrations which inhibit similar currents in mammalian tissues merits further study, as understanding the molecular basis of such differences may well open the way to new therapeutic strategies.
This work was supported by the Wellcome Trust through the award of an International Research Fellowship to Dr Kumar and a Project Grant to Dr McGeown. Dr Kumar's current address is: Division of Pharmacology and Toxicology, Indian Veterinary Research Institute, Izatnagar – 243 122 (UP), India. Dr White's current address is: B39 Anatomy-Chemistry Building, University of Pennsylvania, 3620 Hamilton Walk, Philadelphia, PA 19104, USA.
References
REFERENCES
AMBROSIO, J.,
CRUZ-RIVERA, M.,
ALLAN, J.,
MORAN, E.,
ERSFIELD, K. &
FLISSER, A. (
1997).
Identification and partial characterization of a myosin-like protein from cysticerci and adults of Taenia solium using a monoclonal antibody.
Parasitology
114,
545–553.Google Scholar
ARMSTRONG, C. M. &
GILLY, W. F. (
1992).
Access resistance and space clamp problems associated with whole cell patch clamping.
Methods in Enzymology
207,
100–122.CrossRefGoogle Scholar
BENNETT, J. L. &
KOHLER, P. (
1987).
Fasciola hepatica: action in vitro of triclabendazole on immature and adult stages.
Experimental Parasitology
63,
49–57.CrossRefGoogle Scholar
BLAIR, K. L. &
ANDERSON, P. A. V. (
1993).
Properties of voltage-activated ionic currents in cells from the brains of the triclad flatworm Bdelloura candida.
Journal of Experimental Biology
185,
267–286.Google Scholar
BLAIR, K. L. &
ANDERSON, P. A. V. (
1994).
Physiological and pharmacological properties of muscle cells isolated from the flatworm Bdelloura candida (Tricladida).
Parasitology
109,
325–335.CrossRefGoogle Scholar
BLAIR, K. L. &
ANDERSON, P. A. V. (
1996).
Physiology and pharmacology of turbellarian neuromuscular systems.
Parasitology
113,
S73–S82.CrossRefGoogle Scholar
BLAIR, K. L.,
DAY, T. A.,
LEWIS, M. C.,
BENNETT, J. L. &
PAX, R. A. (
1991).
Studies on muscle cells isolated from Schistosoma mansoni: a Ca2+-dependent K+ channel.
Parasitology
102,
251–258.CrossRefGoogle Scholar
BRICKER, C. S.,
PAX, R. A. &
BENNETT, J. L. (
1982).
Microelectrode studies of the tegument and sub-tegumental compartments of male Schistosoma mansoni: anatomical location of sources of electrical potentials.
Parasitology
85,
149–161.CrossRefGoogle Scholar
COBBETT, P. &
DAY, D. A. (
2003).
Functional voltage-gated Ca2+ channels in muscle fibers of the platyhelminth Dugesia tigrina.
Comparative Biochemistry and Physiology A Molecular and Integrative Physiology
134,
593–605.CrossRefGoogle Scholar
COONS, A. H.,
LEDUC, E. H. &
CONNOLLY, J. M. (
1955).
Studies on antibody production. I. A method for the histochemical demonstration of specific antibody and its application to a study of the hyper-immune rabbit.
Journal of Experimental Medicine
102,
49–60.Google Scholar
DAY, T. A.,
KIM, E.,
BENNETT, J. L. &
PAX, R. A. (
1995).
Analysis of the kinetics and voltage-dependency of transient and delayed K+ currents in muscle fibres isolated from the flatworm Schistsoma mansoni.
Comparative Biochemistry and Physiology
111A,
79–87.CrossRefGoogle Scholar
DAY, T. A.,
ORR, N.,
BENNETT, J. L. &
PAX, R. A. (
1993).
Voltage gated currents in muscle cells of Schistosoma mansoni.
Parasitology
106,
471–477.CrossRefGoogle Scholar
EDWARDS, G. &
WESTON, A. H. (
1995).
The role of potassium channels in excitable cells.
Diabetes Research and Clinical Practice
28,
S57–S66.CrossRefGoogle Scholar
ETTER, E. F.,
MINTA, A.,
POENIE, M. &
FAY, F. S. (
1996).
Near-membrane [Ca2+] transients resolved using the Ca2+ indicator FFP18.
Proceedings of the National Academy of Sciences, USA
93,
5368–5373.CrossRefGoogle Scholar
FAIRWEATHER, I. &
BORAY, J. C. (
1999).
Fasciolicides: efficacy, actions, resistance and its management.
Veterinary Journal
158,
81–112.CrossRefGoogle Scholar
HARPER, A. A.,
CATACUZZENO, L.,
TREQUATTRINI, C.,
PETRIS, A. &
FRANCIOLINI, F. (
2001).
Verapamil block of large-conductance Ca-activated K channels in rat aortic myocytes.
Journal of Membrane Biology
15,
103–111.CrossRefGoogle Scholar
HATANO, N.,
OHYA, S.,
MURAKI, K.,
GILES, W. &
IMAIZUMI, Y. (
2003).
Dihydropyridine Ca2+ channel antagonists and agonists block Kv4.2, Kv4.3 and Kv1.4 K+ channels expressed in HEK293 cells.
British Journal of Pharmacology
139,
533–544.Google Scholar
HILLE, B. (
1992).
Ionic Channels of Excitable Membrane (2nd Edn), pp.
130–133.
Sinauer Associates Inc.,
Sunderland, Massachusetts.
HORN, R. &
MARTY, A. (
1988).
Muscarinic activation of ionic currents measured by a new whole-cell recording method.
Journal of General Physiology
92,
145–159.CrossRefGoogle Scholar
JANG, J. H.,
KIM, S. D.,
PARK, J. B.,
HONG, S. J. &
RYU, P. D. (
2003).
Ion channels of Fasciola hepatica incorporated into planar lipid bilayers.
Parasitology
128,
83–89.Google Scholar
KEENAN, L. &
KOOPOWITZ, H. (
1984).
Ionic bases of action potentials in identified flatworm neurones.
Journal of Comparative Physiology A
155,
197–208.CrossRefGoogle Scholar
KEENAN, L. &
KOOPOWITZ, H. (
1981).
Tetrodotoxin-sensitive action potentials from the brain of the polyclad flatworm Notoplana acticola.
Journal of Experimental Zoology
215,
209–213.CrossRefGoogle Scholar
KIM, H. S.,
KAM, K. Y.,
RYU, P. D.,
HONG, S. J.,
JEON, J. S.,
JEON, B. H.,
KIM, K. J. &
PARK, J. B. (
2002).
A gadolinium and pH-sensitive hyperpolarization-activated cation current in acutely isolated single neurones from Fasciola hepatica.
Parasitology
125,
423–430.CrossRefGoogle Scholar
KNAUS, H.-G.,
McMANUS, O. B.,
LEE, S. H.,
SCHMALHOFER, W. A.,
GARCIA-CALVO, M.,
HELMS, L. M. H.,
SANCHEZ, M.,
GIANGIACOMO, K.,
REUBEN, J. P.,
SMITH, A. B. IIIRD,
KACZOROWSKI, G. J. &
GARCIA, M. L. (
1994).
Tremorgenic indole alkaloids potently inhibit smooth muscle high-conductance calcium-activated potassium channels.
Biochemistry
33,
5819–5828.CrossRefGoogle Scholar
KUMAR, D.,
McGEOWN, J. G.,
REYNOSO-DUCOING, O.,
AMBROSIO, J. R. &
FAIRWEATHER, I. (
2003).
Observations on the musculature and isolated muscle fibres of the liver fluke, Fasciola hepatica.
Parasitology
127,
457–473.CrossRefGoogle Scholar
LARGE, W. A. &
WANG, Q. (
1996).
Characteristics and physiological role of the Ca2+-activated Cl− conductance in smooth muscle.
American Journal of Physiology
271,
C435–C454.CrossRefGoogle Scholar
LINCKS, J.,
BOYAN, B. D.,
BLANCHARD, C. R.,
LOHMANN, C. H.,
LIU, Y.,
COCHRAN, D. L.,
DEAN, D. D. &
SCHWARTZ, Z. (
1998).
Response of MG63 osteoblast-like cells to titanium and titanium alloy is dependent on surface roughness and composition.
Biomaterials
19,
2219–2232.CrossRefGoogle Scholar
LOIRAND, G.,
PACAUD, P.,
BARON, A.,
MIRONNEAU, C. &
MIRONNEAU, J. (
1991).
Large conductance calcium-activated non-selective cation channel in smooth muscle cells isolated from rat portal vein.
Journal of Physiology
437,
461–475.CrossRefGoogle Scholar
MARTIN, R. J. (
1997).
Modes of action of anthelminthic drugs.
Veterinary Journal
154,
11–34.CrossRefGoogle Scholar
MURAKUMO, M.,
USHIKI, T.,
ABE, K.,
MATSUMARA, K.,
SHINNO, Y. &
KOYANAGI, T. (
1995).
Three-dimensional arrangement of collagen and elastin fibers in the human urinary bladder: a scanning electron microscopic study.
Journal of Urology
154,
251–256.CrossRefGoogle Scholar
NEHER, E. (
1992).
Correction for liquid junction potentials in patch clamp experiments.
Methods in Enzymology
207,
123–131.CrossRefGoogle Scholar
NELSON, M. T.,
PATLAK, J. B.,
WORLEY, J. F. &
STANDEN, N. B. (
1990).
Calcium channels, potassium channels, and voltage dependence of arterial smooth muscle tone.
American Journal of Physiology
259,
C3–C18.CrossRefGoogle Scholar
SAKMANN, B. &
NEHER, E. (
1984).
Patch clamp techniques for studying ionic channels in excitable membranes.
Annual Review of Physiology
46,
455–472.CrossRefGoogle Scholar
SOLON, M. &
KOOPOWITZ, H. (
1982).
Multimodal interneurones in the polyclad flatworm Alloeoplana californica.
Journal of Comparative Physiology A
147,
171–178.CrossRefGoogle Scholar
THOMSON, S. H. (
1977).
Three pharmacologically distinct potassium channels in molluscan neurones.
Journal of Physiology
265,
465–488.CrossRefGoogle Scholar
URBANO, F. J. &
BUNO, W. (
1998).
BAPTA-AM blocks both voltage gated and Ca2+-activated K+ currents in cultured bovine chromaffin cells.
Neuroreport
9,
3403–3407.CrossRefGoogle Scholar
VOLK, K. A.,
MATSUDA, J. J. &
SHIBATA, E. F. (
1991).
A voltage-dependent potassium current in rabbit coronary artery smooth muscle cells.
Journal of Physiology
439,
751–768.CrossRefGoogle Scholar
ZHABYEYEV, P.,
MISSAN, S.,
JONES, S. E. &
McDONALD, T. F. (
2000).
Low-affinity block of cardiac K+ currents by nifedipine.
European Journal of Pharmacology
401,
137–143.CrossRefGoogle Scholar
ZHANG, S.,
ZHOU, Z.,
GONG, Q.,
MAKIELSKI, J. C. &
JANUARY, C. T. (
1999).
Mechanism of block and identification of the verapamil binding domain to HERG potassium channels.
Circulation Research
84,
989–998.CrossRefGoogle Scholar
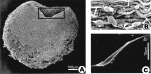
Fig. 1. Scanning electron micrographs of ventral sucker muscle from Fasciola hepatica. (A) Micrograph of a ventral sucker treated with potassium hydroxide and collagenase to reveal the muscle fibres in situ. The circumferential orientation of the underlying muscle is clearly seen on the exposed inner face of the sucker (outlined with a box). (B) Enlarged region from within the boxed area in (A) showing muscle fibres (large arrows) and their attached cell bodies (small arrowheads). (C) Individual muscle fibre isolated from the ventral sucker.
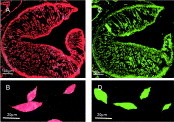
Fig. 2. Fluorescent staining for actin and myosin in ventral sucker from Fasciola hepatica. (A) Confocal optical section from ventral sucker stained for actin with TRITC-labelled phalloidin. (B) Confocal image of isolated fibres from ventral sucker labelled with TRITC-labelled phalloidin. (C) Confocal micrograph of a sucker labelled for myosin using a polyclonal antibody raised against type II myosin from Taenia solium and a FITC-conjugated secondary antibody. (D) Confocal images of isolated fibres labelled for myosin using the same antibodies.

Fig. 3. Step depolarizations from a holding potential of −40 mV evoked sustained outward currents in most muscle fibres studied. (A) Superimposed traces of the currents recorded from a single muscle fibre are shown below the applied voltage protocol. Depolarization was applied at 10 s intervals and increased in 10 mV steps from −40 mV to +60 mV. In this (and all other) records, the broken horizontal line represents zero current. (B) Plot of the mean values (±S.E.M.) of the peak current (filled symbols) and the sustained current (open symbols) at each membrane potential for 7 muscle fibres. (C) Data points represent the mean values of normalized whole cell conductance (G/Gmax) at each membrane potential (see text for details). The solid curve is a Boltzmann equation with half-maximal activation at 9 mV and a slope factor of −14·3 mV (R2 for fit=0·99). (D) Plot of the mean time-constant (τact) for activation of the outward current at each membrane potential used.

Fig. 4. Step depolarizations evoked more transient outward currents in a small percentage of muscle fibres studied. (A) Superimposed traces of the currents recorded from a single muscle fibre during voltage steps from −40 mV to +60 mV. The initial outward current decayed markedly during the maintained depolarizing step. (B) Plot of the mean values (±S.E.M.) of the peak current (filled symbols) and the sustained current (open symbols) evoked at each membrane potential for 7 fibres in which current decayed by more than 50% during the depolarizing step to +60 mV. (C) Voltage-dependent changes in the mean time-constant of activation (τact). (D) Voltage-dependent changes in the mean time-constant of current decay during depolarization to the potentials indicated (τdecay).

Fig. 5. [K+]o-dependence of tail-currents. (A) Muscle fibres were hyperpolarized to −80 mV for 10 ms and then depolarized to +60 mV for 200 ms to activate outward currents (see diagram of voltage-protocol). Repolarization to potentials varying between −120 mV and −10 mV elicited a family of tail-currents, as outlined by the boxes on the current records. All 3 sets of records were obtained from the same fibre at different [K+]o, as shown. (B) Tail-currents from A at higher amplification and on a faster time-base. (C) Mean tail-current (measured 6 ms after repolarization) plotted against membrane potential for 6 fibres exposed to the protocol in A under control conditions ([K+]o=4 mM, ellipsoid symbols; symbol size exceeds S.E.M. if no bar is shown) and with [K+]o=30 mM (rectangular symbols). Tail-current reversal potentials are indicated by arrows 1 and 2. (D) Voltage-dependence of the mean time-constants of deactivation (τdeact) for the tail currents under control conditions (filled symbols) and in high [K+]o (open symbols). No value has been plotted for high [K+]o at −20 mV as there was inadequate tail current under these conditions to allow accurate curve-fitting.

Fig. 6. Effects of K+ channel blockers on outward current. (A) Superimposed current records from a single fibre for depolarizations increased in 10 mV steps from −40 mV to +60 mV (see voltage protocol). The currents shown were recorded in control solutions (upper records) and during superfusion with 1 mM TPA+ (lower records). (B) Superimposed records showing the evolution of current blockade for a fibre that was depolarized to +60 mV every 30 s. The time elapsed from the start of TPA+ superfusion (1 mM) is shown. The sustained current was blocked more rapidly than the early current, leaving a residual transient outward current peak e.g., at 60 s. (C) Superimposed current records from a cell showing the current evoked during a step to +60 mV under control conditions and after 90 s superfusion with penitrem A (10 μM). (D) Bar charts summarizing the effects of different K+-channels blockers as assessed using the peak outward current evoked at +60 mV in the presence of the drug normalized to the control current in the same fibres. The concentrations and number of experiments summarized for each drug were as follows: TPA+ (1 mM; n=5), TEA+ (30 mM; n=5), Ba2+ (3 mM; n=4), penitrem A (10 μM; n=7), 3,4,DAP (100 μM; n=4) and 4AP (10 mM; n=8). Asterisks indicate statistically significant changes from paired controls; *P<0·05, **P<0·001 (paired t-test).

Fig. 7. Effects of verapamil on outward currents. (A) Superimposed records from a single fibre depolarized to +60 mV under control conditions and in the presence of increasing concentrations of verapamil. The sustained phase of current was selectively inhibited at the lower concentrations used. (B) Concentration-effect curve showing the mean ratio of the current amplitude at each verapamil concentration to the control current amplitude in the same fibre. Results for the peak and sustained currents are shown and each value represents the mean (±S.E.M.) for 6–8 fibres. (C) Superimposed currents recorded from a single fibre during step depolarizations increasing in 10 mV steps from −40 mV to +60 mV (see voltage protocol). The control currents (upper records) are compared with those recorded from the same cell during superfusion with 30 μM verapamil (lower records). (D) Summary of 5 experiments using the protocol in (C) showing mean values for the peak current at each membrane potential under control conditions (closed symbols) and in the presence of verapamil (open symbols).

Fig. 8. Effects of nimodipine on outward currents. (A) Current records from a single fibre depolarized to +60 mV under control conditions and in the presence of increasing concentrations of nimodipine. (B) Concentration-effect curve showing the mean ratio of the current amplitude at each nimodipine concentration to the control amplitude in the same fibre. Data for peak and sustained currents are summarized separately and each value represents the mean (±S.E.M.) for 6–7 fibres. (C) Superimposed currents recorded from a single fibre during a series of depolarizations increasing in 10 mV steps from −40 mV to +60 mV (see voltage protocol). The control currents (upper records) are compared with those recorded from the same fibre during superfusion with 30 μM nimodipine (lower records). (D) Summary of 5 experiments using the protocol in (C) showing mean values for the peak current at each membrane potential under control conditions (closed symbols) and in the presence of nimodipine (open symbols).

Fig. 9. (A) Two current records from the same fibre showing the current evoked during a step to +60 mV under control conditions and after 5 min superfusion with 50 μM BAPTA-AM. (B) Bar chart summarizing results from 5 experiments showing the effect of BAPTA-AM on the mean value (+S.E.M.) of the peak and sustained currents. P values indicate statistically significant reductions from control (paired t-test).
 You have
Access
- 3
- Cited by