Nearly 50% of patients in healthcare facilities receive a prescription for an antimicrobial, up to half of which are inappropriate and/or unnecessary. Reference Magill, Edwards and Beldavs1 This overuse not only increases the burden of antimicrobial-resistant organisms but also puts patients, including those not receiving these drugs, at risk for Clostridioides difficile infection. Reference Brown, Valenta, Fisman, Simor and Daneman2
To address the issue, the United States National Strategy for Combating Antibiotic Resistant Bacteria proposed the establishment of robust antimicrobial stewardship programs (ASPs) to achieve the ambitious goal of a 20% reduction of inpatient antibiotic use by 2020. 3 The result has been implementation of regulatory requirements for establishing ASPs. Unfortunately, the regulations are based on a checklist approach, not on the achievement of improvements or establishment of benchmarks for utilization. As such, the optimal approach to achieve sustained reductions in unnecessary therapy remains unknown. Reference Pollack and Srinivasan4
Most literature on the topic of ASPs has been published from large academic medical centers, where physicians are employed by the health system. Very little research has been published on the design, implementation, or effects of ASPs to reduce antibiotic prescriptions at nonacademic hospitals that specifically utilize private practice infectious disease (ID) and other physicians. Here, we describe implementation and impact of such a program at a large, nonacademic, acute-care hospital in the eastern United States.
Methods
Setting
The Valley Hospital (TVH) is an acute-care nonteaching hospital with 431 licensed beds located in northern New Jersey. In 2020, TVH had 41,345 inpatient admissions. Its division of infectious diseases is staffed by a private practice group.
General interventions
In early 2013, the following 2 processes were implemented to address overuse of broad-spectrum intravenous antimicrobials: (1) reduction in the computerized antimicrobial ordering duration from 7 to 4 days and (2) a pharmacist-driven ASP. Poor initial medical staff compliance led to incorporation of the clinical expertise of the ID group into the ASP. The program was given authority to discontinue unnecessary therapy and automatically covert to oral. Disagreements require formal ID consultation and providers have the option to appeal to the chief medical officer (CMO). This approach has received the full support of the hospital administration, and the medical staff bylaws were amended accordingly.
Specific stewardship steps
Antimicrobial therapy is considered unnecessary if used for noninfectious syndromes, nonbacterial infections, and therapy beyond an indicated duration. Reference Spivak, Cosgrove and Srinivasan5 Rounds occur 7 days a week, and ∼10–15 cases are reviewed daily. This number has remained relatively constant over time.
Stewardship efforts generally focus on patients who have received at least 2 days of therapy (DOT). Providers are contacted directly and informed about decisions regarding unnecessary therapy and discontinuations. Continued therapy is re-evaluated daily. Oral conversion occurs automatically without provider notification. Therapeutic durations are chosen in accordance with evidence-based recommendations. Reference Spellberg and Rice6 An electronic note is entered by pharmacy documenting the change. The program requires 0.7 pharmacist full-time equivalents (FTE) and ∼1 hour per day of ID physician time. The ID group receives compensation for its services through a contractual agreement with the hospital.
CDI interventions
At TVH, CDI is deemed hospital onset in accordance with the National Health Safety Network definition. 7 C. difficile testing is via nucleic acid amplification (GeneXpert, Cepheid, Sunnyvale, CA). In March of 2016 a review of our positive tests suggested that many did not meet the clinical definition of CDI. We amended our policy, provided education, and modified our computerized ordering protocol. Specifically, for those specimens received from patients who would meet the case definition of hospital-onset CDI if the test is positive, approval by an infection preventionist is required before processing.
Analysis
To analyze DOT and CDI rate trends, we plotted data using control charts, with any point above or below the upper or lower control limits, or 2 of 3 points between the 95% confidence interval limits and the control limits, considered statistically significant changes from the baseline. Reference Carey and Lloyd8 Control and confidence interval limits were calculated based on values prior to the intervention to detect special cause variation from the baseline. For rates with insufficient baseline data to calculate control limits, the χ Reference Brown, Valenta, Fisman, Simor and Daneman2 test was used, with P ≤ .05 considered significant. This study was determined not to constitute human subjects research by the hospital the institutional review board.
Results
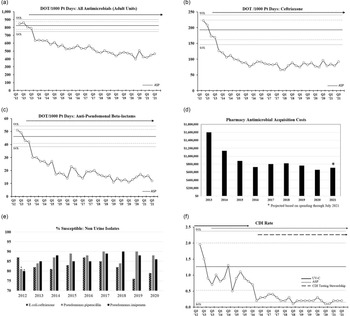
During the baseline period from October 2012 to March 2013, an average of 860 DOT per 1,000 patient days of antimicrobials were administered per month (Fig. 1A). Implementation of the initially pharmacist-only stewardship protocol resulted in a <10% reduction in days of therapy. After involvement of the ID group in late 2013, a 20% reduction over 6 months followed. Thereafter, a steady reduction occurred to a new baseline of 400–500 DOT per 1,000 patient days. Reductions have been consistent among all classes of antimicrobials (Fig. 1B and C).
Impact of antimicrobial stewardship programs (ASPs) on antibiotic utilization, cost, susceptibilities, and CDI rates. (A) Quarterly changes in administered days of therapy (DOT) per 1,000 patient days. (B) Changes in ceftriaxone administered days of therapy per 1,000 patient days. (C) Changes in antipseudomonal β-lactams (ceftazidime, cefepime, imipenem, meropenem, piperacillin-tazobactam) administered days of therapy per 1,000 patient days. (D) Yearly changes in pharmacy antimicrobial acquisition costs. (E) Changes in susceptibilities of inpatient non urinary isolates of E. coli to ceftriaxone and Pseudomonas aeruginosa to piperacillin and imipenem. (F) Changes in quarterly CDI rate (cases per patient days ×1,000). For control charts, any data point above or below the upper control limit (UCL) or lower control limit (LCL) (solid lines), or 2 of 3 data points between the 95th percentile lines (dashed lines) and the UCL/LCL are considered statistically significant shifts from the baseline process. *P < .05.

No concordant rise in complications, such as increased ICU admissions or 30-day sepsis readmission rates, have been observed. Furthermore, according to the CMS, the percentage of TVH patients who received appropriate care for severe sepsis and septic shock was higher than national and state averages (72% vs 65% and 60%, respectively), and the respective death rates for COPD (9.7% vs 8.1%) and pneumonia (15.4% vs 15.3%) were no different than the national rate. 9
Antibiotic acquisition costs have declined by >50% (Fig. 1D). Pseudomonas aeruginosa susceptibilities to piperacillin and imipenem statistically increased, whereas E. coli sensitivities to ceftriaxone did not significantly change (Fig. 1E). The hospital’s CDI rate has declined >90%. The most significant reduction occurred after changing our testing protocol; P< .05) (Fig. 1F).
Discussion
We have demonstrated that significant and sustained reductions in antimicrobial usage and CDI rates, with increases in pseudomonal susceptibilities to key antibiotics, are achievable through a multifaceted ASP in a nonacademic hospital setting. Prior work describing the effect of ASPs in community hospitals, involving smaller facilities that lacked on-site ID physicians, is limited. Reference Stenehjem, Hersh and Buckel10 Our results confirm that unnecessary therapy is commonplace in US hospitals, but by implementing ASPs based on fundamental clinical principles, improved antibiotic prescriptions can be achieved even in settings where many physicians are in private practice. This ASP approach required significant clinical infectious disease experience (both pharmacy and ID physician) decision-making confidence and an appreciation that even 1 unnecessary antimicrobial dose can be harmful.
This study had several limitations. It was conducted at a single center with a nonrandomized design. However, the study was quasi-experimental, using a before-and-after design with control charts setting control limits based on the baseline period. The effects seen were temporally related to the interventions implemented; thus, there is a reasonable likelihood that they were driven by the changes implemented. Medical staff acceptance of this type of ASP, particularly in nonteaching facilities, could be suboptimal, particularly at onset. In retrospect, some of the initial skepticism and resistance may have been because ASPs were novel in 2013. Nevertheless, the program has rarely relented or allowed administration of therapy that was determined to be truly unnecessary. Notably, a level of trust has evolved that has actually improved over time, and disagreements have virtually disappeared.
Safely averting the administration of thousands of doses of unnecessary and potentially harmful therapeutics exemplifies high-value care. We believe that these results could potentially serve as a benchmark for appropriate utilization, particularly in community hospitals. Importantly we hope that our experience can serve as an inspiration for those considering similar ASPs.
Acknowledgments
Financial support
No financial support was provided relevant to this article.
Conflicts of interest
All authors report no conflicts of interest relevant to this article.