I. INTRODUCTION
The active layer in an organic solar cell is a thin light-absorbing and charge-generating film sandwiched between two electrical contacts that collect the photogenerated charges. In this layer at least two different organic molecules, acting as electron-donor and electron-acceptor, are mixed. The degree of mixing, which strongly depends on the processing conditions, has a large impact on the power conversion efficiency of the solar cell. Reference Peet, Heeger and Bazan1–Reference Liu, Gu, Jung, Jo and Russell5 Therefore, it is of great importance to be able to image the active layer morphology. Microscopy techniques such as atomic force microscopy (AFM) and scanning electron microscopy (SEM) are routinely used to image the structure of the surface of the active layer. Soft X-ray spectroscopy techniques, such as X-ray photoelectron spectroscopy (XPS) and near-edge X-ray absorption fine structure (NEXAFS) spectroscopy, yield chemical information and can be used to determine the composition at the surface of the blend film. Reference Hansson, Ericsson, Holmes, Rysz, Opitz, Campoy-Quiles, Wang, Barr, Kilcoyne, Zhou, Dastoor and Moons6–Reference Anselmo, Dzwilewski, Svensson and Moons8 The rich fine structure of NEXAFS spectra at the C1s-edge is particularly useful in the challenging quest to distinguish the two organic molecules (donor and acceptor molecules) and provide chemical contrast with a variety of surface sensitivities. Even other absorption edges, such as O1s and N1s, in their respective photon energy ranges, are of interest for many common conjugated molecules.
Imaging of the structure in the bulk of the active layer is frequently achieved using transmission electron microscopy (TEM) Reference Backe, Lindqvist, Mendaza, Gustafsson, Wang, Andersson, Muller and Olsson9–Reference Yang, van Duren, Janssen, Michels and Loos13 and the 3-dimensional technique electron tomography. Reference Backe, Lindqvist, Mendaza, Gustafsson, Wang, Andersson, Muller and Olsson9,Reference Barrau, Andersson, Zhang, Masich, Bijleveld, Andersson and Inganas14–Reference van Bavel, Sourty, de With, Veenstra and Loos17 The corresponding soft X-ray technique that provides images of chemical composition through the bulk of the film is scanning transmission X-ray microscopy (STXM). Reference Hansson, Ericsson, Holmes, Rysz, Opitz, Campoy-Quiles, Wang, Barr, Kilcoyne, Zhou, Dastoor and Moons6,Reference Holmes, Burke, Sista, Barr, Magurudeniya, Stefan, Kilcoyne, Zhou, Dastoor and Belcher10,Reference Collins and Ade18–Reference McNeill, Watts, Thomsen, Belcher, Greenham, Dastoor and Ade22 The complementarity of surface sensitive NEXAFS spectroscopy and high-resolution microscopy illustrates that soft X-ray techniques offer interesting opportunities for the analysis of the compositions at the nano-scale in materials for organic photovoltaics. Reference McNeill and Ade23 Moreover, the perspectives of 3D chemical mapping for organic electronic devices by STXM tomography are very promising. Reference Obst, Wang and Hitchcock24
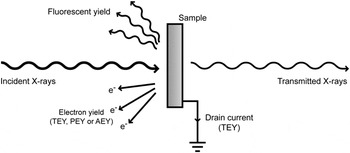
X-ray absorption in matter shows sharp step-like increases at certain energies, called absorption edges. Reference Thompson, Attwood, Gullikson, Howells, Kim, Kirz, Kortright, Lindau, Liu, Pianetta, Robinson, Scofield, Underwood, Williams and Winick25 In the region close to the edge, strong fluctuations in absorption can occur at different photon energies, known as near-edge absorption fine structure. Reference Stöhr26,Reference Nahid, Gann, Thomsen and McNeill27 Since a variable photon energy is required to detect these absorption resonances, NEXAFS measurements are normally performed at synchrotron facilities. As the photon energy is scanned across an absorption edge, core-level electrons (e.g., from the C1s orbital) are excited into unoccupied electronic states. In the relaxation process that follows, energy is released either by the emission of a photon or by the ejection of an Auger electron. A quantitative measure of the absorption is obtained by detecting the emitted photons (known as fluorescent yield) or the electrons (known as electron yield). In addition, by directly counting the number of transmitted X-rays through a sample and comparing it to the incident intensity, the absorption from the full sample thickness is obtained. At the C1s edge, this process requires a thin sample, ideally 100–200 nm, Reference Hub, Wenzel, Raabe, Ade and Fink28 either freestanding or mounted on a transparent substrate. Compared to electron yield, fluorescent yield (FY) gives information from deep within the sample than electron yield since the escape depth of photons is much higher than for electrons, while transmission mode gives information from the full sample thickness. The different detection modes are illustrated in Fig. 1.
Different possible detection modes in NEXAFS spectroscopy.

The total electron yield (TEY) is measured by detecting all electrons that manage to escape the sample, often by measuring the sample drain current. For partial electron yield (PEY) measurements, a channeltron detector is used together with a retarding voltage that prevents low kinetic energy electrons from reaching the detector. Since electrons originating from deep within the sample are likely to have lost energy due to inelastic scattering processes, PEY has a higher surface sensitivity than TEY. A third option for electron yield detection is Auger electron yield (AEY) which is the most surface sensitive of the different electron yield modes. AEY is measured using an electron energy analyzer in which the detection window is chosen to match the kinetic energy of electrons emitted by an Auger transition; i.e., electrons that have lost no or little energy to inelastic scattering can be measured selectively.
Organic molecules, such as those used in organic photovoltaics, have particularly rich and detailed features at the carbon edge, Reference Dhez, Ade and Urquhart29,Reference Watts, Swaraj, Nordlund, Luning and Ade30 making it possible to use NEXAFS spectra to identify a molecule by its molecular fingerprint. Once the spectra of the pure components are available, the composition of multicomponent blends can be determined by fitting the spectrum of the blend to a linear combination of the pure components’ spectra. The coefficients in the linear combination give the volume ratio of the components. Vertical variations in the blend film composition can be determined by combining the information gained from the different detection modes (FY, TEY, PEY, AEY) described above.
STXM is a technique that combines the chemical contrast of NEXAFS spectroscopy with high-resolution microscopy, providing composition maps. In materials that are mixtures of components whose NEXAFS spectra differ, STXM can be used to map the composition. The discrete photon energies where the difference in absorption between the components is the highest are selected.
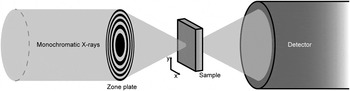
In STXM, a monochromatic X-ray beam is focused by mirror systems onto a Fresnel Zone Plate (FZP) as schematically shown in Fig. 2, i.e., a setup with closely spaced rings with a central blocking plate that gives rise to a circular diffraction pattern. After the FZP, an order sorting aperture (OSA) is positioned so that it blocks all diffraction orders except the first, i.e., the zeroth order unfocused light and higher order diffractions. Thus, by adjusting the distance between the FZP and the sample, a well-focused spot is used to probe the sample. The smallest possible spot size is obtained by using spatially coherent light and, for a given X-ray wave length, the spot size is limited by the outer zone width of the FZP. Reference Attwood31,Reference Kilcoyne, Tyliszczak, Steele, Fakra, Hitchcock, Franck, Anderson, Harteneck, Rightor, Mitchell, Hitchcock, Yang, Warwick and Ade32 The focusing movement (z-direction) is typically achieved by stepper motors. In the x and y directions, i.e., the scanning of the sample and positioning of the FZP, the position control is done by both stepper motors and piezoelectric drives. A laser interferometer system is used to control the relative positions of the FZP and the sample, enabling a spatial resolution of 30–50 nm. The control systems for STXM have previously been described elsewhere for the equipment at ALS Reference Kilcoyne, Tyliszczak, Steele, Fakra, Hitchcock, Franck, Anderson, Harteneck, Rightor, Mitchell, Hitchcock, Yang, Warwick and Ade32 and at SLS. Reference Flechsig, Quitmann, Raabe, Böge, Fink and Ade33,Reference Raabe, Tzvetkov, Flechsig, Boge, Jaggi, Sarafimov, Vernooij, Huthwelker, Ade, Kilcoyne, Tyliszczak, Fink and Quitmann34 On the secondary side of the sample, the transmitted X-rays are detected by a scintillator and photomultiplier tube.
Schematic illustration of a STXM setup. Monochromatic X-rays are focused onto the sample by a Fresnel Zone Plate (FZP). The sample is raster scanned relative to the beam while the transmitted X-rays are detected. Unwanted diffraction orders from the zone plate are blocked by an order sorting aperture placed between the FZP and the sample (not shown in the figure).

The set of X-ray absorption (or transmission) maps obtained at the different discrete photon energies forms an image stack. The image stack can be completed by an X-ray absorption map taken at the high photon energy end (the so called post-edge), which gives the distribution of the total carbon content in the film and for which the contrast depends on the thickness and density variations in the sample. The chemical composition maps that visualize the distribution of the different blend components are then obtained from a linear combination of the pristine component spectra at each pixel. This corrects for thickness variations, since the composition maps are derived from the contribution of each component to the total absorption. The chemical composition at each pixel is the average composition through the film at that pixel.
In addition to the chemical mapping based on a discrete set of STXM images in an image stack, the local chemical composition can also be determined by measuring the NEXAFS spectrum at several points along a line. The NEXAFS spectra are averaged over a chosen part of the line and then deconvoluted to determine a linear combination of the pure components NEXAFS spectra.
During the last decade, synchrotron-based soft X-ray based spectroscopy and microscopy techniques have been used extensively to analyze organic photovoltaics (OPV) materials. C1s-NEXAFS spectroscopy has made it possible to determine the chemical composition on the surface of a polymer:fullerene blend film, which was often found to differ from the bulk composition Reference Hansson, Ericsson, Holmes, Rysz, Opitz, Campoy-Quiles, Wang, Barr, Kilcoyne, Zhou, Dastoor and Moons6,Reference Anselmo, Dzwilewski, Svensson and Moons8 due to vertical phase separation in the active layer. Using the different NEXAFS modes, TEY, PEY, and AEY, the composition profile near the surface has been determined. In this respect, the method is complementary to X-ray and neutron reflectometry techniques Reference Kiel, Kirby, Majkrzak, Maranville and Mackay35–Reference Ro, Akgun, O’Connor, Hammond, Kline, Snyder, Satija, Ayzner, Toney, Soles and DeLongchamp37 and to depth profiling techniques, such as secondary ion mass spectrometry. Reference Hansson, Ericsson, Holmes, Rysz, Opitz, Campoy-Quiles, Wang, Barr, Kilcoyne, Zhou, Dastoor and Moons6,Reference Anselmo, Lindgren, Rysz, Bernasik, Budkowski, Andersson, Svensson, van Stam and Moons38–Reference Treat, Brady, Smith, Toney, Kramer, Hawker and Chabinyc42 NEXAFS at C1s and O1s edges have also shown to be very useful for the study of photodegradation of conjugated molecules, in particular fullerene derivatives. Reference Anselmo, Dzwilewski, Svensson and Moons43–Reference Hansson, Lindqvist, Ericsson, Opitz, Wang and Moons45 The resonances in the experimental spectra can be assigned to specific molecular moieties by comparing them with NEXAFS spectra calculated by density functional theory. Reference Brumboiu, Ericsson, Hansson, Moons, Eriksson and Brena46–Reference Patel, Su, Luo, Wang, Perez, Fischer, Prendergast, Bazan, Heeger, Chabinyc and Kramer48
Some polymer blend films exhibit lateral phase separation, i.e., the formation of islands in a homogeneous phase. These islands are usually rich in one or the other blend component. Soft X-ray microscopy techniques, such as STXM, make it possible to image these domain structures within phase separated blend films with a resolution of approximately 35 nm Reference Ade, Watts, Swaraj, McNeill, Thomsen, Belcher and Dastoor49 and to distinguish chemically the two phases. STXM enables the determination of local composition in domains of phase separated blend films Reference Hansson, Ericsson, Holmes, Rysz, Opitz, Campoy-Quiles, Wang, Barr, Kilcoyne, Zhou, Dastoor and Moons6 or in the core and shell of organic core–shell nanoparticles. Reference Holmes, Burke, Sista, Barr, Magurudeniya, Stefan, Kilcoyne, Zhou, Dastoor and Belcher10 The optimal domain size in polymer solar cells is generally thought to be 10–20 nm, which is comparable to the exciton diffusion length in conjugated polymers. Such small domains are below the present resolution limit of STXM.
AFM and TEM are also commonly used for morphology studies of bulk heterojunction devices and provide a higher resolution, but the information retrieved by these techniques does not contain the detailed chemical contrast that can be provided by STXM. For an overview of the complementary methods used for studying the vertical and lateral morphology of the active layer in polymer solar cells, we refer to our earlier work. Reference Hansson, Ericsson, Holmes, Rysz, Opitz, Campoy-Quiles, Wang, Barr, Kilcoyne, Zhou, Dastoor and Moons6 Developments of combined AFM-IR microscopy, X-ray photoemission electron microscopy (XPEEM), and energy-filtered TEM techniques are very promising for assessing the nanostructure morphology in organic solar cells, since they will push the resolution limit while providing chemical contrast.
In summary, soft X-ray methods are relevant for OPV materials in resolving several key questions: (i) determining local composition in films with lateral composition gradients, (ii) determining surface composition in films with vertical composition gradients, (iii) determining degradation of blend components.
Here we study poly[2,3-bis-(3-octyloxyphenyl)quinoxaline-5,8-diyl-alt-thiophene-2,5-diyl] (TQ1), which is an easily synthesized polymer Reference Wang, Hou, Wang, Hellstrom, Zhang, Inganäs and Andersson50 that has demonstrated a solar cell power conversion efficiency (PCE) of 7%. Reference Kim, Yeom, Kim and Yang51 Furthermore, we study the fullerene derivatives [6,6]-phenyl C71-butyric acid methyl ester (PC70BM) and [6,6]-phenyl-C61-butyric acid methyl ester (PC60BM), and blends of TQ1 and PC70BM. We demonstrate how the local composition of a blend film of TQ1 and PC70BM is affected by the sample preparation technique and by degradation and how a combination of microscopy and spectroscopy can be used to correctly determine the local composition in TQ1:PC70BM blend films.
II. EXPERIMENTAL SECTION
A. Materials
The synthesis of TQ1 is described elsewhere. Reference Wang, Hou, Wang, Hellstrom, Zhang, Inganäs and Andersson50 The number average and weight average molecular weights of TQ1 were M n = 71 kg/mol and M w = 265 kg/mol. PC70BM (purity > 99%) was purchased from Solenne BV (Groningen, The Netherlands). PEDOT:PSS (Clevios P VP AI 4083) was purchased from Heraeus Precious Metals GmbH & Co. KG (Hanau, Germany).
B. Sample preparation
Blend solutions of TQ1:PC70BM 1:3 w/w were prepared either in chloroform (CF) at a concentration of 15 mg/mL or in chlorobenzene (CB) at 20 mg/mL. This corresponds to a 1:2.5 v/v ratio, using densities of 1.1 g/cm3 for TQ1 and 1.3 g/cm3 for PC70BM, Reference Kiel, Kirby, Majkrzak, Maranville and Mackay35 assuming that densities for PC60BM and PC70BM are similar. Reference Kiel, Kirby, Majkrzak, Maranville and Mackay35,Reference Zhang52 There are, however, different values for PCBM densities stated in the literature, for example, Rispens et al. reported higher values for crystalline PC60BM. Reference Rispens, Meetsma, Rittberger, Brabec, Sariciftci and Hummelen53 The density values used give a density ratio of 1.18 for the PC70BM/TQ1 densities. All blend ratios are further on given as v/v ratios.
Substrates were cut from silicon wafers [n-type, (001) orientation and resistivity 0.001–0.003 Ω cm] and cleaned using the standard RCA-method, Reference Kern54–Reference Kissinger and Kissinger56 without the final HF-etching step to leave the surface hydrophilic. Immediately after the cleaning, a 40 nm thick layer of PEDOT:PSS was spin-coated on top of the substrates after filtering through a 0.45 µm nylon filter.
The Si3N4 membranes used for TEM had a thickness of 100 nm and were purchased from Silson Ltd. (Southam, United Kingdom). The Si3N4 membranes used for STXM were purchased from Norcada, Inc. (Edmonton, Canada), had a thickness of 10 nm, and were coated by 5 nm of SiO2 for increased hydrophilicity. All Si3N4 substrates were UV-ozone treated for 5 min prior to spin-coating. Cu-grids (3 mm diameter, 300 mesh) were purchased from Ted Pella Inc. (Redding, California).
The TQ1:PC70BM blend films were deposited by spin-coating. Solution concentrations and spin speeds were chosen to give a final film thickness of approximately 100 nm, although for films spin-coated from CF, the film thickness varies between 100 and 140 nm due to the formation of striations. The film thickness was measured by making a scratch in the film with a scalpel and measuring across the scratch with the tip of an AFM (Nanoscope IIIa Multimode with Veeco Metrology group, Freemont, California). The thicknesses of pristine TQ1 and PC70BM films were, in addition to AFM measurements on SiO x /Si substrates, confirmed by cross section SEM of films on Cu-grids to be 100 nm for TQ1 and 90 nm for PC70BM.
Films were deposited on Cu TEM grids by floating them off from PEDOT:PSS coated silicon substrates onto deionized water and then collecting them on the Cu grids. Films were also made spin-coated directly onto PEDOT:PSS-coated Si3N4 membranes for TEM, and directly onto SiO2-covered Si3N4 membranes for STXM.
C. Characterization
The TEM measurements were performed on a JEOL 1200 EXII (JEOL Ltd., Tokyo, Japan) at an accelerating voltage of 80 kV. SEM images were acquired with a LEO Gemini 1530 (Carl Zeiss AG, Oberkochen, Germany), using an acceleration voltage of 3 kV and detecting secondary electrons.
TEY and AEY NEXAFS spectra were measured at the D1011 beamline at MAX-IV, Sweden. The C1s absorption edge was measured in the photon energy range 276–327 eV at 55° incidence angle. For TEY, the sample drain current was measured and AEY was measured using an upgraded VG Scienta SES200 (Uppsala, Sweden) in the electron kinetic energy range 260–310 eV. The spectra were divided by the corresponding spectrum of a freshly in situ Ar-sputtered Au/mica sample and then normalized in the high photon energy region according to the “Stable monitor method”. Reference Stöhr26,Reference Watts, Thomsen and Dastoor57 The photon energy scale was calibrated by measuring the spectrum of highly ordered pyrolytic graphite (HOPG) and using the position of the exciton resonance at 291.65 eV as an energy reference. Reference Watts and Ade58
The STXM measurements were performed on beamline 5.3.2.2 at the Advanced Light Source (ALS) in Berkeley, California, Reference Kilcoyne, Tyliszczak, Steele, Fakra, Hitchcock, Franck, Anderson, Harteneck, Rightor, Mitchell, Hitchcock, Yang, Warwick and Ade32 and on the PolLux beamline (X07DA) at the Swiss Light Source (SLS), Switzerland. Reference Flechsig, Quitmann, Raabe, Böge, Fink and Ade33,Reference Raabe, Tzvetkov, Flechsig, Boge, Jaggi, Sarafimov, Vernooij, Huthwelker, Ade, Kilcoyne, Tyliszczak, Fink and Quitmann34 Both are bending magnet based beamlines with photon energies in the range 250–780 eV at 5.3.2.2 and 250–1600 eV at PolLux. The samples were either mounted on copper grids or on Si3N4 membranes, and measured either in a helium atmosphere at 0.33 atm (ALS) or in vacuum (SLS). The samples were raster scanned with respect to the X-ray beam and the transmitted X-rays were detected by a scintillator and a photomultiplier tube. NEXAFS spectra at the C1s edge were measured on pristine TQ1 and PC70BM films and the photon energies that gave the highest contrast between the two materials (284.3 and 287.3 eV) were chosen for the image scans. The blend compositions were determined by fitting the NEXAFS spectra of the blends to linear combinations of thickness scaled spectra of pristine TQ1 and PC70BM. This way, the composition is obtained as volume ratios of the pristine components. Image analysis was performed with the aXis2000 software package (http://unicorn.mcmaster.ca/aXis2000.html). Further details on the experiment and data analysis can be found elsewhere. Reference McNeill, Watts, Thomsen, Belcher, Greenham and Dastoor21 The STXM results shown in Figs. 3(a)–3(c) and 5 were acquired at ALS and those shown in Figs. 3(d), 6, and 7(a) were acquired at SLS. Since the thickness of the pristine films was known, tabulated values for the mass absorption coefficient Reference Henke, Gullikson and Davis59 along with the known stoichiometry could be used to estimate the densities of TQ1 and PC70BM from the post-edge intensities. Reference Watts, Warnicke, Pilet and Raabe60 This allows us to estimate the PC70BM/TQ1 density ratio to 1.15 which rationalizes our used density values for TQ1 and PC70BM.
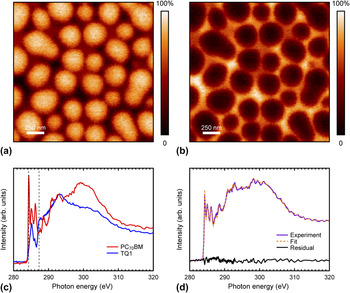
STXM compositional maps showing the volume concentration of (a) PC70BM and (b) TQ1 in a TQ1:PC70BM 1:2.5 blend film spin-coated from chlorobenzene and floated onto a Cu grid. The color scale is such that light colors correspond to higher component concentrations. (c) C1s NEXAFS spectra of pristine TQ1 and PC70BM. Vertical dashed lines indicate the photon energies chosen for imaging the blend films. (d) C1s NEXAFS spectrum of a TQ1:PC70BM blend film spin-coated from chlorobenzene and floated onto a Cu grid, shown together with the fitted linear combination of the pristine components’ spectra and the residual of the fit.

III. RESULTS AND DISCUSSION
A. Local composition determination
Figures 3(a) and 3(b) show STXM compositional images, derived from image scans taken at the C1s-edge with different X-ray photon energies of a blend thin film of TQ1 and PC70BM spin-coated from chlorobenzene and floated onto a Cu grid. This blend system is an example of a thin film exhibiting strongly phase-separated domains. Domains formed through liquid–liquid phase separation do not have a pure composition but rather are enriched in one of the blend components. Blend ratio, thermodynamic properties expressed as Flory–Huggins interaction parameters, as well as drying kinetics related to the particular choice of solvent all affect the form and composition of the domains. To determine the composition in a domain, chemical contrast and a resolution higher than the domain size are needed. (Note that the domain size is much larger than the resolution in this example, and also that smaller domains can be analyzed by STXM.). The STXM maps for TQ1 and PC70BM are taken with different monochromatic X-ray photon energies, which preferably match the absorption resonances of TQ1 and PC70BM. However, in practice it is often not a resonance peak, but rather an energy where the absorption contrast is maximized, which is the best choice [Fig. 3(c)]. From these images, the polymer- and fullerene-rich domains can be readily identified and the local compositions of the blend determined. By averaging the composition over the entire scan, it is possible to compare the measured film composition with the bulk blend ratio that was used to prepare the spin-coated film. In this case we find that the ratio is 1:1.5, which does not quite match the expected 1:2.5 feed ratio. There are several possible origins for this mismatch, including (a) spectral fitting error, (b) sample preparation methods, and (c) selective degradation of one of the blend components.
In Fig. 3(d) we present a NEXAFS spectrum taken in transmission mode from a TQ1:PC70BM 1:2.5 blend film spin-coated from chlorobenzene and floated onto a Cu grid. The blend film composition can be calculated by fitting this spectrum to a linear combination of the pristine components’ NEXAFS spectra. By doing so, the absorption at many more photon energies is taken into account than for the STXM compositional map. The resulting fit, also shown in Fig. 3(d), gives a blend composition of 1:1.9. This value is closer to the 1:2.5 feed ratio used to prepare the films than the value obtained by averaging the STXM compositional maps: highlighting that a proportion of the discrepancy most likely originates from fitting error. Although recording the entire NEXAFS spectrum point by point to obtain the STXM compositional maps is unfeasible due to time and X-ray damage constraints, it is very useful for determining local composition at a point or along a line. In fact, the procedure of fitting the full spectrum measured in transmission mode is identical to that reported earlier for determining the surface composition of blend films from electron yield NEXAFS spectra. Reference Hansson, Ericsson, Holmes, Rysz, Opitz, Campoy-Quiles, Wang, Barr, Kilcoyne, Zhou, Dastoor and Moons6,Reference Anselmo, Lindgren, Rysz, Bernasik, Budkowski, Andersson, Svensson, van Stam and Moons38,Reference Hansson, Lindqvist, Ericsson, Opitz, Wang and Moons45 A small residual [Fig. 3(b)] indicates a good fit. However, the 1:1.9 TQ1:PC70BM blend ratio obtained from the fit still does not completely agree with the expected 1:2.5 feed ratio. In Sec. III. B, we show how the choice of sample preparation technique can affect the film composition.
B. Sample preparation techniques
When measuring a NEXAFS spectrum by detecting the electron yield, the sample can be deposited on a wide variety of substrates, such as silicon, metal- or PEDOT:PSS-coated substrates, because only the near surface region is probed and hence the substrate is largely inconsequential for the measurement. The only requirement is that a good electrical contact be formed between the sample holder and the sample, but that contact can be provided to the back as well as the front side of the sample. When measuring a NEXAFS spectrum in transmission mode on the other hand, as is usually the case for STXM measurements, substrates that are highly transparent to X-rays are required. Two common methods for STXM sample preparation are (i) the so called lift-off/float-on technique: the thin film is deposited on a sacrificial substrate, e.g., glass or silicon coated with poly(3,4-ethylenedioxythiophene) polystyrene sulfonate (PEDOT:PSS) or another water soluble polymer. The substrate is then placed in contact with water so that the underlying PEDOT:PSS layer dissolves and the active layer is left floating on the water surface. The film can then be picked up by a new substrate, here the Cu-grid. (ii) Thin films are deposited directly onto a silicon nitride membrane which is supported by a silicon frame.
The deposition on Cu grids by the lift-off/float-on technique is common practice for the preparation of samples for TEM. It is practical for STXM samples as well, and the grid lines can make focusing easier, in addition to being helpful if one wants to retrace a specific area for later follow-up measurements.
However, the drawback of using Cu grids is the uncertainty introduced by the direct contact with water.
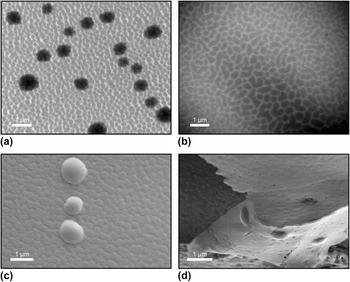
Figures 4(a) and 4(b) show TEM images of TQ1:PC70BM blend films spin-coated from chloroform. Figure 4(a) shows a film lifted off from a water surface and placed on a Cu grid while Fig. 4(b) shows a film spin-coated directly onto a Si3N4 membrane. Laterally phase-separated domains are clearly visible, with a PC70BM-rich phase forming islands surrounded by a TQ1-rich phase. Reference Hansson, Ericsson, Holmes, Rysz, Opitz, Campoy-Quiles, Wang, Barr, Kilcoyne, Zhou, Dastoor and Moons6 In addition to the phase separated structure, micrometer sized, dark spots are visible in the film floated onto Cu grids, but not in the film on the Si3N4 membrane.
Electron microscopy images of TQ1:PC70BM 1:2.5 films. (a) TEM image of a film lifted off from a PEDOT:PSS-coated Si substrate onto a water surface and floated onto a Cu grid. (b) TEM image of a film spin-coated directly onto a PEDOT:PSS-coated Si3N4 membrane. (c) SEM image of the bottom side of a film floated onto a Cu grid, showing droplet shaped aggregates. (d) SEM image of a film floated onto a Cu grid that has then been sliced with a scalpel and folded over, allowing the film and the aggregates to be viewed from the side.

Figures 4(c) and 4(d) show SEM images of TQ1:PC70BM blend films spin-coated from chlorobenzene, lifted off from a water surface and placed on a Cu grid. Figure 4(c) shows the bottom side of the film. Figure 4(d) shows a film placed on a Cu grid and sliced by a scalpel, allowing the film to be imaged from the side. Situated at the bottom side of the films, micrometer sized, droplet shaped aggregates can be clearly observed. These aggregates appear regardless of whether the TQ1:PC70BM 1:2.5 films are spin-coated from chloroform or chlorobenzene.
The main difference in sample preparation between the films on Cu-grids and on Si3N4 is that the films on Cu-grids have been in direct contact with water. Therefore, the appearance of the aggregates is very likely linked to the lift-off/float-on procedure. Also, from the observation of aggregates at the bottom of the film, another reasonable suggestion could be that they are undissolved PEDOT:PSS that remain on the bottom of the film.
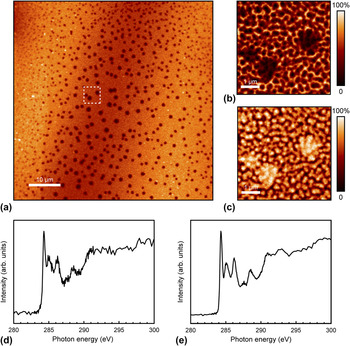
To chemically identify the aggregates, STXM measurements were performed. In Fig. 5(a), a TQ1:PC70BM 1:2.5 film spin-coated from chloroform and mounted on a Cu grid is shown imaged by STXM in transmission mode at a photon energy of 290 eV. The 60 × 60 µm2 image shows a large number of dark spots across the film, indicating thicker and strongly absorbing areas. Figures 5(b) and 5(c) show compositional STXM maps (5 × 5 µm2) corresponding to (b) TQ1 and (c) PC70BM concentrations. The aggregates appear dark in the TQ1 map while in the PC70BM map they appear bright, showing that they are rich in PC70BM.
STXM images of a TQ1:PC70BM 1:2.5 blend film spin-coated from chloroform and floated onto a Cu grid. (a) 60 × 60 µm2 X-ray transmission image, taken at 290 eV. (b) 5 × 5 µm2 composition maps corresponding to (b) TQ1 and (c) PC70BM volume concentrations. The dashed square in (a) indicates where the composition maps (b) and (c) were acquired. C1s NEXAFS spectra in transmission mode of (d) an aggregate in a TQ1:PC70BM 1:2.5 film spin-coated from chloroform and (e) a film of pristine PC70BM.

A NEXAFS C1s spectrum taken locally on one of the aggregates is shown in Fig. 5(d) along with a NEXAFS C1s spectrum of a film of pristine PC70BM [Fig. 5(e)]. The two spectra look very similar, clearly showing that the aggregates are comprised of PC70BM. We can, in other words, confidently dismiss the possibility of the aggregates being undissolved PEDOT:PSS remaining at the bottom of the film.
We have also observed that the amount and size of the PC70BM droplets depend on the time that the film spends in water during the lift-off/float-on process. The amount of droplets initially increases with the time in water, and in films that have been left floating longer than 10 min we observe few such droplets, which indicates that some PC70BM is lost in the water.
To the best of our knowledge, this is the first time that the formation of PC70BM clusters caused by the lift-off/float-on technique is reported. This might seem somewhat surprising given the large number of studies where the lift-off/float-on technique has been used to prepare samples for transmission microscopy studies. However, exposing polymer:fullerene films to polar solvents or solvent vapor has previously been shown to cause both PC70BM and PC60BM aggregation at the surface of the film that is in direct contact with the solvent. Zheng et al. reported aggregation of PC70BM in poly[[4,8-bis[(2-ethylhexyl)oxy]benzo[1,2-b:4,5-b′]dithiophene-2,6-diyl][3-fluoro-2-[(2-ethylhexyl)carbonyl]thieno[3,4-b]thiophenediyl]] (PTB7):PC70BM blend films as a result of exposure to vapor of several different polar solvents. Reference Zheng, Li, Zheng and Yu61 Han et al. exposed poly(3-hexylthiophene) (P3HT):PC60BM films to pure methanol, while Liu et al. exposed P3HT:PC60BM films to acetone; both observing PC60BM diffusion toward the surface being in contact with the polar solvent. Reference Han, Gopalan, Lee, Kang, Lee, Lee, Kwon, Lee and Kang62,Reference Liu, Lü, Ning, Lu, Lu, Zhang, Fang, Tang, Hu, Lou, Teng and Hou63
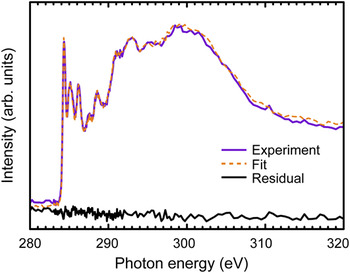
To investigate how the formation of the PC70BM aggregates influences the composition in the TQ1:PC70BM blend films, NEXAFS spectra (in transmission mode) were also taken on films spin-coated directly onto Si3N4 membranes and compared to those on Cu-grids. The blend composition was then calculated by fitting the spectra to linear combinations of the pristine components’ spectra. The fit for the TQ1:PC70BM 1:2.5 blend film spin-coated from chlorobenzene onto a Si3N4 membrane is shown in Fig. 6. The TQ1:PC70BM ratio obtained from the fit was 1:2.5 which matches the 1:2.5 feed ratio, while for the fit for films on Cu grids [Fig. 3(d)] the ratio was 1:1.9. This clearly shows that the formation of these PC70BM aggregates has a significant impact on the measured blend ratio.
C1s NEXAFS spectrum of a TQ1:PC70BM blend film spin-coated from chlorobenzene on a Si3N4 membrane, shown together with the fitted linear combination of the pristine components’ spectra and the residual of the fit.

C. Photo-degradation of PCBM
Another challenge when determining the chemical composition of thin films of organic molecules is the molecules’ sensitivity to oxygen and water vapor, especially in the presence of light. It has been reported for polymers Reference Henriksson, Lindqvist, Abdisa, Wang, George, Kroon, Müller, Yohannes, Inganäs and Andersson64–Reference Rivaton, Tournebize, Gaume, Bussière, Gardette and Therias69 as well as fullerenes Reference Anselmo, Dzwilewski, Svensson and Moons43,Reference Reese, Nardes, Rupert, Larsen, Olson, Lloyd, Shaheen, Ginley, Rumbles and Kopidakis70,Reference Chambon, Rivaton, Gardette and Firon71 that photochemical processes can modify the chemical structures, for instance by breaking double bonds. Since the resonances in the C1s-NEXAFS spectra are very sensitive to small changes in the structure of the molecule, photo-oxidation or other chemical processes that may occur during transfer of the samples through air can affect the spectrum, which we have previously shown in particular for C60-derivatives. The π* resonances in the C1s NEXAFS spectrum of PC60BM decrease dramatically upon photo-oxidation. Reference Anselmo, Dzwilewski, Svensson and Moons43 Moreover, the degree of degradation has been shown to be different for pure PC60BM as compared to PC60BM blended with a polymer. Reference Hansson, Lindqvist, Ericsson, Opitz, Wang and Moons45 Hence, such degradation can also affect the film composition derived from STXM measurements.
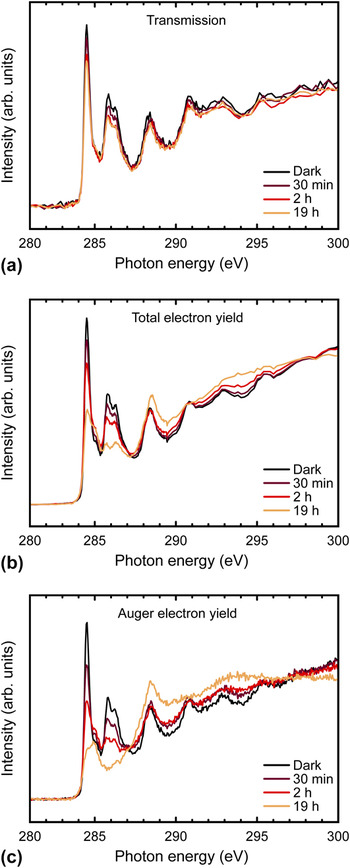
C1s NEXAFS spectra of pristine PC60BM films, before and after exposure to light in air for different times, are shown in Fig. 7. Figure 7(a) shows the NEXAFS spectrum recorded in transmission mode, whereas the TEY is shown in Fig. 7(b) and the AEY in Fig. 7(c). As the exposure time increases, the intensity of the π* resonances at 284.5, 285.8 and 286.2 eV is reduced, in agreement with previous work. Reference Anselmo, Dzwilewski, Svensson and Moons43,Reference Hansson, Lindqvist, Ericsson, Opitz, Wang and Moons45 This photo-degradation is clearly visible for all the detection modes, but is most pronounced in the electron yield, especially in the very surface sensitive AEY mode. It is thus evident that the observed photo-degradation of PC60BM is most severe at the surface. Since this PC60BM degradation is large enough to affect the transmission spectrum, as can be seen in Fig. 7(a), some care has to be taken when using STXM to evaluate the blend composition in polymer:PCBM films. 284.5 eV is often the photon energy of choice for a STXM measurement of a polymer:PCBM blend film since this PCBM π* peak tends to be well separated from any absorption peak in the polymer spectra. However, since the intensity of the 284.5 eV peak is very sensitive to degradation, keeping a polymer:PCBM blend film in light in ambient air can affect the composition derived from STXM. To achieve correct composition values, it is therefore important to limit the exposure of samples to air and light during preparation and transfer.
C1s NEXAFS spectra of spin-coated films of pristine PC60BM exposed to AM1.5 simulated sunlight in ambient air for different times, acquired by measuring the transmission (a), total electron yield (b), and Auger electron yield (c).

IV. CONCLUSIONS
A combination of X-ray absorption microscopy and spectroscopy has been used to characterize the composition of thin films of mixtures of conjugated polymers and conjugated molecules such as fullerenes. Determining local composition requires that the film components (fullerene and polymer or polymer and polymer) be distinguished through their specific molecular fingerprints in the X-ray absorption spectrum. In the case of TQ1:PC70BM films, we highlight the key issues that can arise during these experiments and suggest some approaches to overcome them.
For microscopy studies in transmission, the films are typically lifted off from their PEDOT:PSS-coated substrates by floating them off on a water bath and subsequently picking them up onto a Cu grid. By a combination of STXM, TEM, and SEM, we identified micrometer sized drop-like clusters consisting of nearly pure PC70BM, formed at the bottom of TQ1:PC70BM films as a result of direct contact with water. In films spin-coated onto PEDOT:PSS-covered Si3N4 membranes, such clusters are not observed. The PC70BM clusters are therefore formed during transfer of the films onto Cu grids, showing that contact with water can modify the film and influence the composition in polymer:fullerene blend films, leading to an underestimated PC70BM concentration. Furthermore, photodegradation can also affect the film composition derived from STXM measurements. Indeed, in TQ1:PC60BM blend samples exposed to air and light, the fullerene photo-oxidizes faster than the polymer, which can lead to strongly decreased intensities of the characteristic π* peaks of PC60BM, and thus an underestimated PCBM content. Preparing and transferring the samples in an inert environment is important to achieve correct composition values. By comparing surface sensitive electron yield NEXAFS spectra with spectra taken in transmission mode in a STXM instrument, we can separate surface degradation from bulk degradation, which illustrates the complementarity of the techniques. In summary, combined NEXAFS spectroscopy and scanning transmission X-ray microscopy have successfully extended the morphology and stability studies of organic materials for photovoltaics beyond structural aspects, by adding detailed information on chemical composition with nanometer resolution.
ACKNOWLEDGMENTS
We acknowledge the Paul Scherrer Institut, Villigen, Switzerland for provision of synchrotron radiation beamtime at beamline PolLux (X07DA) of the SLS and would like to thank Dr. Ben Watts for assistance. The Advanced Light Source is supported by the Director, Office of Science, Office of Basic Energy Sciences, of the U.S. Department of Energy under Contract No. DE-AC02-05CH11231. We are grateful to the beamline staff at ALS 5.3.2.2 for assistance. Beamline staff at D1011 at MAX-IV is gratefully acknowledged for assistance. E.M. acknowledges funding from the Swedish Energy Council, contract number 38327-1, and the Swedish Research Council, grant 2015-03778, and financial support from the Göran Gustafsson Foundation for Research in Natural Sciences and Medicine.