


1. Introduction
Breaking water waves feature a rather amazing variety of fluid mechanics, ranging from nearly potential flow prior to breaking, to unsteady turbulent boundary layers at the sea bed, to a turbulent jet flow e.g. during the initial plunge, to a highly complicated and turbulent multi-phase (air and water) flow throughout the surf zone. Over the past few decades, significant efforts have been made to better understand the breaking wave process through both experimental and numerical means.
A large number of experimental studies have been performed, with focus on, for example, the breaking onset location, turbulence characteristics as well as the undertow velocity field in the surf zone, which is especially important in nearshore sediment transport processes. The surf zone is the part of the shoreface from the most seaward wave breaking point to the most landward broken wave (Van Rijn Reference Van Rijn1993). The surf zone can be divided into two subregions, i.e. the outer and the inner surf zone. For spilling breakers, there has not been a specific definition of the threshold between the two subregions. It can be considered that the outer surf zone extends from the breaking point up to the part with rapid changes in wave shape, and the inner surf zone consists of the breaking bores with slow changes in wave shape. For plunging breakers, the splash point (where the water pushed upwards by the plunging jet hits the water again) is often used to mark the start of the inner surf zone. When breaking waves propagate to the shore, a return flow (known as undertow) beneath the wave trough is generated to compensate the amount of water waves that is transported shoreward. The undertow velocity is generally strongest in the surf zone (Svendsen Reference Svendsen1984). Most experimental studies have been performed in relatively small-scale facilities (e.g. Nadaoka, Hino & Koyano Reference Nadaoka, Hino and Koyano1989; Ting & Kirby Reference Ting and Kirby1994, Reference Ting and Kirby1996; Chang & Liu Reference Chang and Liu1999; Stansby & Feng Reference Stansby and Feng2005; De Serio & Mossa Reference De Serio and Mossa2006; Lara, Losada & Liu Reference Lara, Losada and Liu2006). Among these, the spilling and plunging breaking wave experiments of Ting & Kirby (Reference Ting and Kirby1994, Reference Ting and Kirby1996) have been most often used for validating numerical models. Spilling breaking is a rather gentle breaking at the wave crest and is followed by a gradual dissipation of energy over the surf zone, while plunging breaking is more violent with the crest curling over and plunging into the surface as a turbulent jet flow. Recently, several large-scale experimental studies involving breaking waves over a fixed barred bed profile (e.g. Scott et al. Reference Scott, Cox, Maddux and Long2005; van der A et al. Reference van der A, van der Zanden, O'Donoghue, Hurther, Cáceres, McLelland and Ribberink2017; van der Zanden et al. Reference van der Zanden, van der A, Cáceres, Hurther, McLelland, Ribberink and O'Donoghue2018, Reference van der Zanden, van der A, Cáceres, Larsen, Fromant, Petrotta, Scandura and Li2019) have likewise been performed, with detailed measurements provided for the flow and turbulence fields throughout the surf zone, as well as in the near-bed bottom boundary layer region (van der Zanden et al. Reference van der Zanden, van der A, Cáceres, Hurther, McLelland, Ribberink and O'Donoghue2018).
With the continual increase in computer power, computational fluid dynamics (CFD) modelling has been increasingly utilized as an alternative means of studying breaking waves, due to its lower cost and faster set-up compared to conventional laboratory tests. Also, CFD can, in principal, overcome scale effects and operation disturbances that exist in laboratory experiments. Computational fluid dynamics simulations of breaking waves have typically been conducted based on Reynolds-averaged Navier–Stokes (RANS) equations, coupled with various turbulence closure models (e.g. Lin & Liu Reference Lin and Liu1998; Bradford Reference Bradford2000; Chella et al. Reference Chella, Bihs, Myrhaug and Muskulus2015; Lupieri & Contento Reference Lupieri and Contento2015; Brown et al. Reference Brown, Greaves, Magar and Conley2016; Derakhti et al. Reference Derakhti, Kirby, Shi and Ma2016a,Reference Derakhti, Kirby, Shi and Mab; Devolder, Troch & Rauwoens Reference Devolder, Troch and Rauwoens2018; Liu et al. Reference Liu, Ong, Obhrai, Gatin and Vukčević2020). Additionally, large-eddy simulation models (LES; e.g. Christensen & Deigaard Reference Christensen and Deigaard2001; Christensen Reference Christensen2006; Zhou et al. Reference Zhou, Hsu, Cox and Liu2017) have also been employed to study wave breaking processes, as have models based on so-called smoothed particle hydrodynamics (SPH; e.g. Shao Reference Shao2006; Shadloo et al. Reference Shadloo, Weiss, Yildiz and Dalrymple2015; Wei et al. Reference Wei, Li, Dalrymple, Derakhti and Katz2018; Lowe et al. Reference Lowe, Buckley, Altomare, Rijnsdorp, Yao, Suzuki and Bricker2019). In recently years, some high-fidelity direct numerical simulation (DNS) studies have been made on breaking waves with focus on air-entrainment and bubble statistics (e.g. three-dimensional simulations of Deike, Melville & Popinet (Reference Deike, Melville and Popinet2016), Wang, Yang & Stern (Reference Wang, Yang and Stern2016) and Chan et al. (Reference Chan, Johnson, Moin and Urzay2021)), which have built largely upon previous two-dimensional simulations solving the Navier–Stokes equations (e.g. Iafrati Reference Iafrati2009, Reference Iafrati2011). These high-fidelity simulations are at small length scales and are not yet practically applicable to surf zone breaking waves due to computational time and costs. Among those various approaches, RANS models have been those most widely used for surf zone breaking wave modelling, as they are the most computationally affordable.
Regarding RANS two-equation models, the pioneering work of Lin & Liu (Reference Lin and Liu1998) applied a nonlinear  $k$–
 $\varepsilon$ model for simulating breaking waves (
 $k$ is the turbulent kinetic energy density and
 $\varepsilon$ is the dissipation rate). Their simulations showed a pronounced over-production of turbulence at the most offshore point of their comparison (near the breakpoint). This is similar to other more recent works (e.g. Brown et al. Reference Brown, Greaves, Magar and Conley2016; Derakhti et al. Reference Derakhti, Kirby, Shi and Ma2016a,Reference Derakhti, Kirby, Shi and Mab; Devolder et al. Reference Devolder, Troch and Rauwoens2018; Liu et al. Reference Liu, Ong, Obhrai, Gatin and Vukčević2020) using other two-equation models such as
 $k$–
 $\omega$ and
 $k$–
 $\omega$ shear stress transport (SST) models (
 $\omega$ being the specific dissipation rate). Several of the simulations mentioned just above even clearly demonstrate turbulence levels prior to breaking that are similar in magnitude to those within the surf zone, which obviously defies physical explanation as well as measurements. Hsu, Sakakiyama & Liu (Reference Hsu, Sakakiyama and Liu2002) also identified that the
 $k$–
 $\varepsilon$ turbulence model tended to predict unrealistically high turbulence in regions that were supposed to contain low turbulence levels during their long-time simulations. They suspected that this problem was due to convection and diffusion mechanisms. To combat this issue they have used an empirical damping coefficient to reduce the eddy viscosity in such regions.
The persistent problem of over-production of turbulence in the potential flow region beneath (non-breaking) surface waves in RANS turbulence closure models has only recently been fully explained and analysed. Building on the proof of conditional instability of the  $k$–
 $\omega$ closure model of Mayer & Madsen (Reference Mayer and Madsen2000), Larsen & Fuhrman (Reference Larsen and Fuhrman2018) proved that nearly all two-equation models in wide use (several
 $k$–
 $\omega$ and
 $k$–
 $\varepsilon$ variants) are (asymptotically) unconditionally unstable in such regions. (An exception is the realizable
 $k$–
 $\varepsilon$ model of Shih et al. (Reference Shih, Liou, Shabbir, Yang and Zhu1995), which was proved to be conditionally unstable in such regions by Fuhrman & Li (Reference Fuhrman and Li2020).) Larsen & Fuhrman (Reference Larsen and Fuhrman2018) devised a simple and general method for formally stabilizing two-equation models, based on a reformulation of the eddy viscosity. Their ‘stabilized’
 $k$–
 $\omega$ model was tested on small-scale spilling waves over a constant slope in Larsen & Fuhrman (Reference Larsen and Fuhrman2018) and on full-scale plunging waves over a breaker bar in Larsen et al. (Reference Larsen, van der A, van der Zanden, Ruessink and Fuhrman2020). These works have collectively shown that the stabilized
 $k$–
 $\omega$ model leads to marked improvement in the predicted turbulence, undertow velocity profiles and the bottom boundary layer dynamics in the pre-breaking region and outer surf zones, likely to be of considerable importance for, for example, breaking wave hydrodynamics and cross-shore sediment transport predictions. However, even the best of the models considered in Larsen & Fuhrman (Reference Larsen and Fuhrman2018) and Fuhrman & Li (Reference Fuhrman and Li2020) were still rather inaccurate in the inner surf zone (i.e. closer to the shoreline), thus seemingly requiring yet more advanced methods of achieving turbulence closure. To date, no single turbulence closure model has demonstrated the ability to accurately simulate the entirety of the breaking process, from shoaling to the inner surf zone, including accurate prediction of the undertow velocity structure and magnitude, for both spilling and plunging breaking waves.
NASA's CFD Vision 2030 Study white paper (Slotnick et al. Reference Slotnick, Khodadoust, Alonso, Darmofal, Gropp, Lurie and Mavriplis2014) identifies advanced turbulence modelling based on Reynolds stress models (RSMs) as a priority in the coming decades. Motivated by this, and especially the persistent shortcomings encountered with two-equation turbulence closure models noted above, the present study considers novel applications of a Reynolds stress turbulence model for the simulation of breaking waves. Specifically, we consider applications of the stress– $\omega$ model proposed by Wilcox (Reference Wilcox2006), which has not been utilized previously for this purpose. Unlike two-equation models, RSMs (e.g. Launder, Reece & Rodi Reference Launder, Reece and Rodi1975; Wilcox Reference Wilcox2006) simulate all components of the Reynolds stress tensor with their own respective transport equation, eliminating the need to resort to a Boussinesq eddy viscosity approximation. Therefore, RSMs are theoretically superior to their two-equation counterparts, while still maintaining reasonable computational efficiency, compared to turbulence-resolving methods such as DNS and LES. Comparing with two-equation RANS models, RSMs must provide closure for a larger number of terms, which can present a challenge. In the present work, the closure terms and coefficients provided in Wilcox (Reference Wilcox2006) are adopted. To the authors’ knowledge, the study of Brown et al. (Reference Brown, Greaves, Magar and Conley2016) has been the only one to have attempted application of a RSM to study breaking waves, in their case utilizing the Launder–Reece–Rodi (LRR) stress–
 $\varepsilon$ model (Launder et al. Reference Launder, Reece and Rodi1975). However, they found a significant overestimation of the turbulent kinetic energy for spilling breakers both pre- and post-breaking, which was even more pronounced than found with several of their two-equation closures. Their results suggest that RSMs may share the same problem of instability in the nearly potential flow region beneath surface waves, leading to unphysical exponential growth of turbulence. The formal stability of RSMs in the potential flow region beneath non-breaking surface waves is an open question, which is definitively answered by the present work. We further aim to establish the ability of the stress–
 $\omega$ model to accurately simulate coastal fluid mechanics problems involving breaking waves.
The present work is organized as follows. We begin by conducting a novel stability analysis of the Wilcox (Reference Wilcox2006) stress– $\omega$ model in a region of idealized potential flow beneath surface waves (§ 2). We prove that this model is formally neutrally stable in such regions, and therefore ought not give rise to unphysical exponential growth of turbulence. The stress–
 $\omega$ model (with buoyancy production terms included, as derived in Appendix A) is then tested in CFD simulations throughout § 3. Here the formal stability analysis is directly verified through simulations of a progressive surface wave train (§ 3.1). We then move from the surface to the sea bed, and consider CFD simulations of a turbulent wave boundary layer, with comparisons made against a two-equation
 $k$–
 $\omega$ model (§ 3.2). We finally test the performance of the stress–
 $\omega$ model in simulations involving both the spilling (§ 3.3) and plunging (§ 3.4) breaking wave cases of Ting & Kirby (Reference Ting and Kirby1994, Reference Ting and Kirby1996), with direct comparison made against the best of the
 $k$–
 $\omega$ models devised by Larsen & Fuhrman (Reference Larsen and Fuhrman2018). The present breaking wave results are discussed relative to those of prior CFD studies in § 4, before drawing conclusions in § 5.
Although it is not the primary focus of the present work, for completeness, we similarly analyse the LRR stress– $\varepsilon$ model for stability in Appendix B. Similar to the stress–
 $\omega$ model, we prove that the stress–
 $\varepsilon$ model is likewise neutrally stable in the potential flow region beneath non-breaking surface waves. This has also been confirmed through testing with surface wave trains, as noted there. The likely explanation of the LRR stress–
 $\varepsilon$ model significantly over-predicting turbulence prior to breaking in the work of Brown et al. (Reference Brown, Greaves, Magar and Conley2016) is also provided there.
2. Stability analysis of the Wilcox (Reference Wilcox2006) stress– $\omega$ turbulence model in the potential flow region beneath waves

2.1. Turbulence closure model
While computational power has improved immensely in recent decades, for many fluid mechanics problems, it is still not practically feasible to resolve the small scales required for either DNS or LES. Rather, it is often necessary in practice to work with a Reynolds-averaged description of the flow, with the effects of turbulence on the mean flow accounted for with the aid of a turbulence closure model. For this purpose, the present study focuses on the Wilcox (Reference Wilcox2006) stress– $\omega$ model (where
 $\omega$ is again the specific dissipation rate of turbulence). This model, in a form suitable for a two-phase (water–air) fluid mixture, consists of the following stress-transport equations:
 \begin{align} \underbrace{\frac{ \partial \bar{\rho} \tau_{ij}}{\partial t} }_{\text{Time variation}} + \underbrace{ \bar{u}_k \frac{\partial \bar{\rho} \tau_{ij}}{\partial x_k}}_{\text{Convection}} &={-}\underbrace{\bar{\rho} P_{ij}}_{\text{Production}} +\underbrace{ \frac{2}{3} \bar{\rho} \beta^* \omega k \delta_{ij}}_{\text{Dissipation}} -\underbrace{\bar{\rho} \varPi_{ij} }_{\text{Pressure-strain}}\nonumber\\ &\quad + \underbrace{\bar{\rho} \alpha_b^* \frac{k}{\omega} N_{ij}}_{\text{Buoyancy production}} +\underbrace{ \frac{\partial}{\partial x_k}\left[\bar{\rho} (\nu + \sigma^*\frac{k}{\omega})\frac{\partial \tau_{ij}}{\partial x_k} \right] }_{\text{Diffusion}} \end{align}
combined with a separate transport equation for the specific rate of dissipation  $\omega$:
 \begin{align} \underbrace{ \frac{\partial \bar{\rho}\omega}{\partial t} }_{\text{Time variation}} + \underbrace{ \bar{u}_j \frac{\partial \bar{\rho} \omega}{\partial x_j}}_{\text{Convection}} &= \underbrace{ \bar{\rho} \alpha \frac{\omega}{k} \tau_{ij}\frac{\partial \bar{u}_i}{\partial x_j}}_{\text{Production}} - \underbrace{\bar{\rho} \beta \omega^2 }_{\text{Dissipation}} + \underbrace{\sigma_d \frac{\bar{\rho}}{\omega} \frac{\partial k}{\partial x_j}\frac{\partial \omega}{\partial x_j} }_{\text{Cross-diffusion}} \nonumber\\ &\quad + \underbrace{ \frac{\partial}{\partial x_k} \left[ \bar{\rho}\left(\nu + \sigma \frac{k}{\omega}\right)\frac{\partial \omega}{\partial x_k}\right] } _{\text{Diffusion}}. \end{align}
In the above,  $x_j$ are the Cartesian coordinates,
 $\bar {u}_j$ are the mean (Reynolds-averaged) components of the velocity,
 $g_j$ is gravitational acceleration,
 $\delta _{ij}$ is the Kronecker delta,
 $\nu$ is the kinematic fluid viscosity,
 $\bar {\rho }$ is the fluid density and
 $t$ is time. The specific Reynolds stress tensor is defined as
 \begin{equation} \tau_{ij} ={-} \overline{u_{i}^\prime u_{j}^\prime}, \end{equation}
where a prime denotes turbulent fluctuations and the overbar denotes Reynolds averaging. The turbulent kinetic energy (per unit mass) is thus
 \begin{equation} k ={-} \tfrac{1}{2} \tau_{kk}. \end{equation}
Buoyancy production (as derived in Appendix A) is included with terms proportional to the Brunt–Väisälä frequency tensor:
 \begin{equation} N_{ij}= \frac{1}{\rho_0} \left( g_i\frac{\partial \bar{\rho}}{\partial x_j} + g_j\frac{\partial \bar{\rho}}{\partial x_i}\right), \end{equation}
where  $\rho _0$ is the constant reference density of the fluid.
The pressure–strain correlation is
 \begin{align} \varPi_{ij}&=\beta^* C_1 \omega\left(\tau_{ij}+\tfrac{2}{3}k\delta_{ij}\right) -\hat{\alpha}(P_{ij}-\tfrac{2}{3}P\delta_{ij}) \nonumber\\ &\quad -\hat{\beta}\left(D_{ij}-\tfrac{2}{3}P\delta_{ij}\right) -\hat{\gamma}k\left(S_{ij}-\tfrac{1}{3}S_{kk}\delta_{ij}\right), \end{align}
where
 $$\begin{gather} P_{ij}=\tau_{im}\frac{\partial \bar{u}_j}{\partial x_m}+\tau_{jm} \frac{\partial \bar{u}_i}{\partial x_m}, \end{gather}$$
 $$\begin{gather}D_{ij}=\tau_{im}\frac{\partial \bar{u}_m}{\partial x_j}+\tau_{jm}\frac{\partial \bar{u}_m}{\partial x_i}, \end{gather}$$
 $$\begin{gather}S_{ij}= \frac{1}{2} \left( \frac{\partial \bar{u}_i}{\partial x_j} + \frac{\partial \bar{u}_j}{\partial x_i} \right), \end{gather}$$
 $$\begin{gather}P=\tfrac{1}{2}P_{kk}. \end{gather}$$
The model closure coefficients, taken directly from Wilcox (Reference Wilcox2006), are defined as follows:
 \begin{gather} \left.\begin{array}{cccc@{}} C_1=1.8, & C_2=10/19, & \hat{\alpha}=(8+C_2)/11, & \hat{\beta}=(8C_2-2)/11, \\ \hat{\gamma}=(60C_2-4)/55, & \alpha=0.52, & \beta^*=0.09, & \beta_0=0.0708, \\ \beta=\beta_0 f_{\beta}, & \sigma=0.5, & \sigma^*=0.6, & \sigma_{d0}=0.125, \end{array}\right\} \end{gather}
 \begin{gather} \sigma_d=\begin{cases} 0, & \displaystyle \frac{\partial k}{\partial x_j}\frac{\partial \omega}{\partial x_j} \leqslant 0 \\ \sigma_{d0}, & \displaystyle \frac{\partial k}{\partial x_j}\frac{\partial \omega}{\partial x_j} > 0, \end{cases} \end{gather}
 \begin{gather} f_{\beta}=\frac{1+85 \chi_{\omega}}{1+100 \chi_{\omega}},\quad \chi_{\omega}=\left\vert\frac{\varOmega_{ij}\varOmega_{jk}\hat{S}_{ki}}{(\beta^* \omega)^3} \right\vert, \quad \hat{S}_{ki}=S_{ki}-\frac{1}{2}\frac{\partial \bar{u}_m}{\partial x_m} \delta_{ki}, \end{gather}
with  $\alpha _b^*=1.36$ (following Larsen & Fuhrman (Reference Larsen and Fuhrman2018); see also Appendix A). Unless explicitly stated otherwise, this value is fixed in what follows. A detailed description of the closure evolution from third-order turbulence correlations to second-order ones can be found in Wilcox (Reference Wilcox2006, pp. 41–43) and Launder et al. (Reference Launder, Reece and Rodi1975, their § 3).
Compared with the LRR (Launder et al. Reference Launder, Reece and Rodi1975) stress– $\varepsilon$ model, the
 $\omega$-based stress-transport model formulated above reduces the complexity of the diffusion term and the pressure–strain relation considerably. Moreover, since the
 $\omega$ equation yields better near-wall behaviour, the pressure–strain relation does not require an artificial wall-reflection term. (As discussed by Parneix, Laurence & Durbin (Reference Parneix, Laurence and Durbin1998), the LRR wall-reflection term is more to mitigate a deficiency in the
 $\varepsilon$ equation than to correctly or physically represent the pressure-echo process.) We therefore adopt the Wilcox (Reference Wilcox2006) stress–
 $\omega$ model as our primary focus for both analysis and applications in what follows.
2.2. Stability analysis
As shown and explained by Mayer & Madsen (Reference Mayer and Madsen2000), Larsen & Fuhrman (Reference Larsen and Fuhrman2018) and Fuhrman & Li (Reference Fuhrman and Li2020) (see also § 7.6 of Sumer & Fuhrman (Reference Sumer and Fuhrman2020)), standard two-equation turbulence closure models can result in turbulence over-production in the potential flow core region beneath surface waves. This is due to their inherent instability in such regions, leading to non-physical exponential growth of the turbulent kinetic energy and eddy viscosity. Computational results of Brown et al. (Reference Brown, Greaves, Magar and Conley2016), who used the LRR stress– $\varepsilon$ turbulence model to simulate breaking waves, demonstrated seemingly similar turbulence over-production prior to incipient wave breaking. This suggests that RSMs may share the same inherent instability in nearly potential flow regions having finite strain. It is therefore of interest to extend the analysis of Larsen & Fuhrman (Reference Larsen and Fuhrman2018) to consider the formal asymptotic stability of RSMs. In what follows in the main text we formally analyse the Wilcox (Reference Wilcox2006) stress–
 $\omega$ model. Similar analysis (and findings) of the LRR stress–
 $\varepsilon$ model is provided in Appendix B for completeness.
Consider now an incompressible fluid region having constant density beneath a small-amplitude plane surface wave train propagating in the horizontal  $x_1=x$ direction, where the turbulence model described above is active. We will assume the mean flow is described by linear potential flow (Stokes first-order) wave theory, with velocity fields
 $$\begin{gather} \bar{u}_1=u=\frac{H \sigma_{w}}{2} \frac{\cosh (k_w y)}{\sinh (k_w h)} \cos(k_w x - \sigma_{w} t), \end{gather}$$
 $$\begin{gather}\bar{u}_2=v=\frac{H \sigma_{w}}{2} \frac{\sinh (k_w y)}{\sinh (k_w h)} \sin(k_w x - \sigma_{w} t), \end{gather}$$
where the vertical  $x_2=y$ axis is placed at the bed,
 $\sigma _{w}$ is the angular wave frequency,
 $k_w$ is the wavenumber,
 $h$ is the water depth and
 $H$ is the wave height.
Following Mayer & Madsen (Reference Mayer and Madsen2000), Larsen & Fuhrman (Reference Larsen and Fuhrman2018) and Fuhrman & Li (Reference Fuhrman and Li2020), diffusive and convective terms are neglected in the analysis, which is reasonable in the potential flow region. Meanwhile, the buoyancy production term goes to zero in the region beneath surface waves where the density is again assumed constant. From the assumptions stated above, (2.1) and (2.2) simplify to the following system of seven governing equations:
 $$\begin{gather} \frac{\partial \tau_{ij}}{\partial t} ={-} P_{ij} + \frac{2}{3} \beta^{*}\omega k \delta_{ij} - \varPi_{ij}, \end{gather}$$
 $$\begin{gather}\frac{\partial \omega}{\partial t} = \alpha \frac{\omega}{k} \tau_{ij} \frac{\partial \bar{u}_i}{\partial x_j} - \beta \omega^2. \end{gather}$$
We may simplify the governing equations yet further by (1) assuming that the turbulence field under consideration has equivalent normal stresses (such that  $\tau _{11}=\tau _{22}=\tau _{33}$), (2) accounting for both assumed zero mean flow (
 $\bar {u}_3=w=0$) and uniformity (
 $\partial /\partial x_3=0$) in the transverse
 $x_3=z$ direction and (3) invoking local continuity
 $\partial \bar {u}_i/\partial x_i=0$. Equations (2.16) and (2.17) then reduce considerably to the following system of three ordinary differential equations:
 $$\begin{gather} \frac{\partial k}{\partial t} = \displaystyle 2\tau_{12} S_{12} - \beta^* \omega k, \end{gather}$$
 $$\begin{gather}\frac{\partial \tau_{12}}{\partial t} = \displaystyle \displaystyle \left(\frac{4}{3} - \frac{4}{3}\hat{\alpha} - \frac{4}{3}\hat{\beta} + \hat{\gamma} \right) k S_{12}-C_1 \beta^* \omega \tau_{12}, \end{gather}$$
 $$\begin{gather}\frac{\partial \omega}{\partial t} = \displaystyle 2\alpha \frac{\omega}{k} \tau_{12} S_{12} - \beta \omega^2, \end{gather}$$
where (2.18) stems from the trace of (2.16). Notice that even in this reduced form the resulting RSM differs fundamentally from a simpler  $k$–
 $\omega$ turbulence model (see Larsen & Fuhrman Reference Larsen and Fuhrman2018), with the Reynolds shear stress
 $\tau _{12}$ governed by its own equation.
For analysis purposes, it turns out to be convenient to introduce a dimensionless utility variable  $\varPsi = k/ \tau _{12}$. Combining (2.18) and (2.19), while also invoking
 $\varPsi$ into the
 $\omega$ equation (2.20) then leads to
 $$\begin{gather} \frac{\partial \varPsi}{\partial t} = \underbrace{\left( \frac{4}{3}\hat{\alpha} + \frac{4}{3}\hat{\beta} - \hat{\gamma}-\frac{4}{3} \right)}_{{-}8/15} \varPsi^2 S_{12} + (C_1-1)\beta^* \varPsi \omega + 2S_{12} , \end{gather}$$
 $$\begin{gather}\frac{\partial \omega}{\partial t} ={-} \beta \omega^2 + 2 \alpha \frac{\omega}{\varPsi} S_{12} . \end{gather}$$
From inspection of (2.21) and (2.22) it is clear that, for any reasonable initial conditions, i.e. with  $\tau _{12}$ (hence
 $\varPsi$) and
 $S_{12}$ having the same sign, both
 $\varPsi$ and
 $\omega$ will evolve asymptotically towards equilibrium values such that their respective time derivatives are zero. A brief mathematical analysis follows. Setting both (2.21) and (2.22) to zero, and solving for
 $\varPsi$ and
 $\omega$ (discarding the unphysical solution with
 $\omega =0$) leads to the following asymptotic values (so called fixed points):
 $$\begin{gather} \varPsi_\infty ={\pm} \sqrt{6\times\frac{(1-C_1)\alpha\beta^*-\beta}{\beta(4\hat{\alpha}+4\hat{\beta}-3\hat{\gamma}-4)}}\approx{\pm} 2.394, \end{gather}$$
 $$\begin{gather}\frac{\omega_\infty}{S_{12}} ={\pm} \alpha\sqrt{\frac{2}{3}\times\frac{4-4\hat{\alpha}-4\hat{\beta}+3\hat{\gamma}}{\beta^2+(C_1-1)\alpha\beta\beta^*} }\approx{\pm} 6.135, \end{gather}$$
where the closure coefficients have been invoked to arrive at the constants. For positive  $S_{12}$, the fixed point is
 $(\varPsi _\infty, \omega _\infty )=(2.394, 6.135 S_{12})$, while for negative
 $S_{12}$ the fixed point is
 $(\varPsi _\infty, \omega _\infty )=(-2.394, -6.135 S_{12})$.
Now let us check for formal stability of the fixed points based on the eigenvalues of the Jacobian matrix for (2.21)–(2.22) which is defined by
 \begin{equation} J = \begin{bmatrix} \displaystyle \frac{\partial}{\partial \varPsi}\left(\frac{\partial \varPsi}{\partial t}\right) & \displaystyle \frac{\partial}{\partial \omega}\left(\frac{\partial \varPsi}{\partial t}\right) \\ \displaystyle \frac{\partial}{\partial \varPsi}\left(\frac{\partial \omega}{\partial t}\right) & \displaystyle \frac{\partial}{\partial \omega}\left(\frac{\partial \omega}{\partial t}\right) \end{bmatrix}. \end{equation}
After invoking the right-hand sides of (2.21)–(2.22) in the above, in addition to the model closure coefficients, this becomes
 \begin{equation} J= \begin{bmatrix} -1.067S_{12}\varPsi+0.072\omega & 0.072\omega \\ \displaystyle -\frac{1.04S_{12}\omega}{\varPsi^2} & \displaystyle -0.1416\omega+\frac{1.04 S_{12}}{\varPsi} \end{bmatrix}. \end{equation}
By linearizing about (i.e. inserting) the fixed points  $(\varPsi _\infty, \omega _\infty )$, the eigenvalues of
 $J$ are found to be
 $(-1.99,-0.558)\vert S_{12}\vert$. As these are negative, the fixed points correspond to stable nodes (Strogatz Reference Strogatz2018). This is also visually demonstrated for the positive quadrant by the dimensionless stream plot of
 $( 1/\vert S_{12}\vert \partial \varPsi /\partial t , 1/ (S_{12}\vert S_{12}\vert ) \partial \omega / \partial t )$ in figure 1, depicting evolution to a single point in the
 $\omega /\vert S_{12}\vert$–
 $\varPsi$ plane, there indicated by the filled circle. The plot with
 $\varPsi$ and
 $S_{12}$ both having negative sign is symmetric to that shown in figure 1. This behaviour has been confirmed through numerous numerical simulations of (2.18)–(2.20), examples of which (with initial conditions for
 $S_{12}$ and
 $\tau _{12}$ having both positive and negative values) are shown in figure 2. The asymptotic constants found above are likewise consistent with figure 1.
Dimensionless stream plot of  $( ({1}/{\vert S_{12}\vert })({\partial \varPsi }/{\partial t}), ({1}/{S_{12}\vert S_{12}\vert } )({\partial \omega }/{\partial t}) )$ depicting the evolution of
 $\varPsi$ and
 $\omega /\vert S_{12} \vert$ to a single point indicated by the filled circle.

Simulated development (full lines) and predicted asymptotic values (dashed lines) of  $\varPsi$ and
 $\omega /S_{12}$ based on ordinary differential equations of (2.18)–(2.20) for the stress–
 $\omega$ closure model. Here
 $S_{12}$ and
 $\tau _{12}$ are provided with both positive and negative initial conditions.

Inserting the asymptotic values  $\varPsi _{\infty }$ and
 $\omega _{\infty }$ back into (2.18) and (2.19) and simplifying then leads to linearized equations of the form
 \begin{equation} \frac{1}{k}\frac{\partial k}{\partial t} = \frac{1}{\tau_{12}}\frac{\partial \tau_{12}}{\partial t} = \varGamma_\infty , \end{equation}
where
 \begin{equation} \varGamma_\infty = (\beta-\alpha\beta^*) \sqrt{\frac{2}{3}\times \frac{4-4\hat{\alpha}-4\hat{\beta}+3\hat{\gamma}} {\beta^2+(C_1-1)\alpha\beta\beta^*} } \times \vert S_{12} \vert \approx 0.2831\times \vert S_{12}\vert \end{equation}
defines the asymptotic exponential growth rate of both  $k$ and
 $\tau _{12}$.
It is seen from (2.28) that the exponential growth rate is expressed in terms of the strain rate:
 \begin{equation} S_{12}=\frac{1}{2} \left( \frac{\partial u}{\partial y}+ \frac{\partial v}{\partial x} \right), \end{equation}
which has been treated as fixed above at some unknown value for the sake of keeping the analysis tractable. Note that this is entirely consistent with the prior analysis of the  $k$–
 $\omega$ model (and several other two-equation turbulence models) made by Larsen & Fuhrman (Reference Larsen and Fuhrman2018), who similarly assumed their variable
 $p_0=2S_{ij}S_{ij}$ to be fixed. This was interpreted in practice, for example, as a period- and depth-averaged value beneath the considered surface wave field. Adopting a similar approach, we therefore insert (2.14) and (2.15) into (2.29) and period average. This leads to the rather trivial, but contextually important, result that
 \begin{align} \langle S_{12} \rangle & = \displaystyle \frac{1}{T} \int _0 ^T S_{12} \,{\rm d}t \nonumber\\ & = \displaystyle \frac{1}{T} \int _0 ^T \frac{1}{2}H k_w \sigma_{\omega} \cos (\sigma_{\omega} t - k_w x)\,\textrm{csch} (h k_w)\sinh(k_w y) \,{\rm d}t \nonumber\\ & = \displaystyle 0 \end{align}
(where  $\langle \cdot \rangle$ indicates period averaging), such that the exponential growth rate will, in fact, be simply (on average) zero.
This thus proves that, under the simplifying assumptions made above, the Wilcox (Reference Wilcox2006) stress– $\omega$ turbulence model is neutrally stable in the potential flow region beneath small-amplitude progressive waves. We find similarly for the LRR stress–
 $\varepsilon$ RSM, the details of which are again provided in Appendix B. These results are in contrast to the authors’ original expectations, based on the computational results of Brown et al. (Reference Brown, Greaves, Magar and Conley2016). The reason for this discrepancy is likewise explained in Appendix B. The present results are also in stark contrast to similar analysis made for several two-equation models, most of which have been proved to be either unconditionally unstable (Larsen & Fuhrman Reference Larsen and Fuhrman2018) or (in the special case of the realizable
 $k$–
 $\varepsilon$ model) conditionally unstable (Fuhrman & Li Reference Fuhrman and Li2020), under the same assumptions as considered here.
For the interested reader, an alternative analysis based on eigenvalues of the Jacobian matrix for the governing equations (2.18)–(2.20), linearized about the fixed points, is presented in Appendix C. The alternative analysis confirms the asymptotic growth rate found in (2.28), and hence the finding of neutral stability above.
2.3. Comparison with analysis of two-equation models
Given the fundamental differences in the formal stability of Reynolds stress turbulence models compared to their two-equation counterparts, it seems worthwhile to briefly revisit the prior analysis of these simpler models to pinpoint precisely where these differences arise. For this purpose, consider the  $k$ equation in (2.18), where the turbulence production term corresponds to
 \begin{equation} P_k = 2\tau_{12}S_{12}, \end{equation}
the form of which is theoretically based (though it is emphasized that this quantity neglects additional contributions from turbulent normal stresses). With a Reynolds stress closure model,  $\tau _{12}$ is free to evolve naturally based on its own transport equation (2.19). Conversely, with two-equation closure models it is instead conventionally based on the Boussinesq approximation
 \begin{equation} \tau_{ij}=2\nu_t S_{ij} - \tfrac{2}{3}k \delta_{ij}, \end{equation}
where  $\nu _t$ is the kinematic eddy viscosity. For the conditions specifically analysed in § 2.2, (2.32) leads to the Reynolds stress
 $\tau _{12}=2\nu _tS_{12}$, such that the turbulence production term becomes
 \begin{equation} P_k = p_0\nu_t, \quad p_0=4S_{12}S_{12}, \end{equation}
i.e. proportional to  $p_0$ rather than simply
 $S_{12}$. Similarly, in their analysis of standard two-equation models, Larsen & Fuhrman (Reference Larsen and Fuhrman2018) showed that they inevitably lead to asymptotic values of
 $\omega _\infty$ and
 $\varGamma _\infty$ that are both proportional to
 $\sqrt {p_0}$, rather than
 $S_{12}$. Critically in the present context, in the potential flow region beneath surface waves
 $\langle p_0\rangle$ is finite (Mayer & Madsen Reference Mayer and Madsen2000; Larsen & Fuhrman Reference Larsen and Fuhrman2018), rather than zero as is the case for
 $\langle S_{12}\rangle$; see (2.30).
Thus, this clarifies that it is the Boussinesq approximation of the Reynolds shear stress in two-equation turbulence closure models that is responsible for their formal instability in the potential flow region beneath surface waves. Notably, this finding lends credence to the approach adopted by Larsen & Fuhrman (Reference Larsen and Fuhrman2018), who utilized a re-formulated eddy viscosity (to include an additional stress-limiting feature) in order to formally stabilize such closures.
3. Computational fluid dynamics simulations with the Wilcox (Reference Wilcox2006) stress–$\omega$ model

This section presents a series of CFD simulations, where the Wilcox (Reference Wilcox2006) stress– $\omega$ model is used as turbulence closure for a numerical model solving incompressible RANS equations. The selected simulations will build towards the ultimate aim of accurately simulating breaking surface waves with significantly improved accuracy compared with existing two-equation closures. Specifically, § 3.1 considers simulation of a simple progressive non-breaking wave train, as a direct test of the model's stability in the potential flow core region (as analysed in the preceding section). We then focus on simulation of the turbulent wave boundary layer in § 3.2, of fundamental interest beneath both non-breaking and breaking waves. This section finally culminates with CFD simulations of both spilling (§ 3.3) and plunging (§ 3.4) breaking waves. All simulations in the present work have been carried out within the OpenFOAM® v1812 framework. Free surface simulations utilize the waves2FOAM toolbox (Jacobsen, Fuhrman & Fredsøe Reference Jacobsen, Fuhrman and Fredsøe2012) for wave initiation or generation and absorption.
The free surface is modelled using the volume of fluid method, and the phases in terms of the two fluids (i.e. air and water) are tracked by a scalar field  $\gamma$, where
 $\gamma =0$ denotes pure air and
 $\gamma =1$ denotes pure water. Any intermediate
 $\gamma$ value between 0 and 1 represents a fluid mixture. The
 $\gamma$ field is governed by the advection equation (see also Sumer & Fuhrman Reference Sumer and Fuhrman2020, p. 558):
 \begin{equation} \frac{\partial \gamma}{\partial t} + \frac{\partial (\bar{u}_i \gamma)}{\partial x_i} + \frac{\partial [\bar{u}_i^r \gamma (1-\gamma)]}{\partial x_i} =0, \end{equation}
where  $\bar {u}_i^r$ is a relative velocity for interface compression according to Berberović et al. (Reference Berberović, van Hinsberg, Jakirlić, Roisman and Tropea2009). Any fluid property (represented by
 $\varPhi$) is calculated by
 \begin{equation} \varPhi=\gamma \varPhi_{water} + (1-\gamma)\varPhi_{air}, \end{equation}
i.e. fluid properties are weighted linearly based on the local value of  $\gamma$. For modelling the free surface of breaking waves with strong turbulence, Brocchini & Peregrine (Reference Brocchini and Peregrine2001) and Brocchini (Reference Brocchini2002) also proposed an approach using averaged equations (i.e. mass and momentum conversation equations along with an equation for the turbulent kinetic energy), with boundary conditions obtained through integration across the two-phase surface layer. This may provide a useful alternative for modelling the disturbed free surface of breaking waves, though this approach will not be pursued here.
3.1. Simulating a progressive wave train
The stability analysis in § 2.2 demonstrates that the Wilcox (Reference Wilcox2006) stress– $\omega$ model is neutrally stable in the ideal potential flow region beneath surface waves. This is again in contrast to our original suspicions, since the Reynolds stress CFD simulations of Brown et al. (Reference Brown, Greaves, Magar and Conley2016) demonstrated turbulence over-production prior to breaking. As an initial test to confirm our stability analysis, we therefore conduct CFD simulations involving the simple propagation of a theoretically (based on potential flow theory) steady wave train. For comparative purposes, two simulations are considered, having buoyancy production either on (
 $\alpha _b^*=1.36$, as indicated in § 2.1) or off (
 $\alpha _b^*=0$). The reason for this comparison is to elucidate any effects of the buoyancy production term (which will cause a sink of turbulence near the air–water interface), since it was not considered in the stability analysis for reasons of simplicity. Following Larsen & Fuhrman (Reference Larsen and Fuhrman2018), we adopt the wave properties associated with the incident wave from the spilling breaker experiments of Ting & Kirby (Reference Ting and Kirby1994) for the present simulations, corresponding to period
 $T = 2$ s and wave height
 $H = 0.125$ m on a constant water depth
 $h = 0.4$ m. The numerically exact stream function wave (potential flow) solution of Fenton (Reference Fenton1988) (as implemented by Jacobsen et al. (Reference Jacobsen, Fuhrman and Fredsøe2012)) yields the dimensionless depth
 $k_w h=0.664$ and steepness
 $k_wH=0.207$. This wave solution is set as the initial conditions on a domain spanning a single wavelength with periodic left and right boundaries. An initially small turbulence field is set with
 $\tau _{11}=\tau _{22}=\tau _{33}=-\tau _{12}=-1.33\times 10^{-6} \ \textrm {m}^2\ \textrm {s}^{-2}$, such that the initial turbulent kinetic energy
 $k_0$ is
 $2.0 \times 10^{-6}\ \textrm {m}^2\ \textrm {s}^{-2}$. The set-up utilized (including mesh, discretization schemes and multi-phase flow solver) is adopted directly from Larsen & Fuhrman (Reference Larsen and Fuhrman2018), who performed similar tests utilizing two-equation (
 $k$–
 $\omega$) turbulence models. Specifically, the maximum Courant number is set to
 $Co=0.05$, and a diffusive balance scheme as discussed in Larsen, Fuhrman & Roenby (Reference Larsen, Fuhrman and Roenby2019) is adopted. The bottom boundary is modelled as a slip wall, to mimic potential flow as much as possible.
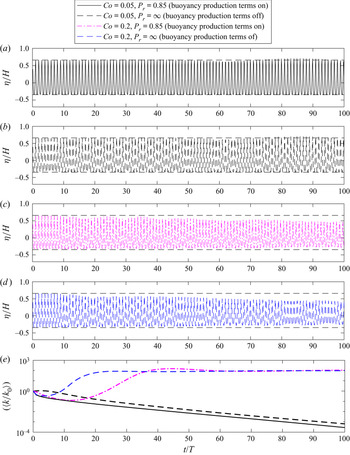
Figure 3 depicts time series of the dimensionless surface elevation as well as the period- and depth-averaged (note that  $[\cdot ]$ herein indicates depth-averaging) turbulence level over a simulated duration of
 $100T$. It is seen in figure 3(a) that the wave propagates with nearly constant form in both cases (the two results for the free-surface elevations are indistinguishable). It is seen from figure 3(b) that the case with
 $\alpha _b^*=0$ results in a growth rate in the turbulent kinetic energy that may indeed be reasonably characterized as zero. This result is consistent with our simplified analysis of this problem in § 2.2, again predicting that the model is neutrally stable. Minor deviations (e.g. the initial slow decay and later rise of
 $[\langle k/k_0 \rangle ]$) are relatively insignificant, and are likely due to terms neglected in the analysis and/or from accumulation of small numerical errors, which may cause the solution to deviate from the ideal potential flow solution over extended times. It is likewise seen from figure 3(b) that the buoyancy production term being active instead leads to a decay in turbulence levels. This is clearly due to the additional sink in turbulence caused by this term near the air–water interface, which was not considered in the formal stability analysis. Hence, both simulations largely confirm our analysis, that the Wilcox (Reference Wilcox2006) stress–
 $\omega$ model is indeed stable in the ideal potential flow core region beneath non-breaking surface waves. Note that both results presented in figure 3 differ considerably from the simulation using the Wilcox (Reference Wilcox2006)
 $k$–
 $\omega$ closure model in its standard form, as presented in figure 4(a) of Larsen & Fuhrman (Reference Larsen and Fuhrman2018), which resulted in immediate exponential growth of the eddy viscosity (hence turbulence) and eventual wave decay, due to this model's inherent instability, as shown and discussed therein.
Computed (a) surface elevation time series and (b) the time- and depth-averaged turbulence level for the progressive waves with the Wilcox (Reference Wilcox2006) stress– $\omega$ model, with buoyancy production term both off (
 $\alpha _b^*=0$) and on (
 $\alpha _b^*=1.36$).

3.2. Simulating the oscillatory turbulent wave boundary layer
We now turn our attention to the performance of the Wilcox (Reference Wilcox2006) stress– $\omega$ model in the bottom boundary layer region beneath waves, an area of special importance beneath both non-breaking and breaking waves. (Recall that this region was neglected in the previous wave train simulations due to the use of a slip condition at the sea bed.) For this purpose, we consider the experiments of Jensen, Sumer & Fredsøe (Reference Jensen, Sumer and Fredsøe1989) conducted in a full-scale oscillating tunnel facility. We specifically consider their Test 13, involving the boundary layer beneath a sinusoidally varying free-stream flow (having velocity magnitude
 $U_{0m}=2.0\ \textrm {m}\ \textrm {s}^{-1}$ and period
 $T=9.72$ s) yielding a Reynolds number
 $Re=aU_{0m}/\nu \approx 6\times 10^6$, where
 $a=U_{0m}/\sigma _w$ and
 $\nu =1.14 \times 10^{-6}\ \textrm {m}^2\ \textrm {s}^{-1}$. The bottom wall is rough, with Nikuradse's equivalent roughness
 $k_s=0.84$ mm. A model height of 0.145 m corresponding to half of the physical tunnel height (0.29 m) in Jensen et al. (Reference Jensen, Sumer and Fredsøe1989) is used, hence only the bottom boundary layer is simulated. The top boundary is treated as a frictionless (slip) lid. The bottom boundary is set as a no-slip wall, where the
 $\omega$ wall function with a viscous–inertial sublayer blending method (Menter & Esch Reference Menter and Esch2001; Popovac & Hanjalic Reference Popovac and Hanjalic2007) is applied, combined with a zero normal gradient condition for the Reynolds stress. The first cell centre near the bottom wall lies at
 $y_c/k_s=0.5$. An oscillatory body force is applied to drive the flow until an equilibrium (periodic in time) state is reached and comparisons are made.
Computed and experimental results are compared in figure 4 at four phases during the oscillation cycle:  $\sigma _w t=0^\circ$ (free-stream flow reversal),
 $45^\circ$ (flow acceleration due to a favourable pressure gradient),
 $90^\circ$ (peak free-stream flow) and
 $135^\circ$ (flow deceleration due to an adverse pressure gradient). Results are shown for the dimensionless mean flow
 $\bar {u}/U_{0m}$ (figure 4a); the turbulent kinetic energy density
 $k/U_{0m}^2$ (figure 4b), which for the experiments of Jensen et al. (Reference Jensen, Sumer and Fredsøe1989) has been empirically approximated from (Justesen Reference Justesen1991)
 \begin{equation} k={-}0.65(\tau_{11} + \tau_{22}); \end{equation}
as well as the Reynolds stress components  $-\tau _{11}/U_{0m}^2$,
 $-\tau _{22}/U_{0m}^2$ and
 $\tau _{12}/U_{0m}^2$ (figures 4c, 4d and 4e, respectively). Results computed utilizing both the Wilcox (Reference Wilcox2006) stress–
 $\omega$ and
 $k$–
 $\omega$ models are shown, such that those of the RSM (the primary focus of the present work) may be compared directly with a simpler two-equation model. Note that for the
 $k$–
 $\omega$ model, the Reynolds stress components are obtained directly from the Boussinesq approximation (2.32).
Comparison of computed and measured vertical profiles for (a)  $\bar {u}/U_{0m}$, (b)
 $\displaystyle k/U_{0m}^2$, (c)
 $\displaystyle -\tau _{11}/{U_{0m}^2}$, (d)
 $\displaystyle -\tau _{22}/U_{0m}^2$, (e)
 $\displaystyle \tau _{12}/U_{0m}^2$ and ( f)
 $\displaystyle U_{f}/U_{0m}$ for the oscillatory wave boundary layer case of Jensen et al. (Reference Jensen, Sumer and Fredsøe1989, their Test 13). The depicted CFD simulations utilize both the Wilcox (Reference Wilcox2006) stress–
 $\omega$ and
 $k$–
 $\omega$ turbulence models.

From figure 4(a) it is seen that the computed mean flow velocities from both models are largely similar, and in good agreement with the experiments. The most notable difference is the slight reduction (and increased accuracy) in the mean flow computed with the stress– $\omega$ model at phase
 $\sigma _w t=135^\circ$ (i.e. during adverse pressure and flow deceleration), relative to the
 $k$–
 $\omega$ model. This difference is explained immediately below. It is seen in figure 4(b) that the stress–
 $\omega$ model obviously improves the accuracy of the turbulence kinetic energy
 $k$, relative to the
 $k$–
 $\omega$ model, especially at phase
 $\sigma _w t=135^{\circ }$. Note that Sumer & Fuhrman (Reference Sumer and Fuhrman2020) have similarly documented relatively poor performance of the Wilcox (Reference Wilcox2006)
 $k$–
 $\omega$ model in simulating the deceleration stage of the wave boundary layer (see their figures 5.90–5.92), and this is a well-known deficiency with two-equation models in general (see e.g. Justesen (Reference Justesen1991) for similar finding with a
 $k$–
 $\varepsilon$ closure model). From inspection of the results just discussed in figure 4(a), it is clear that the over-prediction of
 $\bar {u}$ seen there with the
 $k$–
 $\omega$ model is associated with its under-prediction of
 $k$ at this phase, i.e. that the
 $k$–
 $\omega$ model does not extract enough energy from the mean flow during the flow deceleration stage. Since the form of the turbulence production term in the
 $k$ equation (
 $\tau _{ij}\partial \overline {u}_i/\partial {x_j}$, which simplifies to
 $\tau _{12}\partial \bar {u}/\partial y$ in the present horizontally uniform case) is theoretical (hence exact if its determination is free of error), it is then clear that this shortcoming must be due to inaccuracy of
 $\tau _{12}$ from the Boussinesq approximation (2.32).
The individual Reynolds stress component profiles at each stage are presented in figure 4(c–e). It is seen that the stress– $\omega$ model captures the dynamics of both the turbulent normal and shear stress components with better accuracy compared to the
 $k$–
 $\omega$ model, although
 $\tau _{11}$ and
 $\tau _{12}$ at
 $\sigma _w t=135 ^{\circ }$ are still slightly under-predicted in the near-bottom region. It is seen in figure 4(c,d) that
 $\tau _{11}$ and
 $\tau _{22}$ predicted by the
 $k$–
 $\omega$ model (blue dashed lines) are identical and deviate from the experimental measurements. This is simply because application of the Boussinesq approximation (2.32) for the present case leads simply to
 \begin{equation} \tau_{11}= \tau_{22} ={-}\frac{2}{3}k, \quad \tau_{12} = \nu_t \frac{\partial \bar{u}}{\partial y}, \end{equation}
the former of which is well known to be incorrect, even in the simpler case of a steady horizontally uniform turbulent boundary layer flow; see e.g. Chapter 3 of Sumer & Fuhrman (Reference Sumer and Fuhrman2020). In line with the discussion above, it is notable that  $\tau _{12}$ (figure 4e) is indeed under-predicted by the
 $k$–
 $\omega$ model at
 $\sigma _wt=135^\circ$. Overall, the Wilcox (Reference Wilcox2006) stress–
 $\omega$ model is demonstrated to be superior to the
 $k$–
 $\omega$ model in simulating the turbulence dynamics for the oscillatory wave boundary layer flows, as measured by Jensen et al. (Reference Jensen, Sumer and Fredsøe1989).
The measured and modelled friction velocity  $U_f$ is likewise presented in figure 4(f). In the experiment of Jensen et al. (Reference Jensen, Sumer and Fredsøe1989), the friction velocity was determined by fitting straight lines to the logarithmic-layer portion of the mean velocity distribution (see Sumer & Fuhrman Reference Sumer and Fuhrman2020, § 5.4.1). It is noted that the difference in the measurements for two half cycles are quite obvious, and are due to apparent asymmetries that occurred in the experiment, which are avoided in the numerical simulations. It is seen that both stress–
 $\omega$ and
 $k$–
 $\omega$ model results match the friction velocity closely for the first half cycle. The friction velocity simulated with the stress–
 $\omega$ model is identical to that with the
 $k$–
 $\omega$ model in the flow acceleration stage, while being slightly larger than that with the
 $k$–
 $\omega$ model in the peak and deceleration stages. As the difference in the measurements over the two half cycles is larger than that of the two numerical results, both numerical model results are considered acceptable.
3.3. Simulating spilling breaking waves
The preceding preliminary simulations have demonstrated potential advantages of using a stress– $\omega$ model (rather than a traditional two-equation
 $k$–
 $\omega$ turbulence closure) for applications relevant to non-breaking waves, ranging from the free surface (the progressive wave train) to the sea bottom (the turbulent wave boundary layer). Let us now apply the model to simulate breaking wave hydrodynamics, the primary aim of the present paper. For this purpose, we first consider the spilling breaking wave experiment of Ting & Kirby (Reference Ting and Kirby1994, Reference Ting and Kirby1996), to be followed by their plunging breaking wave experiment in the following subsection.
The numerical set-up for simulation of the experiments of Ting & Kirby (Reference Ting and Kirby1994, Reference Ting and Kirby1996) is shown in figure 5, where a  $\tan \beta =1/35$ constant slope is connected to a region having constant still water depth
 $h_0=0.4$ m. The origin is placed at the same water depth (
 $h=0.38$ m) as in the experiments, for consistency. A relaxation zone (Jacobsen et al. Reference Jacobsen, Fuhrman and Fredsøe2012) of one wavelength is set at the inlet for wave generation, which also serves to absorb any reflected waves. A no-slip condition along with standard smooth bed wall functions are employed as the bottom boundary conditions, since in the experiments of Ting & Kirby (Reference Ting and Kirby1994) and Ting & Kirby (Reference Ting and Kirby1996) a roughness value was not explicitly indicated. The computational mesh utilized is identical to that used previously by Larsen & Fuhrman (Reference Larsen and Fuhrman2018). Dimensional and dimensionless wave properties utilized for the simulation of both spilling and plunging breaking wave cases are indicated in table 1, where a numerically exact stream function (potential flow) theory is used for specification of the generated wave at the inlet. In table 1,
 $x_b$ denotes the position of incipient breaking and
 \begin{equation} \xi_0=\frac{\tan\beta}{\sqrt{H_0/L_0}} \end{equation}
is the surf similarity parameter, where  $L_0=gT^2/(2{\rm \pi} )$ is the deep-water wavelength and
 \begin{equation} H_0 = H\sqrt{\tanh(k_wh)\left(1+\frac{2k_wh}{\sinh(2k_wh)}\right)} \end{equation}
is the deep-water wave height, calculated according to linear wave theory. The breaking wave simulations are initially run for  $50T$ to reach equilibrium, followed by a subsequent
 $50T$ which is utilized for period-averaging purposes. The simulated spilling breaking case with the stress–
 $\omega$ model required approximately 12 days to run in parallel on 16 processors on the supercomputing cluster at the Technical University of Denmark (DTU). Note that the total computational time using the stress–
 $\omega$ model is approximately 15 % more than that using the
 $k$–
 $\omega$ model.
Computational domain set-up for plunging and spilling breaker cases corresponding to the breaking wave experiments of Ting & Kirby (Reference Ting and Kirby1994).

Wave properties for breaking wave simulations. Parameter  $x_b$ is the measured breaking point in Ting & Kirby (Reference Ting and Kirby1994) and
 $\xi _0$ is the surf similarity parameter.

To elucidate differences between the Wilcox (Reference Wilcox2006) stress– $\omega$ and two-equation
 $k$–
 $\omega$ turbulence closure models, simulations utilizing a stabilized version of the Wilcox (Reference Wilcox2006)
 $k$–
 $\omega$ model, as proposed by Larsen & Fuhrman (Reference Larsen and Fuhrman2018) (with stress-limiter coefficients
 $\lambda _1=0.2$ and
 $\lambda _2=0.05$, as suggested there and in their notation), are also considered for comparison. This model will hereafter be called the LF18
 $k$–
 $\omega$ model. Note that results based on the LF18
 $k$–
 $\omega$ model have been re-simulated for presentation herein, to ensure full consistency with the stress–
 $\omega$ results. This ensures that any effects associated, for example, with the specific OpenFOAM software version or boundary treatment are fully controlled for. (Such effects have not been found to be very significant, but this accounts for subtle differences in the results presented herein compared to those originally presented in Larsen & Fuhrman (Reference Larsen and Fuhrman2018).)
To begin our investigation, figure 6 depicts a snapshot of the spilling breaker turbulent kinetic energy (here presented dimensionless as  $k/(gh_0)$, where
 $h_0=0.4$ m is the constant still water depth prior to the slope) simulated with the Wilcox (Reference Wilcox2006) stress–
 $\omega$ model at
 $t/T=100$. It is observed that there is no sign of turbulence over-production prior to breaking, indicating that the Wilcox (Reference Wilcox2006) stress–
 $\omega$ model is indeed stable, i.e. free of unphysical exponential growth of turbulence in nearly potential flow regions. This is once again consistent with our analysis of this model (§ 2) as well as our previous CFD simulations involving a progressive wave train (§ 3.1). The present result is in stark contrast to those stemming from two-equation models (both
 $k$–
 $\omega$ and
 $k$–
 $\varepsilon$ variants) in their standard forms; see e.g. Brown et al. (Reference Brown, Greaves, Magar and Conley2016), Larsen & Fuhrman (Reference Larsen and Fuhrman2018, their figure 6a,b), Larsen et al. (Reference Larsen, van der A, van der Zanden, Ruessink and Fuhrman2020) and Fuhrman & Li (Reference Fuhrman and Li2020, their figure 7a).
Snapshot of the spilling breaker turbulent kinetic energy simulated with the Wilcox (Reference Wilcox2006) stress– $\omega$ model at
 $t/T=100$.

Figure 7 shows the surface elevation envelopes for the spilling breaker simulations, where  $\langle \eta \rangle$ is the period-averaged mean water level (over the final 50
 $T$), and
 $\eta _{max}$ and
 $\eta _{min}$ are respectively the averaged maximum and minimum surface elevations. Results from both the stress–
 $\omega$ and LF18
 $k$–
 $\omega$ models are shown separately. The grey shaded regions depict plus and minus one standard deviation, hence indicating the degree of wave-to-wave variability. Good agreement is observed in figure 7(a) between the simulation with the Wilcox (Reference Wilcox2006) stress–
 $\omega$ model and the measurements of Ting & Kirby (Reference Ting and Kirby1994). The predicted breaking point (where
 $\eta _{max}-\langle \eta \rangle$ is the highest) is consistent with the experimental measurement. The surface elevation envelopes predicted by the LF18
 $k$–
 $\omega$ model are also similarly in line with the experimental measurement (figure 7b), consistent with previous demonstrations.
Period-averaged surface elevation envelopes for the spilling breaker simulated with (a) the Wilcox (Reference Wilcox2006) stress– $\omega$ model and (b) the LF18
 $k$–
 $\omega$ model, comparing with the experimental measurement of Ting & Kirby (Reference Ting and Kirby1994). Grey shaded areas are the plus and minus one standard deviation.

Figure 8(a–d) compares the computed phase-averaged surface elevations with the experimental measurements of Ting & Kirby (Reference Ting and Kirby1994) at four post-breaking cross-shore locations, where  $\bar {\eta }$ denotes the phase-averaged surface elevation and
 $\langle \eta \rangle$ denotes the period-averaged surface elevation. Additionally, the two model results are compared even further onshore (
 $x=9.725$ m) in figure 8(e), for completeness. (Although the phase-averaged surface elevations from the experiments were not directly reported at this position, velocity and turbulence profiles were, to be presented in what follows.) It is seen that the numerical predictions with both turbulence models are generally in line with the experimental data for the three positions furthest offshore (figure 8a–c). Further onshore, the stress–
 $\omega$ model maintains this accuracy. However, it is seen in figure 8(d,e) that the wave front computed with the LF18
 $k$–
 $\omega$ model is well ahead of what was measured. This was also noticed by Larsen & Fuhrman (Reference Larsen and Fuhrman2018), indicating that the breaking bore travels too rapidly in the inner surf zone. Larsen & Fuhrman (Reference Larsen and Fuhrman2018) (see their figure 10) showed clearly that this problem was due to the conventional stress-limiter on the eddy viscosity (controlled by the
 $\lambda _1$ coefficient in their notation) within the Wilcox (Reference Wilcox2006)
 $k$–
 $\omega$ model. Simulations where this feature was on (
 $\lambda _1>0$) resulted in significantly improved results (in terms of undertow velocity and turbulence profiles) in the outer surf zone, but at the expense of reduced accuracy in the inner surf zone. The stress–
 $\omega$ model, on the other hand, breaks free of the eddy viscosity concept altogether, and hence avoids this issue entirely.
Phase-averaged surface elevation for the spilling breaker from the experimental measurement of Ting & Kirby (Reference Ting and Kirby1994) and the present simulations. (a–c) The outer surf zone; (d,e) the inner surf zone.

Let us now turn our attention to the turbulence quantities beneath the spilling breaking waves. Ting & Kirby (Reference Ting and Kirby1994, Reference Ting and Kirby1996) have reported results for  $\sqrt {\langle k\rangle }$,
 $\langle \sqrt {-\tau _{11}} \rangle$ and
 $\langle \tau _{22}\rangle /\langle \tau _{11}\rangle$ at each measurement position. Although the measurements for
 $\langle \tau _{22}\rangle$ were not directly reported, they can be obtained from their reported
 $\sqrt {\langle k\rangle }$ and
 $\langle \tau _{22}\rangle /\langle \tau _{11}\rangle$ values. In Ting & Kirby (Reference Ting and Kirby1994), because the transverse velocity component was not measured,
 $k$ was estimated empirically by
 \begin{equation} \left\langle k \right\rangle = \tfrac{-1.33}{2}\left( \langle \tau_{11}\rangle+\langle \tau_{22}\rangle \right), \end{equation}
which is also utilized for the experimental  $k$ values presented in what follows. For the LF18
 $k$–
 $\omega$ model, the Reynolds stress components are again obtained directly from the Boussinesq approximation (2.32).
Figures 9 and 10 compare specific period-averaged Reynolds normal stress (non-dimensionalized  $-\tau _{11}=\overline {u^\prime u^\prime }$ and
 $-\tau _{22}=\overline {v^\prime v^\prime }$ period-averaged over the final simulated
 $50T$; results are similarly period-averaged in several forthcoming figures) profiles at each of the measured cross-shore positions. Figure 11 similarly presents a comparison of computed and measured period-averaged turbulent kinetic energy density
 $k$ profiles. From these figures, it can be surmised that both the Wilcox (Reference Wilcox2006) stress–
 $\omega$ model and the LF18
 $k$–
 $\omega$ model predict Reynolds normal stress components that are reasonably, though not perfectly, in line with the measurements. It is noted that the stress–
 $\omega$ model predicts streamwise normal stresses (
 $\tau _{11}$) significantly better than vertical ones (
 $\tau _{22}$). This might be attributed to the simple formulation of pressure–strain closure in the Wilcox (2006) stress–
 $\omega$ model, as the streamwise normal stresses (
 $\tau _{11}$) are dominated by the production term
 $P_{11}$ while
 $\tau _{22}$ is mainly driven by the pressure–strain correlation
 $\varPi _{22}$. It is seen in figure 11(d–h) that there is also a tendency for the LF18
 $k$–
 $\omega$ model to predict more accurate turbulence near the free surface, where the stress–
 $\omega$ model predicts slightly higher turbulence than the
 $k$–
 $\omega$ model. This can also be attributed to the standard Wilcox (Reference Wilcox2006) stress-limiting feature in the
 $k$–
 $\omega$ model, as shown through systematic testing by Larsen & Fuhrman (Reference Larsen and Fuhrman2018, compare e.g. Cases 3 and 5 in their figure 12).
Period-averaged Reynolds normal stress  $-\tau _{11}$ for the spilling breaker from the experimental measurement of Ting & Kirby (Reference Ting and Kirby1994) and the present simulations. (a,b) The pre-breaking region; (c–e) the outer surf zone; ( f–h) the inner surf zone.

Period-averaged Reynolds normal stress  $-\tau _{22}$ for the spilling breaker from the experimental measurement of Ting & Kirby (Reference Ting and Kirby1994, Reference Ting and Kirby1996) and the present simulations.

Period-averaged turbulent kinetic energy  $k$ for the spilling breaker from the experimental measurement of Ting & Kirby (Reference Ting and Kirby1994) and the present simulations.

Let us now similarly investigate the computed Reynolds shear stresses  $\tau _{12}=-\overline {u^\prime v^\prime }$, which can be expected to play a much more important role in terms of flow resistance than the turbulent normal stresses. Figure 12 compares the period-averaged
 $\tau _{12}$ (again over the final simulated
 $50T$) profiles from both models at all eight measurement positions considered previously. Note that this quantity was not reported by Ting & Kirby (Reference Ting and Kirby1994), and thus we are not able to compare directly with their measurements; nevertheless, important differences between the two models are revealed. It is seen from figure 12(a–d) that neither model predicts significant Reynolds shear stress prior to breaking (as should be expected) or in the outer surf zone. However, further shoreward the Reynolds shear stress predicted with the Wilcox (Reference Wilcox2006) stress–
 $\omega$ model is significantly larger than with the LF18
 $k$–
 $\omega$ model, particularly in the upper part of the water column i.e. near the surface. These differences can also be seen directly in figure 13, which compares (phase-averaged) snapshots of the specific Reynolds shear stress (
 $\tau _{12}$) field beneath breaking bores computed with both models in the inner surf zone. The instant shown has been selected such that the surface breaking wave front is approximately at the innermost measurement position (
 $x=9.725$ m). The increased Reynolds shear stresses with the stress–
 $\omega$ model will in turn increase flow resistance in the upper part of the water column. Although we again cannot compare directly with measurements of
 $\tau _{12}$ in the present case, it is now evident that it is this increased flow resistance that is responsible for slowing the propagation of the breaking wave front in the inner surf zone, bringing the resulting (phase-averaged) surface elevation time series computed with the stress–
 $\omega$ model in line with that measured (see again e.g. figure 8d). In Larsen & Fuhrman (Reference Larsen and Fuhrman2018), the flow resistance was represented through the eddy viscosity
 $\nu _t$, as shown in their figure 14. A higher eddy viscosity in the upper part of the flow extracts more energy from the mean flow, which reduces the mean flow velocities. However, the stress–
 $\omega$ model does not utilize the eddy viscosity assumption. Therefore, we compare the flow resistance between two turbulence models through
 $P_k$, as given in (2.31) and (2.33a,b), which represents the rate at which kinetic energy is transferred from the mean flow to the turbulence (Wilcox Reference Wilcox2006, p. 109). For the stress–
 $\omega$ model, the turbulence shear production is in the form of
 $\tau _{12} S_{12}$ which is seen to be the rate at which work is done by the mean shear strain rate against the Reynolds shear stress. Therefore,
 $P_k$ is an indicator of flow resistance that is induced by the Reynolds shear stress
 $\tau _{12}$. For the two-equation model,
 $P_k$ is calculated based on
 $\nu _t$, as is presented in (2.33a,b). As shown in figure 14 in the upper part of the flow (right beneath the breaking bore), the shear production of turbulence with the stress–
 $\omega$ model is larger than with LF18
 $k$–
 $\omega$ model, indicating higher flow resistance near the broken wave surface with the stress–
 $\omega$ model. The related effects on the period-averaged undertow velocity profiles are considered in the next paragraph.
Period-averaged specific Reynolds shear stress  $\tau _{12}$ for the spilling breaker from the experimental measurement of Ting & Kirby (Reference Ting and Kirby1994) and the present simulations.

Phase-averaged  $\tau _{12}$ at
 $t/T=0.08$ for the spilling breaker case computed with the (a) Wilcox (Reference Wilcox2006) stress–
 $\omega$ model and (b) LF18
 $k$–
 $\omega$ model. Results are scaled using the depth
 $h=0.102$ m at
 $x=9.725$ m.

Period-averaged  $P_k$ for the spilling breaker from the present simulations.

As hinted immediately above, figure 15 compares computed and measured period-averaged undertow velocity profiles. It is seen that the stabilized LF18  $k$–
 $\omega$ model provides accurate undertow velocity profiles before wave breaking and in the outer surf zone (figure 15a–e), generally consistent with the earlier findings of Larsen & Fuhrman (Reference Larsen and Fuhrman2018). Once reaching the inner surf zone (figure 15f–h), however, the LF18
 $k$–
 $\omega$ model yields exaggerated undertow velocities. In contrast, the stress–
 $\omega$ model maintains consistent accuracy in the computed undertow velocity profile across the entirety of the measured surf zone, resulting in a significant increase in accuracy. These differences seem clearly linked to the increased flow resistance near the surface shown in figure 12(e–h) and figure 13, and the related increased accuracy of the breaking bore propagation evident from figure 8(d). As the Reynolds shear stress in two-equation turbulence closure models is computed based on the Boussinesq approximation, it seems clear that this classical assumption utilized within two-equation models (even in their stabilized form) fails to yield the correct evolution of the flow resistance in the inherently complicated inner surf zone, which further leads to locally inaccurate undertow predictions.
Period-averaged undertow velocity profiles for the spilling breaker from the experimental measurement of Ting & Kirby (Reference Ting and Kirby1994) and the present simulations.

The accurate prediction of undertow velocities is of major importance in the fluid mechanics of the surf zone, as they are important drivers of fluid, pollutants and sediment transport in nearshore coastal regions. Despite this importance, the problem of inaccurate undertow velocity profiles has consistently plagued RANS CFD simulations of breaking waves over the past two decades. The present results utilizing the Wilcox (Reference Wilcox2006) stress– $\omega$ model are novel, in that they represent the first time that consistent quantitative accuracy in the computed undertow has been maintained throughout the entirety of the nearshore wave breaking process, i.e. during shoaling (prior to breaking), to the outer surf zone and all the way into the inner surf zone. Other RANS models (typically using two-equation turbulence closure) yield incorrect undertow structure prior to breaking and in the outer surf zone (e.g. Lin & Liu Reference Lin and Liu1998; Brown et al. Reference Brown, Greaves, Magar and Conley2016; Devolder et al. Reference Devolder, Troch and Rauwoens2018; Liu et al. Reference Liu, Ong, Obhrai, Gatin and Vukčević2020) or exaggerated undertow in the inner surf zone (e.g. Jacobsen et al. Reference Jacobsen, Fuhrman and Fredsøe2012; Larsen & Fuhrman Reference Larsen and Fuhrman2018; Larsen et al. Reference Larsen, van der A, van der Zanden, Ruessink and Fuhrman2020), or both. A detailed discussion of the results and problems in previous works is presented in § 4.
3.4. Simulating plunging breaking waves
We now employ the Wilcox (Reference Wilcox2006) stress– $\omega$ model to simulate the plunging breaking wave experiments of Ting & Kirby (Reference Ting and Kirby1994, Reference Ting and Kirby1996). For these simulations the numerical set-up and protocol are identical to that used for spilling breakers in § 3.3, with the wave parameters as indicated in table 1. The simulation of the plunging breaking waves required approximately 25 days to run in parallel on 16 processors on the supercomputing cluster at DTU. As before, comparison is made with the LF18
 $k$–
 $\omega$ model (Larsen & Fuhrman Reference Larsen and Fuhrman2018), which again represents a stabilized form of the basic model presented by Wilcox (Reference Wilcox2006). As much of the story to follow bears similarity to that in § 3.3, it will be told with far greater brevity in the present subsection.
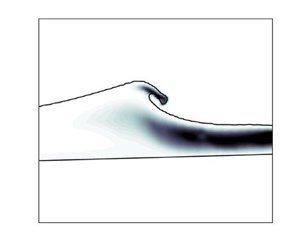
Figure 16 depicts a snapshot of the dimensionless turbulence field  $k/(\omega \nu )$ for the plunging breaking case, computed with the stress–
 $\omega$ model at a time instant of
 $t/T=50.825$, similar to figure 6. This time instant has been chosen, as it corresponds to wave over-turning just prior to the subsequent plunge. Similar to our findings in the spilling breaking case, there is no turbulence over-production prior to wave breaking. This should by now be expected as we have definitively established that the stress–
 $\omega$ model is stable in nearly potential flow regions beneath surface waves. It can be noted that this plunging case is not nearly as prone to significant turbulence over-production prior to breaking as the spilling case, because the unstable growth rate is much smaller due to a small value of
 $[\langle p_0 \rangle ]$, as discussed by Larsen & Fuhrman (Reference Larsen and Fuhrman2018).
Snapshot of the plunging breaker turbulent kinetic energy simulated with the Wilcox (Reference Wilcox2006) stress– $\omega$ model at
 $t/T=100$.

Figure 17 compares the surface elevation envelopes from the model simulations with the experimental measurements, similar to figure 7. A reasonable match is again achieved. Both the Wilcox (Reference Wilcox2006) stress– $\omega$ and LF18
 $k$–
 $\omega$ models predict the breaking point, and subsequent wave decay, reasonably. The set-up in the mean water level is likewise similarly well predicted. It is noted that right after the breaking point (at
 $x \approx 8$ m), the maximum surface elevation predicted with both numerical models has small deviations from the experimental measurement (with the stress–
 $\omega$ model result being slightly closer to the measurement). This deviation could be due to the plunging jet splashing down and causing turbulent mixture of the surface layer (as discussed in Brocchini (Reference Brocchini2002)) which makes accurate modelling challenging. However, our numerical models are able to show reasonable consistency with the measurements, with minor deviations in the splash region. Comparisons of computed and measured phase-averaged time series of the surface elevation at several measurement positions are additionally provided in figure 18. Interestingly, apart from the deviations near the crest in figure 18(c–e) with the
 $k$–
 $\omega$ model, the computed wave front in the present plunging case does not propagate noticeably faster with the
 $k$–
 $\omega$ model in the inner surf zone. This differs from our findings in the spilling case (see figure 8d,e), and is explained later in this subsection.
Surface elevation envelopes for the plunging breaker simulated with (a) the present Wilcox (Reference Wilcox2006) stress– $\omega$ model and (b) the LF18
 $k$–
 $\omega$ model, comparing with the experimental measurement of Ting & Kirby (Reference Ting and Kirby1994). Grey shaded areas are the plus and minus one standard deviation.

Phase-averaged surface elevation for the plunging breaker from the experimental measurement of Ting & Kirby (Reference Ting and Kirby1995) and the present simulations. (a–c) The outer surf zone; (d,e) the inner surf zone.

Computed and measured (when available) period-averaged (over the final  $50T$, as before) turbulent normal stress profiles are compared in figures 19 (for
 $-\tau _{11}$) and 20 (for
 $-\tau _{22}$), with profiles for the turbulent kinetic energy density
 $k$ similarly presented in figure 21. In the experiments,
 $k$ was again estimated from (3.7). As Ting & Kirby (Reference Ting and Kirby1994) did not provide measurement data for
 $\langle -\tau _{22}\rangle$ or
 $\langle \tau _{22}\rangle /\langle \tau _{11}\rangle$ for their plunging case, only model results are shown in figure 20. From these figures it is seen that the two models seem to provide comparable accuracy for the turbulent normal stresses, similar to what was shown in our prior simulations involving spilling breaking waves. The results for
 $k$ are somewhat more accurate with the stress–
 $\omega$ model specifically at
 $x=9.795$ m (figure 21g), though this increased accuracy is not consistent throughout the surf zone as a whole. The overall predictions for
 $k$ in the inner surf zone with both turbulence models are larger than the measurement with a maximum factor of two (figure 21g). The reason remains uncertain to the authors. However, it is worthwhile to mention that the experimental study of Scott et al. (Reference Scott, Cox, Maddux and Long2005) presented
 $k$ profiles post-processed with three different turbulence separation methods, with results varying by up to a factor of two to six from one another. The vertical gradient of their largest prediction is much higher than that of the lowest prediction (as shown in their figure 5). Therefore, the difference between our numerical results and the measurement of Ting & Kirby (Reference Ting and Kirby1994) might still be considered reasonable.
Period-averaged specific Reynolds normal stress  $-\tau _{11}$ profiles for the plunging breaker from the experimental measurement of Ting & Kirby (Reference Ting and Kirby1994) and the present simulations. (a,b) The pre-breaking region; (c–e) the outer surf zone; ( f–h) the inner surf zone.

Period-averaged specific Reynolds normal stress  $-\tau _{22}$ profiles for the plunging breaker from the present simulations.

Period-averaged turbulent kinetic energy  $k$ profiles for the plunging breaker from the experimental measurement of Ting & Kirby (Reference Ting and Kirby1994) and the present simulations.

Figure 22 presents the computed phase-averaged  $\tau _{12}$ field in the surf zone for the plunging case with both models, in a fashion similar to figure 13. The phase plotted has been selected to capture the propagation of the breaking wave front in the inner surf zone. Similar to our findings in the spilling case, it is clearly seen that the stress–
 $\omega$ model predicts turbulent shear stresses that are significantly larger in the inner surf zone than that with the
 $k$–
 $\omega$ model. It can thus be expected to result in increased flow resistance in this region. From comparison of figures 22 and 13 it is also seen that the increased turbulent shear stresses in the plunging case are spread more uniformly throughout the water column than in the spilling case, where they were more concentrated near the surface. This is likely due to the more violent surf zone initiated by the plunging breaking, and thus also explains why the breaking surface front propagates at approximately the same speed in the inner surf zone with both models in the present case (see again figure 18). The flow resistance indicated by
 $P_k$ for the plunging breaker is likewise presented in figure 23. It is clearly seen that in the upper part of the flow,
 $P_k$ predicted with the stress–
 $\omega$ model is much larger than that predicted with the LF18
 $k$–
 $\omega$ model, indicating higher flow resistance and therefore smaller magnitude of mean flow velocity with the stress–
 $\omega$ model.
Phase-averaged  $\tau _{12}$ at
 $t/T=0.30$ for the plunging breaker case computed with the (a) Wilcox (Reference Wilcox2006) stress–
 $\omega$ model and (b) LF18
 $k$–
 $\omega$ model. Results are scaled using the depth
 $h=0.083$ m at
 $x=10.395$ m.

Period-averaged  $P_k$ for the plunging breaker from the present simulations.

Figure 24 finally compares computed and measured undertow velocity profiles. It is seen that before wave breaking (figure 24a–c), the numerical simulations with both turbulence models are almost identical, and are in line with the experimental measurement. This is as expected, since both model variants considered herein are formally stable in the potential flow regions beneath surface waves; hence the choice of turbulence model has little impact prior to breaking. Results are also similar in the outer surf zone, as seen in figure 24(d,e). Much more significant differences become apparent once the inner surf zone is reached, as seen in figure 24( f–h). Consistent with the previously considered spilling breaking case (figure 15), in the inner surf zone the LF18  $k$–
 $\omega$ model results in undertow velocity profiles that are much larger than were measured. The LF18 turbulence model similarly yielded over-predicted undertow velocities in the simulation of large-scale plunging breakers made by Larsen et al. (Reference Larsen, van der A, van der Zanden, Ruessink and Fuhrman2020). It is thus now evident that this is a consistent shortcoming with this model, which stems from the inclusion of the traditional stress-limiter within the Wilcox (Reference Wilcox2006)
 $k$–
 $\omega$ model (see again the comparisons made by Larsen & Fuhrman (Reference Larsen and Fuhrman2018), with this feature switched on and off). The stress–
 $\omega$ model, on the other hand, reduces this exaggeration considerably, though not completely. The undertow profiles predicted with this model in the inner surf zone are much more uniform, having a similar structure to what has been measured. The reduction in the undertow magnitudes computed with the stress–
 $\omega$ model is consistent with the increased flow resistance in the inner surf zone, as illustrated in figures 22 and 23.
Period-averaged undertow velocity profiles for the plunging breaker from the experimental measurement of Ting & Kirby (Reference Ting and Kirby1994) and the present simulations.

Though a substantial improvement of the predicted undertow in the inner surf zone is seen with the stress– $\omega$ model, there are still some disagreements between the stress–
 $\omega$ model prediction and the experimental measurement for the plunging breaker (figure 24f–h). The reasons are, as yet, uncertain to the authors. One possible reason could be the simplistic formulation of the pressure–strain terms in the Wilcox (Reference Wilcox2006) stress–
 $\omega$ model, for which more complex closures for pressure–strain terms could potentially make further improvement for the undertow predictions in the complicated inner surf zone of plunging breakers. Another possible reason could be air bubbles entrained in the plunging surf zone. The present study has not specifically employed a model for the air bubbles/pockets. The bubble-mass cascade phenomena (Chan et al. Reference Chan, Johnson, Moin and Urzay2021) and the bubble breakup in the inner surf zone may further increase the flow resistance. These may be interesting to investigate in future work.
4. Discussion
The present work represents the first time that such accurate prediction of the breaking point, turbulence characteristics and evolution of the undertow structure from pre-breaking to the inner surf zone has been achieved with a single turbulence closure model for both the spilling and plunging breaking cases of Ting & Kirby (Reference Ting and Kirby1994, Reference Ting and Kirby1996), which have widely served as the basis for validating breaking wave models over the past two decades. In what follows, we provide a discussion of the results and problems encountered in previous studies which have attempted to model breaking waves with comparable CFD models. Such results mainly fall into three categories:
(i) Over-production of turbulence prior to breaking, especially in the spilling case. Models in this category become polluted due to unphysical turbulence over-production during the shoaling process, i.e. before the wave breaking process even starts, and therefore cannot claim to have modelled correctly the processes leading up to and including the surf zone. Results in this category typically stem from two-equation closure models in their standard forms, as the analysis of Larsen & Fuhrman (Reference Larsen and Fuhrman2018) has proved that these are (asymptotically) unconditionally unstable in nearly potential flow regions beneath non-breaking surface waves. Numerous examples include wave breaking simulations using standard formulations of the  $k$–
 $\varepsilon$ turbulence model (e.g. Lin & Liu Reference Lin and Liu1998; Bradford Reference Bradford2000; Xie Reference Xie2013; Brown et al. Reference Brown, Greaves, Magar and Conley2016; Derakhti et al. Reference Derakhti, Kirby, Shi and Ma2016b). Results using the ‘non-stabilized’ (standard) variant of the realizable
 $k$–
 $\varepsilon$ model to simulate breaking waves by Fuhrman & Li (Reference Fuhrman and Li2020) also fall into this category. The same problem is also evident in SPH simulations coupled with a
 $k$–
 $\varepsilon$ model (e.g. Shao Reference Shao2006). Likewise, results from
 $k$–
 $\omega$ or
 $k$–
 $\omega$ SST closure models have also demonstrated the same turbulence over-production problem (e.g. Brown et al. Reference Brown, Greaves, Magar and Conley2016; Devolder et al. Reference Devolder, Troch and Rauwoens2018; Liu et al. Reference Liu, Ong, Obhrai, Gatin and Vukčević2020). Results using ‘non-stabilized’ variants of the
 $k$–
 $\omega$ model by Larsen & Fuhrman (Reference Larsen and Fuhrman2018), i.e. those having
 $\lambda _2=0$ (their notation), would similarly fall into this category. In some other works employing standard two-equation models, the undertow velocity profiles and turbulence were simply not presented. For example, Lupieri & Contento (Reference Lupieri and Contento2015) utilized the
 $k$–
 $\omega$ SST model, but did not present undertow and turbulent kinetic energy predictions. However, the phase-averaged surface elevations for both spilling and plunging breakers near the breaking point were significantly under-predicted, which would be consistent with a polluted pre-breaking region, causing the simulated waves to decay prematurely. Similarly, Chella et al. (Reference Chella, Bihs, Myrhaug and Muskulus2015) utilized a standard
 $k$–
 $\omega$ model to simulate breaking waves, but did not present detailed predictions of either undertow or turbulence. As turbulence models of this type were shown by Larsen & Fuhrman (Reference Larsen and Fuhrman2018) to be formally unstable, combined with the numerous simulations with similar models leading to turbulence over-production noted above, there would seem to be little doubt as to the inherent instability in the nearly potential flow leading up to wave breaking in their model. It is worth mentioning that some recent notable works using two-equation turbulence closure models have attempted to improve the accuracy of breaking wave modelling by focusing on the air–water interface region near the surface. For example, Devolder et al. (Reference Devolder, Troch and Rauwoens2018) added buoyancy production terms to the
 $k$–
 $\omega$ and
 $k$–
 $\omega$ SST models, to account for density gradients near the air–water interface. Additionally, Liu et al. (Reference Liu, Ong, Obhrai, Gatin and Vukčević2020) applied a free-surface jump condition to the
 $k$–
 $\omega$ SST model, while also separately considering a variant incorporating buoyancy production as in Devolder et al. (Reference Devolder, Troch and Rauwoens2018), to simulate the experiments of Ting & Kirby (Reference Ting and Kirby1994, Reference Ting and Kirby1996). Their works showed that such features could improve prediction of the breaking point relative to standard models without these features. However, over-production of turbulence prior to breaking still clearly persists in these models, which is especially apparent in the spilling case, as can clearly be seen, for example, in figure 17 of Liu et al. (Reference Liu, Ong, Obhrai, Gatin and Vukčević2020). This is also clear from results of Larsen & Fuhrman (Reference Larsen and Fuhrman2018) and Larsen et al. (Reference Larsen, van der A, van der Zanden, Ruessink and Fuhrman2020) using ‘non-stabilized’ models, but where buoyancy production was still included, as also discussed by Fuhrman & Larsen (Reference Fuhrman and Larsen2020). These results thus collectively indicate that, while inclusion of buoyancy production will cause a local sink of turbulent kinetic energy near the free surface (and thus may be beneficial), it does little to stabilize two-equation turbulence models (and hence avoid turbulence over-production) in the nearly potential flow core region prior to breaking as a whole.
(ii) Turbulence over-production eliminated prior to breaking, but undertow poorly predicted in the inner or outer surf zone. This category consists of CFD simulations using turbulence models which avoid turbulence over-production prior to breaking, but typically yield poor undertow velocity structure and/or magnitude in either the outer or the inner surf zone (e.g. Mayer & Madsen Reference Mayer and Madsen2000; Jacobsen et al. Reference Jacobsen, Fuhrman and Fredsøe2012; Jacobsen, Fredsoe & Jensen Reference Jacobsen, Fredsoe and Jensen2014; Larsen & Fuhrman Reference Larsen and Fuhrman2018; Fuhrman & Li Reference Fuhrman and Li2020). This category can be further subdivided into those turbulence closure models which incorporate a conventional stress-limiter on the eddy viscosity (corresponding to  $\lambda _1>0$ in the notation of Larsen & Fuhrman (Reference Larsen and Fuhrman2018)) and those which do not (corresponding to
 $\lambda _1=0$, again in their notation). Mayer & Madsen (Reference Mayer and Madsen2000) made the first attempt to control the instability inherent in the standard
 $k$–
 $\omega$ model through ad hoc modification of the production terms (i.e. the production terms in the
 $k$ and
 $\omega$ equations were modified to be based on the rotation-rate tensor instead of the strain-rate tensor). Jacobsen et al. (Reference Jacobsen, Fuhrman and Fredsøe2012, Reference Jacobsen, Fredsoe and Jensen2014) adopted the modification of Mayer & Madsen (Reference Mayer and Madsen2000), such that the turbulence over-production in the potential flow region prior to breaking was avoided, while also incorporating a conventional stress-limiter on the eddy viscosity. The resulting model yielded reasonable prediction of the undertow velocity structure in the spilling breaking case of Ting & Kirby (Reference Ting and Kirby1994), both prior to breaking and in the outer surf zone, but unfortunately resulted in exaggerated undertow magnitudes (by a factor of approximately two) in the inner surf zone. Larsen & Fuhrman (Reference Larsen and Fuhrman2018) discussed theoretical inconsistencies with the modification proposed by Mayer & Madsen (Reference Mayer and Madsen2000) (namely, that it leaves the Reynolds stress tensor doubly defined) and instead formally stabilized two-equation models through re-formulation of the eddy viscosity. Fuhrman & Li (Reference Fuhrman and Li2020) adopted a similar approach and stabilized the realizable
 $k$–
 $\varepsilon$ model. The ‘stabilized’ model results of Larsen & Fuhrman (Reference Larsen and Fuhrman2018) with the conventional stress-limiter on (
 $\lambda _1>0$) were qualitatively similar to those of Jacobsen et al. (Reference Jacobsen, Fuhrman and Fredsøe2012), with undertow velocity profiles quite accurate prior to breaking and in the outer surf zone, but exaggerated in the inner surf zone. Larsen & Fuhrman (Reference Larsen and Fuhrman2018) additionally conducted simulations where their ‘stabilized’ closure models had the conventional stress-limiter switched off (
 $\lambda _1=0$ in their notation). This variant produced quite accurate undertow profiles in the inner surf zone, but at the expense of grossly over-predicted turbulence levels and erroneous undertow structure in the outer surf zone. From this comparison, it seems clear that the classical Boussinesq approximation utilized within two-equation turbulence closure models (even with advanced features, such as stress-limiters) is not capable of yielding the correct evolution of the flow resistance beneath breaking waves over the entirety of the surf zone, even in the relatively calm conditions associated with spilling breaking. Experience with ‘stabilized’ closure models in the CFD simulation of plunging breaking waves (Larsen et al. Reference Larsen, van der A, van der Zanden, Ruessink and Fuhrman2020; Sumer & Fuhrman Reference Sumer and Fuhrman2020) has likewise produced results that are generally consistent with those described above. As such, while the models cited above avoid over-production of turbulence in potential flow regions prior to the onset of breaking, none can reasonably claim to have accurately simulated the breaking process (including accurate evolution of the undertow velocity profile) across the entirety of the surf zone in either the spilling or plunging cases of Ting & Kirby (Reference Ting and Kirby1994, Reference Ting and Kirby1996).
(iii) Results simulated with other CFD approaches such as LES and SPH with a subgrid-scale turbulence model. We finally discuss results from a third category, consisting of models not working within the confines of RANS equations. Watanabe & Saeki (Reference Watanabe and Saeki1999) applied LES with a subgrid-scale model to simulate breaking waves. However, their model was only qualitatively validated. Christensen (Reference Christensen2006) simulated both spilling and plunging breaking wave experiments of Ting & Kirby (Reference Ting and Kirby1994, Reference Ting and Kirby1996) with LES and two different subgrid-scale models, one in terms of the Smagorinsky model and the other based on the  $k$ equation. However, compared with the present results, the breaking points were not accurately captured and the turbulence levels were in general too high compared with experiments of Ting & Kirby (Reference Ting and Kirby1994, Reference Ting and Kirby1996). Zhou et al. (Reference Zhou, Hsu, Cox and Liu2017) also conducted LES with a Lagrangian dynamic subgrid closure model. Their model over-predicted the turbulent intensity especially near the surface. The undertow velocities were more or less similar to those of the work of Jacobsen et al. (Reference Jacobsen, Fredsoe and Jensen2014) which have been classified into category (ii) above. Makris, Memos & Krestenitis (Reference Makris, Memos and Krestenitis2016) applied a SPH approach with a Smagorinsky-type subparticle-scale approach, which is similar to the LES concept. Their study on a weakly plunging breaker showed clear underestimation of the ensemble-averaged surface elevation at the incipient breaking region compared with the experiment of Stansby & Feng (Reference Stansby and Feng2005). Lowe et al. (Reference Lowe, Buckley, Altomare, Rijnsdorp, Yao, Suzuki and Bricker2019) also conducted a SPH simulation for breaking waves, and it was found that the turbulent kinetic energy was over-predicted with this approach, even with no subparticle-scale turbulence closure models included. This over-prediction was even greater with inclusion of a subgrid-scale model. They specifically highlighted the need for further improvement in subgrid-scale turbulence models within the surf zone.
In contrast to those models discussed above, the present study marks the first time that the Wilcox (Reference Wilcox2006) stress– $\omega$ RSM has been utilized to simulate the multi-phase wave breaking process. As can be seen from the results presented and discussed above, this approach solves several of the problems which have consistently plagued other comparable models of breaking waves over the past two decades. Most notably, the present results have demonstrated, for both spilling and plunging breaking cases: (1) no turbulence over-production prior to breaking, (2) accurate prediction of the breaking point, (3) reasonable (though certainly not perfect) evolution of turbulence quantities within the surf zone and (4) undertow velocity profile structure and magnitudes for the spilling breaker are in line with measurements from pre-breaking regions all the way to the outer and inner surf zones, while for the plunging breaker the undertow results are largely improved compared with the best two-equation model of Larsen & Fuhrman (Reference Larsen and Fuhrman2018), especially in the inner surf zone. Hence, the present model seemingly provides the most accurate and consistent (for both spilling and plunging cases) description of the turbulent wave breaking process achieved with CFD models to date.
Indeed, many of the issues faced by the comparable CFD models discussed above are rather naturally avoided with the stress– $\omega$ turbulence closure. As proved in § 2, this model is formally (neutrally) stable in the potential flow region beneath non-breaking surface waves. Hence, it avoids (without any modification) the over-production of turbulence prior to breaking plaguing the standard two-equation models in category (i) above. Following Devolder et al. (Reference Devolder, Troch and Rauwoens2018) and Larsen & Fuhrman (Reference Larsen and Fuhrman2018), we have additionally added buoyancy production to this model, such that these benefits are likewise retained. Finally, the stress–
 $\omega$ model breaks free of the Boussinesq approximation, and hence the eddy viscosity concept (and associated complications such as stress-limiters) altogether. Rather, the Reynolds stress is allowed to evolve according to its own governing equation, resulting in a model that is both theoretically superior, and more capable of predicting the dynamic variations in the flow resistance that arise between the outer and inner surf zones. This freedom seems to solve the problem consistently encountered by the models falling into category (ii) above, where users were seemingly faced with having to choose between accurate undertow profiles in either the outer or inner surf zone. It is finally worth mentioning that, by still working within the confines of Reynolds-averaged equations, the stress–
 $\omega$ model additionally avoids the practical resolution issues that are commonly faced and raised in LES applications, while also avoiding any need for subgrid-scale modelling, as described in relation to category (iii) above. It would thus seemingly offer an attractive compromise that has been under-utilized to date, providing a turbulence model that is dynamic enough to handle the inherently complicated surf zone at reasonable computational expense.
5. Conclusions
The present work has considered the Reynolds stress– $\omega$ model of Wilcox (Reference Wilcox2006), as a new candidate for providing turbulence closure in the CFD simulation of breaking waves with RANS equations. We have first conducted novel stability analysis of this model, formally proving that it is neutrally stable in the potential flow region beneath non-breaking surface waves. Unlike simpler two-equation models in their standard forms (see Larsen & Fuhrman Reference Larsen and Fuhrman2018), this model should therefore not lead to unphysical exponential growth of turbulence during the shoaling process leading up to incipient breaking. Comparison with prior analysis of two-equation models has also definitively shown that their instability arises as a result of the widely utilized Boussinesq approximation. The stability of the stress–
 $\omega$ model in potential flow regions has been directly confirmed through CFD simulations involving a progressive surface wave train.
As coastal waves (both breaking and non-breaking) also involve a wave boundary layer at the sea bottom, the stress– $\omega$ model has subsequently been applied to simulate unsteady oscillatory turbulent wave boundary layer flow, as measured by Jensen et al. (Reference Jensen, Sumer and Fredsøe1989). The computational results are generally in line with those measured, with notable improvement over two-equation turbulence closures apparent in the deceleration stage, where, for example, the
 $k$–
 $\omega$ turbulence model fails to accurately capture the turbulence kinetic energy and the Reynolds shear stress distribution. The stress–
 $\omega$ model has improved the accuracy for predicting the anisotropic Reynolds normal stress and Reynolds shear stress components within the wave boundary layer.
This work has culminated with CFD simulations employing the stress– $\omega$ turbulence closure model in the simulation of both the spilling and plunging breaking wave cases of Ting & Kirby (Reference Ting and Kirby1994, Reference Ting and Kirby1996). Surface elevation envelopes, turbulence characteristics and undertow velocity profiles have been predicted with consistent accuracy maintained from pre-breaking all the way into the inner surf zone in both cases. Comparison with the stabilized
 $k$–
 $\omega$ model of Larsen & Fuhrman (Reference Larsen and Fuhrman2018) demonstrates that both models predict Reynolds normal stresses (and turbulent kinetic energy) that are reasonably in line with measurements. Both models likewise predict similar undertow velocity profiles prior to breaking and in the outer surf zone. In the inner surf zone, however, the Larsen & Fuhrman (Reference Larsen and Fuhrman2018)
 $k$–
 $\omega$ model predicts undertow velocity profiles that are exaggerated by a factor of approximately two in magnitude relative to measurements, a feature that has similarly plagued several other two-equation turbulence closure models in the literature. The stress–
 $\omega$ model, on the other hand, generally results in undertow velocity profiles that are reasonably accurate (in both the uniformity of structure and magnitude) throughout the surf zone. These differences have been shown to stem from predictions in the Reynolds shear stresses within the inner surf zone, which are significantly larger with the stress–
 $\omega$ model (near the surface in the spilling case, more distributed across the depth in the plunging case). This in turn results in greater flow resistance in the inner surf zone. Based on a survey of previous CFD simulations of breaking waves in the literature, we conclude that the stress–
 $\omega$ model considered herein is seemingly the first demonstrating the collective ability to: (1) naturally avoid turbulence over-production prior to breaking, (2) accurately predict the breaking point, (3) provide reasonable evolution of turbulent normal stresses across the surf zone, while also providing (4) accurate undertow structure and magnitude from pre-breaking regions all the way to the outer and inner surf zones for the spilling breaking waves, and improvement for the plunging breaking waves compared with previous numerical simulations. It may therefore be useful for other studies involving various aspects of breaking waves, as it seems to have been under-utilized in the literature to date. The authors are freely releasing their source code implemented in the OpenFOAM framework, to hopefully help make such applications more accessible, as described in more detail in the next section.
While the present work has focused primarily on analysis and applications of the Wilcox (Reference Wilcox2006) stress– $\omega$ model, a stability analysis of the Launder et al. (Reference Launder, Reece and Rodi1975) (LRR) Reynolds stress–
 $\varepsilon$ turbulence closure model in the potential flow region beneath non-breaking waves is also newly considered in Appendix B, for completeness. Similar to our findings for the stress–
 $\omega$ model, the stress–
 $\varepsilon$ model is likewise proved to be neutrally stable. This has similarly been confirmed through CFD simulation of a propagating wave train, similar to § 3.1. The likely explanation of the turbulence over-production experienced by Brown et al. (Reference Brown, Greaves, Magar and Conley2016) is also provided there.
Availability of source codes
The source code implemented and utilized in the present work is publicly available at: https://github.com/LiYZPearl/ReynoldsStressTurbulenceModels. This includes our implementations of all turbulence models utilized within, namely the Wilcox (Reference Wilcox2006) stress– $\omega$ and
 $k$–
 $\omega$ models, for use in both single- and two-phase flow simulations (including buoyancy production terms). In the case of the
 $k$–
 $\omega$ model, the two-phase flow implementation also includes stabilization of the model as described in Larsen & Fuhrman (Reference Larsen and Fuhrman2018), deemed the LF18 model within. The OpenFOAM set-ups for the simulations presented herein of the turbulent wave boundary layer, as well as both spilling and plunging breaking wave cases, are likewise provided as tutorials.
Funding
Y.L. acknowledges financial support from the European Union's Horizon 2020 research and innovation programme, Marie Sklodowska-Curie Grant No. 713683 (COFUNDfellowsDTU, H. C. Ørsted Postdoc project SUBSEA: simulating breaking waves and sediment transport with stabilized turbulence models). B.E.L. and D.R.F. acknowledge financial support from the Independent Research Fund Denmark (project SWASH: simulating wave surfzone hydrodynamics and sea bed morphology, Grant No. 8022-00137B). This support is greatly appreciated.
Declaration of interests
The authors report no conflict of interest.
Appendix A. Buoyancy production term for the Wilcox (Reference Wilcox2006) stress–$\omega$ model

In this appendix we derive the buoyancy production term for use in the Wilcox (Reference Wilcox2006) stress– $\omega$ turbulence closure model equation (2.1). The derivation of the buoyancy production term starts from the exact form given in Burchard (Reference Burchard2002, p. 18):
 \begin{equation} B_{ij}=\frac{1}{\rho_0} \left( g_i \overline{ u^\prime_j \rho^\prime } + g_j \overline{ u^\prime_i\rho^\prime} \right) . \end{equation}
Following Burchard (Reference Burchard2002, p. 37), the correlation between the fluctuating velocity and density can be written as
 \begin{equation} \overline{u'_j\rho' }={-}\alpha_b^*\frac{k}{\omega}\frac{\partial \bar{\rho}}{\partial x_j}, \end{equation}
where  $k/\omega$ here effectively plays the role of the eddy viscosity. Invoking (A2) within (A1), the buoyancy production term becomes
 \begin{equation} B_{ij}={-}\alpha_b^{*} \frac{k}{\omega} N_{ij}, \end{equation}
where  $N_{ij}$ is from (2.5). This matches the term seen within (2.1).
Note that taking half the trace of  $B_{ij}$ above leads to
 \begin{equation} B_{k} ={-}\frac{1}{2}B_{ii}= \alpha_b^{*} \frac{k}{\omega} N^2, \quad N^2= \frac{g_i}{\rho_0}\frac{\partial \bar{\rho}}{\partial x_i}. \end{equation}
This matches the buoyancy production term utilized in the  $k$–
 $\omega$ turbulence closure model by Larsen & Fuhrman (Reference Larsen and Fuhrman2018). They showed that requiring the steady-state Richardson number to be smaller than
 $0.25$ (Schumann & Gerz Reference Schumann and Gerz1995; Burchard Reference Burchard2002) corresponds to a minimum value
 $\alpha ^*_b=1.36$. This value has similarly been adopted within the Wilcox (Reference Wilcox2006) stress–
 $\omega$ model (which did not originally include a buoyancy production term) in the present work.
Appendix B. Stability analysis of the Launder et al. (Reference Launder, Reece and Rodi1975) stress–$\varepsilon$ model

The stress– $\varepsilon$ closure model of Launder et al. (Reference Launder, Reece and Rodi1975) (called the LRR stress–
 $\varepsilon$ model in the present work), with additional buoyancy production terms (derived similar to above), may be written in full as
 \begin{align} \underbrace{ \frac{\partial\bar{\rho} \tau_{ij}}{\partial t} }_{\text{Time variation}} + \underbrace{ \bar{u}_k \frac{\partial \bar{\rho} \tau_{ij}}{\partial x_k}}_{\text{Convection}} &={-} \underbrace{ \bar{\rho} P_{ij}}_{\text{Production}} + \underbrace{\frac{2}{3} \bar{\rho} \varepsilon \delta_{ij}}_{\text{Dissipation}} - \underbrace{\bar{\rho} \varPi_{ij} }_{\text{Pressure-strain}} + \underbrace{ \bar{\rho} \frac{C_{\mu}}{P_r}\frac{k^2}{\varepsilon} N_{ij} }_{\text{Buoyancy production}} \nonumber\\ &\quad - \underbrace{ C_s \frac{\partial}{\partial x_k}\left[ \frac{\bar{\rho} k}{\varepsilon}\left(\tau_{im}\frac{\partial \tau_{jk}}{\partial x_m} + \tau_{jm}\frac{\partial \tau_{ik}}{\partial x_m}+\tau_{km}\frac{\partial \tau_{ij}}{\partial x_m}\right) \right] }_{\text{Diffusion}}, \end{align}
 \begin{align} \underbrace{ \frac{\partial \bar{\rho} \varepsilon}{\partial t}}_{\text{Time variation}} + \underbrace{ \bar{u}_j \frac{\partial \bar{\rho} \varepsilon}{\partial x_j} }_{\text{Convection}} &= \underbrace{ \bar{\rho} C_{1\varepsilon}\frac{ \varepsilon}{k}\tau_{ij}\frac{\partial \bar{u}_i}{\partial x_j} }_{\text{Production}} - \underbrace{ \bar{\rho} C_{2\varepsilon}\frac{ \varepsilon^2}{k} }_{\text{Dissipation}} - \underbrace{ \bar{\rho} C_{1\varepsilon}C_{3\varepsilon}C_{\mu}\frac{1}{P_r}\frac{\varepsilon}{k} N^2 }_{\text{Buoyancy production}}\nonumber\\ &\quad - \underbrace{ C_{\varepsilon} \frac{\partial}{\partial x_k}\left[ \frac{\bar{\rho} k}{\varepsilon}\tau_{km} \frac{\partial \varepsilon}{\partial x_m}\right] }_{\text{Diffusion}}, \end{align}
where
 \begin{align} \varPi_{ij}&=C_1\frac{\varepsilon}{k}\left(\tau_{ij}+\frac{2}{3}k\delta_{ij}\right)- \hat{\alpha}\left(P_{ij}-\frac{2}{3}P\delta_{ij}\right)- \hat{\beta}\left(D_{ij}-\frac{2}{3}P\delta_{ij}\right) \nonumber\\ &\quad -\hat{\gamma}k\left(S_{ij}-\frac{1}{3}S_{kk}\delta_{ij}\right)+ \left[0.125\frac{\varepsilon}{k}\left(\tau_{ij}+\frac{2}{3}k\delta_{ij}\right)- 0.015(P_{ij}-D_{ij})\right]\frac{k^{3/2}}{\varepsilon n}. \end{align}
The last term on the right-hand side of (B3) is the LRR stress– $\varepsilon$ wall-reflection term, where
 $n$ is the distance normal to the surface. In the above,
 $\varepsilon$ is the turbulence dissipation rate and
 $P_{ij}$ and
 $D_{ij}$ are respectively defined in (2.7) and (2.8). The closure coefficients are (Gibson & Launder Reference Gibson and Launder1978)
 \begin{equation} \left.\begin{array}{ccc@{}} C_{\mu}=0.09, & C_1=1.8, & C_2=0.60, \\ \hat{\alpha}=(8+C_2)/11, & \hat{\beta}=(8C_2-2)/11, & \hat{\gamma}=(60C_2-4)/55, \\ C_s=0.11, & C_{\varepsilon}=0.18, & C_{1\varepsilon}=1.44, \\ C_{2\varepsilon}=1.92, & C_{3\varepsilon}={-}0.33, & P_r=0.85, \end{array} \right\} \end{equation}
with  $C_{3\varepsilon }=-0.33$ and (the Prandtl number)
 $P_r=0.85$ adopted from the standard
 $k$–
 $\varepsilon$ closure model.
Similar to the Wilcox (Reference Wilcox2006) stress– $\omega$ model, the governing equations for the LRR stress–
 $\varepsilon$ model defined in (B1) and (B2) can be simplified for stability analysis purposes in the two-dimensional potential flow region beneath propagating surface water waves. An additional assumption is made that the term for the near-wall effect in the pressure–strain correlation is negligible. This is justifiable in the potential flow region above the bottom boundary layer. Following the derivation in § 2.2, the analogous resulting simplified
 $k$,
 $\tau _{12}$ and
 $\varepsilon$ equations for the LRR stress–
 $\varepsilon$ model are
 $$\begin{gather} \frac{\partial k}{\partial t} = 2 \tau_{12} S_{12} - \varepsilon, \end{gather}$$
 $$\begin{gather}\frac{\partial \tau_{12}}{\partial t} = \left(\frac{4}{3} - \frac{4}{3}\hat{\alpha} - \frac{4}{3}\hat{\beta} + \hat{\gamma}\right) k S_{12}-C_1 \frac{\varepsilon}{k}\tau_{12} , \end{gather}$$
 $$\begin{gather}\frac{\partial \varepsilon}{\partial t} = 2 C_{1\varepsilon} \frac{\varepsilon}{k} \tau_{12} S_{12} - C_{2\varepsilon}\frac{\varepsilon^2}{k} . \end{gather}$$
To perform a stability analysis on the three-equation system above, it turns to be convenient to utilize two utility variables, namely  $\varPsi =k/\tau _{12}$ and
 $\varXi =\varepsilon / \tau _{12}$. The equations for these quantities work out to be
 $$\begin{gather} \frac{\partial \varPsi}{\partial t} =\frac{\partial (k/\tau_{12})}{\partial t} = \underbrace{\left( \frac{4}{3}\hat{\alpha}+\frac{4}{3}\hat{\beta}-\hat{\gamma}-\frac{4}{3} \right)}_{{-}8/15} \varPsi^{2} S_{12} + (C_1 -1)\varXi + 2 S_{12}, \end{gather}$$
 $$\begin{gather}\frac{\partial \varXi}{\partial t} = \frac{\partial (\varepsilon/\tau_{12})}{\partial t} = \underbrace{ \left( \frac{4}{3}\hat{\alpha}+\frac{4}{3}\hat{\beta}-\hat{\gamma}-\frac{4}{3} \right)}_{{-}8/15} \varPsi \varXi S_{12} + (C_1 -C_{2\varepsilon})\frac{\varXi^2}{\varPsi} + 2 C_{1\varepsilon} \frac{\varXi}{\varPsi} S_{12}. \end{gather}$$
Setting both (B8) and (B9) equal to zero, their (constant) asymptotic equilibrium values can be found as
 $$\begin{gather} \varPsi_{\infty}={\pm} \sqrt{6 \times \frac{C_1+C_{1\varepsilon}-C_1C_{1\varepsilon} - C_{2\varepsilon} }{(C_{2\varepsilon} -1)(4\hat{\alpha} + 4\hat{\beta} - 3\hat{\gamma} -4 )} }\approx{\pm} 2.277, \end{gather}$$
 $$\begin{gather}\frac{\varXi_{\infty}}{S_{12}} = \frac{2(C_{1\varepsilon} -1) }{C_{2\varepsilon} -1} \approx 0.957. \end{gather}$$
Thus the fixed points for the nonlinear ordinary differential equations (B8)–(B9) are  $(\varPsi _{\infty }, \varXi _{\infty }) = (\pm 2.277, 0.957 S_{12})$. To check for formal stability of these two fixed points, the Jacobian matrix for (B8)–(B9) is defined as
 \begin{equation} J = \begin{bmatrix} \displaystyle \frac{\partial}{\partial \varPsi}\left(\frac{\partial \varPsi}{\partial t}\right) & \displaystyle \frac{\partial}{\partial \varXi}\left(\frac{\partial \varPsi}{\partial t}\right) \\ \displaystyle \frac{\partial}{\partial \varPsi}\left(\frac{\partial \varXi}{\partial t}\right) & \displaystyle \frac{\partial}{\partial \varXi}\left(\frac{\partial \varXi} {\partial t}\right) \end{bmatrix}. \end{equation}
After invoking the right-hand sides of (B8)–(B9) in the above, in addition to the model closure coefficients, this becomes
 \begin{align} J= \begin{bmatrix} -1.067S_{12}\varPsi & 0.8 \\ \displaystyle \frac{0.12 \varXi^2}{\varPsi^2}-0.533 S_{12} \varXi -\frac{2.88 S_{12} \varXi }{\varPsi^2} & \displaystyle -0.533 \varPsi S_{12}+\frac{2.88 S_{12}}{\varPsi}-\frac{0.24 \varXi}{\varPsi } \end{bmatrix}. \end{align}
After linearizing about the fixed points  $(\varPsi _\infty, \varXi _\infty )$, the eigenvalues of
 $J$ are found to be
 $(-2.012,-0.4663)\vert S_{12}\vert$. As these are negative, the fixed points correspond to stable nodes, similar to what was found for the stress–
 $\omega$ model.
Now inserting these fixed points ( $\varPsi _{\infty }, \varXi _{\infty }$) back into (B5) and (B6) and simplifying, then leads to the following linearized equation for the exponential growth rate for
 $k$:
 \begin{equation} \varGamma_{\infty}=\frac{1}{k}\frac{\partial k}{\partial t} = \frac{2S_{12} - \varXi_{\infty}}{\varPsi_{\infty}}. \end{equation}
Substituting the closure coefficients finally yields
 \begin{align} \varGamma_{\infty}= (C_{2\varepsilon}-C_{1\varepsilon}) \sqrt{\frac{2}{3} \times \frac{\left(4\hat{\alpha}+4\hat{\beta}-3\hat{\gamma}-4 \right)}{(C_{2\varepsilon}-1)(C_1+C_{1\varepsilon}-C_1C_{1\varepsilon}-C_{2\varepsilon})} } \times \vert S_{12} \vert \approx 0.458 \times \vert S_{12} \vert . \end{align}
As discussed in § 2.2, since  $\langle S_{12}\rangle =0$ in the idealized potential flow region beneath propagating waves, then
 $\varGamma _{\infty }$ will (on average) likewise be zero. Therefore, this proves that, similar to the Wilcox (Reference Wilcox2006) stress–
 $\omega$ model, the LRR stress–
 $\varepsilon$ model is neutrally stable in the ideal potential flow region beneath non-breaking surface waves.
While the model analysed above has not been the main focus of the present work, for the sake of completeness the progressive wave train simulations from § 3.1 have also been repeated using the LRR stress– $\varepsilon$ model, maintaining the same schemes and settings as before (maximum Courant number
 $Co=0.05$). The results for the free-surface elevations are presented in figure 25(a) (simulated with buoyancy production terms on) and figure 25(b) (with buoyancy production terms off). They are unsurprisingly identical and similar to those from the Wilcox (Reference Wilcox2006) stress–
 $\omega$ model (figure 3a). The period- and depth-averaged
 $k/k_0$ time series are presented in figure 25(e). The black solid line (with buoyancy production terms on) has an immediate decrease of
 $k$, while the black dashed line (with buoyancy production terms off) has a zero growth of
 $k$ in the early stage and then decreases at the same rate as the solid line. Both simulations are stable, confirming our analysis. It is noted that the simulations with the Wilcox (Reference Wilcox2006) stress–
 $\omega$ model and LRR stress–
 $\varepsilon$ model are essentially consistent with buoyancy production terms on (comparing figures 3 and 25 in the black solid lines). Conversely, the wave trains simulated with buoyancy production terms off are different in the growth rate, i.e. the Wilcox (Reference Wilcox2006) stress–
 $\omega$ model has a zero growth rate in general (figure 3b, black dashed-dotted line), while the LRR stress–
 $\varepsilon$ model has a zero growth in the beginning and a decreasing
 $k$ later on (figure 25e, black dashed line). This slight difference may due to the wall-reflection term in the LRR stress–
 $\varepsilon$ model which could be interesting to investigate in detail in future work. These results, combined with those in the main text, thus demonstrate that RSMs (both stress–
 $\omega$ and stress–
 $\varepsilon$ variants) are generally (neutrally) stable in the idealized potential flow region beneath non-breaking surface waves. They should therefore not be expected to suffer from the problem of unphysical over-production (exponential growth) of turbulence in potential flow regions prior to wave breaking, common to many two-equation turbulence closure models in their standard forms, as shown by Larsen & Fuhrman (Reference Larsen and Fuhrman2018).
Computed time series of (a–d) surface elevations and (e) depth- and period-averaged turbulent kinetic energy beneath wave trains simulated with the LRR stress– $\varepsilon$ model. The results depicted as blue dashed lines in (d,e), with
 $Co=0.20$ and without buoyancy production terms, are chosen to match most closely those used by Brown et al. (Reference Brown, Greaves, Magar and Conley2016).

A final remaining open question (which we shall now attempt to close) is: Why then did Brown et al. (Reference Brown, Greaves, Magar and Conley2016) experience pronounced over-production of turbulence prior to spilling breaking in their CFD simulation using the LRR stress– $\varepsilon$ model? In this context, it is important to emphasize that for the analysis (predicting neutral stability) above to hold in practice, a CFD model must maintain the nearly potential flow region beneath a surface wave with sufficient accuracy such that
 $\langle S_{12}\rangle \approx 0$. If this is not the case, since
 $\varGamma _\infty \sim |S_{12}|$ in (B15), then our analysis suggests RSMs may, in fact, still be prone to unphysical exponential growth of turbulence beneath non-breaking waves, if they do not solve the flow with sufficient accuracy. We hypothesize that this is precisely what has occurred in the simulation of Brown et al. (Reference Brown, Greaves, Magar and Conley2016) mentioned just above. Note that Brown et al. (Reference Brown, Greaves, Magar and Conley2016) utilized a significantly larger maximum Courant number (
 $Co=0.2$, hence numerical time step) than considered herein (the present results have uniformly used
 $Co=0.05$). Moreover, Larsen et al. (Reference Larsen, Fuhrman and Roenby2019) have specifically demonstrated that such large Courant numbers can indeed lead to pronounced inaccuracies in the resulting flow kinematics (hence
 $S_{12}$), even beneath computed free surfaces that may otherwise appear reasonable. To test this hypothesis, we repeat our simulation of the wave train above, but now with
 $Co=0.2$, while also switching schemes to those stated by Brown et al. (Reference Brown, Greaves, Magar and Conley2016). We consider two otherwise identical simulations, having buoyancy production terms both on (
 $P_r=0.85$, as before) and off (
 $P_r=\infty$, as in Brown et al. (Reference Brown, Greaves, Magar and Conley2016)). These results are respectively also shown as the pink (dashed-dotted) and blue (dashed) lines in figure 25. For the case believed to most resemble the set-up used by Brown et al. (Reference Brown, Greaves, Magar and Conley2016) (blue dashed lines in figure 25d,e) it is seen that, due to accumulated numerical errors in the velocity kinematics, the turbulence indeed begins to grow exponentially already by
 $t/T=10$. By
 $t/T=20$ the turbulence has reached several hundred times the initial level, becoming large enough to cause unphysical decay of the wave train. A similar (but delayed) process occurs for the case with buoyancy production terms on (figure 25c,e, pink dashed-dotted lines). Based on these results, it seems clear that the over-production of pre-breaking turbulence experienced by Brown et al. (Reference Brown, Greaves, Magar and Conley2016) with the LRR stress–
 $\varepsilon$ model can be attributed to numerical inaccuracies in the velocity kinematics (hence
 $S_{12}$) during their simulated shoaling stage. These inaccuracies can be attributed to the larger Courant number used, in accordance with what has been shown previously (there without a turbulence model) by Larsen et al. (Reference Larsen, Fuhrman and Roenby2019). Because buoyancy production terms create a sink of turbulence in the air–water interface region, their inclusion may delay the onset of this problem, but will not eliminate it. Similar issues could be expected with the stress–
 $\omega$ model if accurate velocity kinematics are not maintained in nearly-potential flow regions beneath surface waves, since similarly
 $\varGamma _\infty \sim |S_{12}|$ in (2.28), though the predicted growth rate would be smaller due to the lower coefficient in front of
 $|S_{12}|$.
Appendix C. Alternative stability analysis of the stress–$\omega$ model using eigenvalues

During the peer review process of the present paper, it became apparent that the stability of the turbulence closure models could be equivalently analysed based on eigenvalues of the Jacobian matrix, after linearizing about the fixed points. We will hence briefly outline this procedure in what follows for the stress– $\omega$ closure model.
The Jacobian matrix for the simplified stress– $\omega$ model governing equations in (2.18)–(2.20) is defined by
 \begin{equation} J = \begin{bmatrix}
\displaystyle\frac{\partial}{\partial
k}\left(\frac{\partial k}{\partial t}\right) &
\displaystyle\frac{\partial}{\partial
\tau_{12}}\left(\frac{\partial k}{\partial t}\right) &
\displaystyle\frac{\partial}{\partial
\omega}\left(\frac{\partial k}{\partial t}\right) \\
\displaystyle\frac{\partial}{\partial
k}\left(\frac{\partial \tau_{12}}{\partial t}\right) &
\displaystyle\frac{\partial}{\partial
\tau_{12}}\left(\frac{\partial \tau_{12}}{\partial
t}\right) & \displaystyle\frac{\partial}{\partial
\omega}\left(\frac{\partial \tau_{12}}{\partial t}\right)
\\ \displaystyle\frac{\partial}{\partial
k}\left(\frac{\partial \omega}{\partial t}\right) &
\displaystyle\frac{\partial}{\partial
\tau_{12}}\left(\frac{\partial \omega}{\partial t}\right) &
\displaystyle\frac{\partial}{\partial
\omega}\left(\frac{\partial \omega}{\partial t}\right)
\end{bmatrix}. \end{equation}
After invoking the right-hand sides of (2.18)–(2.20) in the above, in addition to the model closure coefficients, this becomes
 \begin{equation} J= \begin{bmatrix}
-0.09\omega & 2S_{12} & -0.09k \\ 0.5\bar{3}S_{12} &
-0.162\omega & -0.162\tau_{12} \\ \displaystyle -\frac{1.04
S_{12}\tau_{12}\omega}{k^2} & \displaystyle \frac{1.04
S_{12}\omega}{k} & \displaystyle \frac{1.04
S_{12}\tau_{12}}{k} - 0.1416\omega \end{bmatrix}.
\end{equation}
Further invoking  $k=\varPsi \tau _{12}$ and linearizing about (i.e. inserting) the fixed points from (2.23)–(2.24), the eigenvalues of
 $J$ are found to be
 $(-1.675, -0.5891, 0.2831)|S_{12}|$. It is seen that the critical (third) eigenvalue matches precisely the asymptotic growth rate
 $\varGamma _\infty$ from (2.28), confirming our analysis in the main text.
Although we do not present full details for the sake of brevity, we have also conducted an analogous stability analysis of the LRR stress– $\varepsilon$ model equations defined in (B5)–(B7). Should the interested reader wish to repeat said analysis, we find that the eigenvalues of the Jacobian matrix, after linearizing about the fixed points for this system, correspond to
 $(-1.555, -0.008060, 0.4583)|S_{12}|$. It is again seen that the critical (third) eigenvalue matches precisely the growth rate
 $\varGamma _\infty$ from (B15).