I. INTRODUCTION
Direct solar hydrogen production through photoelectrochemical (PEC) water splitting presents an enticing route to supply the world's increasing energy demand with a renewable chemical fuel. Reference Klahr, Gimenez, Fabregat-Santiago, Bisquert and Hamann1–Reference Cesar, Sivula, Kay, Zboril and Grätzel5 Fuel production from photoelectrolysis of water at semiconductor electrode was first reported in 1972 using TiO2 (anatase) photoanode. Reference Fujishima and Honda6 Due to its large band gap, TiO2 yielded low efficiencies. However, the idea intrigued investigations on identifying an ideal and affordable photoactive semiconductor material with good absorptive capacity in the entire visible region of the solar spectrum and outstanding charge transfer properties. Hematite (α-Fe2O3) received a great deal of attention as a promising photoanode material. Reference Grätzel2–Reference Katz, Riha, Jeong, Martinson, Farha and Hupp4,Reference Duret and Grätzel7–Reference Boudoire, Toth, Heier, Braun and Constable11 A band gap of ∼2.0 eV, low cost, good stability against dissolution in aqueous electrolyte, and nontoxicity make it attractive for water splitting. However, despite the good characteristics, α-Fe2O3 is still not yet an effective photoanode for water to solar fuel application, Reference Katz, Riha, Jeong, Martinson, Farha and Hupp4 due to poor charge transport properties and high rate of carrier recombination. Reference Cesar, Sivula, Kay, Zboril and Grätzel5 Furthermore, the nonoptimal alignment of its conduction band and H2 evolution potential for water reduction presents another challenge for practical implementation of α-Fe2O3 photoanode. Reference Katz, Riha, Jeong, Martinson, Farha and Hupp4 Consequently, a bias of over 1 V versus the reversible hydrogen electrode is required to drive splitting reactions. Reference Katz, Riha, Jeong, Martinson, Farha and Hupp4,Reference Le Formal, Tétreault, Cornuz, Moehl, Grätzel and Sivula12 Upon contact with the electrolyte in a biased cell, electrochemical reactions take place even at room temperature, such as electrochemical corrosion, electrochemical reduction, or oxidation of species in solution, and even catalysis, which all depend fundamentally on steps involving electron transfer. Reference Morrisons13 Electrode reactions (oxidation and reduction) may lead to the formation of an oxide layer on the anode surface. Reference Katz, Riha, Jeong, Martinson, Farha and Hupp4
Anodization is an electrochemical process which could create a thick compact oxide layer of metal surfaces that may increase resistance to corrosion of the surface. Reference Rangaraju, Panday, Raja and Misra14 The growth of the oxide film involves the transport of matter and charge between different phases, like metal, oxide and anodizing medium. Bora et al., Reference Bora, Braun, Erat, Ariffin, Löhnert, Sivula, Töpfer, Grätzel, Manzke, Graule and Constable15 point to electrochemical oxidation (anodization) as an operational step in functionality of biased PEC cells. During anodization the applied anodizing potential causes ionization of F2+ to Fe3+ cations [Fe2+ → Fe3+ + e−] as well as dissociation of water and possibly the electrolyte to occur at the oxide-electrolyte interface. Reference Rangaraju, Raja, Panday and Misra16 Moreover, a significant amount of anions is supplied by water dissociation due to water splitting process. Some of the metal ions combine with oxygen anions and form metal oxide at the oxide-electrolyte interface. Reference Rangaraju, Raja, Panday and Misra16,Reference Garcla17 Apparently, a thin layer of oxide film grows by both outward and inward diffusion of ions through the oxide-electrolyte interface and simultaneously oxidation heat is generated. Reference Morrisons13,Reference Wei and Chen18 The formation process of this anodic oxide is a complex process involving physics, chemistry and electrochemistry. Both chemical dissolution and electric field dissolution play role in the structure and composition of the formed anodic film, particularly at the oxide-electrolyte surface. Reference Wei and Chen18 The thickness of the formed oxide layer is influenced by the charge passed (i.e., product of current density and time) whereas, the morphology and composition depend on the anodizing conditions such as anodizing potential and time, reaction temperature, and electrolyte type, pH and concentration. Reference Graeve, Terryn and Thompson19,Reference Abd-Elnaiem, Mebed, Gaber and Abdel-Rahim20 The surface undergoes extensive morphological reorganization upon anodization. The oxide scales are in continuous transformation including grain growth, phase transformation, porosity, precipitation, recrystallization, development, and thickening that depend on anodizing conditions. Reference Saijo, Murakami, Hino and Kanadani21 All these parameters may influence the photoresponse of the photoanode.
Although a significant improvement has been made on conductivity of α-Fe2O3 by elemental doping Reference Cesar, Sivula, Kay, Zboril and Grätzel5,Reference Chatman, Pearce and Rosso22–Reference Aroutiounian, Arakelyan, Shahnazaryan, Hovhannisyan, Wang and Turner25 and nanostructuring, Reference Ahn, Kwak, Lee, Yoon and Jang26–Reference Niu, Zhang, Ma, Qin, Wan, Xu and Miao29 the influence of the anodizing process on the photocatalytic performance of α-Fe2O3 photoanode in a PEC cell has not been extensively studied. However, a detailed research on the surface molecular structure of anodized α-Fe2O3 photoanode has been conducted and reported transformation of Fe2+ to Fe3+ states at the surface upon subject to anodizing conditions and the findings were attributed to filling of oxygen vacancies due to increasing oxygen content at the surface. Reference Braun, Sivula, Bora, Zhu, Zhang, Grätzel, Guo and Constable9,Reference Bora, Braun, Erat, Ariffin, Löhnert, Sivula, Töpfer, Grätzel, Manzke, Graule and Constable15,Reference Gajda-Schrantz, Tymen, Boudoire, Toth, Bora, Calvet, Gratzel, Constable and Braun30,Reference Braun, Chen, Flak, Fortunato, Gajda-Schrantz, Gratzel, Graule, Guo, Huang, Liu, Popelo, Sivula, Wadati, Wyss, Zhang and Zhu31 Recently, x-ray diffractometry revealed significant modifications on the crystallographic structure and morphology at the surface upon anodization at 500 mV versus Ag/AgCl for just 1 min. Reference Maabong, Machatine, Hu, Braun, Nambala and Diale32 In particular, a significant grain growth at the surface by a 3 factor of magnitude was observed. Microstructure, in particular the crystallinity, crystallite size, shape, spatial distribution, and morphology have an important influence on electrical, optical, and catalytic properties of semiconductor materials. Reference Heiroth, Frison, Rupp, Lippert, Barthazy Meier, Müller Gubler, Döbeli, Conder, Wokaun and Gauckler33 Therefore, a complete understanding of the influence of anodization process on the microstructure of α-Fe2O3 photoanode is vital in improving the PEC performance of α-Fe2O3 photoelectrode. This study aimed toward investigating the influence of anodization (exposure) time on the surface modifications on α-Fe2O3 photoanode caused upon anodization in PEC cell. For this, we carried out structural and morphological analysis of α-Fe2O3 photoanode electrochemically oxidized at an applied anodic potential of 700 mV versus Ag/AgCl in 1 M KOH under illumination, for different exposure times. To the best of our knowledge, no similar results have been reported.
II. EXPERIMENTAL SECTION
A. Electrode preparation
α-Fe2O3 thin films were synthesized by dip coating of a precursor complex on a conductive fluorine-doped tin oxide (FTO) coated glass substrate in a systematic procedure described in Fig. 1. The FTO Substrates were cleaned in an ultrasonic bath of acetone and isopropanol for 30 min, rinsed with ethanol and dry blown with compressed N2 (99.95%). The precursor complex was synthesized by heating a mixture of iron (III) nitrate (Fe(NO3)3·9H2O) and oleic acid (C18H34O2) to 125 °C while continuously stirring to give a red-brown viscous mass which was then cooled to room temperature, left for 24 h to dry, and subsequently treated with 80 mL of tetrahydrofuran. The resultant supernatant solution was stirred with a glass rod to dissolve the contents and the powdery precipitate was separated from the solution by centrifugation (4000 rpm) for 15 min. The precursor complex was recovered for the dip coating of the film. α-Fe2O3 thin films of 4 layers of average thickness of 530 nm were obtained by repeated dip coating and annealing at 500 °C for 30 min for each layer.
A schematic diagram of the systematic procedure for preparation of pristine α-Fe2O3 photoanode nanoparticles.

B. Electrochemical oxidation process
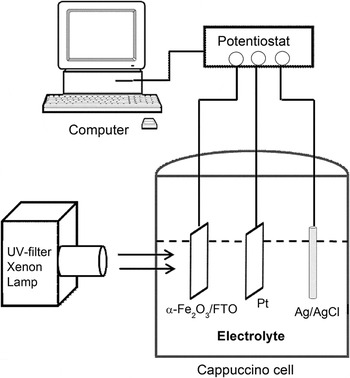
The electrochemical oxidation (anodization) was carried out in a three-electrode PEC cell (also known as a “cappuccino cell”, manufactured from PEEK plastic, Radiometer Analytical, Lyon, France), Reference Braun, Chen, Flak, Fortunato, Gajda-Schrantz, Gratzel, Graule, Guo, Huang, Liu, Popelo, Sivula, Wadati, Wyss, Zhang and Zhu31 as shown in Fig. 2. α-Fe2O3/FTO, a platinum plate (0.5 cm × 0.5 cm), and Ag/AgCl in saturated KCl were used as the working (anode), cathode, and reference electrode, respectively. A potentiostat (Voltalab80 PGZ 402, Radiometer Analytical) interfaced with a PC was used in all the measurements. The anodic potential of 700 mV was applied for 1, 10, and 900 minutes in 10 cm3 of 1 M KOH (pH = 13.8) under 1.5 AM simulated light conditions with a UV-filtered xenon lamp. The anodized samples were washed with distilled water to remove the occluded ions from the anodized solutions and left to dry in air.
A schematic diagram of the anodizing apparatus, three-electrode PEC cell.

C. Characterization of the samples
The phase purity of the films was confirmed by the powder x-ray diffraction (XRD) (PANanalytical X'Pert PRO, Almelo, The Netherlands) with Co Kα-1 radiation (λ = 0.178901 nm). The surface morphology analysis of the films was investigated with a field emission gun scanning electron microscopy (FEG-SEM) employing Zeizz Ultra 55 instrument (Carl Zeiss AG, Goettingen, Germany) fitted with the usual SEM detectors and in-lens detector. The surface topography of the films was examined using the Nanoscope atomic force microscopy (AFM) operating in the tapping mode at a scan rate of 0.4 Hz. The average thickness was obtained by a surface profiler.
III. RESULTS AND DISCUSSION
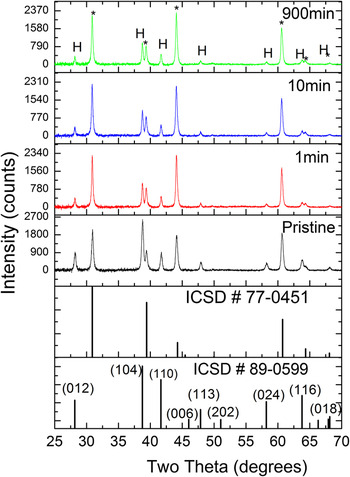
Figure 3 shows the XRD pattern for the as-prepared films (pristine) and after the films were anodized for 1, 10, and 900 min under illumination. The (104) and (110) peaks were observed in all the films which confirmed the α-phase formation of rhombohedral iron oxide with
 $R\bar 3c$
space group. Other reflections corresponding to (012), (006), (113), (202), (024), (116), and (018) planes were also observed in all the films. No diffraction peaks of any other impurities of iron oxide phases were detected, indicating high purity of the synthesized α-Fe2O3 thin films.
XRDs of dip coated pristine and anodized α-Fe2O3 films (marked with H) deposited on F:SnO2 substrates. The peaks marked with (*) corresponds to SnO2 originating from the substrate. The standard powder pattern of α-Fe2O3 [ICSD #89-0599] and SnO2 [ICSD #77-0451] are also included.

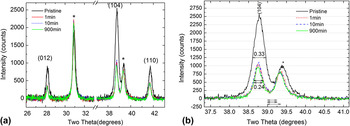
The peaks were generally sharp and narrow with small full width at half maximum (FWHM) indicating high crystallinity of the samples. The expanded XRD pattern of the films in Fig. 4(a) shows decreasing peaks intensity and linewidths upon anodization. A close inspection and comparison of the (104) peaks in Fig. 4(b) clearly demonstrate decreasing linewidths at half maximum with increasing anodization time, suggesting increase in crystallites size of the anodized nanoparticles. A pronounced effect on the peaks width and intensity between the pristine and anodized films was observed. No noticeable difference between the anodized films was observed regardless of the anodization times.
Expanded XRD pattern of the prominent Bragg reflections of α-Fe2O3 films (a) and close inspection of (104) peak (b) showing decreasing peak linewidth (FWHM) upon anodization.

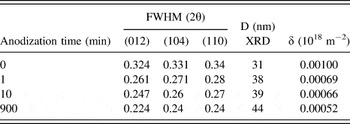
The extracted FWHM values for the prominent reflections (012), (104), and (110) and the corresponding average crystallite size, D, as extracted from the peak width analysis and estimated according to Debye–Scherrer formula Reference Mote, Purushotham and Dole34 are presented in Table I. The estimated average crystallite size was observed to range from ∼31 to 44 nm. The obtained crystallite size range values are close to values previously obtained for the films that were subjected to 500 mV constant anodic potential for 1 min, Reference Maabong, Machatine, Hu, Braun, Nambala and Diale32 regardless of the difference in exposure time. There was no clear correlation between crystallite size and anodization time.
A presentation of the FWHM, average crystallites size (D) and dislocation density (δ) of the α-Fe2O3 nanoparticles before and after electrochemical oxidation in 1M KOH at 700 mV at different anodization times.

The dislocation density δ, which represents the amount of defects or imperfections in the film, is given as δ = 1/D 2. Reference Caglar, Ilican, Caglar, Yakuphanoglu, Wu, Gao, Lu and Xue35 The calculated values of δ for all the films are also given in Table I. The smaller FWHM and larger D values indicate better crystallization of the film. Dislocation densities exhibit a decreasing trend with increasing anodization time, which implies decrease in the concentration of lattice imperfections.
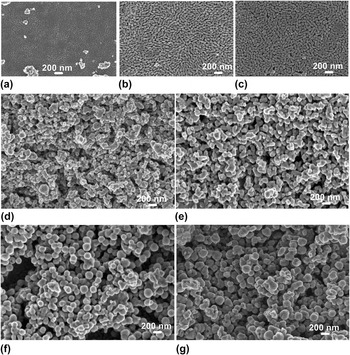
The role of exposure time on grain growth in anodized α-Fe2O3 photoanode is clearly illustrated by FEG-SEM top-view micrographs of the prepared films in Fig. 5, taken prior to and after anodization. The method of preparation is considered an important factor that significantly affects the surface properties of the nanoparticles. During annealing, excess hematite was peeled off from the surface and excess film was removed before the next dipping step. However, surface analysis by SEM still revealed peeling off (not shown) of the top layer which consisted of typical dumbbell shaped nanoparticles, shown in Fig. 5(a) for pristine and (b and c) anodized films for 1 and 900 min, respectively. The exposed sublayer underneath showed spherical nanoparticles [Figs. 5(d)–5(g)]; (d)-pristine and (e and g)-anodized films. On both parts of the films (top and exposed sublayer), increase in grain size was demonstrated. Prior to anodization, the films exhibit small sized-grains which recrystallized, grew and reorganized upon anodization. The nonanodized top layer showed less porous surface with an average grain size of ∼42.9 nm. Upon anodization, the layer became more porous with average grain size increasing to ∼62.3 and 99.4 nm after being subjected to anodic conditions for 1 and 900 min, respectively. During anodic anodization, the oxidation heat produced leads to dissolution of the oxide by the electrolyte particularly at oxide-electrolyte interface, resulting in porous oxide layer. Reference Wei and Chen18 The spherical grains on the exposed layer increased from approximately 57.9 nm in pristine state to 153.5 nm for films anodized for 900 min.
FEG-SEM top-view images of α-Fe2O3 films before and after anodization at 700 mV in 1M KOH, measured from top layer [(a) before, (b) 1, (c) 900 min] and exposed sublayer [(d) before, (e) 1, (f) 10, (g) 900 min].

As the anodization process continues, both the cation and anion ions migrate between the bulk oxide and the electrolyte through the film pores and the film gets thicker and denser. Probably, a thin layer of oxide is formed thorough diffusion of metal cations and oxygen anions. The relatively thin, nonporous oxide layer under the porous oxide structures is considered to contribute to the improvement of corrosion resistance of the oxide. Reference Jackson, Ahmed, Jackson and Ahmed36 It should be noted that because of the nature of the preparation method used in this study, the films were rough and the difference in film thickness could not be detected using a surface profiler. In contrast to crystallites size, the effect of anodization time on grain size is more significant. The grain size observed from FEG-SEM images is larger than the crystallite size from XRD analysis. The grains increased in size probably by coalescence of neighboring grains during reorganization of the surface and form large grain. Reference Garcla17
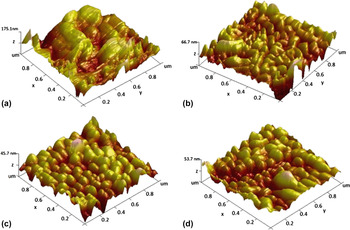
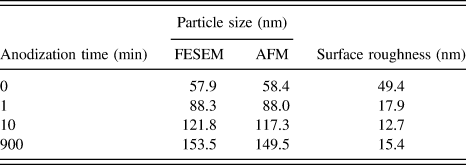
The 3D top-view AFM images in Fig. 6 (measured form the exposed layer) clearly confirmed FEG-SEM analysis. The size of the grains on the surface increased with anodization time. Prior to anodization, the grains were not visible on the surface, due to loosely attached α-Fe2O3 grains. Reference Shei, Chang and Lee37 The poor-adherence was confirmed by the maximum height of the film. Upon being subjected to anodization conditions for only 1 min, a significant change on the surface topography was observed with nanoparticles becoming clearly visible on the surface. The anodized sample images show increasing grain size with increasing anodization time. Like FEG-SEM, the average grain size increased from approximately ∼58.4 nm for nanoparticles in pristine state to approximately 88–149.5 nm for films anodized for 1 min (shortest time) and 900 min (longest time), respectively. The grain size values are in agreement with the FEG-SEM analysis as shown in Table II. Long anodization time resulted in larger nanocrystals.
3D AFM images of α-Fe2O3 nanoparticles before (a) and after anodization at 700 mV in 1 M KOH for 1 min (b), 10 min (c) and 900 min (d).

A comparison of surface roughness of the hematite nanoparticles before and after electrochemical oxidation in 1M KOH at 700 mV at different anodization times.

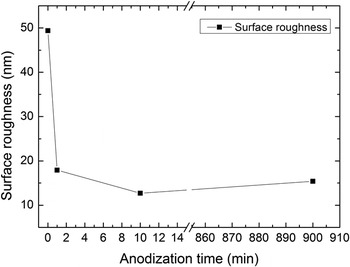
The surface roughness of all the samples was extracted from AFM images and presented against anodization time in Fig. 7. Generally, the films were rough. The pristine films surface exhibits a larger root-mean-square (rms) roughness of ∼49.4 nm. However, a rapid decrease in the rms roughness was observed upon anodization for 1 min. The rms value decreased with increasing anodization time as the particles became larger. The decrease in rms value may be ascribed to dissolution of rough spots upon anodization. Surface roughness plays an important role in various processes, such as adhesion and light scattering, and can significantly affect the PEC performance of the α-Fe2O3 nanostructures.
Surface roughness of α-Fe2O3 films versus anodization time.

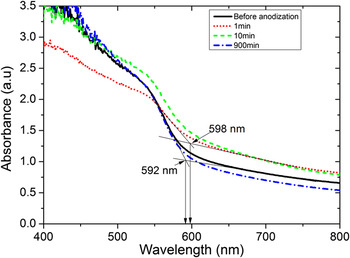
The scattering and absorption coefficients of α-Fe2O3 depend on particle size, shape, density, surface roughness and spatial arrangement of the particles, morphology, and refractive index. Small particles of hematite are less absorbing than large particles. Reference Cornell and Schwertmann38 Thus, enhancement in UV-vis optical absorbance observed in anodized films (Fig. 8) may be attributed to increased grain size and thickness of the oxide. The onset absorbance wave length occurred at 592 nm for pristine nanoparticles, and 598 and 596 for films anodized for 1 min and 900 min, respectively. A shift to higher wave length in anodized films may be attributed smoothening of the surface and grain growth upon anodization.
UV-vis absorption spectra of the α-Fe2O3 prior to and after anodization.

IV. DISCUSSION
The film formation and grain growth mechanism upon anodization of a pre-existing oxide film is a complex process although one may establish a number of analogies with anodization of metal surfaces. Previous studies discussed different factors as possible source of heat during anodization, for example (i) oxidation reaction heat and convectional joule heating (electrical power dissipated) of the electrolyte, Reference Wei and Chen18 (ii) burning of the oxide under illumination. Reference Morrisons13 Excitation of nanoparticles with UV-visible light leads to generation of a large number of carriers. Majority of these carriers recombine nonradiatively before contributing to water splitting. Thus, the energy released from nonradiative recombination heats up the oxide surface. Probably grain growth occurs likely due to Ostwald ripening; whereby large particles grow at the expense of small particles as a result of increase in temperature at the surface. Smaller grains which have a higher solubility than larger ones slowly dissolve and redeposit on the large crystals and simultaneously grain growth occurs. According to Heiroth et al., Reference Heiroth, Frison, Rupp, Lippert, Barthazy Meier, Müller Gubler, Döbeli, Conder, Wokaun and Gauckler33 grain growth process in polycrystalline material is driven by the minimization of the total grain boundary per area. During recrystallization and growth processes, the number of grain boundaries decreases due to the annihilation of small grains by grain boundary migration. Reference Li, Zhang and Metzger39 The smaller primary particles have large surface free energy and tend to agglomerate, coalesce, and grow into larger grains. Reference Garcla17,Reference Belkhedkar and Ubale40 The rotation-coalescence of neighboring grains results in elimination of grain boundaries between them and supposedly grain growth. Therefore, grain growth upon anodization is expected to reduce recombination rate of holes and electrons and subsequently enhance conductivity of the photoelectrode. Reference Tamboli, Rahman and Joo41 Photoconductivity measurements of the anodized films were not done in this study. However, Braun et al., Reference Braun, Chen, Flak, Fortunato, Gajda-Schrantz, Gratzel, Graule, Guo, Huang, Liu, Popelo, Sivula, Wadati, Wyss, Zhang and Zhu31 reported enhanced current density on anodized hematite after the films were subjected to anodic potential of 200 and 600 mV in 1M KOH for 24 h. The enhancement on conductivity may be attributed to improved surface upon anodization. Gajda-Schrantz et al., Reference Gajda-Schrantz, Tymen, Boudoire, Toth, Bora, Calvet, Gratzel, Constable and Braun30 reported on study of molecular structure of the anodized films by XPS analysis, which suggested reduction of surface states (Fe2+) on the surface upon anodization. Although, the presence of Fe2+ on the surface appears essential, these states have a considerable influence on the kinetics of the electron processes occurring at the semiconductor–liquid junction, acting as additional recombination centers, interband trapping levels and intermediate centers that may shorten the lifetime of photogenerated carriers and yield low photocurrent. Reference Arutyunyan42
V. CONCLUSION
The influence of exposure time on the surface crystallographic structure modifications on hematite (α-Fe2O3) photoanode upon anodization in PEC cell was investigated. α-Fe2O3 thin films prepared by economic and facile dip coating method were anodized in 1M KOH at an anodic potential of 700 mV versus Ag/AgCl under simulated illumination. The crystallite size increased from ∼31 nm for nanoparticles in pristine state to ∼38 and 44 nm after anodization for 1 min (shortest time) and 900 min (longest time), respectively, without losing the crystallinity. A positive clear correlation between anodization time and grain size was observed from FEG-SEM and AFM. Grain size increased with increasing anodization time from ∼57.9 nm in pristine state to ∼153.7 nm for films exposed for 900 min; longer exposure time to anodizing conditions resulted in larger grains. This increase in grain size during anodization is expected to improve conductivity of α-Fe2O3 due to reduced recombination rate of holes and electrons as a result of improvement on the surface of the electrode during anodization. Density of dislocations, surface roughness, and possibly grain boundaries decreased.
ACKNOWLEDGMENT
This study was supported by Swiss-South African Joint Research (SSAJR) Project IZLSZ2-149031; the Swizz SNF grant R'Equip 206021-121306 and National Research Foundation of South Africa (NRF). K.M acknowledges University of Botswana for financial support. Y.H is grateful for financial support from and SNF Project No. 132126.