Staphylococcus aureus is a gram-positive foodborne pathogen that has been the cause of 171 cases of foodborne illness in the past decade, resulting in 7351 hospitalisations in Korea (MFDS, 2013). The pathogen has been isolated from various foods, especially meat and chicken (Jablonski & Bohach, Reference Jablonski, Bohach, Beuchat, Doyle and Montville2001; Tamarapu et al. Reference Tamarapu, McKillip and Drake2001; Jorgensen et al. Reference Jorgensen, Mathisen, Lovseth, Omoe, Qvale and Loncarevic2005; Colombari et al. Reference Colombari, Mayer, Laicini, Mamizuka, Franco, Destro and Landgraf2007). Pathogenic Staph. aureus at a density of 105–106 CFU/g produces sufficient quantities of enterotoxins to cause intoxication after consumption of contaminated dairy products (Bergdoll, Reference Bergdoll and Doyle1989). Although cheeses are generally considered to be one of the safest foods, 0·4% of the total foodborne outbreaks in Europe were caused by the consumption of contaminated cheese in 2006 (Little et al. Reference Little, Rhoades, Sagoo, Harris, Greenwood and Mithani2008; Kousta et al. Reference Kousta, Mataragas, Skandamis and Drosinos2010). Therefore, acceptable limits and microbiological criteria for contamination of cheese by Staph. aureus have been established in many countries. France allows up to 103 CFU/g of Staph. aureus in raw milk cheeses and Canada permits up to 102 CFU/g of the pathogen in pasteurised milk cheese and 103 CFU/g in raw milk cheese (Le Loir et al. Reference Le Loir, Baron and Gautier2003; JLW, 2013). However, Korea applies a ‘zero tolerance’ policy for Staph. aureus in cheese (QIA, 2011), which may lead to international trade conflicts and negative consequences for cheese industry growth.
Of the various cheeses produced, Brie and Camembert may have higher probabilities of being contaminated with Staph. aureus during packaging and distribution because they are produced without post-fermentation heating and so possess high moisture levels. Exposure assessment for Staph. aureus on Brie and Camembert is therefore a necessity and this process would be aided by a model to describe its growth kinetics on these cheeses. Such information could be used for microbial risk assessment.
Mathematical models have been used to describe bacterial growth and death patterns under various storage conditions (McMeekin et al. Reference McMeekin, Brown, Krist, Miles, Neumeyer, Nichols, Olley, Presser, Ratkowsky, Ross, Slater and Soontranon1997; Yoon, Reference Yoon2010; Lee et al. Reference Lee, Suk, Lee, Lee and Yoon2012). Primary models are used to calculate kinetic parameters such as the maximum specific growth rate (μmax) and lag phase duration (λ), and then a secondary model is fitted to these as a function of environmental factors such as temperature, pH, and water activities (Baranyi & Roberts, Reference Baranyi and Roberts1994; Mataragas et al. Reference Mataragas, Drosinos, Siana, Skandamis and Metaxopoulos2006; Yoon et al. Reference Yoon, Belk, Scanga, Smith and Sofos2009). Most of these models were developed using data obtained from broth media, which do not account for the matrix effect of real foods on bacterial growth. Therefore, Yoon et al. (Reference Yoon, Belk, Scanga, Smith and Sofos2009, Reference Yoon, Geornaras, Scanga, Belk, Smith, Kendall and Sofos2011) suggested that models should be developed using data from real foods. In this study, we developed such models to describe Staph. aureus growth on Brie and Camembert cheeses.
Materials and methods
Inoculum preparation
Staph. aureus strains ATCC13565, ATCC14458, ATCC23235, ATCC27664, and NCCP10826 were cultured in 10 ml tryptic soy broth (TSB; Bacto™, Becton Dickinson, Sparks, MD, USA) at 35 °C for 24 h. The cultures were transferred, in 0·1 ml aliquots, into 10 ml fresh TSB for subculture at 35 °C for 24 h. The subcultures were then centrifuged at 1912 g for 15 min at 4 °C, and the cell pellets were washed twice with phosphate buffered saline (PBS, pH 7·4; 0·2 g KH2PO4, 1·5 g Na2HPO4, 8·0 g NaCl, and 0·2 g KCl in 1 l distilled water). The cell suspensions of five Staph. aureus strains were then mixed, and the mixture was serially diluted with PBS to obtain a density of 6 log CFU/g.
Sample preparation and inoculation
Brie and Camembert cheeses were purchased from a local supermarket. Fifteen grams of the natural cheeses were aseptically transferred into plastic bags, and 0·1-ml portions of the inoculum were inoculated onto the Brie and Camembert at a density of 3 to 4 log CFU/g. The inoculated samples were then massaged 10 times to spread the bacteria evenly, and sealed using a packager (Food Guard®; Rollpack, Pyeongtaek, Gyeonggi-do, Korea). The samples were then aerobically stored at 4, 10, 15, 25, and 30 °C for 60, 26, 14, 5 and 2 d, respectively.
Experimental growth analyses
To quantify bacterial populations, cheese samples were analysed at appropriate time intervals. A 30 ml volume of 0·1% buffered peptone water (BPW; Difco™, Becton Dickinson) was added into the sample bag and homogenised for 120 s (BagMixer®, Interscience, St. Nom, France). The homogenates were then serially diluted with BPW, and 0·1-ml portions of the diluted suspensions were surface-plated on tryptic soy agar (TSA; Difco™) and mannitol salt agar (MSA; BBL™, Becton Dickinson) to obtain the total bacterial and Staph. aureus cell counts, respectively. The colonies were counted manually after incubation at 35 °C for 48 h. After microbial analysis, pH values of the homogenates were measured with a digital pH meter (Accumet®, Denver Instruments, Arvada, CO, USA). Water activities of cheese samples were determined using a water activity meter (Aquaspector®, NAGY Messsysteme, Germany).
Model development
The Baranyi model (Baranyi & Roberts, Reference Baranyi and Roberts1994) was fitted to the Staph. aureus growth data for Brie and Camembert with DMFit (Institute of Food Research, Norwich, UK, http://www.ifr.ac.uk/safety/dmfit/) to calculate the maximum growth rate (r max; log CFU/g/h), the lag phase duration (λ; h), the lower asymptote (N 0; log CFU/g), and the upper asymptote (N max; log CFU/g).
To evaluate the effect of storage temperature on the kinetic parameters, the secondary models were fitted to the values of r max and λ as follows:
 $$\sqrt {{\rm r}_{{\rm max}}} = a_{\rm \mu} (T-T_{\rm min})$$
where a μ is the slope of the linear regression, T min is the theoretical minimum temperature (Ratkowsky et al. Reference Ratkowsky, Olley, McMeekin and Ball1982), and T is the storage temperature.
 $${\rm ln(\lambda )} = {\rm \alpha} + {\rm \beta} \times T$$
where, α and β is the coefficient value, and T is the storage temperature.
Validation
Since data for Staph. aureus growth on Brie and Camembert were not available in the literature, an additional experiment, using different storage temperatures (18 and 23 °C), was conducted to obtain observed data (log CFU/g) for validating the models. The observed data were then compared with predicted Staph. aureus cell counts (log CFU/g), which were calculated by developed models. The model performance was evaluated according to its root mean square error (RMSE); the lower the value of RMSE, the better the fit. The equation for RMSE is
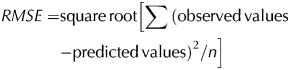 $$ \eqalign{ RMSE = & {\rm square}\,{\rm root}\left[ {\sum {{\rm (observed}\,{\rm values}}} \right. \cr &\left. { - {\rm predicted}\,{\rm values)}^2 /n} \right]} $$
where n represents the number of data points.
Statistical analysis
The growth parameters (r max, λ, N 0, and N max) were analysed using the GLM procedure of SAS® version 9.2 (SAS Institute, Cary, NC, USA). All mean comparisons were performed using a pairwise t-test at α=0·05.
Results and discussion
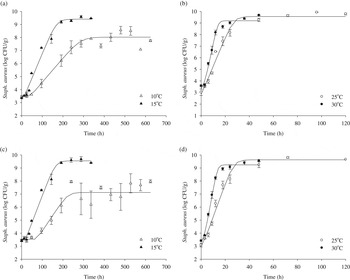
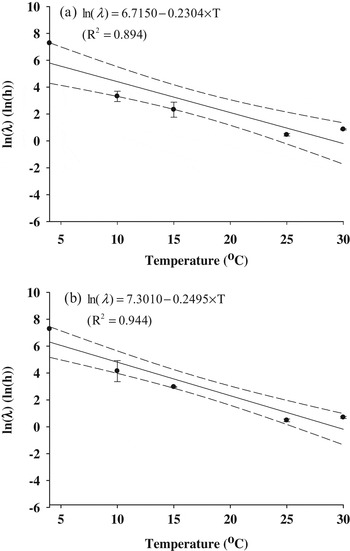
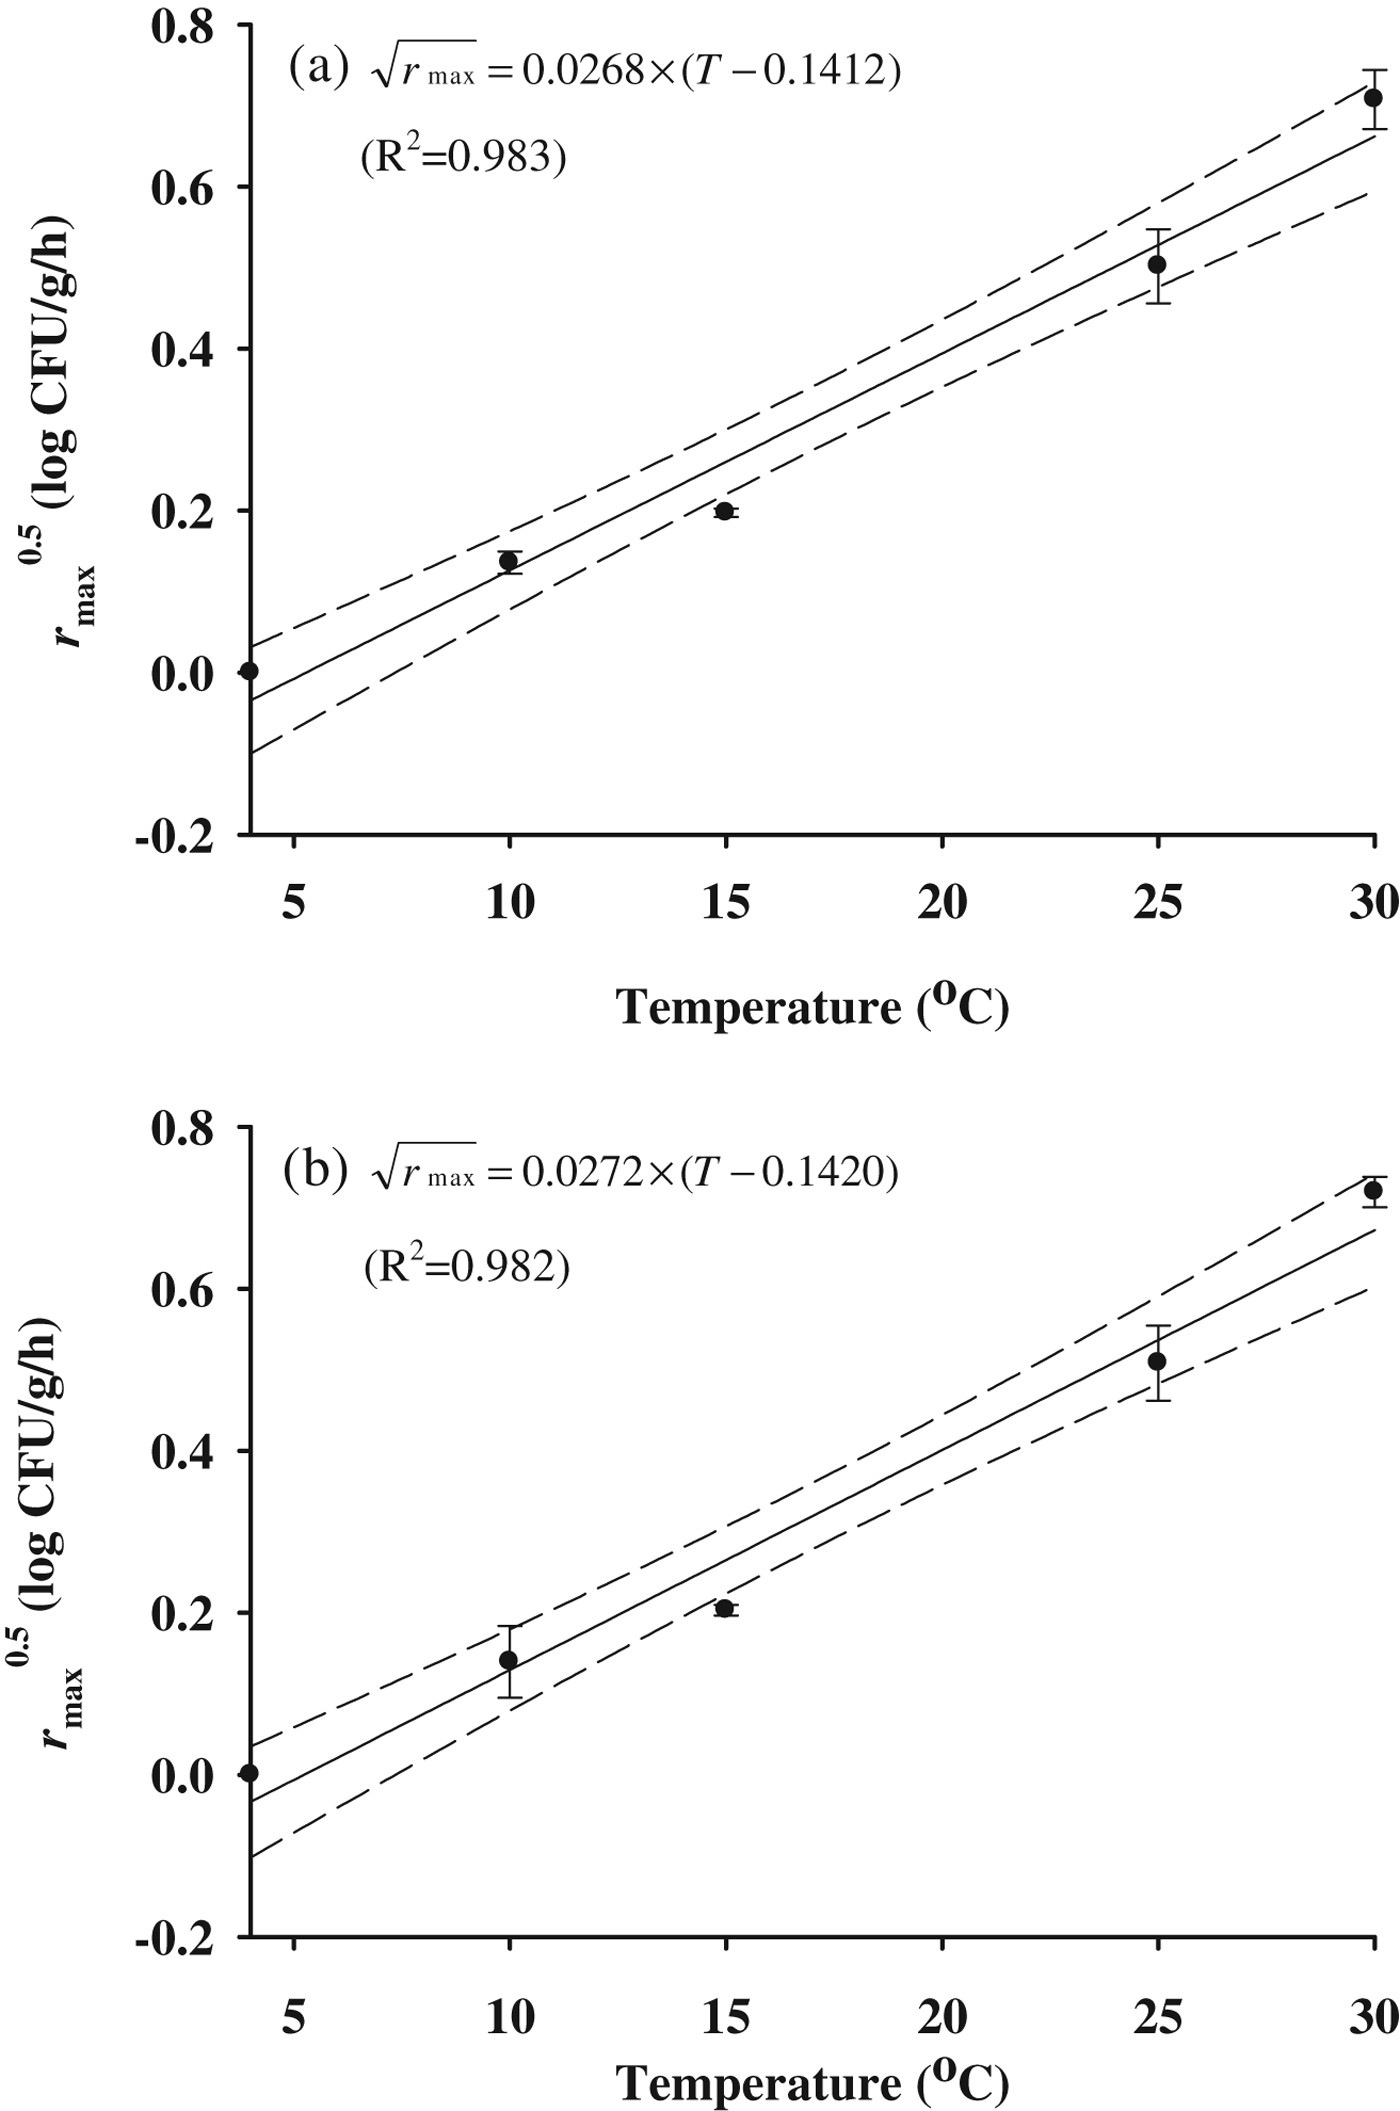
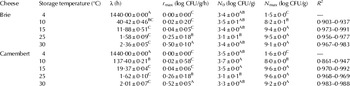
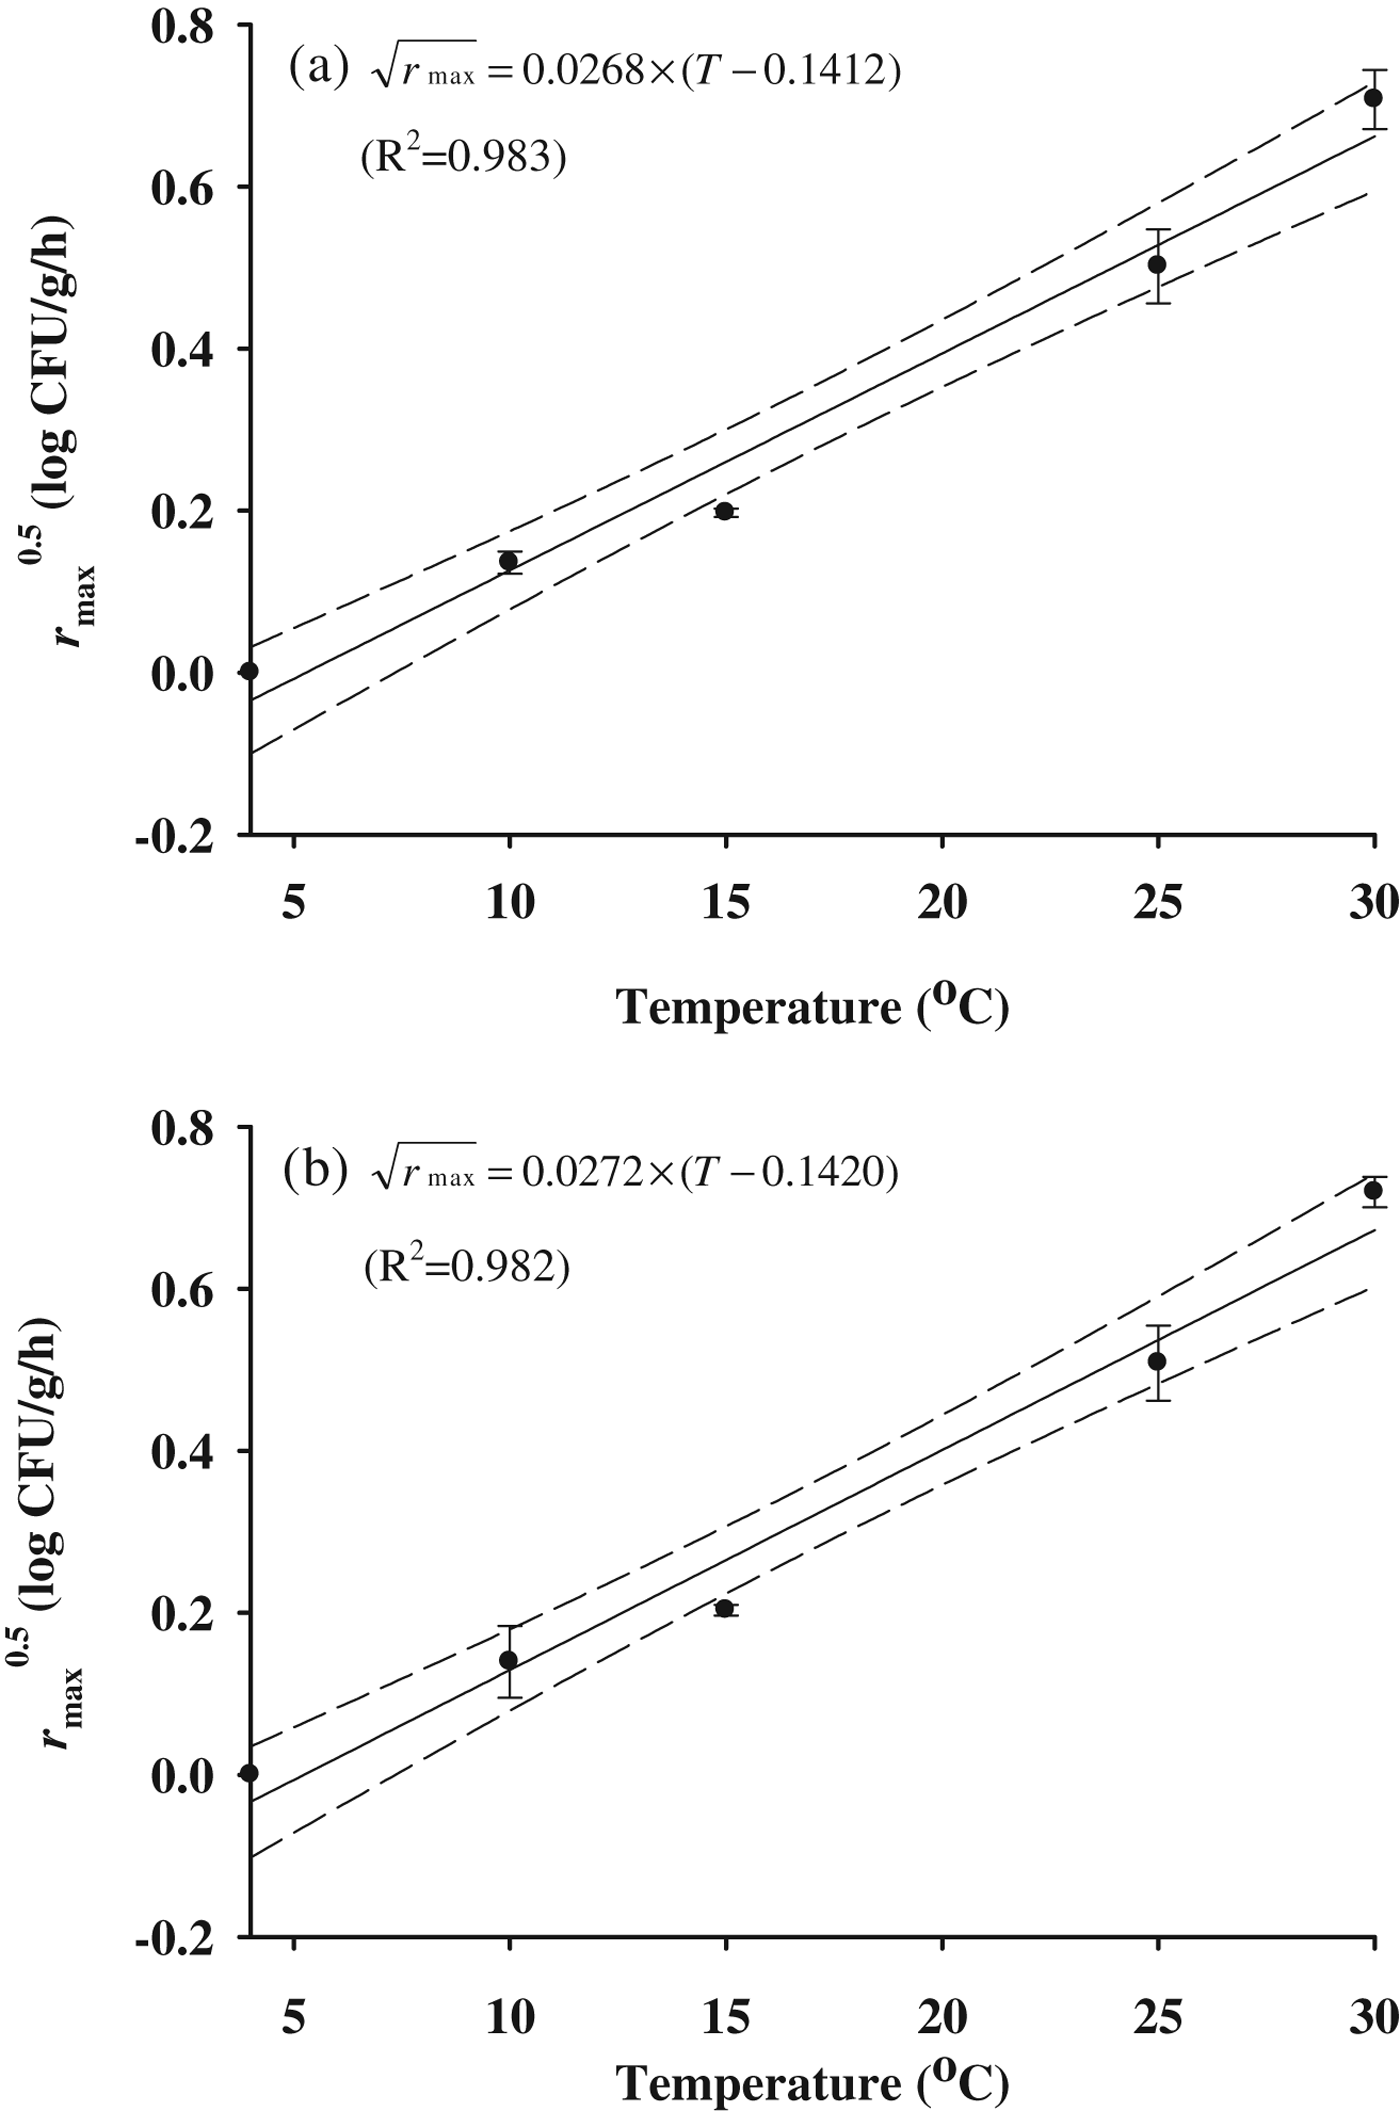
No bacterial growth occurred on Brie or Camembert at 4 °C, but significant growth (P<0·05) was observed at 10–30 °C for both cheeses (Table 1 and Fig. 1). Thus, only the Staph. aureus growth data obtained at 10, 15, 25, and 30 °C were used to develop the primary models; for 4 °C r max was determined to be 0 and the period of storage was estimated as λ. The R 2 values of the primary model were 0·861–0·992 (Table 1), indicating that it appropriately described the growth kinetics of Staph. aureus on Brie and Camembert. The λ values significantly decreased (P<0·05) from 4 to 15 °C for both cheeses, but there was no storage-temperature effect on λ between 15 and 30 °C (Table 1 and Fig. 2). r max values were similar between 10 °C (0·02 log CFU/g/h) and 15 °C (0·04 log CFU/g/h), followed by a significant increase in r max at 25 °C (0·25–0·26 log CFU/g/h) and 35 °C (0·50–0·52 log CFU/g/h). No differences in kinetic parameters were observed between Brie and Camembert (Table 1). This result may be due to their similar pH values (Brie, 6.3; Camembert, 6.6) and water activities (Brie, 0.996; Camembert, 0.981). The secondary models, i.e., the square root model and linear equation, which describe the effect of temperature on the kinetic parameters, had high R 2 values of 0·894–0·983 and produced lines that passed through most of the experimental data points. This result suggests that the secondary models developed in this study, were appropriate for describing the effect of temperature on the kinetic parameters (Figs. 2 & 3).
The primary models of Staphylococcus aureus fitted by Baranyi model (Baranyi & Roberts, Reference Baranyi and Roberts1994) with DMfit; Brie: (a) and (b); Camembert: (c) and (d).

The secondary models for ln(λ) of Staphylococcus aureus on Brie (a) and Camembert (b) cheeses, developed by the linear equation; •: observed value; - - : 95% confidence interval.

The secondary models for r max of Staphylococcus aureus on Brie (a) and Camembert (b) cheeses, developed by square root model (Ratkowsky et al. Reference Ratkowsky, Olley, McMeekin and Ball1982); •: observed value; - - : 95% confidence interval.
Kinetic parameters (mean±relative error) of Staphylococcus aureus on Brie and Camembert cheeses calculated by the Baranyi equation (Baranyi & Roberts, Reference Baranyi and Roberts1994)

r max: maximum growth rate, λ: lag phase duration, N 0: lower asymptote, N max: upper asymptote
A–C: different letters in a same column mean significantly different P<0·05.
To evaluate the performance of the models, an independent experiment was conducted at 18 and 23 °C to obtain experimental data that were not used for model development. The observed Staph .aureus cell counts were compared with those predicted by the combined primary and secondary models at given temperatures. Accuracy (A) and bias (B) factors have been used in many studies; however, Oscar (Reference Oscar2005b) suggested that A and B factors have significant limitations. Thus, in this study, we calculated the RMSE to evaluate model performance. Lower RMSE values indicate smaller difference between predicted and observed data. Lee et al. (Reference Lee, Skandamis, Park, Yoon, Hwang, Lee, Cho and Yoon2013) suggested that model performance was appropriate when the RMSE is 0·326–0·361. Perez-Rodriguez et al. (Reference Perez-Rodriguez, Posada-Izquierdo, Valero, Garcia-Gimeno and Zurera2013) suggested that model performance was appropriate when the RMSE is 0·300–0·450. These values are close to those found for our models (0·380–0·405). In addition, the relative error [RE=(predicted value−observed value)/predicted value] was calculated to be −0·035 for Brie and −0·005 for Camembert. An RE value of less than 0 represents a ‘fail-safe’ prediction, but greater than 0 represents a ‘fail-dangerous’ prediction. Being within an RE range from −0·6 to 0·3 is considered appropriate (Oscar, Reference Oscar2005a). Taken together, these values indicate that the performance of our model is appropriate.
In conclusion, the mathematical models developed in this study should be useful for describing the growth kinetics of Staph. aureus on Brie and Camembert cheeses. Furthermore, these results could be used in exposure assessments as part of quantitative microbial risk assessments for cheeses.
This research was supported by a grant (13162MFDS927) from Ministry of Food and Drug Safety in 2013.