Introduction
As the population ages, the effects of disparities in socio-economic status and how they may affect the health of older people who will make up larger proportions of the populations of Western countries is an important issue for policy makers (Jatrana and Blakely Reference Jatrana and Blakely2014). How the economic living standards of older people are understood and assessed is a matter of current contention (Berthoud, Blekesaune and Hancock Reference Berthoud, Blekesaune and Hancock2006). The measurement of socio-economic status among older people is particularly challenging (Grundy and Holt Reference Grundy and Holt2001). Because older people generally live in different types of economic circumstances to those who are working, and because, as people age, their desires and needs are qualitatively different to those of younger generations (Stephens, Breheny and Mansvelt in press), there is a need for measures of economic living standards which are appropriate for older people.
Economic living standards
Assessment of economic living standards is used to locate individuals within the range of possibilities for material wellbeing within their own society, and these relative measurements are often used to establish poverty rates for particular population groups (Berthoud and Bryan Reference Berthoud and Bryan2011; Jensen et al. Reference Jensen, Krishnan, Spittal and Sathiyandra2003) or to understand the relationship of socio-economic status to health or other outcomes (Grundy and Holt Reference Grundy and Holt2001; Renahy et al. Reference Renahy, Alvarado-Llano, Koh and Quesnel-Vallee2012; Salmond and Crampton Reference Salmond and Crampton2012). Economic living standards have long been assessed in terms of comparisons of income, wealth, and material resources or assets owned by individuals (Macintyre et al. Reference Macintyre, McKay, Der and Hiscock2003). Income has been the most popular indicator but has also been found wanting because measures of income alone do not include other financial resources or advantages, do not account for changes across time, do not include varying demands on that income, and are not reported accurately or willingly by many respondents (Pfoertner, Andress and Janssen Reference Pfoertner, Andress and Janssen2011; Renahy et al. Reference Renahy, Alvarado-Llano, Koh and Quesnel-Vallee2012; Saunders, Naidoo and Griffiths Reference Saunders, Naidoo and Griffiths2008). These issues are particularly relevant to older people whose incomes change as they move into retirement, who may have varying levels of assets, who are less likely to have dependants although they have lower incomes and who may be sensitive to reporting their income. In general, measures of income do not capture the range of resources that contribute to living well within a particular society.
To counteract these shortcomings, an alternative approach to assessing living standards has been developed, which is conceptually based on people's ability to participate in their own society. Originating in the living standard concept introduced by Peter Townsend (Reference Townsend1979), this approach focuses on what people consume, their ability to engage in recreation and other forms of social participation, and their household facilities, rather than on calculations of the resources (income and assets) that enable participation (Halleröd Reference Halleröd2006; Jensen et al. Reference Jensen, Krishnan, Spittal and Sathiyandra2003). Measurement of living standards from this perspective has been used to capture deprivation according to the lack of ability to participate for many reasons, rather than simply on lack of income (Pfoertner, Andress and Janssen Reference Pfoertner, Andress and Janssen2011). Although measures of living standards have largely focused on assessing deprivation (Saunders, Naidoo and Griffiths Reference Saunders, Naidoo and Griffiths2008), the approach has also been developed to capture differences in living conditions across the spectrum from deprived to comfortable (Perry Reference Perry2009; Salmond and Crampton Reference Salmond and Crampton2012). However, the focus of this approach remains on capturing lack of resources or lack of socially perceived necessities (Saunders, Naidoo and Griffiths Reference Saunders, Naidoo and Griffiths2008).
To develop measures based on this approach to living standards, it is necessary to identify a consensus-based list of goods and activities which are needed and valued in society, and to establish that these goods and activities are not available to all, although they are universally desired. Indicators can then assess the level of ownership of or access to these items (e.g. Berthoud and Bryan Reference Berthoud and Bryan2011; Jensen et al. Reference Jensen, Spittal, Crichton, Sathiyandra and Krishnan2002; Pfoertner, Andress and Janssen Reference Pfoertner, Andress and Janssen2011; Renahy et al. Reference Renahy, Alvarado-Llano, Koh and Quesnel-Vallee2012; Salmond et al. Reference Salmond, King, Crampton and Waldegrave2006). Although measures, such as those cited above, have demonstrated utility, there are also some issues when applied to older people's economic wellbeing. Three main problems have arisen with the validity of measures using the consensual deprivation approach. First, the focus on exclusion and deprivation is very appropriate for studies to establish levels of poverty, but in regard to studies of the relationships between socio-economic status and health, they do not add very much to explanations of inequalities at levels of economic wellbeing beyond deprivation (e.g. Salmond and Crampton Reference Salmond and Crampton2012). Secondly, consensual measures of living standards depend upon widespread agreement regarding valued consumer goods, social activities and luxuries that all members of a society need or aspire to (McKay Reference McKay2004). There may be limited consensus within groups, or differences across social and cultural groups within the same society. Thirdly, consensual measures are based on an assumption that the actual access to economic resources is unrelated to personal or cultural preferences. However, evidence suggests that people adapt their preferences to match their economic conditions (Halleröd Reference Halleröd2006) and entrenched deprivation can condition beliefs about what is possible (Sen Reference Sen1987). In the context of ageing, research using consensual measures has also shown that age itself has an important confounding effect on the assessment of living standards.
Economic living standards of older people
Evidence suggests that preferences regarding the important aspects of economic living standards are relative across different age groups. A general tendency for the self-reported material living standards of older people to increase with age has been observed (Fergusson et al. Reference Fergusson, Hong, Horwood, Jensen and Travers2001) and older people are less likely to report financial strain (Groffen et al. Reference Groffen, Bosma, van den Akker, Kempen and van Eijk2008) although their income is generally reduced (Berthoud, Blekesaune and Hancock Reference Berthoud, Blekesaune and Hancock2006). Older people report fewer needs they cannot afford than younger groups, but generally have fewer basic or luxury goods (Berthoud, Blekesaune and Hancock Reference Berthoud, Blekesaune and Hancock2006; Groffen et al. Reference Groffen, Bosma, van den Akker, Kempen and van Eijk2008). Older people are less likely to say they cannot afford items, and more likely to say they do not want them (Bradshaw and Finch Reference Bradshaw and Finch2003; Halleröd Reference Halleröd2006; McKay Reference McKay2004; Perry Reference Perry2009), and older people with limited economic resources are more likely to claim they do not want items compared to younger low-income earners (Halleröd Reference Halleröd2006). Accordingly, differences between wanting, needing and not being able to afford an item are subject to interpretations related to age and social circumstances.
Two broad explanations have been offered for these observed differences between older and younger people. The first is cohort effects related to changes across generations in the experiences and expectations of living standards. The pattern of ownership of necessities and luxuries is different for different age populations (Berthoud, Blekesaune and Hancock Reference Berthoud, Blekesaune and Hancock2006) and these may be related to the material circumstances of each cohort's experience. Secondly, there are changes in circumstance with advancing age for every generation that may lead to age-related change in material wants and needs. Halleröd (Reference Halleröd2006) suggests that the age effect may be due to the adaptation of preferences over time, as older people are more likely to have adapted their preferences to more closely match their economic situation. Consequently, low rates of hardship reported by older people may reflect systematic differences in responses to needs, wants and preferences. These age-related changes may include psychological adaptation, such as increasing disengagement from the wider social world and expected shifts in social status with concomitant reduction in needs. Berthoud, Blekesaune and Hancock (Reference Berthoud, Blekesaune and Hancock2006) use longitudinal data to support this explanation. They found that people report increasing levels of deprivation as they age, although their perception of financial strain decreases. A final aspect to be taken into account in assessing populations is survival effects, since we know that the most materially deprived are less likely to survive to old age (Grundy and Sloggett Reference Grundy and Sloggett2003). Thus, remaining well-off populations will be more likely to report satisfaction with their standard of living.
All explanations carry some weight. The actual reduction in living standards that accompanies ageing, and changes in circumstances and needs, may combine with a cohort effect, reflecting the standards of a particular generation, to produce a particular continuum of living standards. In addition, a survivor effect among the older old will affect the nature of the observed relationship between living standards and health for groups of older people. Thus, the problems with the consensual assessment of relative deprivation are highlighted when evaluating the living standards of older people. To address these, Sen's Capability Approach offers an opportunity to move further beyond resources themselves and the focus on lack.
Capability Approach
Sen's (Reference Sen1987) Capability Approach to economic wellbeing takes us further along the path from the focus on material goods or particular activities, to a concern with the values of people's lives. Rather than focus on the consumption of goods, Sen's (Reference Sen1982) economic analysis distinguishes between a physical, social or environmental good, the utility or benefit of the good, and the functioning, or individual's use, of the good. For Sen, these ‘functionings’ include basic needs such as being healthy and socially respected, but his theoretical focus is on a person's ‘capability’ or the extent to which they have the ability to function in a particular valued way, whether or not they choose to do so (Sen Reference Sen, Nussbaum and Sen1993). ‘Capability’ describes what individuals are able to do and be, and the level of their freedom to pursue the lives they have reason to value. Sen (Reference Sen2002) distinguishes between the achievement of certain specified standards of living, and the capability to achieve desired standards of living. Thus, from a capability perspective, living standards are not located in possession of particular physical, social and environmental goods, but in the possibilities made available for an individual to achieve desired functionings. Consequently, to develop understanding of living standards we need to shift our attention from the possession of particular goods or participation in specified activities to people's perception of their capability to achieve desired functionings. Although the resources required to achieve valued functionings may change as people age, perceptions of capabilities themselves continue to reflect access to aspects of life that older people have reason to value.
A capabilities approach takes into account differences in health, education, resourcefulness and social connections that may influence the process of transforming resources into living standards and additionally accounts for social and cultural diversity in how people achieve valued functionings. People may prefer different ways of living, but those with higher standards of living have greater capability to achieve their valued functionings. A conceptualisation of living standards in terms of capabilities focuses on the extent to which people have the capability to achieve their valued functionings whatever they may be (Robeyns Reference Robeyns2005). For example, Anand and van Hees (Reference Anand and van Hees2006) assessed wellbeing from a capability perspective. Rather than inquiring about levels of actual social participation, or quality of the environment, participants assessed their scope to achieve in these areas. Grewal et al. (Reference Grewal, Lewis, Flynn, Brown, Bond and Coast2006) analysed data from interviews with older people in the United Kingdom to identify six important attributes of quality of life. They identified these attributes as a set of functionings, and the capability to achieve the functionings of attachment, role, enjoyment, security and control as the marker of quality of life. In the same way, standard of living may be seen in terms of the capability to achieve valued functionings (Comim Reference Comim2001). The Capability Approach is a theoretical perspective rather than a set of guidelines and as such it remains an open, underdeveloped and often contested framework that can be used for a variety of aims (Comim Reference Comim2001; Robeyns Reference Robeyns2005).
To assess living standards of older people in terms of capabilities, we began with a qualitative study of 143 interviews with people aged 63–93 years in New Zealand (for details of the initial development of the measure, see Breheny et al. Reference Breheny, Stephens, Alpass, Stevenson, Carter and Yeung2013). Analysis of interviews with these participants established six domains of functionings relevant to their valued living standards (Stephens et al. in press). Questionnaire items were developed and tested for face validity in interviews, to assess the extent to which older people had the freedom to pursue these domains. The questionnaire was pilot tested (with 2000 New Zealanders aged over 65 years randomly selected from the electoral roll). Confirmatory factor analysis (CFA) of a set of 34 items supported the six theoretical domains which were labelled: Health Care, Social Integration, Contribution, Restriction, Security and Enjoyment. Following model development, 25 items assessing the six domains were selected to form a new measure of living standards for older people named the Living Standards Capability for Elders (LSCAPE).
The aims of the present study were (a) to assess the reliability and validity of the LSCAPE and (b) to develop and test a short form of the measure: LSCAPE-6.
Method
Study sample
The LSCAPE was included in the 2012 postal survey of the New Zealand Longitudinal Study of Ageing involving a population sample of 3,923 New Zealand adults aged 50–87 years (for further information, see http://nzlsa.massey.ac.nz/). All participants in this study were randomly selected from the New Zealand electoral roll. Because Māori, the indigenous people of New Zealand, comprise less than 7 per cent of the target age group population (Statistics New Zealand 2009), coupled with estimated attrition rates (see Towers Reference Towers2007), this key ethnic minority was over-sampled to maximise participant recruitment, and allow a better representation of this population. Participants of Māori ethnicity were over-sampled by drawing additional Māori participants using the Māori descent indicator in the electoral roll database. To compensate for both the over-sampling of Māori and for any response biases due to age, gender or ethnicity, a weight was calculated for all respondents that rebalanced the sample to reflect more accurately the population from which the sample was drawn.
A paper-based ‘omnibus’ questionnaire was employed for data collection, which included a broad range of measurement domains including health, wellbeing, social support, neighbourhood characteristics, caring commitments, work and retirement, and demographic information. Multiple contact points were employed to maximise survey participation (in accordance with Dillman Reference Dillman2000). A newsletter containing information about the upcoming survey was sent to those people who had completed a previous questionnaire from an earlier data collection wave. Three months later, questionnaires were distributed via post, each with a pre-paid self-addressed envelope for returning completed surveys. After one week, the whole sample was sent reminder postcards. After two to four weeks, all non-respondents were sent replacement questionnaires. One week later, remaining non-respondents were contacted (via phone or e-mail) to seek information about non-completion.
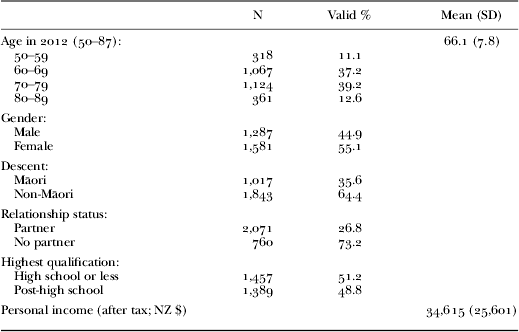
Of the 3,923 questionnaires sent out, 41 were returned to sender (not locatable), and notification was received of 66 people being unable to participate (19 too unwell; 47 deceased). Of the 3,816 remaining, 2,968 were returned (78 per cent response rate). Demographic information for the sample is displayed in Table 1.
Measures
LSCAPE measure of living standards
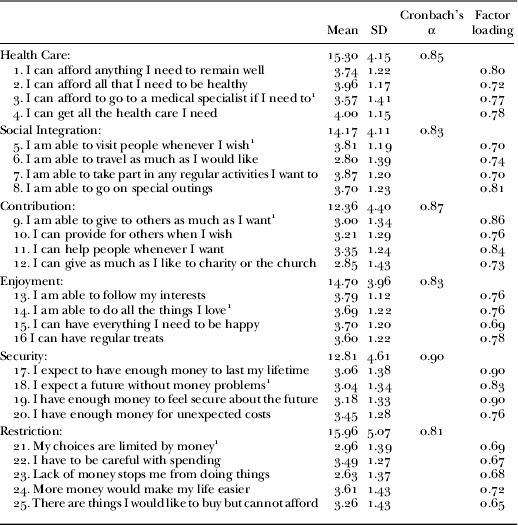
The LSCAPE comprises 25 items that assess the living standards of older people in terms of their capability to achieve valued functionings across six domains: Health Care, Social Integration, Contribution, Enjoyment, Security and Restriction (Breheny et al. Reference Breheny, Stephens, Alpass, Stevenson, Carter and Yeung2013). See Table 2 for all items. All items have five-point response formats on a Likert scale, anchored at ‘not at all true for me’ and ‘definitely true for me’ (mean = 83.4, standard deviation (SD) = 22.3, α = 0.96).
Along with the LSCAPE, the following were used to assess convergent and discriminant validity of the LSCAPE scale and sub-scales.
Living standards
The Economic Living Standards Index short form (ELSI-SF; Jensen et al. Reference Jensen, Spittal, Crichton, Sathiyandra and Krishnan2002) comprises 25 questions that assess restrictions in the ownership of household items, restrictions in social participation, the extent to which respondents economised to keep living costs down and self-rated satisfaction with living standards. For example, respondents are asked whether they have goods such as a washing machine or services such as home contents insurance, are able to warm their homes or have an overseas holiday every three years. Scores are combined and transformed (for details, see Jensen et al. Reference Jensen, Spittal, Crichton, Sathiyandra and Krishnan2002) to form a composite score (0–31), with higher scores reflecting greater economic living standards (mean = 24.2, SD = 5.6).
Life satisfaction
Life satisfaction was assessed with a single item (‘All things considered, how satisfied are you with your life as a whole these days?’; Inglehart et al. Reference Inglehart, Basañez, Diez-Medrano, Halman and Luijkx2004) using a five-point response scale anchored at ‘very dissatisfied’ and ‘very satisfied’ (mean = 4.1, SD = 0.8).
Happiness
Happiness was assessed with a single item (‘In general, how happy or unhappy do you usually feel?’; Fordyce Reference Fordyce1988) using an 11-point response scale anchored from ‘extremely unhappy’ to ‘extremely happy’ (mean = 7.8, SD = 1.8).
Health
Health was assessed using the SF12 health measure (Ware, Kosinski and Keller Reference Ware, Kosinski and Keller1996). The SF12 consists of 12 questions and has two summary components (Physical Health and Mental Health). Norm-based methods were employed to standardise summary component scores using means, standard deviations and factor score coefficients for the scales, resulting in physical health and mental health scores, with higher scores reflecting better health. Scores ranged from 11 to 69 for physical health (mean = 49.9, SD = 10.7) and from 15 to 68 for mental health (mean = 49.6, SD = 7.6). Self-rated health was assessed with a single item from the physical component scale of the SF12 (‘In general, would you say your health is:’), with five possible response options from ‘excellent’ to ‘poor’ and responses reverse-scored so that a higher score indicates better self-rated health (mean = 3.5, SD = 0.9).
Quality of life
Quality of life (QOL) was assessed with an eight-item measure (EUROHIS-QOL eight-item index; Schmidt, Muhlan and Power Reference Schmidt, Muhlan and Power2006), derived from the WHOQOL-100 and the WHOQOL-BREF. The overall QOL score is formed by a simple summation of scores on the eight items, with higher scores indicating better QOL. All items have five-point response formats on Likert scales, ranging for instance from ‘not at all’ to ‘completely’ (mean=33.0, SD=5.0; α=0.85).
Other demographic measures
Other demographic measures included age, gender, relationship status, highest qualification (high school or less versus post- high school), retirement status, annual personal income (after tax) and total worth of assets.
Demographic profile of the sample
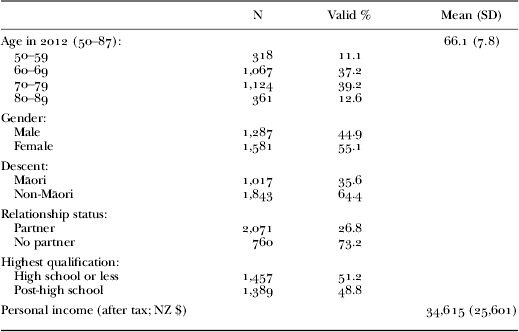
Notes: N values will vary due to missing data. SD: standard deviation.
Overview of data analysis
Descriptive and basic statistical analyses of the data were performed using IBM SPSS Statistics 19 (SPSS Inc. 2010) computer software. CFA was performed using IBM Amos 19.0 (Arbuckle Reference Arbuckle2010) software to test whether the proposed living standards factor structures demonstrated adequate construct validity.
The data were screened, followed by random case selection to split the data-set into two smaller samples, one for psychometric testing of the LSCAPE; and the other for the LSCAPE-6 short-form scale development and testing. t-Tests were conducted to check that there were no significant differences between the two sub-samples across the study variables. Inter-item correlations were examined and statistical tests for establishing the suitability of the data for factoring were conducted. As the number of factors was fixed, the items predicted to load on each factor were established at the outset, and the factors were expected to be correlated; CFA was used to test the factor structure. Goodness of fit was determined on the basis of several indices: the Root Mean Square Error of Approximation (RMSEA; Steiger Reference Steiger1990), the Comparative Fit Index (CFI; Bentler Reference Bentler1990), and the Goodness of Fit Index and Adjusted Goodness of Fit Index (GFI and AGFI; Joreskog and Sorbom Reference Joreskog and Sorbom1989).
Reliability was evaluated by assessing internal consistency (Cronbach's alpha) and item–total correlations of the scales and sub-scales. A series of Pearson product-moment correlations were computed between the scales and other self-report measures to test convergent and discriminant validity. The LSCAPE was compared with one other living standards measure (ELSI-SF) and six wellbeing measures (quality of life, life satisfaction, happiness, self-rated health, physical health and mental health) that, based on previous research, were expected to be related to the living standards items. Correlation analyses were also conducted to test discriminant validity for the sub-scales. For example, total worth of assets was expected to correlate slightly more strongly with the security sub-scale (containing items about having enough money to feel secure about the future) than with the other five sub-scales, but not to correlate so strongly with the sub-scale that it may be seen as a proxy for this measure of living standards. Discriminant validity was also assessed by comparing the LSCAPE sub-scales with measures not expected to be directly related to them (e.g. gender, retirement status). The relationships between different demographic variables (e.g. age, ethnicity, education) and each of the factors were also tested.
Results
Data screening
Missing data
In accordance with the recommendation of Hair et al. (Reference Hair, Black, Babin, Anderson and Tatham2006), cases with 50 per cent or more missing data were identified and omitted from further analyses, leaving 2,895 cases. Overall, 3.1 per cent of the data values were identified as missing over the study variables. Separate variance t-tests indicated few non-random processes. Given the low proportion and randomness of missing data, mean imputation was used to replace missing values.
Assumption testing
The assumptions of normality and linearity were evaluated through SPSS 19. Several of the variables were skewed and transformations were applied to normalise the distribution of responses. Reflex and logarithm transformation (for negative skewness) of the income variable, and square root and logarithm transformations (for positive skewness) of the ELSI-SF, QOL and happiness variables improved the normality of the distributions. Testing identified 25 univariate outliers, which were removed from the data (of which, seven had very high income figures, five had very low QOL and 15 had very low ELSI-SF scores). There were no multivariate outliers. Analyses were run on data-sets including the transformed variables and those with untransformed variables; as few differences were found, results for analyses with untransformed data are reported.
LSCAPE testing
Mean item and sub-scale scores for the LSCAPE are shown in Table 2, along with standard deviations, Cronbach's alphas and factor loadings. The mean total LSCAPE score for this sub-sample was 84.7 (SD = 22.7).
Mean scores, standard deviations (SD), factor loadings and Cronbach's alpha coefficients for the Living Standards Capability for Elders (LSCAPE) sub-scales

Note: 1. LSCAPE-6 items.
Internal consistency
Corrected item–total correlations for the 25-item LSCAPE ranged from 0.46 to 0.82. For the individual sub-scales these were as follows: Health Care (0.65–0.71), Social Integration (0.62–0.70), Contribution (0.68–0.78), Enjoyment (0.62–0.69), Security (0.69–0.82) and Restriction (0.57–0.63). These coefficients show that the individual items are related to their respective sub-scales and to the 25-item LSCAPE at a level higher than the rule of thumb minimum value of 0.2 (Kline Reference Kline1986). Internal consistency was examined using Cronbach's alpha computed for the total score and the six sub-scales. The alpha scores (see Table 2) ranged from 0.81 to 0.90. The alpha reliability coefficient for the 25-item LSCAPE was 0.96, indicating excellent internal consistency.
Confirmatory factor analysis
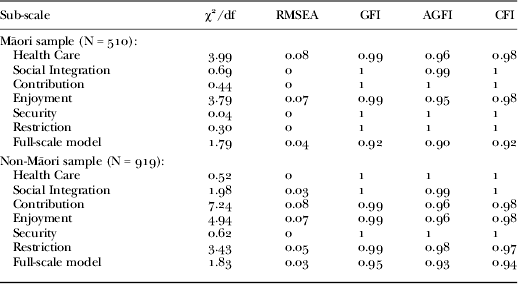
CFA was used to test the extent to which the data conform to the six-factor model previously identified (Breheny et al. Reference Breheny, Stephens, Alpass, Stevenson, Carter and Yeung2013), with Māori and non-Māori sub-sets tested separately. As there were significant correlations between all items, the items were suitable for CFA. A review of kurtosis values revealed no item to be substantially kurtotic; however, the index of multivariate kurtosis and its critical ratio revealed evidence of non-normality. Given this indication of multivariate kurtosis, asymptotic distribution-free estimation was employed to estimate all models (in accordance with Byrne's Reference Byrne2010 guidelines).
The results of the CFA are shown in Table 3. With the GFI, AGFI and CFI fit indices exceeding the recommended 0.90 cut-off value and most RMSEA values being on or below the cut-off value of 0.08, good model fit was indicated for all but the Security sub-scale. The Security sub-scale initially had RMSEA values greater than 0.10 for both the Māori and non-Māori sub-sets (0.12 and 0.14, respectively), indicating poor model fit. A review of the modification indices for this sub-scale identified evidence of misspecification associated with the pairing of error terms for items 19 (‘I have enough money to feel secure about the future’) and 20 (‘I have enough money for unexpected costs’). The error covariance between these items indicated the possibility of redundancy due to content overlap. In light of this apparent item content overlap and the warning that it is seldom appropriate with real data to not allow error terms to be correlated (Bentler and Chou 1987, as cited in Byrne Reference Byrne2010), the model for this Security sub-scale was respecified. The fit for the Security data was significantly improved by allowing error covariance between items 19 and 20 to covary, with all GFI, AGFI and CFI values now = 1.00 and RMSEA = 0 for both Māori and non-Māori sub-sets.
Confirmatory factor analysis fit indices for the six sub-scales of the Living Standards Capability for Elders (LSCAPE) and the final full-scale models for Māori and non-Māori samples
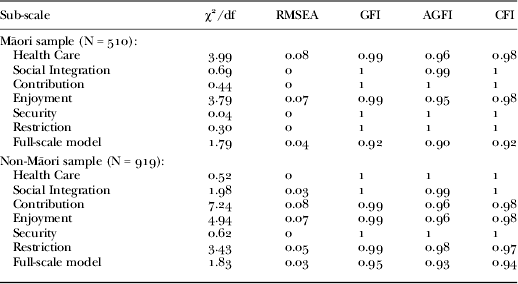
Notes: df: degrees of freedom. RMSEA: Root Mean Square Error of Approximation. AGFI: Adjusted Goodness of Fit Index. CFI: Comparative Fit Index. GFI: Goodness of Fit Index.
For the second-order (full scale) model, for both the Māori and non-Māori sub-sets, the initial GFI, AGFI and CFI values fell below the recommended cut-off criteria. Modification indices indicated that significant model improvement would be achieved by removing one of the Security sub-scale items (item 19) and allowing some error terms to covary. Post-hoc model modifications were performed, which resulted in an improved model for both groups, with the GFI, AGFI and CFI values now meeting or exceeding the set value of 0.90, and further reduced RMSEA values. Overall, the results support the same factor structure for both sub-sets (Māori and non-Māori).
The Cronbach's alpha reliability coefficient for the revised three-item Security sub-scale was 0.87 and the reliability coefficient for the revised 24-item LSCAPE remained at 0.96, indicating excellent internal consistency.
Correlational analyses
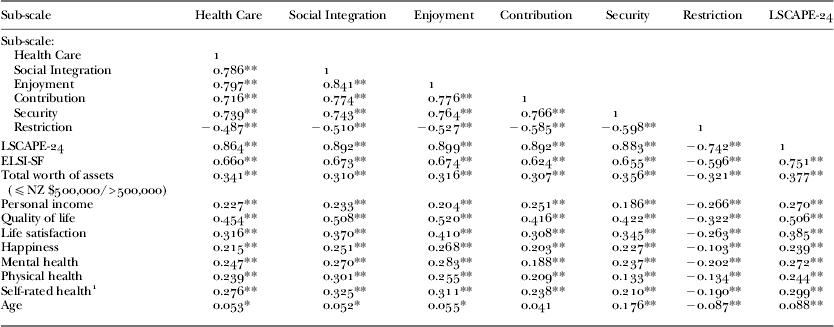
Pearson correlations were computed to examine the association between the six LSCAPE sub-scales, the 24-item LSCAPE (LSCAPE-24) total score, and self-report measures to test convergent and discriminant validity (see Table 4). The different sub-scales were inter-correlated in the expected direction and these relationships are consistent with those reported by Breheny et al. (Reference Breheny, Stephens, Alpass, Stevenson, Carter and Yeung2013). As expected, there were significant positive associations between the LSCAPE-24 sub-scales and convergent validity measures (the exception being the Restriction sub-scale correlations, which were all negative as expected).
The LSCAPE-24 total score and sub-scales showed moderate–strong relationships with the ELSI-SF and moderate relationships with income and the measures of wellbeing (quality of life, life satisfaction, happiness and health). For the most part, the Enjoyment and Social Integration sub-scales demonstrated the strongest associations and Restriction the lowest.
Table 4 also shows that measures were related to the sub-scales by content. For example, income demonstrated a stronger (negative) association with the Restriction sub-scale (containing items about financial limitations) than with the other five sub-scales.
Pearson's r correlations between the Living Standards Capability for Elders (LSCAPE) sub-scales and various measures
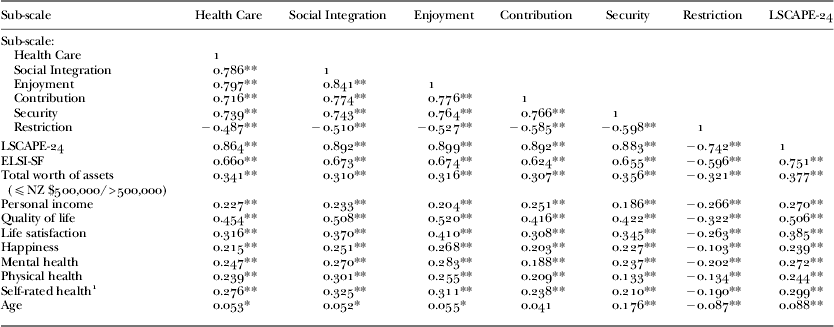
Notes: 1. Self-rated health is one item from the Physical Health component of the SF12 health measure. ELSI-SF: Economic Living Standards Index short form.
Significance levels: * Significant at the 0.05 level, ** significant at the 0.01 level (two-tailed).
The LSCAPE-24 and ELSI-SF sum scores were standardised to facilitate comparisons between the two measures of living standards. Comparison of LSCAPE-24 and ELSI-SF plots (histograms, normal probability plots, detrended normal probability plots) and summary statistics (e.g. skewness, kurtosis) indicated the LSCAPE-24 was more normally distributed than the ELSI-SF (skewness values for the LSCAPE-24 and ELSI-SF were −0.17 and −1.43, respectively, with kurtosis values of −0.67 and 2.43, respectively). Comparison of binned scores indicated that the LSCAPE-24 discriminated better at the higher end of the scale than ELSI-SF. There was a small amount of loss of discrimination at the lower end of the scale. The LSCAPE-24 and ELSI-SF show levels of association with the measures of subjective wellbeing and health as shown in Table 5. As expected from the better discrimination at the higher end of the living standards spectrum, the LSCAPE-24 is more strongly correlated with total worth of assets than is the ELSI-SF. The ELSI-SF correlates more strongly with annual income than does the LSCAPE-24.
Short-form measure
Item selection
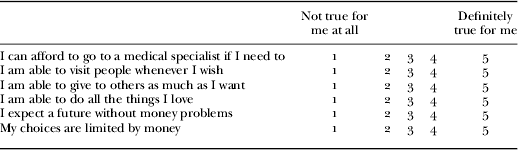
Several criteria were employed in selecting items for the short-form measure of living standards, and decisions were principally based on the item response distributions, factor loadings, and wording and meaning of the items. To ensure that the short-form measure provided discrimination across the range of living standards, items with the greatest response variation were favoured. Following this, factor loadings were examined, and when factor loadings were similar, items were selected based on subjective assessment of item wording or meaning. Based on these criteria, one item was selected to represent each of the six living standards factors, resulting in a six-item short-form measure. The items selected for the living standards short-form (LSCAPE-6) measure are indicated in Table 2 and reproduced in the Appendix.
Psychometric testing
The internal consistency of the LSCAPE-6 (mean = 20.6, SD = 5.7) was good with Cronbach's α = 0.84. Corrected item–total correlations for the LSCAPE-6 ranged from 0.49 to 0.69.
A CFA using structural equation modelling was performed to test the structural validity of the LSCAPE-6 model, with the asymptotic distribution-free method again used for parameter estimation. The model fitted the data well (χ2/degrees of freedom = 3.11, RMSEA = 0.04, GFI = 0.99, AGFI = 0.98, CFI = 0.97), with a satisfactory contribution of the latent factor on each item (factors loadings ranged from 0.52 to 0.76).
In comparing the shortened LSCAPE-6 and the LSCAPE-24 measures, to address over-inflated correlations caused by items correlating with themselves, the six-item scale was compared with both the full 24-item scale and the remaining 18-item form. The correlation between scores from the LSCAPE-24 and the LSCAPE-6 was 0.96; and between the LSCAPE-6 and 18-item form was 0.92.
The comparability of pro-rated scores from the six-item scale (i.e. total six-item score multiplied by (24/6), to provide a metrically equivalent total value to that of the 24-item scale) with the use of the LSCAPE-24 scale was used to determine the concurrent validity of the LSCAPE-6. Again the six-item scale was compared with both the 24-item and 18-item forms, with comparisons made using paired t-tests. There were no significant differences in the scores for the pro-rated six-item LSCAPE-6 (mean = 82.4, SD = 23.0) and those obtained using either the LSCAPE-24 (mean = 82.1, SD = 21.1) or the pro-rated 18-item (i.e. total 18-item score multiplied by (24/18)) form (mean = 82.0, SD = 20.9; t(1440) = 1.72, not significant).
Pearson r correlations showed significant positive associations between the LSCAPE-6, the LSCAPE-24 total score, and measures of living standards and wellbeing (see Table 5). As expected, the LSCAPE-6 demonstrated similar correlations to the LSCAPE-24, with all other measures.
Pearson's r correlations between the living standards scales and various measures

Notes: LSCAPE-24: Living Standards Capability for Elders (24 items). LSCAPE-6: Living Standards Capability for Elders short form. ELSI-SF: Economic Living Standards Index short form.
Significance level: ** Significant at the 0.001 level.
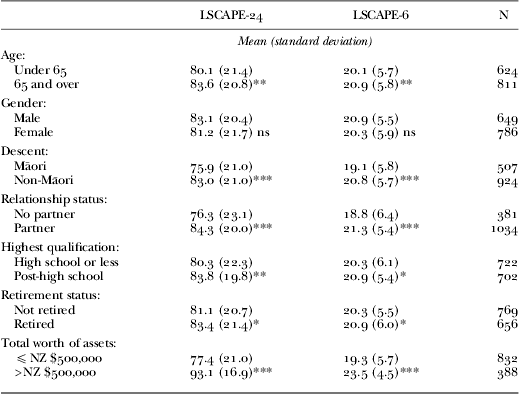
Differences in LSCAPE-24 and LSCAPE-6 scores were examined between demographic groups including those under and over 65 years (age of eligibility for NZ Superannuation), by gender, ethnic group, relationship status, retirement status, education and assets. Table 6 shows the LSCAPE-24 and LSCAPE-6 mean scores, with significant mean differences found according to age, ethnicity, relationship status, educational qualification, retirement status and total worth of assets.
Living Standards Capability for Elders mean scores for different demographic variables
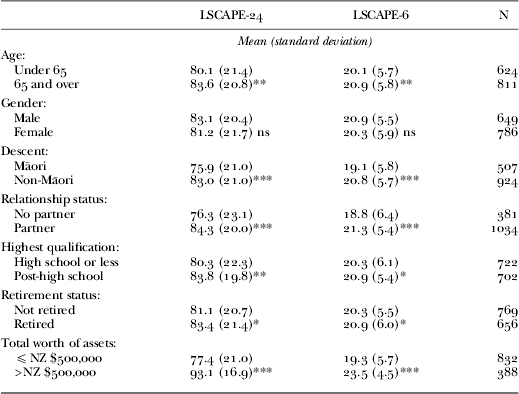
Notes: LSCAPE-24: Living Standards Capability for Elders (24 items).
LSCAPE-6: Living Standards Capability for Elders (short form). N values will vary due to missing data.
Significance levels: Mean difference * significant at the 0.05 level, ** significant at the 0.01 level, *** significant at the 0.001 level, ns: not significant.
Discussion
The aims of this research were (a) to assess the reliability and validity of a measure of living standards for older adults and (b) from this measure, to develop and test a short-form measure of living standards. Correlations and CFAs were conducted to assess the internal reliability of each form, along with the structural validity, concurrent validity, and convergent and discriminant validity. To assess this LSCAPE-24 measure of living standards, we have examined the patterns of association with demographic variables, measures of economic position including an existing measure of living standards, measures of subjective wellbeing and measures of health. The pattern of association demonstrates overlap with these related constructs without redundancy. As expected, the LSCAPE-24 measure of living standards is more strongly associated with total worth of assets than annual income, as income is acknowledged to be a poor indicator of economic position in later life (Jatrana and Blakely Reference Jatrana and Blakely2014). Associations were also found with measures of overall subjective wellbeing: quality of life and life satisfaction. As expected, the level of association is much stronger with these measures than with happiness, which assesses an emotional component of subjective wellbeing (Pinquart and Sorensen Reference Pinquart and Sorensen2000). Given this approach to measuring living standards is based on assessing the extent to which older people are able to live a life they have reason to value, the strength of these patterns of association with economic and wellbeing indicators demonstrates that the LSCAPE-24 has achieved a broader approach to living standards without losing the association with material living conditions.
The strong correlation with a well-validated measure of living standards, the ELSI-SF, demonstrates the association of the LSCAPE-24 with material living conditions. The ELSI-SF assesses living standards in terms of ownership of material goods, ability to participate socially and a subjective assessment of economic position (Jensen et al. Reference Jensen, Spittal, Crichton, Sathiyandra and Krishnan2002). Comparing the LSCAPE-24 to the widely used ELSI-SF shows similar magnitude of correlations to measures of economic position, wellbeing and health. The LSCAPE-24 provides the additional benefit of being more normally distributed and providing more discrimination at the higher end of the living standards spectrum. It is a recognised weakness of consensual measures of living standards that they add little to explanations of inequalities at levels of economic wellbeing beyond deprivation (e.g. Salmond and Crampton Reference Salmond and Crampton2012). This improved discrimination is demonstrated in the present sample by small increases in the strength of the correlation between the LSCAPE-24 and self-rated health and mental health compared to the ELSI-SF. As self-rated health predicts mortality above and beyond objective health risks (Segerstrom Reference Segerstrom2014), the extent of the relationship between the LSCAPE-24 and self-rated health is important. Such increases are the first step towards improved understandings of the association between socio-economic position and health. Although the increase in the relationship to health is modest in this sample, this may reflect the complexity of changes to living standards and health in later life. As people age, mental health tends to improve (Chandola et al. Reference Chandola, Ferrie, Sacker and Marmot2007; Stephens et al. Reference Stephens, Alpass, Towers and Stevenson2011) and physical health tends to decline (Dulin et al. Reference Dulin, Stephens, Alpass, Hill and Stevenson2011). Different measures of health used in ageing research show different rates of decline (Diehr et al. Reference Diehr, Thielke, Newman, Hirshe and Tracy2013). Combined with the survival effects of later life discussed previously, this means that associations between living standards and health in later life are multifaceted and require longitudinal analysis to separate cohort and ageing effects. Further detailed longitudinal analyses with this measure in the New Zealand longitudinal study of health, work and retirement will allow greater understanding of these relationships in the future.
The LSCAPE-24 was developed for those aged over 65 years (Breheny et al. Reference Breheny, Stephens, Alpass, Stevenson, Carter and Yeung2013). This validation study has assessed the use of the measure with those aged 50–87 years. Overall, those aged over 65 years reported significantly higher living standards than those aged under 65 years. Similarly, those in retirement had significantly higher living standards than those in employment. This accords with the tendency for self-reported material living standards of older people to increase with age (Fergusson et al. Reference Fergusson, Hong, Horwood, Jensen and Travers2001) and the comparatively low rates of financial strain reported by older people (Groffen et al. Reference Groffen, Bosma, van den Akker, Kempen and van Eijk2008). Examining the sub-scales, the strongest relationship was between the Security sub-scale and age, indicating that older people report more security about the future. Two possible explanations for this are, firstly, as the security items ask respondents to assess their resources for the future, the oldest people in the sample have less future to account for than the young-old. Consequently, more certainty could be related to less amount of time to account for in terms of sufficient economic resources to last the remainder of one's life. Secondly, mortality is consistently related to economic resources as the most materially deprived are less likely to survive to old age (Grundy and Sloggett Reference Grundy and Sloggett2003). As those with considerable material resources are more likely to survive to advanced older age, this explains the association between security and age in this sample, and may account for the association between age and the measure as a whole.
The New Zealand context
New Zealand has a universal superannuation scheme providing 93 per cent of New Zealanders over 65 years old with an after-tax income of approximately 66 per cent of the net average ordinary wage for couples, and 40 per cent of the net average ordinary wage for older single people (Commission for Financial Literacy and Retirement Income 2012). As the payment rates of NZ Superannuation depend on relationship status, this may go some way to explain the significantly higher living standards reported by those with a partner. Although 73 per cent of single people over 65 years and 86 per cent of older couples report receiving income from other sources such as private superannuation schemes, interest payments and returns on investments, for most people aged over 65 years additional income is modest. Over 40 per cent of the population aged 65 years or older is classified as having low income defined as less than 60 per cent of the median gross equivalised household income (Carter and Imlach Gunasekara Reference Carter and Imlach Gunasekara2012). Although universal superannuation lifts many older New Zealanders out of poverty, and provides a degree of financial and ontological security (Mansvelt, Breheny and Stephens Reference Mansvelt, Breheny and Stephens2013), evidence suggests that for many it is insufficient to support a healthy life (O'Sullivan and Ashton Reference O'Sullivan and Ashton2012). Although New Zealand's provision of universal superannuation is unusual internationally, widespread concerns regarding the affordability of this scheme (Hurley, Breheny and Tuffin Reference Hurley, Breheny and Tuffin2014) and the affordability of basic universal health care means that older New Zealanders face uncertainty regarding the sufficiency of their economic resources to last their lifetime and to meet unknown future needs for health and social care. Developed in this context, the LSCAPE-24 measure assesses variation in the ability to achieve valued functionings in later life that have broad relevance.
Assessing living standards in terms of the Capability Approach means that the items are broadly applicable. At present, the assessment of living standards using the consensual deprivation approach tends to enquire about the ownership of particular consumer goods, the possibilities for engaging in specific social occasions and subjective assessment of satisfaction with living standards, which differ across time and between places and groups. As the LSCAPE-24 measures living standards as the capability to achieve in a variety of domains important to social functioning, health and wellbeing, this measure is not tied to inevitably changing expectations for particular consumer goods or aspirations for certain sorts of luxury items. Such expectations are also likely to differ between ethnic and cultural groups. In this study, the LSCAPE-24 was tested on Māori and non-Māori samples and the factor structure was the same for both groups. There were associations between this measure of living standards and ethnicity, with Māori having significantly lower living standards than non-Māori, as would be expected. Socio-economic status is related to ethnicity in New Zealand, with poorer health and higher mortality among Māori (e.g. Blakely et al. Reference Blakely, Fawcett, Hunt and Wilson2006; Howden-Chapman et al. Reference Howden-Chapman, Blakely, Blaiklock and Kiro2000) and lower living standards among older Māori (Cunningham et al. Reference Cunningham, Durie, Fergusson, Fitzgerald, Hong, Horwood and Stevenson2002). Assessing relative access to a set of valued functionings removes the need for agreement regarding valued consumer goods, social activities and luxuries that people should aspire to (McKay Reference McKay2004). It also allows for differences in expectations across social and cultural groups, and differences in preferred means of achieving valued functionings across time, to be accommodated. By focusing on the capability to achieve a range of widely valued functionings, this approach to measuring living standards among older people will be sensible to older people in a range of places and economic situations. This does not preclude the further specification of the measure to meet the needs of different contexts as the context specificity of capabilities is recognised in the Capability Approach (Sen Reference Sen2004).
From a capability perspective, living standards are about command over physical, social and environmental goods, and the possibilities made available by these resources for an individual to achieve desired functionings. Rather than assessing what people have against a set of consensually derived items, this approach to assessing living standards asks what people can do. This has two advantages. Firstly, this simplifies the structure of the questions. Secondly, this removes the requirement of assessing whether one has things one should aspire to, which has been acknowledged to introduce a moral element of shame (Dominy and Kempson Reference Dominy and Kempson2006). Consequently, this approach sidesteps the debate regarding the role of preferences in the assessment of living standards (Hick Reference Hick2013). By assessing the variation in the ability that older people have to achieve their valued functionings, the difficulty regarding the need for people to feel deprived to count as deprived is avoided. By assessing what people are able to do, assessment of living standards moves further from notions of lack or deprivation towards a nuanced approach to the limitations in access to valued functionings that vary across the gradient from most to least deprived. In terms of Piachaud's (Reference Piachaud1981) critique on the rightful concern of living standards as reflecting restricted opportunity rather than restricted consumption, this measure assesses the opportunities that people have to select a standard of living, rather than concern with the patterns of consumption that they have chosen.
Acknowledgements
This study was funded by the New Zealand Foundation for Research Science and Technology, now the Ministry of Business Innovation and Employment. The research described in this paper was approved by the Massey University Human Ethics Committee.
Appendix:
The Living Standards Capability for Elders short form (LSCAPE-6) measure
Please indicate how true these statements are for you:
(Please circle the most appropriate number to the right of each statement)