Introduction
Taenia multiceps is a ubiquitous taeniid cestode that circulates in a 2-host life cycle including various canids as definitive hosts. A broad range of domestic and wild ungulates as well as non-ungulates (e.g. human) can serve as intermediate hosts and carry the larval stage ‘coenuri’ (Bondareva, Reference Bondareva1963; Abuladze, Reference Abuladze and Skrjabin1964). The dog–sheep/goat cycles appear to be the most important transmission dynamics (Varcasia et al., Reference Varcasia, Tamponi, Ahmed, Cappai, Porcu, Mehmood, Dessì and Scala2022). Stray and shepherd dogs as well as wild canids can acquire T. multiceps after feeding on the coenuri in dead sheep carcasses left on pasture of offal of slaughtered sheep on farms (Vasileiou et al., Reference Vasileiou, Fthenakis and Papadopoulos2015; Al-Riyami et al., Reference Al-Riyami, Ioannidou, Koehler, Hussain, Al-Rawahi, Giadinis, Lafi, Papadopoulos and Jabbar2016). The parasite resides in the small intestine of the definitive hosts, in which feces T. multiceps gravid proglottids and/or eggs are voided and contaminate the environment (Hoberg, Reference Hoberg2002). The intermediate hosts become infected after consuming food or water contaminated with the eggs that hatch in the intestine, and the oncospheres migrate via the bloodstream to all of the body. The oncospheres that reach the central nervous system (CNS) (1–3 weeks post infection) can continue development (Oryan et al., Reference Oryan, Akbari, Moazeni and Amrabadi2014). Around 6–8 months later, fully grown fluid-filled coenuri are formed (Varcasia et al., Reference Varcasia, Tamponi, Ahmed, Cappai, Porcu, Mehmood, Dessì and Scala2022). The coenuri can also be developed, particularly in goats, outside the CNS in various locations including intramuscular fascia, subcutaneous tissues, peritoneal cavity and various organs (Oryan et al., Reference Oryan, Akbari, Moazeni and Amrabadi2014).
A great debate has been raised whether CNS and non-CNS located coenuri belong to the same parasite species. Historically, Goeze (Reference Goeze1780) and Leske (Reference Leske1780) were the first to describe coenuri in the brains of sheep, and named the parasite as Coenurus cerebralis, the larval stage of the cestode Multiceps multiceps. A morphologically similar coenuri have been detected in subcutaneous tissues of goats and sheep and have been named as Coenurus gaigeri and Coenurus skrjabini, respectively (Hall, Reference Hall1916; Popov, Reference Popov1937). In her taxonomic revision, Verster (Reference Verster1969) has transferred the genus Multiceps to the genus Taenia and considered both Taenia gaigeri and Taenia skrjabini as synonyms for T. multiceps based upon their identical morphological characters. Later, several cross-transmission attempts have been conducted and results were controversial. While studies conducted on isolates from Iran have found no morphological or molecular differences between cerebral and non-cerebral coenuri (Oryan et al., Reference Oryan, Nazifi, Sharifiyazdi and Ahmadnia2010, Reference Oryan, Moazeni, Amrabadi, Akbari and Sharifiyazdi2015; Akbari et al., Reference Akbari, Moazeni, Oryan, Sharifiyazdi and Amrabadi2015; Amrabadi et al., Reference Amrabadi, Oryan, Moazeni, Sharifiyazdi and Akbari2015, Reference Amrabadi, Oryan, Moazeni, Shari-Fiyazdi and Akbari2019), Christodoulopoulos et al. (Reference Christodoulopoulos, Dinkel, Romig, Ebi, Mackenstedt and Loos-Frank2016), in an eminent study, observed distinct morphological differences in adult worms collected after feeding puppies 26 cerebral coenuri from sheep and goats in Greece as well as 26 non-cerebral coenuri from goats in some African and Asian countries. These differences, however, were not enough to typify 2 separate species. In addition, the collected coenuri were molecularly tested amplifying 3 genetic markers [nicotinamide adenine dinucleotide hydrogen subunit (nad1), cytochrome oxidase subunit I (cox1) and 12S rRNA], and the phylogenetic analysis displayed no monophyletic groups based on geographical origin, organ location in the intermediate host (cerebral or non-cerebral) or species of intermediate host (sheep or goat). The authors concluded that all variants of T. multiceps can cause cerebral coenurosis in sheep (which may be the ancestral phenotype), and some variants, predominantly from 1 genetic cluster, acquire the additional capacity to produce non-cerebral forms in goats and more rarely in sheep. Moreover, Varcasia et al. (Reference Varcasia, Jia, Yan, Manunta, Pipia, Garippa, Scala and Schuster2012) suggested a new genetic variant that is responsible for the aberrant locations of the coenuri outside the CNS. Noteworthy, some of these studies have utilized a few isolates, either cerebral or non-cerebral, from limited regions (particularly Iran) to establish the comparison. Therefore, a study that analyses all of the sequenced T. multiceps isolates from definitive and intermediate hosts worldwide would provide a clear picture about the molecular situation of both types of coenuri.
Taenia multiceps infections are usually symptomless in the definitive hosts, while can cause serious economic losses in the small ruminant industry due to the developing coenuri in CNS of infected animals. The disease in the intermediate hosts is referred to as coenurosis or gid, and has 2 clinical forms; acute and chronic. The acute form is caused by migration of the oncospheres through the CNS; the chronic gid appears in older sheep, as a consequence of cyst development (Scala et al., Reference Scala, Cancedda, Varcasia, Ligios, Garippa and Genchi2007). Between the 2 forms a quiescent phase is reported in which the parasite grows up into a cyst and sometimes the young metacestodes could be destroyed by the immune response with the complete recovery of the animal (Scala and Varcasia, Reference Scala and Varcasia2006). The chronic form is more common and constitutes a major contributor to the neurological disease of sheep. Scattered outbreaks of the disease have been reported worldwide (Ligios et al., Reference Ligios, Viglietti, Carta, Dexter, Simmons and Agrimi2004; Amer et al., Reference Amer, ElKhatam, Fukuda, Bakr, Zidan, Elsify, Mohamed, Tada and Nakai2017; Mohammadi et al., Reference Mohammadi, Zakian, Farjanikish, Yeganeh, Raisi and Samadipoor2021). In a survey on 114 sheep flocks in Greece, chronic coenurosis was the most frequently observed neurological disorder (45.7%); however, common neurological disorders (except pregnancy toxaemia) of the periparturient period have not been investigated (Polizopoulou et al., Reference Polizopoulou, Giadinis, Papahristou and Papaioannou2016). Recently, an outbreak of acute coenurosis has been reported from a flock of sheep in Sardinia, Italy (Pintus et al., Reference Pintus, Varcasia, Dessì, Tamponi, Manunta, Carboni, Cancedda, Ligios and Scala2018). Except for Australia, T. multiceps infections have been documented worldwide (Scala and Varcasia, Reference Scala and Varcasia2006). However, the published data are rather fragmentary and the link between the occurrence of the disease in definitive and intermediate hosts in most countries is missing, leaving a large gap in the epidemiology of this parasite and underlines the need for further analyses. Several narrative reviews that lack statistical analysis have been published to evaluate T. multiceps infections worldwide (Sharma and Chauhan, Reference Sharma and Chauhan2006; Oryan et al., Reference Oryan, Akbari, Moazeni and Amrabadi2014; Varcasia et al., Reference Varcasia, Tamponi, Ahmed, Cappai, Porcu, Mehmood, Dessì and Scala2022).
The present paper provides the first meta-analysis and comprehensive molecular analysis for the published data (including the sequenced isolates) on T. multiceps from various definitive and intermediate hosts worldwide, aiming at better understanding of the global epidemiology and population genetic structure of this ubiquitous taeniid.
Materials and methods
Searching strategy, eligibility criteria and data extraction
The databases PubMed, Scopus, Science Direct and Google Scholar were searched for published articles on T. multiceps. The following key terms were used in various combinations; T. multiceps, C. cerebralis, C. gaigeri, C. skrjabini, dog, sheep, goat, cattle and wild animals. The Boolean operators ‘OR’ and ‘AND’ were used to connect the entry terms. No limits on year, host, language or study type were considered during search. Articles on taxonomy, biology, diagnosis, pathogenicity, epidemiology, treatment and control of T. multiceps and the larval stage coenurus worldwide were assayed. The collected articles were screened for eligibility independently by 2 of the authors (E.E. and S.S.). Articles with disagreements were discussed with the first author (I.A.). Studies were considered eligible if they had found positive samples for adult or larval stage of T. multiceps. Studies that conducted further molecular analysis or experimental trials on the positive isolates were included. Reports published as case studies describing diagnosis, pathology or treatment of clinical coenurosis were also eligible. Studies that identified the taeniid present in dogs to the genus of Taenia, without to precise the presence of T. multiceps, were excluded. Article of non-original contributions, e.g. book chapters and seminars, were also excluded. A review on T. multiceps infections in humans has recently been published (Deplazes et al., Reference Deplazes, Eichenberger and Grimm2019); thus, reports addressing this topic were excluded from our analysis. The following data were extracted from the eligible studies by 2 of the authors (E.E. and S.S.): country/region, host species, sample size, number of positives, detection methods and coenuri locations. Furthermore, risk factors (e.g. age and sex) were extracted in cases where they were used (Supplementary Tables A–H). The retrieved data were organized in a Microsoft Excel® spreadsheet, and then used for further analyses.
Meta-analysis
The organized data in the Excel spreadsheets were used for the meta-analysis, employing the software Open Meta[Analyst] (Wallace et al., Reference Wallace, Dahabreh, Trikalinos, Lau, Trow and Schmid2012). All analyses were conducted based on a 95% confidence interval. Due to the high heterogeneity (>50% that estimated based on the I 2 statistic) between studies, the random-effects model coupled to the DerSimonian–Laird method were used to estimate T. multiceps prevalence, which is calculated as ‘pooled estimate’ in various definitive and intermediate hosts. Further subgroup analyses were conducted using the same model to detect variabilities in the regional and country-wise prevalences. In dogs, prevalence variation in relation to mode of life and the diagnostic method used was also estimated. Variations in coenuri locations and prevalence in various age groups and genders of sheep were also detected. Publication bias was not determined in the present study because it is not considered relevant for prevalence studies (Hunter et al., Reference Hunter, Saratzis, Sutton, Boucher, Sayers and Bown2014). The software GraphPad Prism version 6 (www.graphpad.com) was also used for the statistical analyses, and various models were employed to evaluate the significance of variations, e.g. the 1-way analysis of variance, Kruskal–Wallis test, Mann–Whitney U test, paired and unpaired t-test, Friedman test and Wilcoxon test. Results of the statistical analyses were considered significant when the P value was <0.05.
Molecular analysis
In March 2021, website of the National Center for Biotechnology Information (http://www.ncbi.nlm.nih.gov) was searched to retrieve partial nucleotide sequences of the mitochondrial gene cox1 of T. multiceps, which have been deposited in the GenBank from various countries. The following terms were used in various combinations: T. multiceps, C. cerebralis, C. gaigeri, C. skrjabini, sheep, goat, cattle, dogs and cox1. In addition, the published articles on molecular characterization of T. multiceps were investigated to match the cited accession numbers with the GenBank retrieved sequences. The collected sequences were aligned and trimmed from both ends using the ClustalW module of the software MEGA 6 (Tamura et al., Reference Tamura, Stecher, Peterson, Filipski and Kumar2013).
Phylogenetic analysis
Phylogenetic trees were constructed using the maximum likelihood analysis based on Hasegawa–Kishino–Yano (HKY) model in the software MEGA (6), which was also used to convert the sequences into Nexus format (Maddison et al., Reference Maddison, Swofford and Maddison1997). Minimum spanning model of the software PopArt 1.7 (Population Analysis with Reticulate Trees) was used to construct the haplotype trees for the aligned sequences in relation to countries of origin, animal species and the developmental stage (Leigh and Bryant, Reference Leigh and Bryant2015).
Population structure analysis
The retrieved sequences were grouped according to their country of origin and used for the population structure analysis. Various diversity, neutrality and fixation indices were calculated using the software DnaSP6 (Rozas et al., Reference Rozas, Ferrer-Mata, Sánchez-DelBarrio, Guirao-Rico, Librado, Ramos-Onsins and Sánchez-Gracia2017). Values of the following indices were calculated: numbers of segregating sites (S), haplotype number (h), haplotype diversity (Hd), nucleotide diversity (π), average number of pairwise nucleotide differences within population (K), Tajima's D (Tajima, Reference Tajima1989), Fu's Fs (Fu, Reference Fu1997), pairwise genetic difference (Fst), gene flow (Nm), average number of pairwise nucleotide differences (Kxy), nucleotide substitution per site (Dxy) and net nucleotide substitution per site (Da) between populations.
Results and discussion
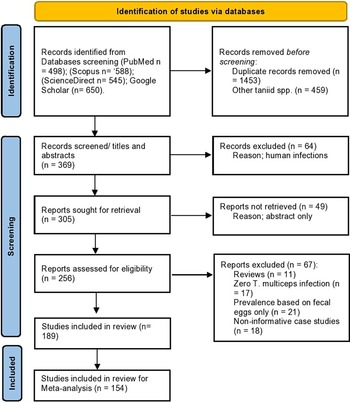
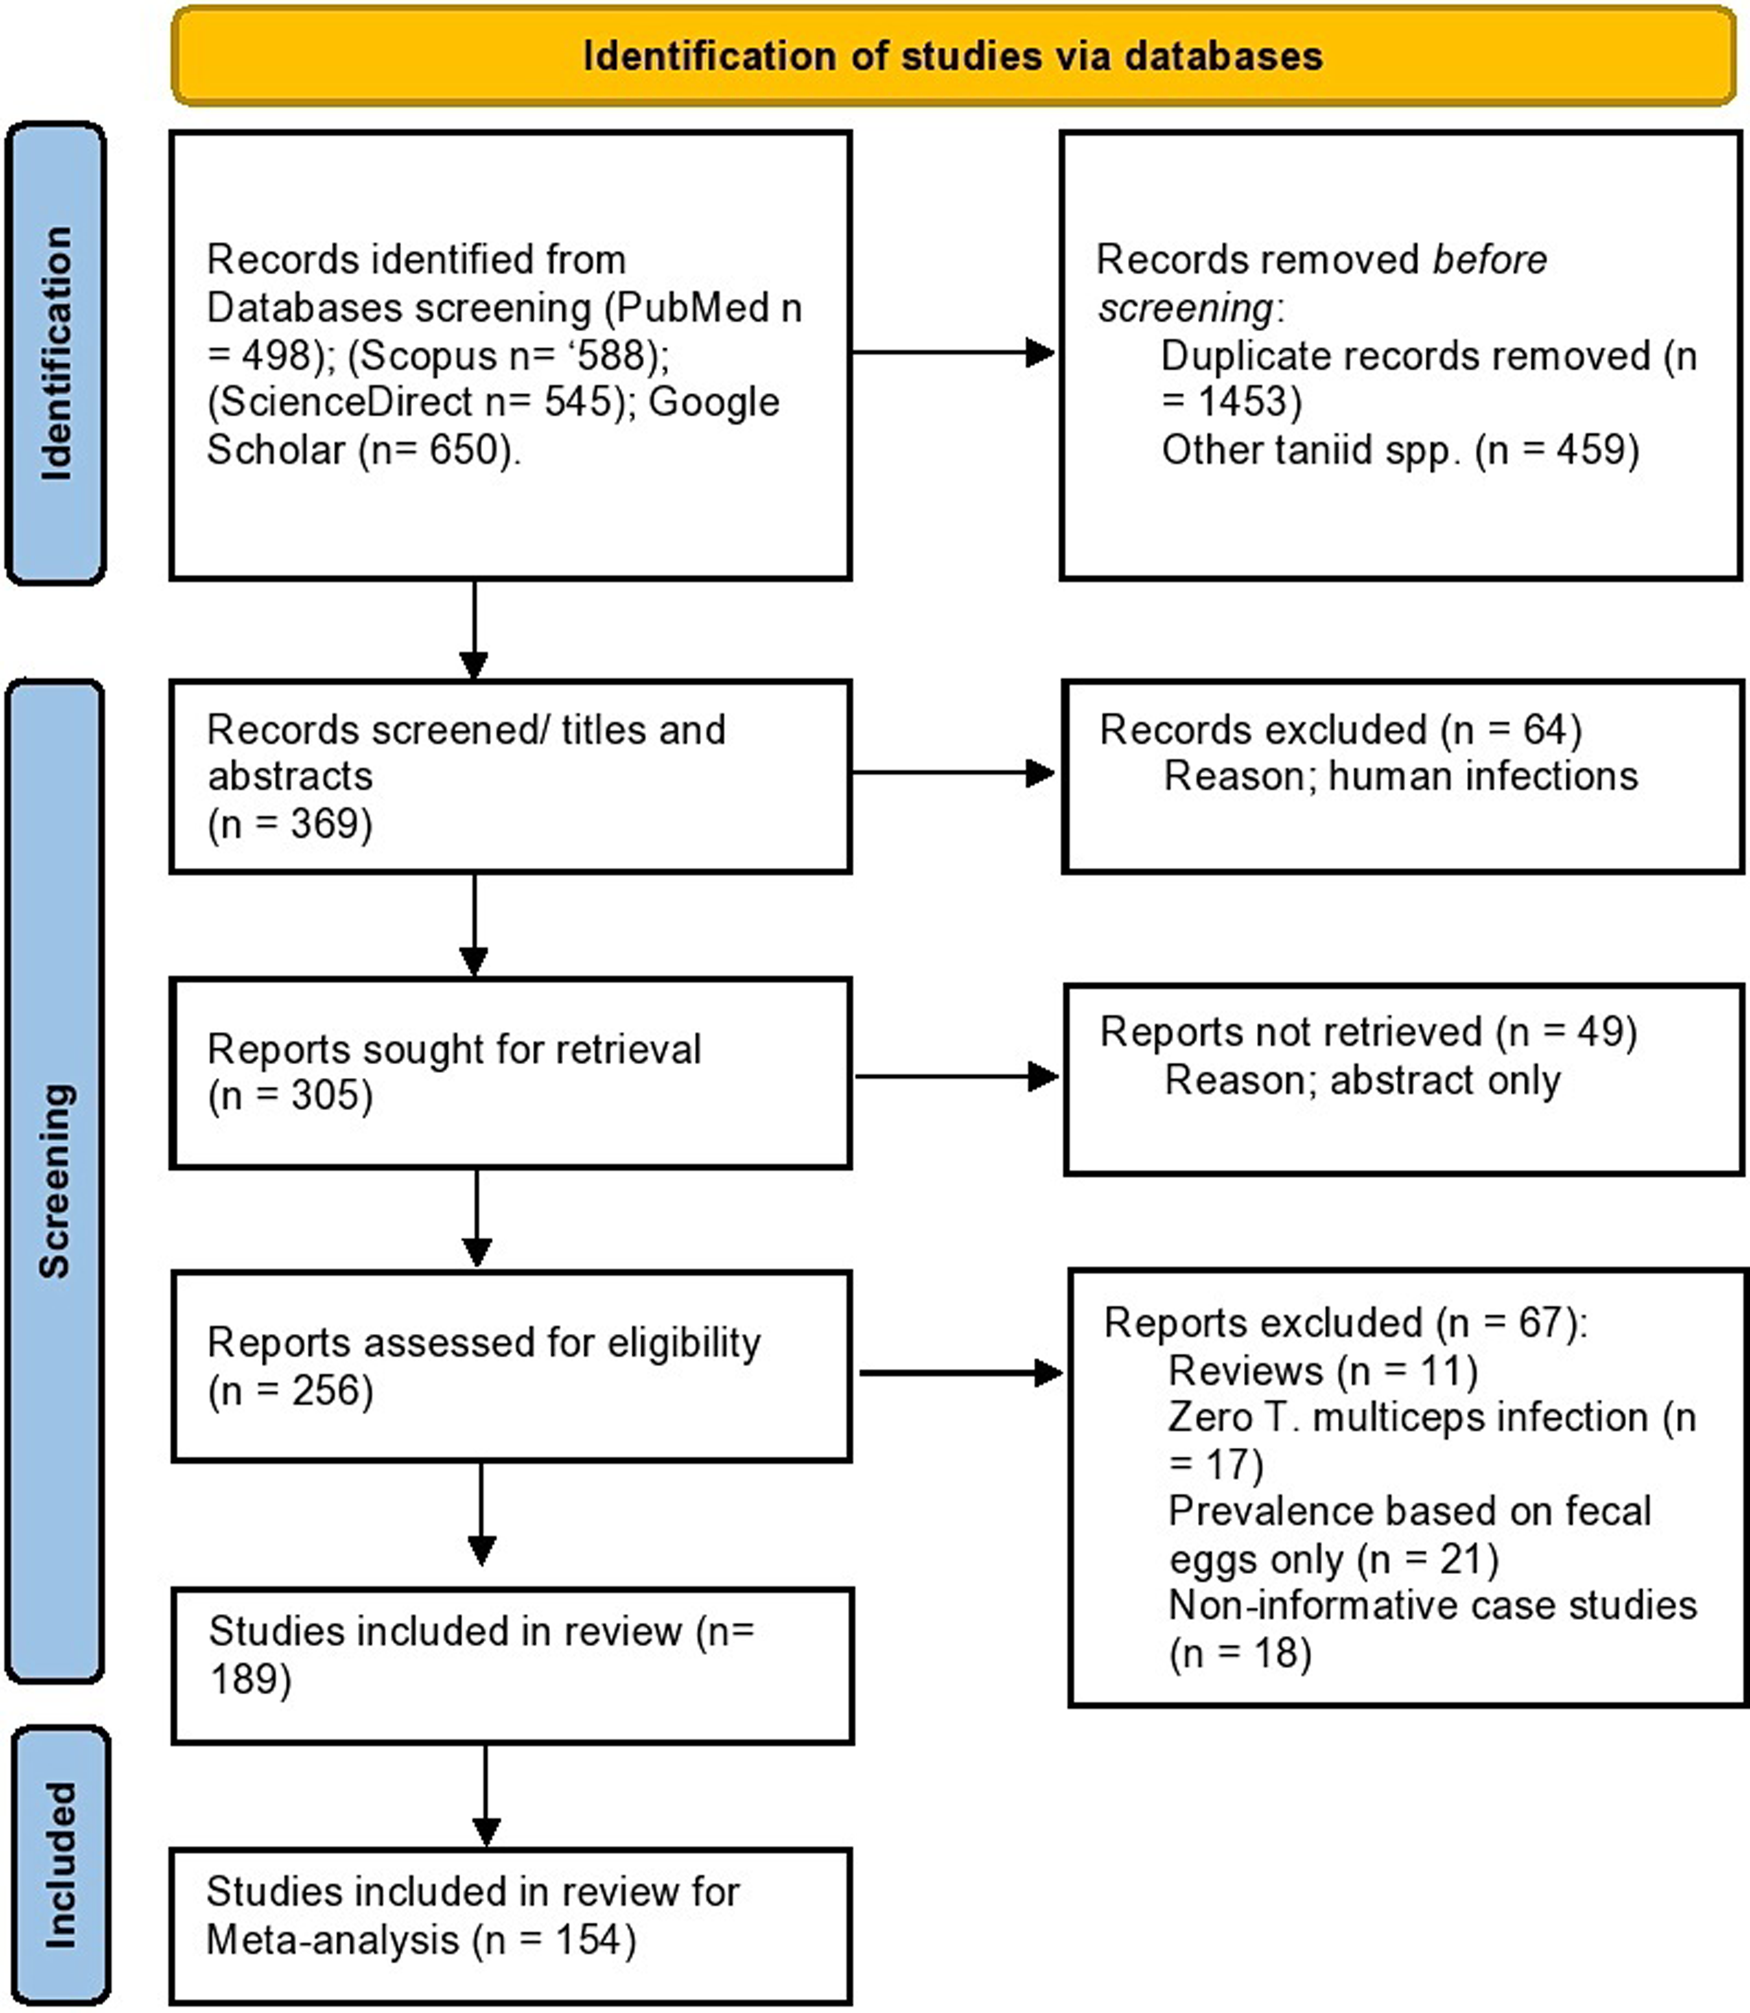
A total of 189 studies on various epidemiological and molecular aspects of T. multiceps in the definitive and intermediate hosts were used in the analyses conducted in the present study (Fig. 1). Seventy-four studies comprising 84 datasets from 32 countries have described the prevalence in various canids (dogs, foxes, wolves and jackals), whereas 80 studies comprising 171 datasets from 44 countries have determined the prevalence in sheep and goats. Data from a total of 397 189 animals consisting of 11 191 dogs, 2898 foxes, 1103 wolves, 718 golden jackals, 183 499 slaughtered sheep, 123 270 slaughtered goats, 55 340 live sheep and 19 170 live goats were included to estimate the global prevalence. Data from other intermediate hosts came from 12 studies on cattle and a study on each of yak, Nubian ibex, bison bull, sable antelopes and chinchilla; however, these limited data were not used in the meta-analyses (Supplementary Table H).
Flow diagram established according to PRISMA guidelines and displaying the search and selection methodology.
Moreover, a total of 233 partial cox1 nucleotide sequences for T. multiceps isolates were used in the molecular analyses conducted in the present study. These sequences represented 442 isolates from sheep (n = 297), goat (n = 109), cattle (n = 6), dog (n = 26), fox (n = 1), mouflon (n = 1) and yak (n = 1). In addition, the collected isolates belonged to various developmental stages of T. multiceps, either adult worms (n = 27) or coenuri (cerebral = 342; non-cerebral = 72). A single isolate that belonged to the Italian ovines has not been assigned to the animal species or developmental stage.
Epidemiology
Definitive hosts
Various canids can serve as natural definitive hosts for T. multiceps, with dogs being the main hosts, most likely due to the close relationship between dogs and human societies. Dogs are very beneficial to humans and kept for a variety of activities such as hunting, shepherding and guarding, which further explains the worldwide dissemination of dog-transmitted parasites. Shepherd and stray dogs appear to be the most important in T. multiceps transmission cycle due to their feeding habits. However, the role of pet dogs has not been determined yet, but is assumed to be very minimal. In several countries particularly in the Middle East, keeping dogs as pets is unpopular due to religious beliefs, yet stray dogs make up the majority of the dog population which favours T. multiceps circulation in those countries.
In total, 45 datasets describing T. multiceps infections in 11 191 dogs worldwide were revealed during our search, and 639 dogs have been found infected resulting in a pooled global prevalence of 5.8% (95% CI 4.7–6.9%). The prevalence and infection intensities of T. multiceps in dogs are in general lower than that of Taenia hydatigena (Wang et al., Reference Wang, Qiu, Zhao, Xu, Yu and Zhu2006; Abbas et al., Reference Abbas, El-Alfy, Janecek-Erfurth and Strube2021). Dogs can develop immunity and become refractory to T. multiceps infections after the second or the third reinfections (Willis and Herbert, Reference Willis and Herbert1984). On the contrary, no immunity is developed against multiple reinfections with T. hydatigena (Heath et al., Reference Heath, Parmeter and Osborn1980). Dogs from various geographical regions have been sampled; however, >75% of the published surveys have originated from Asia and Europe. Further investigations on dogs from the other regions worldwide are required. In addition, surveys from dogs in some coenurosis endemic areas (e.g. Sardinia Island, Italy) are scarce. On the contrary, 17 datasets from dogs in Iran were found and comprised more than one-third of the collected datasets worldwide, but represented only one-tenth (n = 1161) of the total numbers of sampled dogs (see Table 1). No significant variations were detected at the regional level. The highest prevalence (9.1%, 6.5–11.7%) was estimated for dogs in Asia followed by Europe (5.1%, 3.3–6.9%), Africa (4.2%, 2.9–7.5%) and the least was in dogs from the Americas (3.3%, 1.3–5.3%). No T. multiceps infections have been reported in dogs from Australia.
Worldwide prevalence of Taenia multiceps in dogs, and prevalence variation according to lifestyle of sampled dogs and the detection method

NA, not applicable.
Most surveys (n = 40) have relied on the morphological features of the adult worms collected after either dog necropsy or purgative dosing. A few reports (n = 5) have employed polymerase chain reaction (PCR)-sequencing protocols to detect T. multiceps eggs found in taeniid-infected fecal samples. The prevalence was higher (6.7%, 5.4–8.0%) based on adult morphology than on egg-PCR approach (2.2%, 0.8–3.6%), and the difference between the 2 detection methods was bordered on being statistically significant (P value = 0.0504), probably due to the fact that T. multiceps eggs are released from the gravid proglottids before they are excreted in feces. Willis and Herbert (Reference Willis and Herbert1984) noticed an extension of T. multiceps uterine branches to the anterior portion of the gravid proglottids, which can be subject to rupture when the gravid proglottids separate releasing large quantities of eggs that are excreted in dog feces. Moreover, the effect of dogs’ lifestyle on T. multiceps prevalence was investigated in the present study. Nearly equal number (~4700) of stray and herding dogs has been investigated in the included datasets in our analysis, and the prevalence was 2 times higher in stray (7.0%, 5.3–8.6%) than in herding (3.6%, 2.2–5.0%) dogs. Nevertheless, this variation was statistically insignificant (P value = 0.9682) indicating that not only stray dogs but also herding dogs are potential disease spreaders.
Various wild canids can be involved in the biology of T. multiceps suggesting transmission of this taeniid in sylvatic cycles. Nevertheless, the published reports have mostly focused on wild canids from the European region (Table 2). For example, 569 out of 718 golden jackals (Canis aureus) tested for T. multiceps have been originated from Europe, although golden jackals are distributed worldwide. Golden jackals displayed the closest (5.8%, 2.5–9.1%) T. multiceps prevalence to dogs. While these canids have an opportunistic nutritional behaviour (can feed on small mammals, birds, reptiles or even invertebrates), they can also take carrion whenever possible, which explains their infection with T. multiceps (Lange et al., Reference Lange, Lelieveld and De Knegt2021).
Worldwide prevalence of Taenia multiceps in red foxes, golden jackals and grey wolves

NA, not applicable.
Seventeen datasets have detected T. multiceps infections in foxes mostly Vulpes vulpes (the red fox), which according to our analysis had the least T. multiceps prevalence (2.7%, 1.5–3.9%) among various canids. This low prevalence could be explained by feeding habits of the foxes, which feed mostly on rodents (Hegglin et al., Reference Hegglin, Bontadina, Contesse, Gloor and Deplazes2007). In addition to the presumptive inability of foxes to access coenuri in sheep brain through the skull; however, some foxes have been observed accessing the skull contents through foramen magnum (Varcasia et al., Reference Varcasia, Tamponi, Tosciri, Pipia, Dore, Schuster, Kandil, Manunta and Scala2015). Given that the distribution of foxes has increased with human expansion and the competency of foxes as definitive hosts for T. multiceps, which have been evidenced by successful transmission experiments (Varcasia et al., Reference Varcasia, Tamponi, Tosciri, Pipia, Dore, Schuster, Kandil, Manunta and Scala2015), much more global investigations on T. multiceps infection in foxes are required.
Surprisingly, grey wolves (Canis lupus) had the statistically (P value = 0.0049) highest T. multiceps prevalence (21.6%, 15.7–27.5%) among all definitive hosts included in our analysis (Table 2). Wolves usually attack sheep herds (Kaartinen et al., Reference Kaartinen, Luoto and Kojola2009) and can easily access sheep brains using their large and very strong teeth which are able to destroy the skull bones. From another perspective, wolves can hunt various ungulates (e.g. deer, wild boar, elk, moose and bison) in the wild. Therefore, high T. multiceps infection in wolves could be suggestive for the wide dispersal of coenurosis among the wild ungulates and underlines T. multiceps sylvatic cycle. Similar to wolves, a single report has stated high (~45%) T. multiceps infections in 34 coyotes (Canis latrans) caught in Texas, USA in a 2-year survey from 1990 to 1991 (Henke et al., Reference Henke, Pence and Bryant2002).
Intermediate hosts
Many domestic and wild ungulates can serve as intermediate hosts for T. multiceps; however, sheep and goats are the most frequently infected, most likely due to the close association with dogs. Infections are manifested by development of the coenuri in many tissues, but predominantly in the CNS. The resulting disease is known as ‘coenurosis’, and can be also termed ‘gid, stagger or sturdy’ referring to the neurological symptoms. Coenurosis can be silent in its early stage depending on the number of the migrating oncospheres, and development of the neurological symptoms is relevant to the increase in coenuri size. The disease is quite common worldwide. Many studies have been published as case reports and were not used in the meta-analysis conducted in the present study (Supplementary Table F). The included studies have determined T. multiceps prevalence in small ruminants through the macroscopic detection of the coenuri in brains either of (1) slaughtered animals in slaughterhouses or (2) dead and moribund animals with neurological symptoms, and each method has its own shortcomings.
Although slaughterhouse surveys can detect coenuri in brains of animals with silent infections, these surveys are not appropriate for large-scale studies because of the difficulties facing veterinary inspectors to open adequate number of skulls of slaughtered animals. In addition, data on animals with neurological signs are frequently missed because these animals are not often sent to the slaughterhouses. Thirty datasets have found T. multiceps coenuri in 1682 out of 25 920 sheep brains examined at slaughterhouses in regions where the parasite occurs, and the estimated pooled prevalence was 8.8% (95% CI 7.3–10.3%). These datasets came from the Old World: Africa (n = 14 datasets), Asia (n = 9) and Europe (n = 7), and no datasets from the Americas were available. Notably, the majority of sampled sheep (3586/3967) in the Africa came from Ethiopia and slaughtered at various Ethiopian slaughterhouses for exporting (Table 3). At the regional level, no significant variations (P value = 0.5161) were detected, but sheep in Europe displayed the highest (18.4%, 14.0–22.8%) prevalence, which could be related to the high prevalence in wild canids (e.g. wolves) from Europe (Table 2). On the other hand, few datasets (n = 14) from goats were available, and 8998 goat brains have been examined which represented around one-fourth of the examined sheep brains. The pooled prevalence of cerebral coenurosis in goats was 5.8% (95% CI 4.0–7.6%) and also no significant regional variations (P value = 0.1738) were detected. This prevalence did not significantly differ (P value = 0.5660) from that of sheep, assuming that both animal species are similarly susceptible to cerebral coenurosis (Table 3).
Prevalence of Taenia multiceps coenuri in sheep and goats worldwide based upon slaughterhouse surveys

NA, not applicable.
On the other hand, detection of cerebral coenurosis based on post-mortem examination of clinically sick animals with neurological symptoms allows for examination of large numbers and is suitable to diagnose chronic infections. Various sheep flocks have been investigated worldwide, but mostly from countries in Africa and Asia, which illustrates the endemicity of cerebral coenurosis in the 2 regions (Table 4). The pooled prevalence of cerebral coenurosis cases detected employing this approach was 4.1% (3.2–5.0%), which is lower than that detected in sheep from slaughterhouse surveys (8.8%, 7.3–10.3%), but not significantly different (P value = 0.0760). In addition, the prevalence of sheep with chronic coenurosis in neurologically sick animals has been evaluated in 10 datasets from 6 countries (Table 5). Unfortunately, the other neurological disorders (e.g. listeriosis, scrapie, pregnancy toxaemia and copper intoxication) have been investigated in a few studies. For example, Polizopoulou et al. (Reference Polizopoulou, Giadinis, Papahristou and Papaioannou2016) noticed that coenurosis was the most frequently detected pathology in 93 brains of neurologically diseased sheep from Greece. On the contrary, Ligios et al. (Reference Ligios, Viglietti, Carta, Dexter, Simmons and Agrimi2004) found coenuri in 6.2% (11/178) of neurologically sick sheep from Italy, whereas scrapie was detected in 57 (32.0%) sheep. Overall, out of 1147 sheep that displayed neurological symptoms, cerebral coenuri were found in 437 animals resulting in a high prevalence rate (52.9%, 27.4–78.4%), which underlines the substantial role played by coenurosis as a contributor in the neurological disease of sheep. However, it appears that this contribution varies among regions and can be affected by the regional occurrence of the other aetiological agents. Moreover, only 2 datasets were available for goats diagnosed based on clinically sick animals, and the pooled prevalence was 9.4% (4.7–23.5%), which was also insignificantly different (P value = 8167) from that of goats detected in slaughterhouse surveys (5.8%, 4.0–7.6%). In general, variabilities in the number of datasets and sample size of examined animals per country, which are evidenced by the high heterogeneity (>90%) detected in our analysis, could play a role in the variance of the overall and regional prevalence of cerebral coenuri estimated for sheep and goats employing both types of surveys.
Prevalence of Taenia multiceps cerebral coenuri in sheep and goats based on the clinical cases which are confirmed by post-mortem examination

NA, not applicable; NS, not stated.
Prevalence of Taenia multiceps coenuri in brains of sheep with neurological disease worldwide

NS, not stated.
Detection of the non-cerebral coenurosis is much easier than brain coenurosis, as indicated by the number of the examined carcasses revealed from the published datasets that came mostly from Asia (Table 3). In sheep, very few datasets (n = 4) were available and all came from Asia, and the pooled prevalence based on 95% CI was almost nil (0.0%; 0.0–0.1%). Likewise, goats also had a very low prevalence of non-cerebral coenuri (0.3%, 0.2–0.4%), which was insignificantly different (P value = 0. 0731) from that of sheep. Noteworthy, there were significant differences in the prevalence of cerebral and non-cerebral coenurosis in either sheep (P value ≤ 0.0011) or goats (P value = 0.0124), indicating that cerebral coenurosis is the most dominant form in both animal species.
Many factors can affect the prevalence of coenurosis in sheep such as animal age, sex and breed, in addition to some ecological factors, e.g. season, management practices and presence of dogs in or around sheep farms (Sharma and Chauhan, Reference Sharma and Chauhan2006; Godara et al., Reference Godara, Katoch, Yadav, Khajuria and Borkataki2011a; Varcasia et al., Reference Varcasia, Tamponi, Ahmed, Cappai, Porcu, Mehmood, Dessì and Scala2022). Few reports describing these factors were available and most of these reports were inconclusive and were not used in our analysis. For example, only 5 reports have described the seasonal variations in the prevalence of cerebral coenurosis in sheep; 3 of them have determined the prevalence in few months representing 1 or 2 seasons at most. Thus, the seasonality impact remains a hot topic and requires further investigations. In addition, many studies have analysed their data based on various specific age groups (e.g. <6 months, 6 months–1 year, 1–2, 1–3, 2–3, 2–5, >2, >3 and >5 years). To resolve this variation, 3 age groups were assigned for our analysis: <1, 1–3 and >3 years. Nine datasets were identified as suitable for analysis, and the age group 1–3 years was the most represented and displayed the highest prevalence (23.1%, 11.8–34.4%). The prevalence in animals aged <1 year was low (8.5%, 4.8–12.1%), which might be attributed to the prolonged time required for cyst development. However, variations among the studied age groups were insignificant (P value = 0.8135) and are shown in Table 6. Similarly, analysis of 13 datasets to detect the prevalence based on gender variation in sheep revealed no significant difference (P value = 0.6355). Notably, the total number of examined female sheep was 10 times higher than that of males, which displayed the highest prevalence (12.8%, 9.2–16.4%; Table 6).
Prevalence of Taenia multiceps cerebral coenuri in different age groups and genders of sheep and goats

Pathogenicity and predilection sites of the coenuri
Cerebral coenurosis can be manifested in 2 clinical forms: acute and chronic. The acute disease occurs mostly in lambs 2–6 months old and less often in yearling ewes (Scala et al., Reference Scala, Cancedda, Varcasia, Ligios, Garippa and Genchi2007); however, an outbreak of acute coenurosis has been recently reported together in lambs <1 month old and adult ewes in a flock in Italy (Pintus et al., Reference Pintus, Varcasia, Dessì, Tamponi, Manunta, Carboni, Cancedda, Ligios and Scala2018). Acute coenurosis is caused by the migrating oncospheres in the CNS tissues few weeks post infection, resulting in thickening and congestion of the meningeal membrane with focal to multifocal necrotic regions in the cortex of the cerebrum and cerebellum (i.e. multifocal pyo-granulomatous meningo-encephalitis). Grossly, multiple linear reddish-yellow foci of necrotic inflammation are observed and immature coenuri 2–4 mm in diameter can sometimes be seen (Edwards and Herbert, Reference Edwards and Herbert1982; Pintus et al., Reference Pintus, Varcasia, Dessì, Tamponi, Manunta, Carboni, Cancedda, Ligios and Scala2018). The severity of lesions depends largely on the infection dose and animal age, i.e. young animals that ingest large number of T. multiceps eggs display severe lesions (Edwards and Herbert, Reference Edwards and Herbert1982). Infected animals suffer usually from transient pyrexia, listlessness, aversion of the head, convulsions and sometimes death within 4–5 days (Giadinis et al., Reference Giadinis, Psychas, Polizopoulou, Papadopoulos, Papaioannou, Komnenou, Thomas, Petridou, Kritsepi-Konstantinou, Lafi and Brellou2012; Evangelisti et al., Reference Evangelisti, Deiana, Melosu, Burrai, Ballocco, Varcasia, Scala and Manunta2018). Transient retinal haemorrhage can also be evidenced (Edwards and Herbert, Reference Edwards and Herbert1982).
In some cases, animals pass after the acute infection through a quiescent phase during which the coenuri maturation takes place and may last for 1–10 months depending on the rate of the coenuri growth that can be described as fast in the first 100 days, then become reduced (Edwards and Herbert, Reference Edwards and Herbert1982). However, the immature coenuri may eventually die leaving small caseous lesions in the brain tissue (Edwards and Herbert, Reference Edwards and Herbert1982). The chronic form can start as early as 53 days post infection and lasts up to 42 days, and frequently detected in animals aged 9–18 months (Edwards and Herbert, Reference Edwards and Herbert1982; Scott, Reference Scott2012). The mature coenuri act as space occupying lesions resulting in increased intra-cranial pressure which could be evidenced by papilloedema (Edwards and Herbert, Reference Edwards and Herbert1982). Histologically, the coenuri cause pressure atrophy in the brain tissue with non-purulent meningoencephalitis and perivascular cuffing (Ozmen et al., Reference Ozmen, Sahinduran, Haligur and Sezer2005). The clinical signs are related to the size (large-sized coenuri can produce more severe lesions) and location of the coenuri in the brain (Edwards and Herbert, Reference Edwards and Herbert1982). Depression, head tilting either to the right or left and head pressing are frequently observed when the coenuri inhabit the right or left cerebral hemispheres. If the coenuri are located in the cerebellum, then incoordination and hyperexcitability are usually seen. Hind leg paralysis is evidenced when the coenuri are located in the spinal cord (Ozmen et al., Reference Ozmen, Sahinduran, Haligur and Sezer2005). Correlation between the signs and the location of the coenuri becomes difficult in case of multiple infections (Edwards and Herbert, Reference Edwards and Herbert1982) and these latter are reported to be 30% of cerebral coenurosis cases in a recent review from Sardinia (Varcasia et al., Reference Varcasia, Tamponi, Ahmed, Cappai, Porcu, Mehmood, Dessì and Scala2022).
Therefore, analysis of the variabilities in locations and numbers of the developed coenuri is important to understand the pathophysiology of cerebral coenurosis (Table 7). Significant differences (P value ≤ 0.0001) were determined among various locations of the coenuri either in sheep or goats. In both animal species, the coenuri were mostly located in the cerebrum with a frequency rate of 95.7% (94.1–97.4%) in sheep and 90.1% (86.2–93.9%) in goats, probably because of the higher biomass of cerebrum in comparison to the other CNS parts (Scala et al., Reference Scala, Cancedda, Varcasia, Ligios, Garippa and Genchi2007). Within the cerebral cortex, the coenuri were distributed in similar frequencies with no significant differences between the right or left cerebral hemispheres either in sheep (P value = 0.8868) or in goats (P value = 0.0818). The coenuri were also detected in the cerebellum and in the median fissure, but at very low rates (Table 7). Occasionally, the coenuri have been observed in medulla oblongata, occipital region and in the spinal cord, and very few cases have been diagnosed with orbital coenurosis in sheep and goats (see Supplementary Tables E–G). In addition, significant variations (P value ≤ 0.0001) in the occurrence of single or multiple coenuri in brains of infected animals were also determined. The occurrence of a single coenurus was the most common in sheep (69.3%, 59.3–79.4%) and goats (64.6%, 53.3–76.0%). Two coenuri were observed in the brains of 17.2% (11.0–23.3%) of sheep and 19.6% (6.0–33.3%) of goats. Three coenuri were found in 6.2% (3.9–8.4%) of sheep and 10.2% (4.8–15.6%) of goats. Brains with more than 3 coenuri were the least detected; 2.2% (1.0–3.5%) in sheep and 2.7% (0.2–5.6%) in goats.
Variabilities in locations and numbers of Taenia multiceps cerebral coenuri in infected sheep and goats

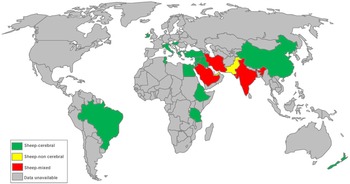
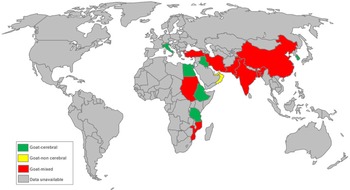
Moreover, extra-CNS locations of the coenuri have been reported frequently in goats and rarely in sheep (Figs 2 and 3). In goats, the coenuri have been observed in the subcutaneous tissues, skeletal muscles (e.g. the thigh, biceps, forelimb muscles, tongue, diaphragm, intercoastal muscles and muscles of the head, neck, thorax and abdomen) and in various organs including the heart, liver, kidneys and lungs (Kheirandish et al., Reference Kheirandish, Sami, Azizi and Mirzaei2012; Schuster et al., Reference Schuster, Sivakumar, Wieckowsky and Reiczigel2015). However, very few goats had both cerebral and non-cerebral coenuri (Godara et al., Reference Godara, Borah, Sharma and Jangir2011b; Kheirandish et al., Reference Kheirandish, Sami, Azizi and Mirzaei2012; Sikandar et al., Reference Sikandar, Adil, Zaneb, Arshad, Ali and Khan2018). In sheep, the coenuri have been detected in the muscles, omentum and the heart (Christodoulopoulos et al., Reference Christodoulopoulos, Kassab and Theodoropoulos2013; Oryan et al., Reference Oryan, Akbari, Moazeni and Amrabadi2014). No specific clinical signs can be observed during mild or moderate non-cerebral coenurosis and the coenuri can only be observed during veterinary inspection of the slaughtered animals. In severe cases, outgrowing skin lumps as well as lameness, paresis and paralysis are common clinical signs (Oryan et al., Reference Oryan, Akbari, Moazeni and Amrabadi2014). A rare case of cardiac insufficiency resulted from severe systemic infection with T. multiceps coenuri has been recently reported in a goat from India (Gururaj et al., Reference Gururaj, Pawaiya, Gangwar, Mishra, Singh, Andani, Paul, Sharma, Shivasharanappa, Rahal, Chaturvedi, Kumar and Sharma2019).
World geographical distribution of cerebral and non-cerebral coenurosis in sheep.

World geographical distribution of cerebral and non-cerebral coenurosis in goats.

Taenia multiceps infections in other intermediate hosts
Sporadic cases of cerebral coenurosis have been reported in cattle from few countries, particularly those located in Europe (Supplementary Table H). The recorded cases mostly had neurological symptoms and have been diagnosed following post-mortem examination of their brains. Unfortunately, no prevalence-based studies have been conducted, except the study of Avcioglu et al. (Reference Avcioglu, Yildirim, Duzlu, Inci, Terim and Balkaya2011). The authors examined 1045 cattle brains in Erzurum province, Turkey. Five brains (0.5%) were found infected, and the coenuri were distributed in the cerebellum (n = 1), right cerebral hemisphere (n = 2) and left cerebral hemisphere (n = 2). Interestingly, an outbreak of clinical coenurosis has been reported in a cattle farm of 20 animals in Kars province, Turkey. Four animals complained of incoordination, circling, unilateral blindness and opisthotonos. During necropsy, the coenuri have been observed in the right and left cerebral hemispheres (Gökçe et al., Reference Gökçe, Beytut, Tașcİ, Uzlu, Kİrmİzİgül and Erdoğan2013). It appears that T. multiceps infections in cattle are underestimated and require further studies.
In addition, T. multiceps coenuri have been detected in the brains of various wild ungulates (e.g. yak, ibex, bison and sable antelopes) including many cases that displayed neurological symptoms. For example, clinical coenurosis have been diagnosed in 2 European mouflon from Hungary (Murai and Sugár, Reference Murai and Sugár1979). These infections constitute a strong evidence for the sylvatic transmission of T. multiceps.
Molecular characterization of T. multiceps isolates and the validity of variant strains
Traditionally, identification of various taeniids to the species level has relied mostly on morphological characteristics of adult worms as well as some ecological and biological aspects such as the host specificity (Hoberg et al., Reference Hoberg, Jones, Rausch, Eom and Gardner2000, Reference Hoberg, Alkire, Queiroz and Jones2001; Hoberg, Reference Hoberg2006; Lavikainen et al., Reference Lavikainen, Haukisalmi, Lehtinen, Henttonen, Oksanen and Meri2008). Molecular features, on the other hand, are more realistic in terms of understanding the biodiversity of various taeniids (Lymbery, Reference Lymbery2017). Mitochondrial genes are popular markers for characterization of different Taenia species due to their relatively fast rate of evolution, conserved nature, limited recombination and maternal transfer (Gasser et al., Reference Gasser, Zhu and McManus1999; Kilinc et al., Reference Kilinc, Celik, Kesik and Simsek2020). The mitochondrial cox1 has been widely used to study the molecular characters of T. multiceps. However, nad1 and 12S rRNA genes display more interspecific nucleotide variations than cox1 (Gasser et al., Reference Gasser, Zhu and McManus1999; Varcasia et al., Reference Varcasia, Lightowlers, Cattoli, Cancedda, Canu, Garippa and Scala2006; Rostami et al., Reference Rostami, Salavati, Beech, Sharbatkhori, Babaei, Saedi and Harandi2013a), but have been used in fewer studies (Supplementary Table I). Recently, sequence analysis of the ITS gene fragments showed higher nucleotide variations in comparison to the cox1 and 12S rRNA (Amer et al., Reference Amer, ElKhatam, Fukuda, Bakr, Zidan, Elsify, Mohamed, Tada and Nakai2017; Tan et al., Reference Tan, Wang, Zheng, Zhang, Huang and Liu2018).
Genetic diversity of T. multiceps isolates has been studied for the first time in 2006 by Varcasia et al. who used a PCR amplification-sequencing protocol employing the cox1 and nad1 genes to examine 40 T. multiceps isolates from sheep (37 cerebral coenuri) and dogs (3 adult worms) in Sardinia, Italy. The existence of 3 genetic variants (Tm1, Tm2 and Tm3) has been proposed, and the predominance of Tm1 lineage has been stated and then confirmed in isolates from sheep, goats, cattle, mouflon and foxes from Sardinia and Sassari (Varcasia et al., Reference Varcasia, Tamponi, Tosciri, Pipia, Dore, Schuster, Kandil, Manunta and Scala2015, Reference Varcasia, Pipia, Dessì, Zidda, Tamponi, Pau, Scala and Boufana2016). While isolates of the Italian cattle have been assigned as the classical Tm1 and Tm2 common in Italy (Varcasia et al., Reference Varcasia, Pipia, Arru, Pes, Tamponi, Dore, Garippa and Scala2013, Reference Varcasia, Pipia, Dessì, Zidda, Tamponi, Pau, Scala and Boufana2016), isolates from Turkish cattle displayed 3 distinct genetic variants not detected in other hosts from Turkey (Avcioglu et al., Reference Avcioglu, Yildirim, Duzlu, Inci, Terim and Balkaya2011), which opens the gate for occurrence of genetic variants in a specific animal species from a certain geographical region. In addition, a genetic variant responsible for aberrant locations of the coenuri outside the CNS in goats from United Arab Emirates has also been proposed (Varcasia et al., Reference Varcasia, Jia, Yan, Manunta, Pipia, Garippa, Scala and Schuster2012). On the contrary, many reports worldwide agreed on the absence of T. multiceps monophyletic groups based on the geographical origin or species of the host (Supplementary Table I). This debate underlines the need for a comprehensive molecular analysis for T. multiceps isolates (cerebral, non-cerebral and adult worms) from different hosts in various countries. A partial example for this analysis has been recently published (Kilinc et al., Reference Kilinc, Celik, Kesik and Simsek2020). The authors have examined 102 GenBank-retrieved partial cox1 nucleotide sequences of T. multiceps isolates from sheep. Twenty haplotypes, including 3 common ones, and multiple nucleotide mutations have been detected. In addition, high genetic differences have been observed between Turkish and Egyptian isolates.
In the present study, we have analysed 233 partial cox1 nucleotide sequences for T. multiceps isolates that have been submitted to GenBank from various countries. Analysis of the aligned sections (337 bp in length) revealed 59-point mutations, of which 28 were parsimony informative with a nucleotide diversity (π) of 0.00915 ± 0.00032 s.d. The average number of nucleotide differences (k) was found to be 3.07503. Fifty-one haplotypes were detected with a haplotype diversity of 0.859 ± 0.00009 s.d. The combination of low nucleotide and high haplotype diversity could indicate a rapid population expansion from small effective population size (Sharma et al., Reference Sharma, Fomda, Mazta, Sehgal, Singh and Malla2013). The population expansion was also statistically tested via estimation of the neutrality indices Tajima's D and Fu's F tests, which are based on distribution of pairwise differences between nucleotide sequences within populations. The calculated values (−1.90106 and −35.055) for both tests, respectively, were significantly negative, and are suggestive for the recent population expansion. All the collected nucleotide sequences and their relevant developmental stages, animal species, countries of origin and detected haplotypes are listed in Supplementary Table J.
In total, 6 geographic populations (China, Iran, Turkey, Greece, Italy and Egypt) were defined suitable for population analyses conducted in the present study. Mongolian isolates were included in the Chinese population, but isolates from Saudi Arabia, Emirates, Somalia and India were excluded due to their very limited numbers. Data on number of isolates, haplotype diversity and nucleotide diversity indices in each population are given in Table 8. Interpopulation nucleotide differences (Kxy) and average number of nucleotide substitutions per site between the 6 populations (Dxy) ranged from 1.45347 and 0.00433 (China and Iran) to 5.87847 and 0.0175 (Turkey and Egypt), respectively (Table 9).
Diversity indices of various populations of Taenia multiceps calculated from cox1 partial nucleotide sequences

N, number of sequences examined; S, number of segregating (polymorphic/variable) sites; K, average number of pairwise nucleotide differences; H, number of haplotypes; Hd, haplotype diversity; π, nucleotide diversity.
Genetic indices between different populations of Taenia multiceps calculated from cox1 partial nucleotide sequences

Fst, Wright's F-statistics for pairwise genetic distance; Gst, genetic differentiation index based on the frequency of haplotypes; Nm, gene flow value; Kxy, average proportion of nucleotide differences between populations; Dxy, average number of nucleotide substitutions per site between populations; Da, number of net nucleotide substitutions per site between populations.
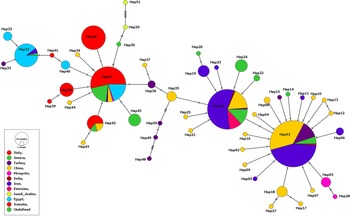
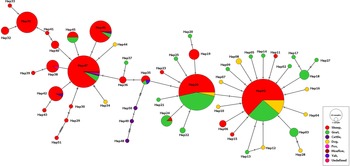
Five major haplotypes were observed; Hap01 and Hap26 were the most common and involved 116 and 86 isolates, respectively. From these 2 haplotypes, some minor haplotypes including 1–8 isolates were evolved. Hap01, Hap26 and their adjoining minor haplotypes circulate in Iran, China, Mongolia and Turkey; however, some Greek as well as very few Italian isolates were included. On the contrary, the third major haplotype (Hap47), which comprised 67 isolates and gave rise to the fourth major haplotype (Hap46) as well as some minor haplotypes, circulates primarily in Italy, Greece and Egypt, and rarely in China, Iran, Mongolia and Turkey. Notably, 48 Egyptian sheep isolates comprised 4 haplotypes containing 4–26 isolates; Hap31 (the fifth major haplotype), Hap32, Hap40 and Hap47 with the former 3 were mostly detected in Egypt (Fig. 4). This pattern of haplotype distribution could be related to some factors that probably include the geographical neighbourship. For example, Turkey and Iran share the borders and have many historical and cultural relations. The majority of Turkish isolates fall into Hap01 which also includes many Iranian isolates. However, haplotypes from Greece do not follow this assumption and circulate worldwide, which is unexplained but probably due to the unique geographic location of Greece which is located at the crossroads of Europe, Asia and Africa. In addition, the ancient Greek empire conquered much of the Old World from Eastern Mediterranean to India (https://en.wikipedia.org/wiki/Greece), and the haplotypes are assumed to have been transmitted from and to Greece through human and animal movement during this period. The calculated pairwise distance (Fst) and gene flow (Nm) values for the Greek population in comparison to the other populations were comparable and varied from 0.19 and 1.92 to 0.43 and 4.11, respectively (Table 9), which underlines the global distribution of the Greek haplotypes. The highest Fst values were estimated for Iran in comparison to Egypt and to Italy (0.77 for each) indicating very high genetic differences, which resulted in very low gene flow values; Iran to Egypt (Nm = 1.01) and Iran to Italy (Nm = 0.97). On the contrary, the lowest Fst value (0.02) was estimated for Chinese population in comparison to Turkish population, and the gene flow value was interestingly very high (22.3), which indicates the genetic similarity between the 2 populations. Overall, the average estimated Fst value was 0.44, which indicates high genetic differentiation among various T. multiceps isolates and could be attributed to the fact that a single oncosphere develops into a coenurus cyst containing several hundreds of identical scoleces, and then each scolex can produce an adult worm producing millions of eggs derived from the main source. Thus, a single mutant oncosphere can produce a large number of mutant individuals potentially capable of generating new genetic variants (Avcioglu et al., Reference Avcioglu, Yildirim, Duzlu, Inci, Terim and Balkaya2011; Rostami et al., Reference Rostami, Beech, Salavati, Baneshi, Kamyabi and Harandi2013b).
Haplotype network established based upon cox1 partial nucleotide sections of T. multiceps isolates worldwide. The network describes distribution of the revealed haplotypes (Hap1−51) in relation to the country of origin, which is indicated by different colours. Circle size is consistent with the haplotype frequency. Number of mutations distinguishing the haplotypes is shown by hatch marks.

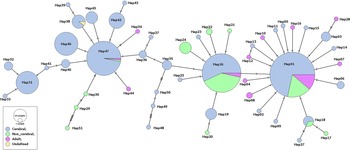
Moreover, the haplotype networks revealed no specific patterns for distribution of the detected haplotypes among various infected hosts, and underline the genetic analogy between the cerebral and non-cerebral coenuri isolates. In detail, isolates of adult worms from dogs, and cerebral and non-cerebral coenuri from sheep and goats were intermingled in the 2 most common haplotypes (Hap01 and Hap26) and their adjoining haplotypes (Figs 5 and 6). However, the combination Hap31, Hap46 and Hap47, which is commonly found in Italy, Greece and Egypt, formed mostly from cerebral isolates of sheep, which could be attributed to the limited number of sequenced goat isolates and to the absence of the non-cerebral isolates from these countries. Noteworthy, interpopulation comparison between the cerebral and non-cerebral T. multiceps isolates yielded a lower pairwise genetic distance (Fst value = 0.21462) and a higher gene flow (Nm value = 9.08), indicating that the genetic differences between the 2 populations are restricted. However, analysis of several isolates comprising the 2 forms from various regions using the ITS-1 that displayed higher nucleotide variations than cox1 would justify the existence of genotype–phenotype relationships. Several cross-transmission attempts have been conducted to determine the analogy/difference between cerebral and non-cerebral T. multiceps coenuri in sheep and goats, and all have found no distinct morphological differences between the 2 coenuri types; however, a genetic variant that has the affinity to produce non-cerebral coenuri has been detected (see Supplementary Text). Our epidemiological findings indicate that sheep and goats are highly susceptible to cerebral than to non-cerebral coenurosis with the latter being more common in goats than sheep, but no clear explanation for this difference has yet been published.
Haplotype network established based upon cox1 partial nucleotide sections of T. multiceps isolates worldwide. The network describes distribution of the revealed haplotypes (Hap1−51) in relation to the host species, which is indicated by different colours. Circle size is consistent with the haplotype frequency. Number of mutations distinguishing the haplotypes is shown by hatch marks.

Haplotype network established based upon cox1 partial nucleotide sections of T. multiceps isolates worldwide. The network describes distribution of the revealed haplotypes (Hap1−51) in relation to coenuri locations (cerebral and non-cerebral), which is indicated by different colours. Circle size is consistent with the haplotype frequency. Number of mutations distinguishing the haplotypes is shown by hatch marks.

In addition, wildlife shared the same haplotypes with sheep and goats. For example, fox and mouflon isolates from Italy were included in Hap47 common in this country, and the Chinese yak isolate was included in Hap35 detected in sheep and goats from China. For cattle, the Italian isolates comprised 3 haplotypes (Hap42, Hap46 and Hap47) common in sheep from Italy; however, 3 variant singleton haplotypes (Hap48, Hap49 and Hap50) were observed in cattle from Turkey and it appears that they represent a genetic variant. Likewise, data inferred from Figs 4–6 suggest the existence of a genetic variant (Hap51) in non-cerebral sheep isolates from Saudi Arabia.
On the other hand, the initial phylogenetic analysis illustrated clustering of all isolates in 2 clades with a minor clade containing only 3 isolates (HM143882, HM143884 and HM143886) that belonged to Turkish cattle. The second clade (major clade) contained all the residual isolates and was further separated into 3 subclades. The first included all the non-cerebral isolates, but 2 that were clustered in the second subclade. The cerebral isolates were evenly distributed in the first and second subclades, other than the third one which consisted of 4 cerebral isolates from sheep and yak in China. After that, 2 non-cerebral isolates (MZ346598 and MZ348363) that belonged to sheep from Saudi Arabia and submitted to GenBank on 10 June 2021 were collected. When the phylogenetic tree was re-constructed using all the collected isolates including those from Saudi Arabia, a few modifications were observed (Supplementary Fig. S1). The most important modification was the clustering of 3 non-cerebral sheep isolates (including 2 Saudi isolates) in the minor clade instead of the Turkish cattle isolates that moved to the first subclade in the major clade but in a separate branch. Overall, the phylogenetic and haplotype analyses highlight the presence of genetic variants in T. multiceps, but due to the limited number of sequenced isolates of these variants, the relationship of these variants to a specific phenotypic character (e.g. non-cerebral locations of the coenuri) cannot be confirmed.
Conclusion
The present study provides a meta-analysis for epidemiology of T. multiceps infections in animals worldwide. Scattered surveys have been published mostly from areas where the disease occurs. The pooled estimates for T. multiceps prevalence in the definitive hosts (various canids) ranged from 2.7 to 21.6%. Dogs (key hosts) had a 5.8% prevalence, and there is a lack in surveys on dogs from some endemic areas (e.g. Sardinia, Italy). For the intermediate hosts, reports focused mostly on sheep, which had a higher prevalence (8.8%) of cerebral coenuri than goats (5.8%). Interestingly, this difference was statistically insignificant suggesting the similar susceptibility of both animal species to cerebral coenurosis. However, a possible bias in the epidemiology of T. multiceps in intermediate hosts is linked to the fact that few epidemiological studies have been conducted giving the complexity of the disease. Most of epidemiological studies list the coenurus cases without linking them to a population. Moreover, animals with coenurus usually are not slaughtered at abattoirs in many countries, but in farms. In abattoirs, only healthy sheep and goats are slaughtered and the skulls are not regularly opened to find the coenuri. Therefore, a real epidemiological study should be carried out in all the sheep and goat populations less than 2 years old looking how many sheep are affected, and should also include fecal samples from dogs. These studies should be conducted at a large scale in areas where T. multiceps situation could be described as endemic. Further investigations from non-endemic areas (e.g. the Americas) are also required. Various molecular analyses for 233 partial cox1 sections for T. multiceps were conducted and displayed high genetic differences as well as interpopulation variabilities. Taenia multiceps variants can be suggested; nonetheless, cerebral and non-cerebral coenuri isolates were genetically similar. We do recommend sequencing of much more isolates from goats particularly in areas where non-cerebral coenurosis has not been reported (e.g. Europe).
Supplementary material
The supplementary material for this article can be found at https://doi.org/10.1017/S0031182022001123.
Data availability
The authors confirm that the data supporting the findings of this study are available within the article (and/or its supplementary materials).
Author's contributions
IA and EE: conceptualization. EE and SS: papers collection, testing for eligibility and data extraction. IA: data analysis. IA and EE: drafted the manuscript. IA, EE, CT and AV: manuscript revisions and editions.
Financial support
None.
Conflict of interest
None.
Ethical standards
Not applicable.