Introduction
Ventricular septal defects are the most common congenital cardiac malformations, accounting for nearly half of all CHDs. The reported incidence of ventricular septal defect ranges from 5 to 50 per 1,000 live births. Reference Penny and Vick1,Reference Hoffman and Kaplan2 Haemodynamically significant left-to-right shunting in ventricular septal defects may lead to chronic volume overload, ventricular dilation, and pulmonary hypertension, all of which can influence myocardial electrical properties.
Alterations in ventricular depolarisation, reflected by electrocardiographic parameters such as QRS duration, QT and corrected QT (QTc) intervals, QT dispersion, and Tp-e–related indices, have been associated with myocardial stress and electrical remodelling in various CHD. Reference Fumanelli, Garibaldi and Castaldi3–Reference Ece5 In left-to-right shunt lesions, chronic pressure and volume overload may increase electrical heterogeneity and contribute to impaired ventricular electrical stability. Reference Khalilian, Ziaratban, Alizadeh, Norouzi and Shirvani6,Reference Deaconu, Deaconu and Marascu7
Previous studies in left-to-right shunt lesions, particularly atrial septal defects and patent ductus arteriosus have demontrated improvements in ventricular repolarization indices following closure, suggesting favourable electrical remodelling likely reflecting the relief of pulmonary hypertension and ventricular volume overload. Reference Khalilian, Ziaratban, Alizadeh, Norouzi and Shirvani6,Reference Yıldız, Kır and Armağan8–Reference Temple12 However, data regarding ventricular electrical remodelling in children with isolated ventricular septal defects remain limited. Although surgical and transcatheter techniques for ventricular septal defect closure are well established, there remains a lack of studies that systematically examine ventricular depolarisation and repolarization parameters before and after ventricular septal defects closure, as well as limited comparative data between closure methods. Reference Uchida, Nishio and Omeki13 Moreover, the extent to which electrical alterations reverse after haemodynamic correction has not been fully clarified. Therefore, this study aimed to evaluate ventricular depolarisation and repolarisation parameters as markers of electrical remodelling in children with isolated ventricular septal defects before and after closure and to compare the effects of surgical and transcatheter closure methods using standard electrocardiographic measurements.
Methods
Study population and ethical approval
This retrospective, single-centre study included children aged 4–18 months who were diagnosed with isolated ventricular septal defect and underwent either surgical or transcatheter ventricular septal defect closure between September 2021 and August 2023 at Ankara Bilkent City Hospital. Patient data were retrieved from electronic medical records.
The study was conducted in compliance with the Declaration of Helsinki and was approved by the Turkish Ministry of Health and Human Ethics Committee of Ankara Bilkent City Hospital (decision number: TABED2-25-975). Owing to the retrospective design, the requirement for informed consent for data analysis was waived by the ethics committee. Written informed consent had been obtained from parents or legal guardians before all interventional and surgical procedures.
Of 84 initially eligible patients, 26 were excluded. The final study cohort included 58 patients who fulfilled all inclusion criteria. A control group of 40 age- and sex-matched healthy children with normal echocardiographic findings, and no known systemic or cardiac disease was also included.
Inclusion and exclusion criteria
Inclusion criteria were (1) isolated ventricular septal defect, (2) age between 4 and 18 months, and (3) completion of either surgical or transcatheter ventricular septal defect closure with available pre- and post-procedural electrocardiograms.
Exclusion criteria comprised conditions known to influence ventricular depolarisation or repolarization, including use of antiarrhythmic medications, beta-blockers, or calcium channel blockers; electrolyte disturbances; metabolic or endocrine disorders; congenital or acquired conduction abnormalities (complete bundle branch block or atrioventricular block); Eisenmenger syndrome; genetic syndromes; prior cardiac surgery; associated complex CHD; postoperative hemodynamically significant residual ventricular septal defect; and incomplete electrocardiographic data (n = 26, Figure 1).
Flow chart of the study population.

Electrocardiographic acquisition and analysis
Standard 12-lead electrocardiograms were obtained at a paper speed of 25 mm/s and an amplitude of 10 mm/mV with patients in the supine position. Baseline electrocardiograms were recorded before ventricular septal defect closure, and follow-up electrocardiograms were obtained at least six months after the procedure during routine outpatient visits.
All electrocardiograms were analysed retrospectively by a single experienced paediatric cardiologist who was blinded to the clinical data and closure method. Measurements were performed manually using high-resolution digital images of electrocardiogram images using Adobe Photoshop CS2 software as a digital calliper tool. Each electrocardiogram parameter was measured three times, and the mean value was used for statistical analysis. Standardised measurement criteria and consistent lead selection were applied throughout the study to minimise measurement variability.
Electrocardiographic parameters
QRS duration: Determined as the maximum QRS duration in any lead, measured from the beginning to the end of the QRS complex crossing the isoelectric line. It is a well-defined parameter of ventricular depolarisation. QT interval and corrected QT interval (QTc): This interval is measured from the onset of the QRS complex to the end of the T-wave. U-waves following the T-wave were excluded from the measurement. QTc is calculated via Bazett’s formula (QTc = QT/√RR). QT Dispersion and QTc Dispersion (QTcd): Defined as the difference between the maximum and minimum QT and QTc durations, respectively. Tp-e Interval: Measured from the peak of the T-wave to its end, defined as the intersection of the isoelectric line with the tangent to the downslope of the T-wave in the precordial leads. The Tp-e duration was calculated by measuring the distance between these points on the isoelectric line. Tp-e Dispersion (Tp-ed): Calculated as the difference between the maximum and minimum Tp-e intervals in the precordial leads. Tp-e/QT and Tp-e/QTc ratios: Determined based on the Tp-e interval and QT and QTc interval measurements. JT and JTc interval: The JT interval represents the time from the end of depolarisation (end of the QRS complex) to the end of ventricular repolarisation (end of the T wave) on an ECG. The corrected JT interval (JTc) adjusts the JT interval for heart rate, similar to the correction for the QT interval with Bazett’s formula (JTc =JT/√RR). JT and JTc dispersion: JT dispersion refers to the difference between the maximum and minimum JT intervals measured across multiple leads of an ECG. The corrected JT dispersion is the rate-adjusted difference between the maximum and minimum JTc intervals across ECG leads. Reference Gupta, Patel and Patel14–Reference Bazoukis, Yeung and Wui Hang Ho16
Transthoracic echocardiography
The size of the ventricular septal defect was determined via apical four-chamber and parasternal long-axis view measurements obtained via transthoracic echocardiography. Mean pulmonary artery pressure was estimated from pulmonary regurgitation, and the pulmonary artery systolic pressure was estimated from tricuspid regurgitation.
Statistical analyses
The statistical data were analysed via the Statistical Package for Social Sciences version 26 (IBM Corp., Chicago, IL, USA). Normality of continuous variables was assessed using the Kolmogorov–Smirnov and Shapiro–Wilk tests. Continuous variables are presented as mean ± standard deviation, and categorical variables as frequencies and percentages. Between-group comparisons were conducted using Student’s t-test or one-way analysis of variance, with Tukey’s post hoc test applied where appropriate. Within-group pre- and post-procedural comparisons were performed using repeated-measures one-way analysis of variance. Categorical variables were compared using the Pearson chi-square test. Pearson or Spearman correlation analysis was performed to evaluate the relationship between echocardiographic ventricular septal defect diameter, electrocardiogram repolarisation and dispersion parameters before and after closure. Correlation coefficients (ρ or r) and corresponding p values were calculated. Given the exploratory retrospective design and the limited sample size, no formal a priori power calculation was not performed. A post hoc power analysis was performed using G*Power version 3.1 (Heinrich Heine University, Düsseldorf, Germany). Assuming a two-tailed independent-samples t-test, an alpha level of 0.05, and 80% power, the available sample size (25 patients in the transcatheter group and 33 patients in the surgical group) was sufficient to detect an effect size (Cohen’s d) of 0.756.
No adjustment for multiple comparisons was applied; therefore, results should be interpreted cautiously and considered hypothesis-generating. A p-value < 0.05 was considered statistically significant.
Technical procedure
All patients in the transcatheter closure group underwent closure via the Lifetech™ Konar multifunctional occluder. Surgical closure was performed under general anaesthesia with median sternotomy and right atriotomy. Dacron or autologous pericardial patches were used. No ventriculotomy was performed.
Results
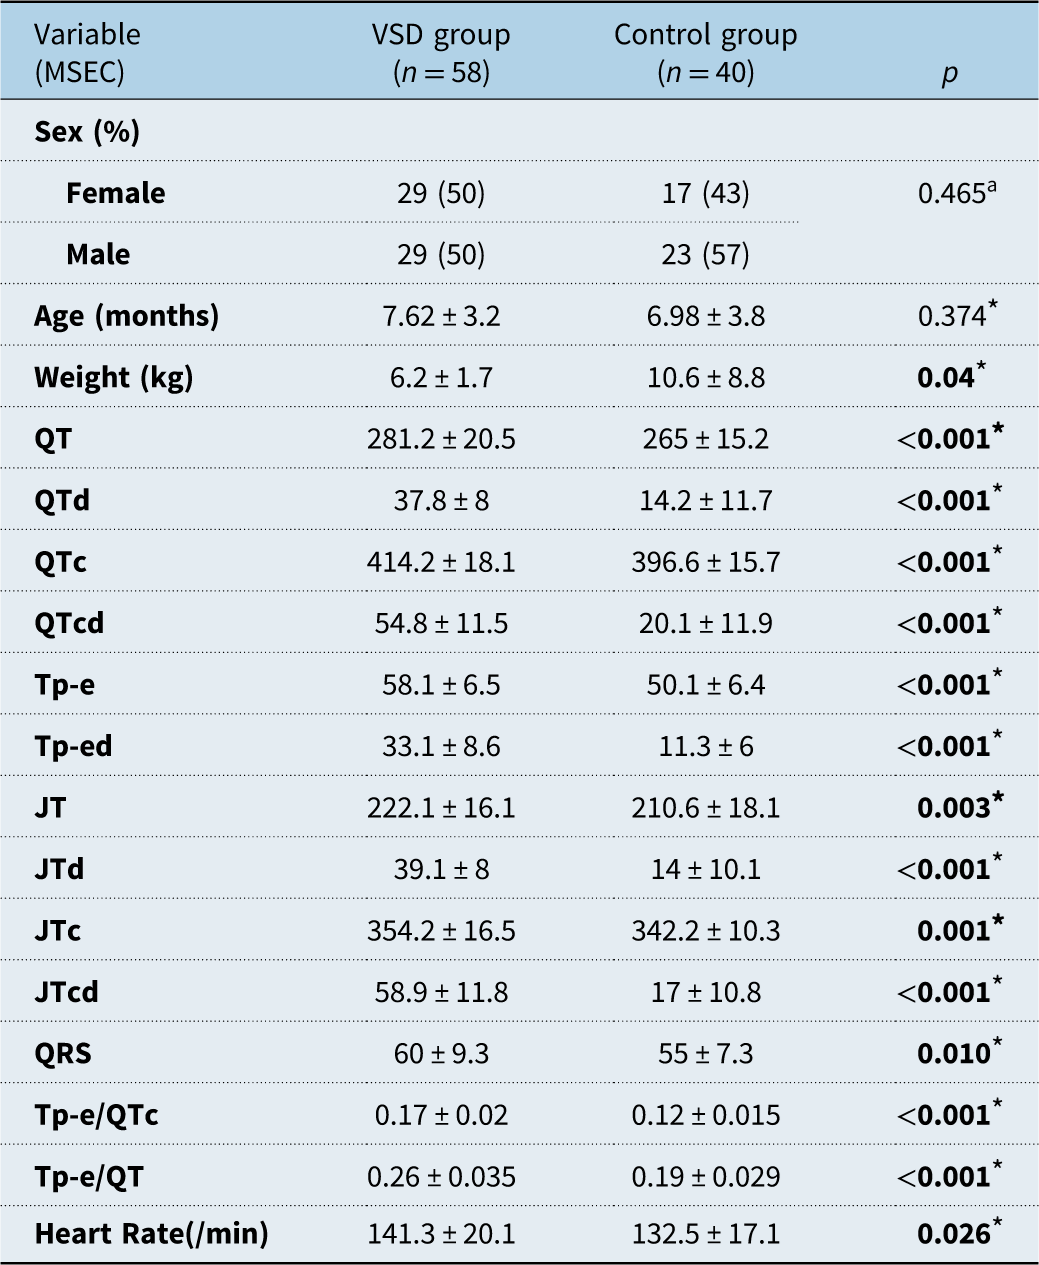
A total of 58 children who underwent ventricular septal defect closure and 40 healthy controls were included in the analysis. The patient and control groups were comparable with respect to age and sex (p > 0.05). Body weight was significantly lower in the ventricular septal defect group than in the controls (Table 1).
Demographic features and baseline electrocardiographic findings of the patient and control groups

Table 1. Long description
The table presents a comparison of demographic features and baseline electrocardiographic findings between a ventricular septal defect (VSD) group of 58 children and a control group of 40 healthy individuals. The table has 18 rows and 4 columns. Column headers are Variable (MSEC), VSD group (n = 58), Control group (n = 40), and p. Row labels include Sex (%), Age (months), Weight (kg), QT, QTd, QTc, QTcd, Tp-e, Tp-ed, JT, JTd, JTc, JTcd, QRS, Tp-e/QTc, Tp-e/QT, and Heart Rate (/min). Each row provides specific values for the VSD group, Control group, and p-value. Notable trends include significant differences in weight, QT, QTd, QTc, QTcd, Tp-e, Tp-ed, JT, JTd, JTc, JTcd, QRS, Tp-e/QTc, Tp-e/QT, and Heart Rate between the two groups, as indicated by p-values less than 0.05.
Values in bold indicate statistically significant differences (p < 0.05).
* Student’s t test (expressed as the mean±standard deviation).
a Pearson chi-square test.
VSD = ventricular septal defect, QTd = QT interval dispersion, QTc = corrected QT interval, QTcd = QTc dispersion, Tp-e = T-peak-to-end, Tp-ed = Tp-e dispersion, JTd = JT interval dispersion, JTcd = corrected JT interval dispersion.
ECG parameters are expressed in milliseconds unless otherwise stated.
Baseline characteristics and echocardiographic findings
According to the Anderson classification, in the transcatheter closure group, 19 out of 25 patients (76%) had perimembranous ventricular septal defects, 2 out of 25 (8%) had midmuscular ventricular septal defects, and 4 out of 25 (16%) had muscular outlet ventricular septal defects. Reference Soto, Becker, Moulaert, Lie and Anderson17,Reference Lopez, Houyel and Colan18 In the surgical closure group, 28 out of 33 patients (84%) had perimembranous ventricular septal defects, 1 out of 33 (3%) had midmuscular ventricular septal defects, and 4 out of 33 (12%) had muscular outlet ventricular septal defects.
The mean ventricular septal defect diameter was significantly smaller in the transcatheter group than in surgical group (p < 0.05). The mean pulmonary artery pressure and pulmonary artery systolic pressure did not differ significantly between the transcatheter and surgical closure groups (Table 2).
Baseline demographic, echocardiographic, and pre-procedural electrocardiographic characteristics of the transcatheter and surgical groups

Table 2. Long description
A table comparing baseline characteristics of transcatheter and surgical groups. The table has 25 rows and 7 columns. Column headers are: Sex (percent), Age (months), Weight (kg), L V E D D (mm), R V E D D (mm), L V E F (percent), L V F S (percent), V S D diameter (mm), m P A P (mmHg), P A S P (mmHg), Pre-procedural E C G parameters, Q T, Q T d, Q T c, Q T c d, T p-e, T p-e d, J T, J T d, J T c, J T c d, Q R S, T p-e/Q T c, T p-e/Q T. Row 1: Sex (percent), Female (Transcatheter: 11 (44 percent), Surgical: 18 (54.5 percent)), Male (Transcatheter: 14 (56 percent), Surgical: 15 (45.5 percent)). Row 2: Age (months), Transcatheter: 7.84 ± 2.98, Surgical: 7.46 ± 3.34. Row 3: Weight (kg), Transcatheter: 6.48 ± 1.22, Surgical: 6.04 ± 2.12. Row 4: L V E D D (mm), Transcatheter: 26.04 ± 2.75, Surgical: 27.24 ± 3.08. Row 5: R V E D D (mm), Transcatheter: 20.24 ± 1.96, Surgical: 20.70 ± 2.58. Row 6: L V E F (percent), Transcatheter: 72.72 ± 2.51, Surgical: 74.42 ± 4.12. Row 7: L V F S (percent), Transcatheter: 40.88 ± 2.07, Surgical: 42.24 ± 4.06. Row 8: V S D diameter (mm), Transcatheter: 4.93 ± 1.20, Surgical: 7.00 ± 1.92. Row 9: m P A P (mmHg), Transcatheter: 31.04 ± 11.12, Surgical: 32.09 ± 11.65. Row 10: P A S P (mmHg), Transcatheter: 52.96 ± 15.39, Surgical: 55.84 ± 14.54. Row 11: Q T, Transcatheter: 283.00 ± 23.54, Surgical: 279.88 ± 18.23. Row 12: Q T d, Transcatheter: 39.20 ± 8.62, Surgical: 36.84 ± 7.51. Row 13: Q T c, Transcatheter: 410.40 ± 19.59, Surgical: 417.15 ± 16.67. Row 14: Q T c d, Transcatheter: 54.08 ± 12.68, Surgical: 55.36 ± 10.72. Row 15: T p-e, Transcatheter: 58.00 ± 6.69, Surgical: 57.75 ± 6.51. Row 16: T p-e d, Transcatheter: 35.20 ± 6.53, Surgical: 31.51 ± 9.72. Row 17: J T, Transcatheter: 222.80 ± 17.04, Surgical: 220.57 ± 15.76. Row 18: J T d, Transcatheter: 38.68 ± 6.58, Surgical: 39.42 ± 9.14. Row 19: J T c, Transcatheter: 349.40 ± 15.96, Surgical: 357.12 ± 16.23. Row 20: J T c d, Transcatheter: 57.60 ± 10.07, Surgical: 59.93 ± 13.09. Row 21: Q R S, Transcatheter: 60.92 ± 10.66, Surgical: 59.30 ± 8.39. Row 22: T p-e/Q T c, Transcatheter: 0.18 ± 0.02, Surgical: 0.17 ± 0.02. Row 23: T p-e/Q T, Transcatheter: 0.26 ± 0.03, Surgical: 0.25 ± 0.03.
Values in bold indicate statistically significant differences (p < 0.05).
Abbreviations as noted in Table 1 and LVEDD = left ventricular end-diastolic diameter; RVEDD = right ventricular end-diastolic diameter; LVEF = left ventricular ejection fraction; LVFS = left ventricular fractional shortening; mPAP = mean pulmonary artery pressure; PASP = pulmonary artery systolic pressure.
a Pearson chi-square test, *Independent samples t-test (expressed as the mean±standard deviation).
VSD diameter was measured by transthoracic echocardiography. mPAP was estimated from pulmonary regurgitation jet. PASP was estimated from tricuspid regurgitation jet.
Pre-procedural electrocardiographic findings
Before ventricular septal defect closure, patients demonstrated significantly prolonged ventricular depolarisation and repolarisation parameters compared with healthy controls (all p < 0.05) (Table 1). However, baseline electrocardiographic findings did not differ significantly between the transcatheter and surgical groups (p > 0.05) (Table 2).
Changes in electrocardiographic parameters after ventricular septal defect closure
In the transcatheter closure group, significant improvements were observed in all ventricular depolarisation and repolarisation parameters at six-month follow-up compared with baseline (all p < 0.05) (Table 3). In the surgical group, most repolarisation parameters also improved after closure. However, QT interval and QT dispersion did not differ significantly from baseline values, whereas all other repolarisation indices demonstrated significant reductions (Table 3).
Changes in ventricular depolarisation and repolarization parameters before and after closure

Table 3. Long description
The table compares ventricular depolarisation and repolarization parameters before and after closure in transcatheter and surgical groups. It has 16 rows and 8 columns. The columns are labeled as follows: Variable (MSEC), Transcatheter group (n = 25) Pre-Procedure, Transcatheter group (n = 25) Post-Procedure, p, Surgical group (n = 33) Pre-Procedure, Surgical group (n = 33) Post-Procedure, and p. The rows are labeled with different variables such as QT, QTd, QTc, QTcd, Tp-e, Tp-ed, JT, JTd, JTc, JTcd, QRS, Tp-e/QTc, and Tp-e/QT. Each row provides values for the transcatheter group pre-procedure and post-procedure, the corresponding p-value, and values for the surgical group pre-procedure and post-procedure, along with the corresponding p-value. Notable trends include significant improvements in all ventricular depolarisation and repolarisation parameters at six-month follow-up in the transcatheter group compared with baseline. In the surgical group, most repolarisation parameters also improved after closure, but QT interval and QT dispersion did not differ significantly from baseline values.
Values in bold indicate statistically significant differences (p < 0.05).
Abbreviations as noted in Table 1.
* Paired-samples t test. Data are presented as mean ± standard deviation. All values are given in milliseconds unless otherwise indicated.
QRS duration increased significantly after the procedure in both transcatheter and surgical groups (p < 0.05). At follow-up, 16 patients had a QRS duration ≥80 ms. A complete right bundle branch block developed in three patients (two surgical, one transcatheter), while an incomplete right bundle branch block was observed in 12 patients (nine surgical, three transcatheter). No left bundle branch block was detected. To assess the potential influence of right bundle branch block, a subgroup analysis excluding affected patients was performed. Most electrocardiographic parameters remained comparable between the transcatheter and surgical groups; however, QT dispersion remained significantly higher in the surgical group (26.3 ± 14.1 ms vs. 15.8 ± 10.2 ms, p = 0.026) (Supplementary Table 1).
Post-procedural comparison between groups and controls
After ventricular septal defect closure, most ventricular repolarisation parameters in the transcatheter group were comparable to those of the control group, with no statistically significant differences (Table 4). In the surgical group, however, QT, QTc, QT dispersion, and QTc dispersion remained significantly prolonged compared with controls.
Comparison of ventricular depolarisation and repolarization parameters among the groups after closure

Table 4. Long description
The table presents a comparison of ventricular depolarisation and repolarization parameters among three groups after closure of ventricular septal defect: Transcatheter, Surgical, and Control. The table has 13 rows and 7 columns. The columns are labeled as follows: POST-Procedure variables (MSEC), VSD Transcatheter (n = 25), VSD Surgical (n = 33), Control (n = 40), p * (Transcatheter VS Surgical), p * (Transcatheter VS Control), p * (Surgical VS Control). The rows are labeled with various parameters: QT, QTd, QTc, QTcd, Tp-e, Tp-ed, JT, JTd, JTc, JTcd, QRS, Tp-e/QTc, Tp-e/QT. Each cell contains numerical values representing the mean and standard deviation of the parameters for each group, along with p-values indicating the statistical significance of the differences between the groups. Notable trends include significant differences in QTd, QTcd, and QRS between the Surgical group and the other groups, as indicated by p-values less than 0.05.
Values in bold indicate statistically significant differences (p < 0.05).
Abbreviations as noted in Table 1.
* One way-anova followed by Tukey’s post hoc test.
When comparing closure methods, QT dispersion and QTc dispersion remained significantly higher in the surgical group than in the transcatheter group after the procedure (p < 0.05). No significant difference in post-procedural QRS duration was observed between the two closure groups; however, QRS duration remained significantly longer in both groups compared with controls (p < 0.001, Figure 2).
A graphical representation of the QTc, QTcd, and QRS durations in the VSD and control groups before and after the procedure.

Figure 2. Long description
The image contains three box plots comparing QTc interval, QTc dispersion, and QRS duration across different groups before and after procedures. Panel A: The box plot shows QTc interval values. The x-axis represents different groups: Transcatheter group pre-procedure, Transcatheter group post-procedure, Surgical group pre-procedure, Surgical group post-procedure, and Control group. The y-axis represents QTc interval values in milliseconds, ranging from 320 to 480. Notable p-values are indicated, such as p=0.008, p=0.049, and p=0.034. Panel B: The box plot shows QTc dispersion values. The x-axis represents the same groups as Panel A. The y-axis represents QTc dispersion values, ranging from 0 to 80. Notable p-values are indicated, such as p<0.001. Panel C: The box plot shows QRS duration values. The x-axis represents the same groups as Panel A. The y-axis represents QRS duration values in milliseconds, ranging from 30 to 120. Notable p-values are indicated, such as p=0.015 and p<0.001. Each box plot includes median values, interquartile ranges, and outliers.
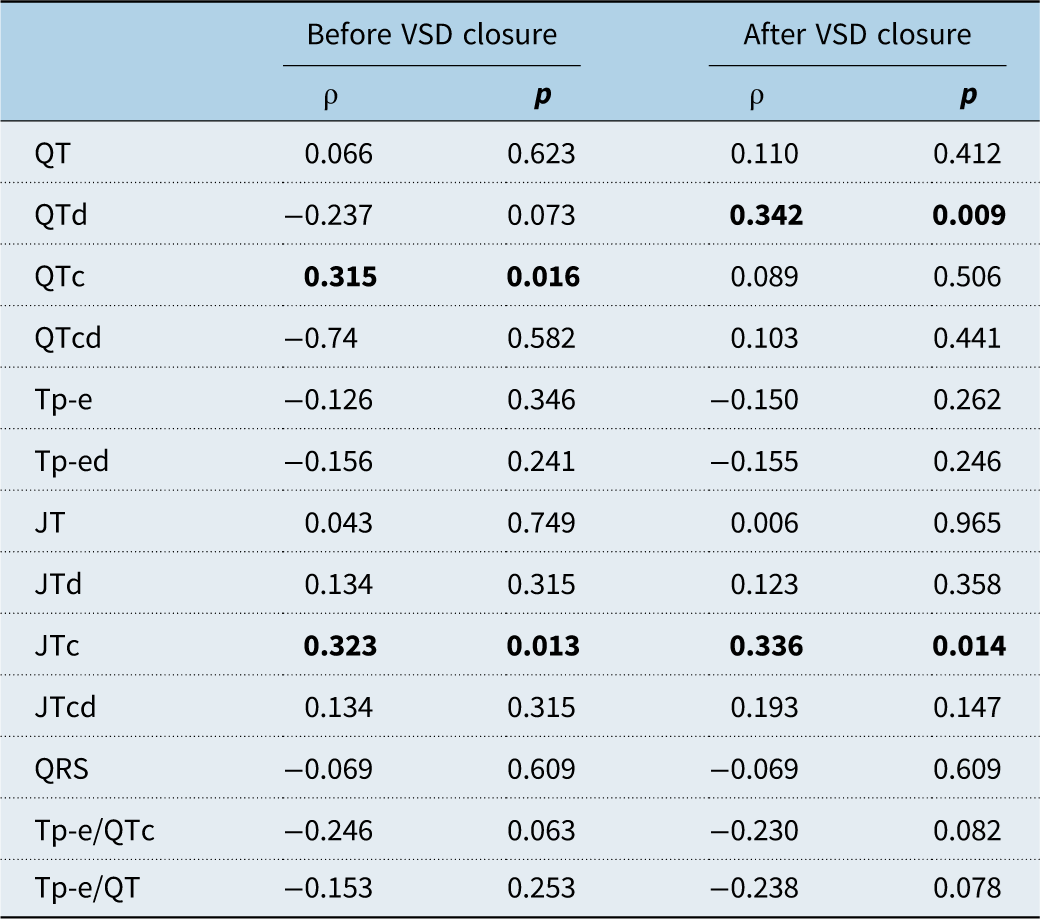
Correlation analysis revealed a modest positive association between ventricular septal defect diameter and both QTc interval (ρ = 0.315, p = 0.016) and JTc interval (ρ = 0.323, p = 0.013) before closure. No other significant correlations were observed. After closure, ventricular septal defect diameter demonstrated a significant positive correlation with QT dispersion (ρ = 0.342, p = 0.009), whereas no significant associations were identified for the remaining electrocardiographic parameters (Table 5).
Spearman correlation between ventricular septal defect diameter and electrocardiographic dispersion parameters before and after closure

Table 5. Long description
The table presents Spearman correlation coefficients and p-values for the relationship between ventricular septal defect diameter and various electrocardiographic dispersion parameters before and after closure. It has 12 rows and 4 columns. The columns are labeled ‘Before VSD closure p’ and ‘After VSD closure p’. The rows are labeled with different electrocardiographic parameters: QT, QTd, QTc, QTcd, Tp-e, Tp-ed, JT, JTd, JTc, JTcd, QRS, Tp-e/QTc, and Tp-e/QT. Each row displays correlation coefficients and p-values for the parameters before and after the closure. Notable correlations include QTc and JTc before closure, and QTd after closure.
Data are presented as Spearman’s correlation coefficient (ρ) and corresponding p values. Statistically significant correlations (p < 0.05) are shown in bold.
Rhythm monitoring
All patients underwent 24-hour Holter monitoring at six months following the procedure. No clinically significant arrhythmias were detected. Rare premature atrial contractions (<1%) were observed in one patient in the transcatheter group and in two patients in the surgical group.
Discussion
The present study evaluated ventricular depolarisation and repolarisation parameters as markers of electrical remodelling in children with isolated ventricular septal defects before and after defect closure. The principal findings were as follows: (1) children with ventricular septal defect exhibited significant abnormalities in both ventricular depolarisation and repolarisation parameters compared with healthy controls before closure; (2) most repolarisation indices improved after both transcatheter and surgical closure, with more complete normalisation observed in the transcatheter group; and (3) QRS duration remained prolonged at follow-up in both groups, suggesting persistent alterations in ventricular depolarisation.
Left-to-right shunt lesions are known to alter myocardial conduction properties and increase electrical heterogeneity, resulting in prolonged depolarisation and increased dispersion of repolarisation on surface electrocardiography. Reference Ece5–Reference Deaconu, Deaconu and Marascu7,Reference Temple12 In the present study, children with ventricular septal defect demonstrated significantly prolonged QRS duration, QT and QTc intervals, and increased dispersion indices before closure, consistent with previous reports. Evidence specific to children with ventricular septal defect is sparse, but Uchida et al. reported that both the early and late repolarisation processes are influenced by left ventricular preload in children with ventricular septal defects. The QRS, QTc, Tp-e, and corrected Tp-e intervals were found to be longer in patients with ventricular septal defects requiring surgery than in controls, similar to the findings of our study. Reference Uchida, Nishio and Omeki13
Improvement in ventricular repolarisation parameters following closure has been reported in children with atrial septal defect and patent ductus arteriosus, suggesting favourable electrical remodelling after relief of haemodynamic burden. Reference Khalilian, Ziaratban, Alizadeh, Norouzi and Shirvani6,Reference Yıldız, Kır and Armağan8,Reference Abu-Tair, Martin, Wiethoff and Kampmann9 The present study extends these observations to isolated ventricular septal defects. Significant reductions were observed in multiple repolarisation indices after closure, particularly in the transcatheter group, in whom most post-procedural values were comparable to those of healthy controls.
In contrast, QT and QT dispersion remained elevated after surgical closure. This finding may be partly reflected by the larger defect size in surgically treated patients, indicating a greater degree of pre-procedural volume overload and myocardial adaptation. Additionally, surgical intervention may directly affect the conduction system through mechanical manipulation, or patch placement, potentially contributing to persistent electrical heterogeneity. Although ventricular septal defect diameter showed weak correlations with selected electrocardiographic parameters, the absence of significant associations with most dispersion indices suggests that differences between treatment groups are unlikely to be explained solely by defect size.
One of the most notable findings of this study was the persistence of prolonged QRS duration in both closure groups. In addition, QRS-related ventricular depolarisation and repolarisation parameters remained significantly greater after the procedure, whereas non-QRS-related repolarisation parameters improved compared with those of the controls. Prolonged QRS duration has been associated with ventricular conduction delay and myocardial scarring in various forms of CHD. Reference Bhat, Malm and Sjöberg19–Reference Khan, Nadorlik, Kertesz, Nicholson, Ro and Cua21 Several mechanisms may account for this observation in ventricular septal defect patients: residual structural remodelling following chronic ventricular overload, intraoperative injury to the conduction pathways in surgically treated patients, and septal compression or local fibrosis related to device implantation in transcatheter closure. Although the clinical significance of modest QRS prolongation in this paediatric population remains uncertain, its persistence suggests incomplete reversal of ventricular electrical remodelling after defect closure.
Because right bundle branch block was more common in the surgical group, it represented a potential confounder when comparing electrocardiographic findings between treatment strategies. However, after exclusion of patients with right bundle branch block, QT dispersion remained significantly higher in the surgical group, whereas other parameters were comparable. This observation suggests that the differences in QT dispersion cannot be explained solely by the presence of right bundle branch block.
Importantly, no clinically significant arrhythmias were detected on 24-hour Holter monitoring at six months after intervention. Thus, the observed electrocardiographic abnormalities appear to represent subclinical alterations in ventricular electrical properties rather than overt arrhythmic disease during early follow-up. Nevertheless, long-term studies are required to determine whether these electrical changes have prognostic implications later in life.
This study provides additional evidence regarding the effects of ventricular septal defect closure on ventricular electrical properties in children and offers a direct comparison of surgical and transcatheter approaches. The findings suggest that ventricular repolarisation abnormalities improve substantially following closure, particularly after transcatheter intervention, whereas alterations in ventricular conduction may persist beyond the early post-procedural period.
Limitations
Several limitations of this study should be acknowledged. First, the retrospective, single-centre design and relatively small sample size may limit the generalisability of the findings and preclude definitive causal inferences. No a priori sample size calculation was performed; although the post hoc power analysis indicated adequate power to detect moderate-to-large effects, smaller between-group differences may have remained undetected.
Second, electrocardiographic measurements were performed retrospectively using manual interval analysis. Although standardised measurements were obtained by a single blinded observer using standardised techniques and repeated three times, measurement bias and variability cannot be completely excluded. Formal intra-observer and inter-observer reproducibility analyses were not performed.
Third, the surgical group had significantly larger defects than the transcatheter group. Although correlation analyses showed only modest associations between defect size and selected electrocardiographic parameters, residual confounding related to defect size and haemodynamic burden remains possible. Therefore, comparisons between closure techniques should be interpreted with caution.
Finally, the follow-up period was limited to six months. Longer follow-up studies are needed to determine the durability of the observed electrocardiographic changes and their potential associations with future arrhythmic outcomes.
Conclusion
Children with isolated ventricular septal defects exhibit alterations in ventricular depolarisation and repolarisation parameters consistent with subclinical electrical remodelling. Following defect closure, most ventricular repolarisation indices improve, particularly after transcatheter intervention. However, ventricular depolarisation abnormalities, reflected by persistent QRS prolongation, may remain despite successful closure. In children who underwent surgical ventricular septal defect closure, the QTd and QTcd values remained impaired even after the procedure. These findings indicate that electrical remodelling after ventricular septal defect closure may be incomplete in the early post-procedural period and may differ according to closure technique.
Supplementary material
The supplementary material for this article can be found at https://doi.org/10.1017/S1047951126123919.
Acknowledgements
We would like to thank all the healthcare professionals in the Paediatric Cardiology and Paediatric Cardiovascular Surgery departments.
Financial support
This research received no specific grant.
Competing interests
The authors declare that they have no conflicts of interest.
Ethical standard
The study was conducted in compliance with the Declaration of Helsinki and was approved by the Turkish Ministry of Health and Human Ethics Committee of Ankara Bilkent City Hospital (decision number: TABED2-25-975).
Authors’ contributions
Y.Ö.Ş. contributed to the idea, concept, design, and writing. A.A. and İ.E. contributed to supervision and critical review. Y.Ö.Ş., E.G.T., and N.Ö. contributed to the literature search, material and data collection, analysis, and interpretation. All the authors reviewed the final manuscript.