Introduction
The Larsen Ice Shelf is by far the largest floating ice body on the Antarctic Peninsula (Fig. I), extending from 64° 15' S in Prince Gustav Channel (western side of James Ross Island) to Cape Fiske (74°15'S) at Smith Peninsula.
Sketch map of the Antarctic Peninsula with the major ice shelves. The dashed line indicates the area covered by the mosaics.

Concerning the Global Change Programme, it is important to monitor the position of the Antarctic coastline, especially of the ice shelves which are subject to substantial changes in the recent past, with a view to establishing whether these changes are cyclic or related to regional or global climatic trends. For this purpose, the Scientific Committee on Antarctic Research (SCAR) Working Group on Glaciology initiated after the mid 1980s a Co-operative Landsat Acquisition Project. At present, about 90% of the Antarctic coast has been covered by cloud-free images (SCAR, 1993). The data thus acquired provide for the first time high-resolution imagery of the Larsen Ice Shelf, forming a basic data set for present and future studies of global change. However, the Russian satellite data recently available through SOJUZKARTA provide, though partially cloud-covered, an earlier data set over almost the same area, which then can be compared with the more recent Landsat TNT coverage.
To date, the most comprehensive data set for the Larsen Ice Shelf has been derived from the 1978 Scasatradar-altimeter data. Contour maps of elevation and radar back-scatter were produced, rifts, grounding points and rough terrain mapped and 30% of the 1978 seaward-edge position defined (Reference Ridley, Cudlip, McIntyre and RapleyRidley and others, 1989).
For the present study, two uncontrolled mosaics were assembled covering the Larsen Ice Shelf area between James Ross Island and Ewing Island (Fig. 2). They show the different regions divided by Cape Longing, Seal Noataks-Robertson Island, Jason Peninsula and Kenyon Peninsula-Gipps Ice Rise. The most northerly part, a small remnant located in Prince Gustav Channel, hadal ready separated from the main ice-shelf body in 1957‐58 (Reference DoakeDoake, 1982). The remnant lies within the extreme climatic limit for ice shelves and is actually the northern most ice shelf in the Southern Hemisphere (Reference SwithinbankSwithinbank,1988). This region, though shown on both mosaics, is not considered here since it has been discussed recently elsewhere (Reference SkvarcaSkvarca, 1993, in press).
Mosaics of the Larsen Ice Shelf (original scale: ~ 1: 1000 000) showing the 1975 and 1986-89 ice-front positions. Note the eastward projection above Gipps Ice Rise on the KATE-200 mosaic which calved as a giant iceberg in early 1986 (reproduced by permission of HOSAT and courtesy of SOɈUZKARTA).
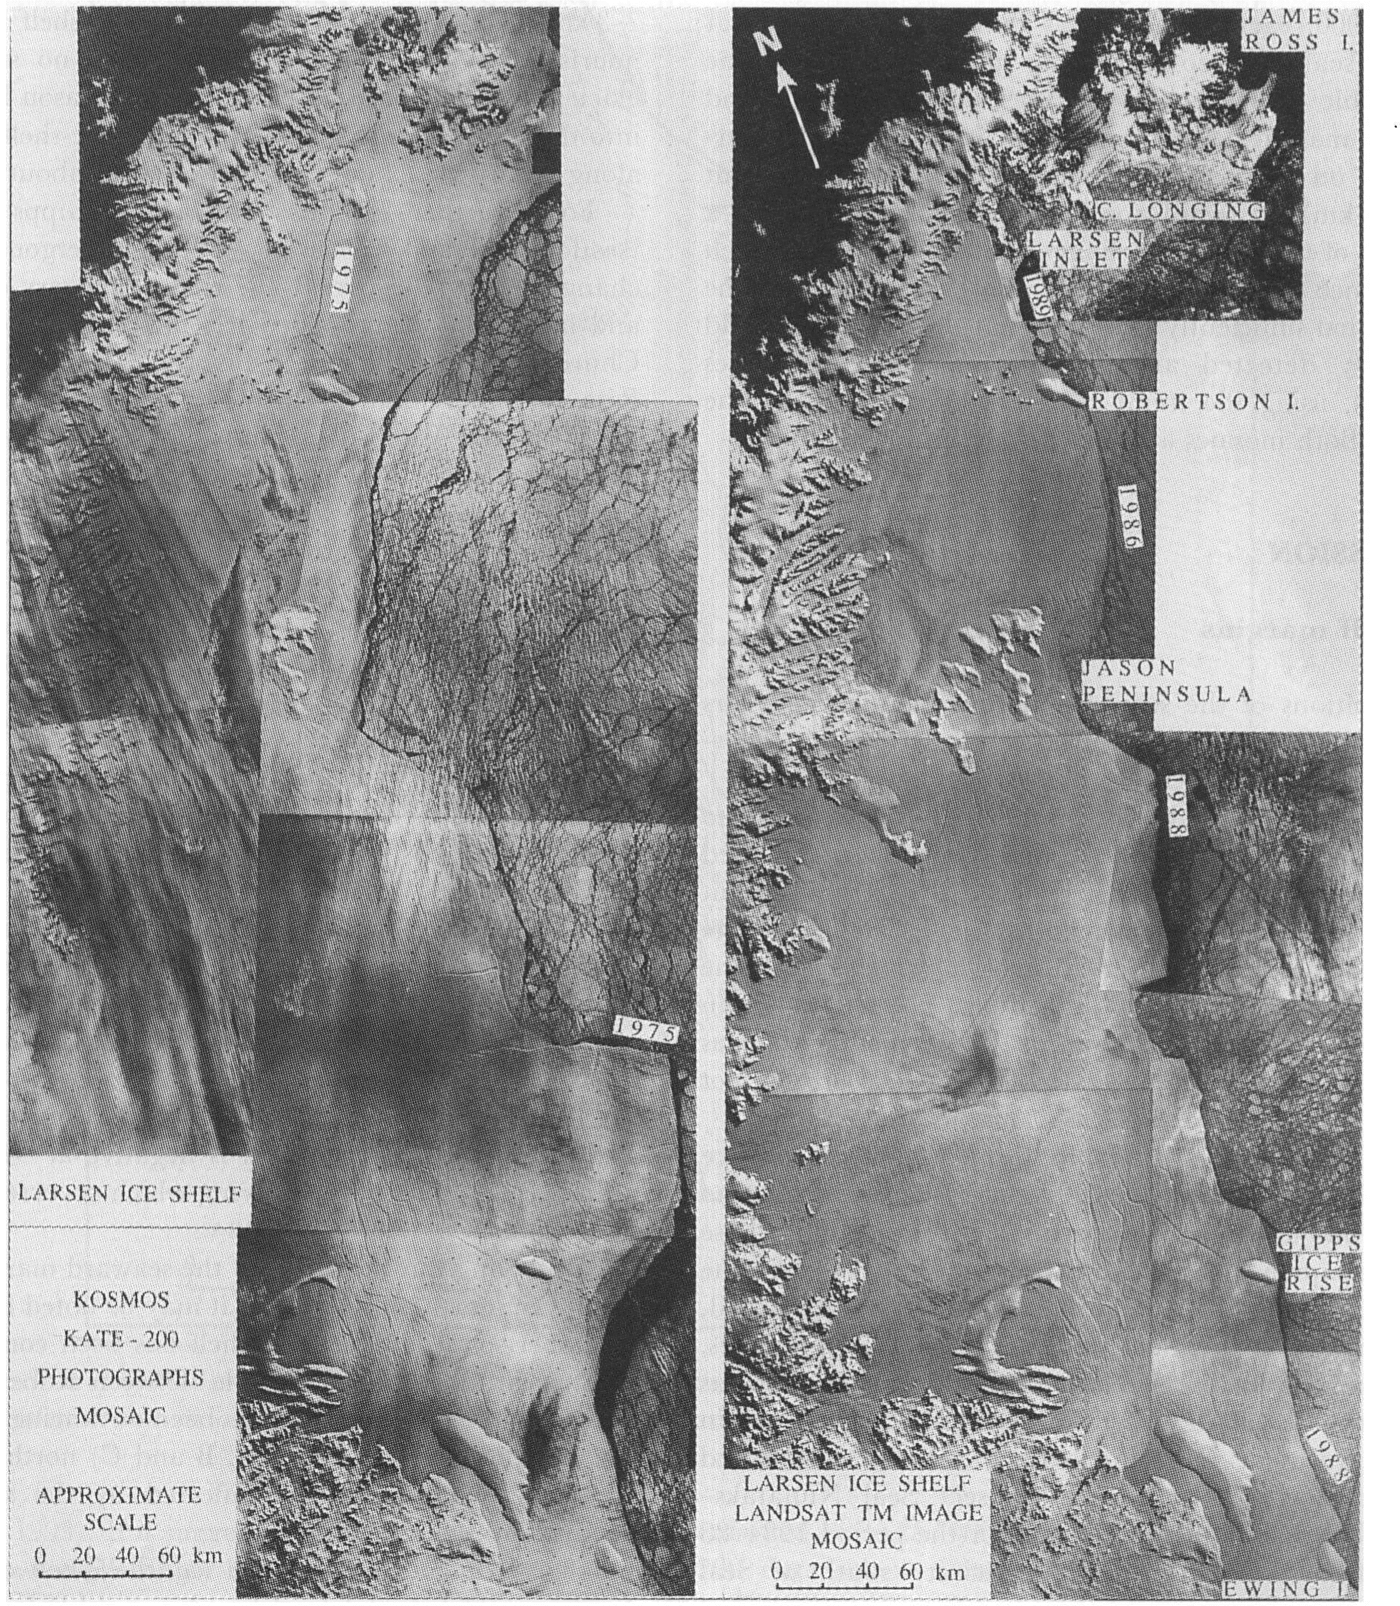
The aims of this paper are to analyse and estimate the variations along the 600 km north-south extent of the Larsen Ice Shelf’s seaward edge between Cape Longing and Ewing Island, which occurred during the period 1975–86–89. The variations, main glaciological features and the surface velocities in the chaotic crevassed-rifted area east of Kenyon Peninsula are derived by comparing the Landsat TM and Kosmos KATE-200 mosaics.
Mosaics data source and assembly
The mosaic of Landsat TM images acquired through the SCAR joint project was assembled using photographic products at band 4 of eight scenes at an approximate scale of 1: 1000000, i.e. path 217, rows 105-108 (1 March 1986); path 215, row 107 (12 January 1988); path 215,rows 108-109 (28 January 1988) and path 216, row 105 of 5 November 1989. In the mosaic's northern section, a1989 Image was attached to the 1986 series using well-defined features at Sobral Peninsula, Cape Longing and the southwest coast of James Ross Island. The 1988 series of three images covering the ice front south of Jason Peninsula were assembled by easily recognized and detectable ice features like crevasses, rifts and the ice frontline. This set was then fitted to the 1986 series by matching the eastern end of Jason Peninsula and Cape Keeler on Kenyon Peninsula, visible on both sets. The overall offset at Cape Keeler thus obtained was less than1mm (1 km at the mosaic's scale) in about 300 km length.
For the Kosmos KATE-200 mosaic, six photographs ata spectral band of 600‐700 nm were used. They correspond to three different sequences obtained towards the end of 1975, i.e. film No. 1064 (frames No. 687, 689and 691) of 4 October; film No. 1064 (frame No. 596) of 3 October and film No.1 084 (frames No. 739 and 741) of 11December. As the original scale of KA TE-200 is1: 1350000, each negative was reduced to the Landsat mosaic scale by co-registering photographically the identifiable and stationary features along the inland and seaward margins. The mosaic thus assembled and superimposed on the Landsat mosaic fits the latter to about 2 mm (2 km) between Cape Longing and Ewing Island, a distance of 600 km. The changes with time were of such significance along the Larsen Ice Shelf coastline, and the time period sufficiently extended that these changes could be easily detected and good quantitative estimates achieved, using the frame of reference provided by the images. Both mosaics are shown reduced in Figure 2.
Discussion
Ice-shelf margins
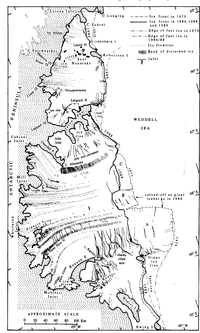
The positions of the seaward margin in different years from Cape Longing to Ewing Island, derived by superimposing both mosaics, are plotted in Figure 3.
Map of the Larsen Ice Shelf with the inland-boundary and seaward-edge positions at different years, and the main glaciological features as inferred from the interpretation of the satellite imagery

The recession of the ice front from Cape Longing to Robertson Island between 1975 and 1991 has been discussed in detail by Reference SkvarcaSkvarca (1993). Figure 3 shows the ice-front position in 1989 as documented by the TM image of late1989 and shown on the Landsat mosaic, which reveals the dramatic disintegration of Larsen Inlet. The retreat within this inlet has continued towards the grounding line as documented by a recent SAR/ERS-1radar image (not shown) of 8 December 1992 (Reference SkvarcaSkvarca, in press).
From Robertson Island to Jason Peninsula, the ice shelf had advanced between 1975 and 1986 and almost no calving had taken place along this ice-front section, whose overall shape has been retained during the 10.4 year time interval. This is concluded by analysing the enlarged, superimposed sequential satellite images of both mosaics.A fairly uniform displacement of 3‐4 km in 10 years has been estimated along this 90 km seaward edge which is in good agreement with the surface velocities measured along a northeast-southwest transect Seal Nunataks-Lisignoli Nunatak. The velocities for the period 1984-88 range from ~300 m a-1 in the vicinity south of Seal Nunataks, increasing slightly to a maximum value of ~360 m a-1 towards the central part which is influenced by the ice in-flow of Crane Glacier from the peninsula. The area of the ice-shelf advance in this region is 8estimated at ~300 km2. It has to be mentioned that an inspection of the Landsat TM image of 19 January 1988(not shown and not included in the mosaic) covering this ice-shelf area roughly indicates that the advance continued until 1988.
At the eastern end of Jason Peninsula, the analysis of the 1986 and 1988 Landsat images and the stereoscopic observation of a KATE-200 pair, which is possible due to60% overlap, shows the ice-shelf front is almost at the peninsula land margin. This conclusion is consistent with that previously obtained through the radar-altimeter data (Reference Ridley, Cudlip, McIntyre and RapleyRidley and others, 1989). The limit of the fast-ice edge in this embayment has considerably changed during 1975-86.
For ~70 km southeastward from the Jason Peninsula eastern land margin (the front of the ice-shelf region east of Churchill Peninsula well defined by a notable band of disturbed ice), the ice shelf has advanced since 1975, by 2‐3 km on average. This part of the ice shelf is mainly nourished by snow accumulation, since no significant glacier input has been observed from the Jason Peninsula into the southern inlets. The area of the ice-shelf advance along this 70 km extent is estimated to be about 160km2.
For a further 220 km southward to Gipps Ice Rise (sections C, B and A), the ice shelf has undergone a major change during the period 1975‐88. This very disturbed and heavily rifted-crevassed ice-shelf region, defined by Churchill Peninsula and Kenyon Peninsula-Gipps Ice Rise, is strongly influenced by the inflow of land ice from the Antarctic Peninsula mainly through Cabinet, Mill, Whirlwind and Mobil oil Inlets. The northernmost section C had already separated from the ice shelf in 1976, shortly after being hit by iceberg 1967A, formerly the Trolltunga tongue (Reference SwithinbankSwithinbank and others, 1988). The most substantial change had occurred in 1986 by the calving of two major icebergs (Reference Ferrigno and GouldFerrig no and Gould, 1987; Reference Jacobs and BarnettJacobs and Barnett, 1987). The area of the larger seaward projection (section A) is estimated at ~6520 km2 and that of the smaller one (section B) at ~1260 km2. From 1975 to 1988, the ice-shelf area between Jason Peninsula and Ewing Island has decreased by ~9200 km2 due to these calving events.
The ice front between Gipps Ice Rise and Ewing Island has been advancing on average between 3.5 and 5.0 km from 1975 until 1988 (~510 km2), while the position of the fast-ice edge has considerably receded during the same period. The overall ice-shelf areal balance between Jason Pensinsula and Ewing Island is negative at ~8530 km2,mainly due to the intense calving which occurred in 1976 and 1986.
Observing the variations of the seaward margin along its 600 km north-south extent, it may be noted that north of Robertson Island the ice shelf has been continuously disintegrating since 1975, while between Robertson and Ewing Islands the ice front has been advancing except in the 220 km length (sections A, Band C) north of Gipps Ice Rise, which has been affected by the significant calving processes since 1975.
It is concluded that the ice shelf between Cape Longing and Ewing Island has decreased by ~9300 km2 since 1975, mainly due to the calving south of Jason Peninsula and in their northern extent by disintegration probably due to the present atmospheric warming (Reference SkvarcaSkvarca, 1993). It is suggested that the climatic limit for the Larsen Ice Shelf may be moving southward towards Robertson Island.
The position of the grounding line at the in land margin of the ice shelf (Fig. 3) was derived by interpreting the four Landsat TM images (band 4) of 1 March 1986, enlarged to 1: 250000 scale and with the aid of KATE-200 data where stereoscopic coverage is available. In general, it was possible to detect the inland boundary as a break in slope at the foot of the glaciers entering the ice shelf (Reference SwithinbankSwithinbank, 1988). Some difficulties were encountered because of the shadow due to low-angle Sun incidence, especially at the deep inlets south of Churchill Peninsula. Digital enhancement of these images would certainly improve the location of the boundary along this extensive and highly irregular inland coastline.
Surface-ice features
The ice-shelf region north of Jason Peninsula is remarkably less structured when compared to the region south of this peninsula. Nevertheless, between Sobral Peninsula and the Seal Nunataks, many distinct ice-flow lines are revealed by the Landast imagery, as well as a group of icc dolines north of Larsen Nunatak, already mentioned by Reference SwithinbankSwithinbank (1988). A small ice rise is detected near Cape Fair weather, as well as a band of rifts extending from the cape towards the Seal Nunataks. A heavily rifted area is also visible at each side of Cape Disappointment. Distinctive ice-flow bands show the significant in-flow to the ice shelf by Hektoria and Evans Glaciers, as well as the input of Crane Glacier, probably one of the longest on the Antarctic Peninsula. A small ice rise is recognized close to the grounding line in front of the glacier north of Leppard Glacier. Wave-pattern features, crossed probably by lines of sastrugi due to the dominant southwest-north east wind, detected north of the western part of Jason Peninsula, could not be explained. In the central part of the seaward margin, a distinctive inlet maybe observed, due to divergent flow, normal to the icc front and entering the ice shelf by about 8 km. The same inlet is also clearly visible on the 1975 photograph but shifted in position because of the ice-shelfs forward movement. Well-defined rift patterns are developed beyond the lateral boundaries south of Robertson Island and the eastern tip of Jason Peninsula land margin. These rifts are clearly noticeable on the 1975 Kosmos image and their shape was maintained until 1986, though considerably displaced eastward due to the ice-shelfs motion.
Large crevasses and rifts, due to divergent flow, are the only distinctive features on the images of the ice shelf in the southern part of Jason Peninsula, bounded to the west by Churchill Peninsula and to the south by a distinctive band of disturbed ice. This very conspicuous and, formed by crevasses transverse to the direction of flow, extends divergently from Cape Alexander almost to the ice front. The surface features, such as flow bands and ice-flow lines south of Churchill Peninsula, are clearly indicating the significant glacier inputs nourishing the ice shelf mainly through Cabinet, Mill, Whirlwind and Mobiloil Inlets.
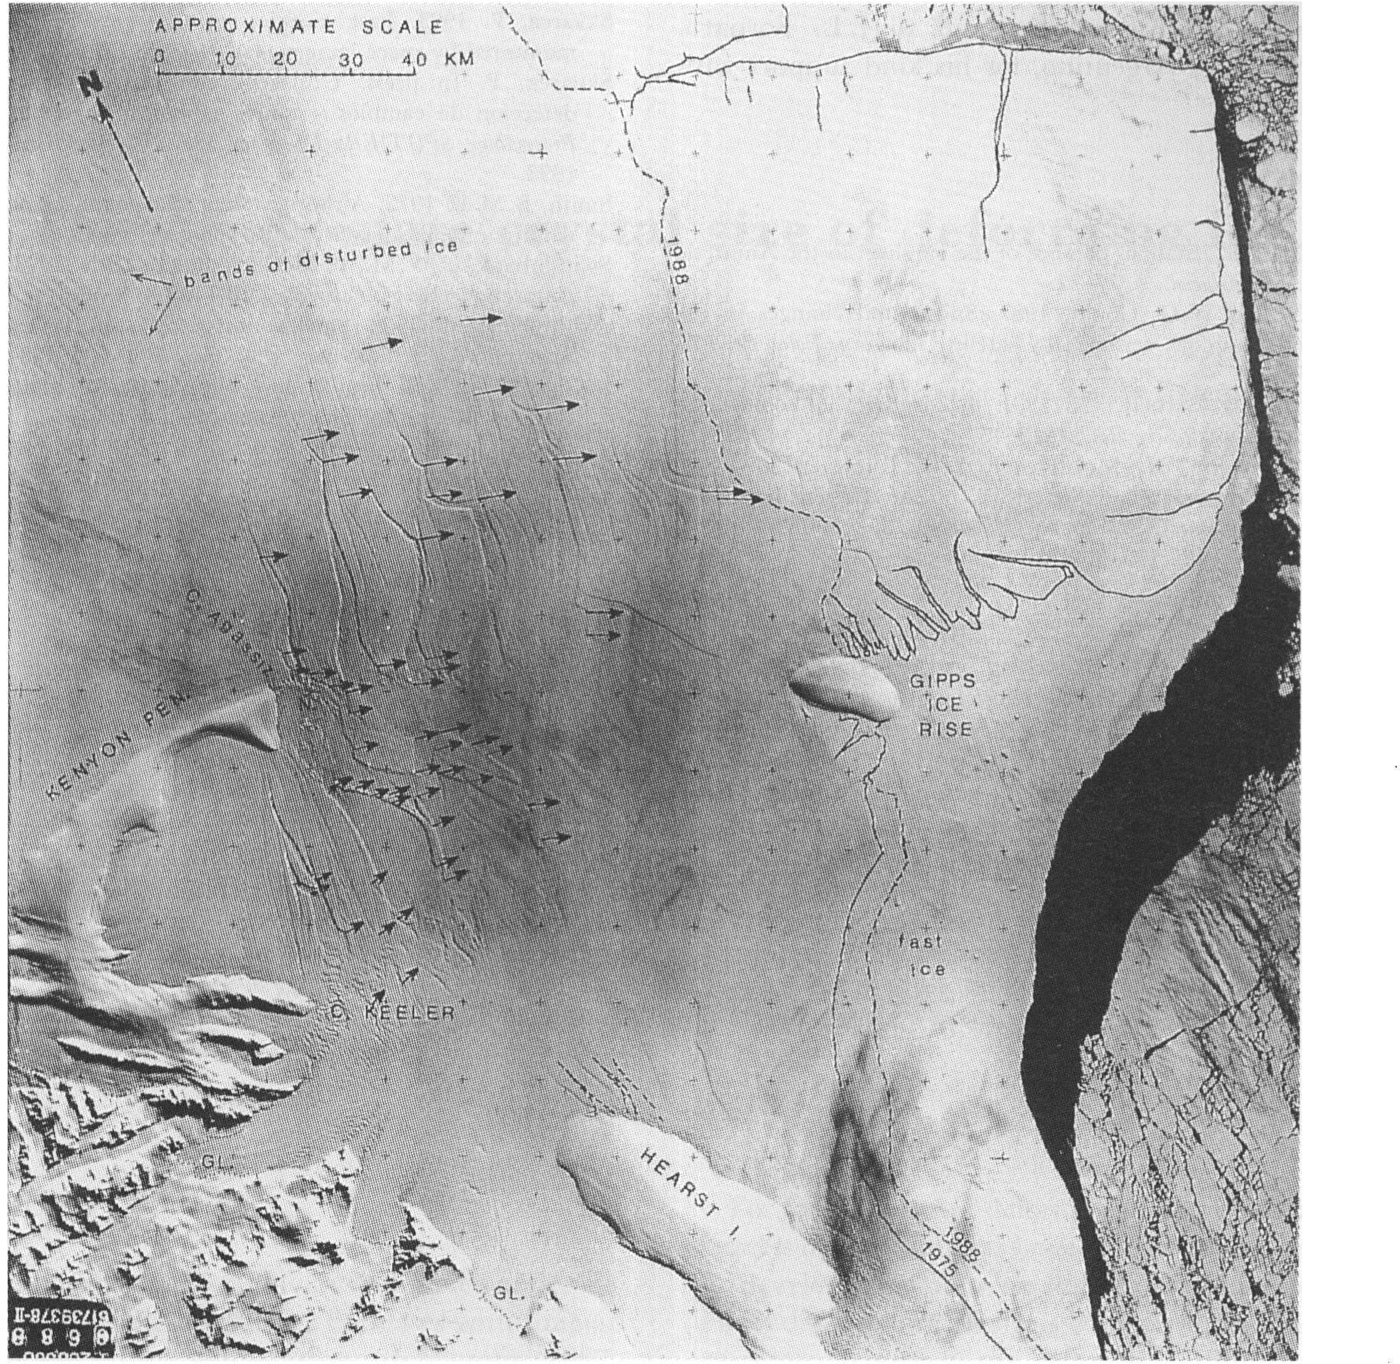
In the region between Cape Keeler and Gipps lce Rise, the rifts and low ice-shelf areas, separated by giant blocks resembling icebergs, give rise to depressions clearly detectable through stereoscopic observation of a KATE-200 image pair. The depressions were previously mapped by interpreting the Seasat data (Reference Ridley, Cudlip, McIntyre and RapleyRidley and others, 1989). A radio-echo sounding profile carried out during 1969-70 along a straight line from Cape Agassiz to Gipps Ice Rise also indicates a sudden change in the icc-shelfs thickness at about 25 km from the cape, where it drops from 132 to30 m, varying slightly between 24 and 56 m for a distance of ~27km towards Gipps Ice Rise (Reference SmithSmith, 1972). These giant rifts open north-south, extending eastward from Cape Agassiz (Fig. 4). Gipps lce Rise, where the calving finally took place in 1986, plays an important role as the last constraining boundary point in this region. From this ice rise onward, the ice shelf starts to float free, producing chasms almost parallel and inlets normal to the ice front, features clearly shown on Figures 3 and 4.
KATE-200 photograph (film No. 1064; frame No. 688) of 4 October 1975, showing the chaotic region eastward of Kenyon Peninsula. The vectors indicate the surface displacement of conspicuous ice features between 1975 and 1986. The dotted lines indicate the positions of the grounding line as inferred by the change-in-slope gradient by stereoscopic observation.(Published by courtesy of SOɈUZKARTA.)
Reference SmithSmith (1972) measured ice-shelf thickness exceeding the 550 m contour, coincident with the highest elevation contours (over 60 m a.s.l.; Reference Ridley, Cudlip, McIntyre and RapleyRidley and others, 1989) at Mobiloil Inlet, where the ice shelf is nourished by the Mercator Ice Piedmont, suggesting that the projection A is due to this significant ice-stream in-flow. By observing the surface-flow features in Figure 3, it is concluded that this projection is caused by the major ice in-flow from the Antarctic Peninsula, well defined by several very distinctive flow bands of disturbed ice and ice-flow lines developed between Francis Island and Kenyon Peninsula. These features can be traced almost to the seawardedge close to the major inlet normal to the ice front, separating sections A and B. Sections Band Care influenced by a less significant ice input, draining through Whirlwind Inlet and Mill-Cabinet Inlets, respectively, as defined by the ice-flow lines. This conclusion is derived by analysing the ice-thickness and elevation contour data available for the region and observing the 1975 ice-front position of the three sections. By interpreting the Landsat TM image of 1 March 1986, it was possible to map the shape of Tonkin Island (located between Francis Island and Three Slice Nunatak), which shows a large difference from that shown on previous maps. Inside Mobiloil Inlet there arc wave-form structures, similar to those detected on the Filchner-Ronne Ice Shelf (Reference SwithinbankSwithinbank and others, 1988), as well as two distinctive, oval-shaped ice rises which are recognized on the same image.
Ice velocities
To measure the Ice motion, a very simple method was applied by co-registering photographically the KATE-200 image collected on 4 October 1975 to the Landsat TM image of 1 March 1986. Both products have a similar resolution; the nominal resolutions are 15-30 m and 28.5 m for KATE-200 and the Landsat TM, respectively. The images were enlarged to ~ 1: 250000 scale, so as to track more easily the displacement of the selected conspicuous ice features. The results are shown in Figure 4, where the vectors indicate the total displacement during the 10.4 year time interval, except for the few features closest to the 1988 ice front which were obtained by comparing the Kosmos data with the Landsat mosaic, assembled in this section by the 1988 images. The ice velocities thus derived are estimated within about 10%error, whose smallness is due to the long time period between the images and well-preserved feature shape. The highest values are detected northeast of Kenyon Peninsula, increasing from ~430 to ~550 m a-1 towards the seaward edge, while in front of the Cape Agassiz-Cape Keeler embayment the velocities vary from ~ 100 to ~460 m a-1 in the direction of Gipps Ice Rise. In the north eastern part, the direction of the ice-shelf movement derived by this method shows good agreement with the actual flow direction defined by the bands of disturbed ice visible at the top left of Figure 4. The giant rifts shown in this figure, opening north-southward and running almost parallel to the ice front, represent without doubt the lines of weakness where the 1986 calving took place, as inferred by the 1988 front-line shape.
Conclusions
Two uncontrolled mosaics have been produced for the first time, covering almost the entire Larsen Ice Shelf using Landsat TM images and Kosmos KATE-200 photographs. Comparison of both satellite-data series shows recent changes in the seaward margin along about a 600 km front-line extent. The Landsat images enabled mapping of rifts, ice rises, crevasses, ice flow lines, bands of disturbed ice, the inland boundary and estimation of ice velocities by comparison with the Kosmos data. The updated position of the seaward margin after the occurrence of recent major changes also provides a useful reference for future studies related to global change.
A digital enhancement of Landsat data would provide better detection and mapping of the glaciological features and probably reveal new ones, as well as considerably improving the location of the inland boundary. Also, amosaic, geo-referenced with sufficient ground, control, would provide a more accurate base line to monitor any future changes along the highly variable Larsen Ice Shelf front line. Nevertheless, the results presented here clearly show the substantial change which occurred within the period 1975–86–89 and contribute to a better knowledge of this ice body located in a less-severe polar environment and therefore probably more vulnerable to any oceanic or atmospheric warming.
The new generation of ERS-I satellite missions, already providing radar images and more accurate altimetry data, will provide additional information on characteristics and dynamics of this particular ice shelf.
Acknowledgements
The author is grateful to the staff of the Departament to Fotogrametría del Servicio de Hidrografia Naval for their help in producing the mosaics and to J. L. Fornaro, Instituto Antártico Argentino, for his kind support with illustrations.