Introduction
With the rapid consumption of fossil resource, the concentration of carbon dioxide (CO2) in the atmosphere has been explosively increased, leading to serious environmental problems [Reference Ran, Jaroniec and Qiao1, Reference Li, An, Park, Khraisheh and Tang2]. Some technologies have been explored to facilitate the capture, sequester, and recycle of CO2 [Reference Zhang, Kong, Meng, Tian, Zhang, Wan, Lin and Wang3]. Among them, solar photocatalytic conversion of CO2 into valuable chemical fuels is considered to be a promising way, which not only mitigates environmental problems but also provides a feasible solution to address energy dilemma [Reference Feng, Zeng, Chen, Ma, Zhao, Jin, Lu, Wu and He4]. Photocatalysts play a vital role in the field of photoreduction CO2. Numerous semiconductor-based photocatalysts, such as TiO2 [Reference Song, Li and Wang5], WO3 [Reference Wang, Hu, Xu, Zhu, Ding and Deng6], and g-C3N4 [Reference Peng, Li, Zheng, Yu and Dong7], have been investigated to reduce CO2 into value-added carbon fuels. However, the limited visible light absorption and fast charge recombination restrict the practical application of single-phase photocatalysts. Therefore, many strategies, including heterojunctions construction [Reference Yang, Li, Xia, Lv and Li8, Reference Li, Xia, Yang, Lv, Lei and Li9], morphological regulation [Reference Chen, Zhou, Liu, Li, Liu and Zou10], and facet engineering [Reference Bai, Wang, Li and Xiong11], have been developed.
Bi-based compounds such as BiOX (X = Cl, Br, I) [Reference Zhang, Wang, Xiao, Liu, Xu and Du12, Reference Ye, Liu, Gong, Tian, Peng and Zan13], Bi2WO6 [Reference Zhang, Dong, Ran, Xie, Lu and Ding14], and Bi2MoO6 [Reference Wang, Ren, Zhang, Hao, Gong, Xiao, Jiang and Tong15] have inspired intense interest and are widely used in photocatalytic system. Among them, BiOI has a strong photoresponse in the visible light region due to the narrow band gap (∼1.9 eV) [Reference Wang, Ye, Zhang, Zhao and Zeng16] and has been widely applied in organic contaminant degradation [Reference Zhang, Wang, Xiao, Liu, Xu and Du12], water splitting [Reference Zhao and Dai17], and photoreduction of CO2 [Reference Ye, Wang, Jin, Su, Wang, Xie, Liu and Liu18, Reference Zang, Su, Qu and Xu19]. However, individual BiOI has some drawbacks, such as the weak photoredox ability and high recombination rate of photogenerated e−–h+ pairs. Construction of heterojunction by combining BiOI with other semiconductor may be a good solution to solve the problems. For example, Liu et al. synthesized BiPO4/BiOI composites and found that the weak mineralization ability of BiOI was improved by constructing heterojunction with BiPO4 [Reference Liu, Yao, Liu, Zong, Zhang, Ma and Zhu20]. Wang et al. prepared the g-C3N4/BiOI heterojunction composites, and the synthesized composites exhibit higher photocatalytic CO2 reduction activity than pure g-C3N4 and BiOI [Reference Wang, Yao, Fan, Zhang, Wang, Zang and Li21].
CdS is a narrow band gap semiconductor and has a sufficient negative conduction band potential [Reference Li, Wei, Fan, Li and Yao22]. However, the application of single-phase CdS in CO2 photoreduction is still restricted by fast recombination of photogenerated electron–hole pairs and serious photocorrosion [Reference Ahmad Beigi, Fatemi and Salehi23]. Therefore, tremendous efforts have been made to suppress the recombination of electron–hole pairs and photocorrosion of CdS. Construction of Z-scheme heterojunction by decorating CdS on other semiconductors provides an efficient approach to solve these problems, according to the previous report [Reference Jo and Selvam24]. In the Z-scheme photocatalytic systems, electrons in other semiconductors can induce the spatial separation of photogenerated carriers and recombine with holes in CdS to avoid the photocorrosion of CdS [Reference Jin, Yu, Guo, Cui and Ho25]. Recently, Low et al. reported that Z-scheme TiO2/CdS nanohybrids exhibited higher photocatalytic CO2 reduction performance than that of CdS and TiO2 [Reference Low, Dai, Tong, Jiang and Yu26]. However, BiOI-based composites decorated with CdS have not been applied in photocatalytic CO2 reduction up to now.
Based on the above analyses, we synthesized a series of CdS/BiOI composites by depositing CdS nanoparticles on the surface of BiOI nanosheets. The synthesized composites were characterized and their photoreduction CO2 activity was evaluated under visible light irradiation (λ > 400 nm). CdS/BiOI composites exhibit remarkably enhanced activity compared with individual CdS and BiOI. At the same time, the photostability of CdS/BiOI is greatly improved. The enhanced photoreduction CO2 activity is attributed to Z-scheme charge transfer mode, which is further verified experimentally.
Results and discussion
X-ray diffraction analysis
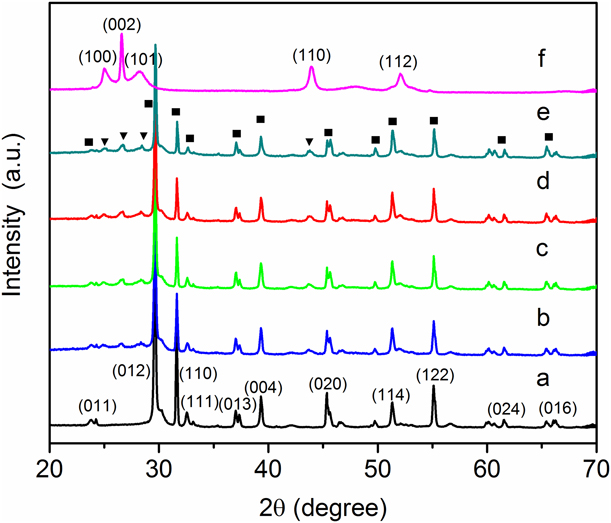
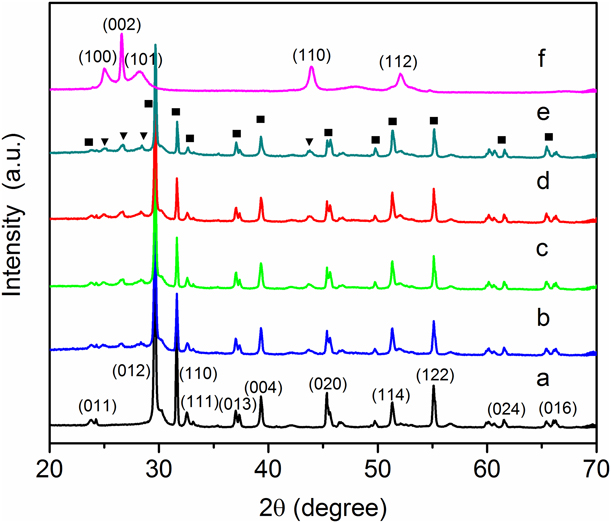
The crystal phase of BiOI, CdS, and CdS/BiOI composites was determined by X-ray diffraction (XRD), and the results are shown in Fig. 1. The XRD patterns of pure BiOI can be well indexed to the tetragonal phase of BiOI (PDF No. 01-073-2062), while those of pure CdS can be ascribed to the hexagonal phase of CdS (PDF No. 01-080-0006). No shift of peak positions is observed in the CdS/BiOI composites, probably because CdS nanoparticles are deposited on the surface of BiOI and not introduced into the lattice of BiOI. The peak intensity of BiOI gradually decreases with the increase in CdS content, which may be due to CdS blocking the X-ray irradiation and coherent scattering of BiOI. Moreover, no other additional impurity peaks are found in the composites, indicating no new phase formed in the as-prepared composites.
XRD patterns of (a) BiOI, (b) BC-3, (c) BC-4, (d) BC-5, (e) BC-6, and (f) CdS (■ represents the diffraction peak of BiOI and ▼ represents the diffraction peak of CdS).
Scanning electron microscopy analysis
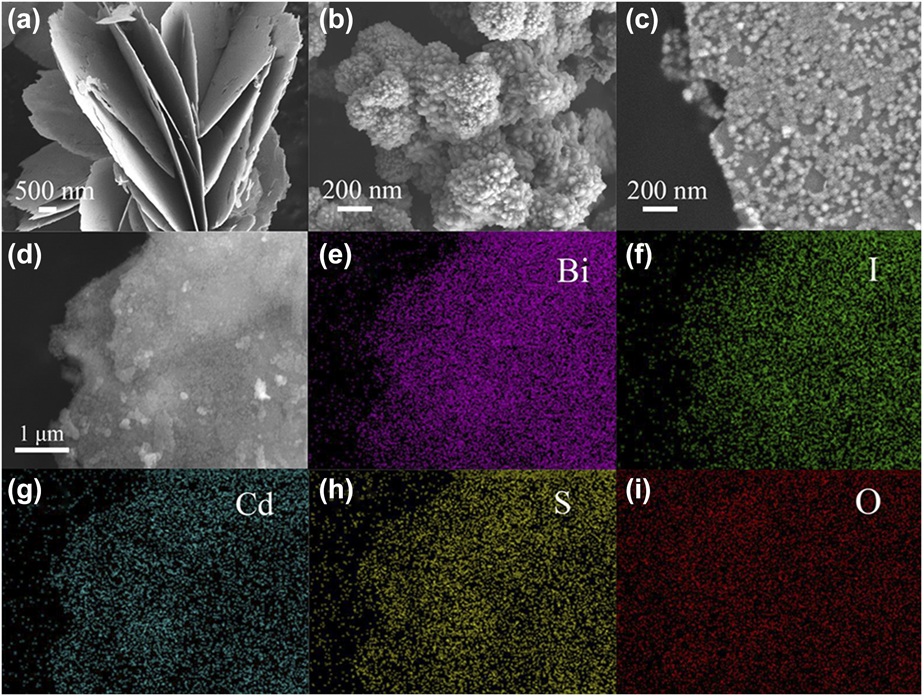
Scanning electron microscopy (SEM) is used to investigate the morphologies of the samples. The SEM image in Fig. 2(a) shows that pure BiOI is composed of 2D nanosheets with a thickness of 30–50 nm. Figure 2(b) displays that pure CdS nanoparticles are seriously agglomerated. SEM image of BC-5 is shown in Fig. 2(c). CdS nanoparticles with an average size of ∼30 nm are dispersed well on the surface of BiOI nanosheets. Moreover, the size of CdS nanoparticles in BC-5 is basically the same, which may be caused by the steric hindrance of side group –NH2 of thiourea [Reference Wei, Wang, Li, Zhang, Yao and Li27]. When comparing SEM images of BC-x, we found that the loading amount of CdS on the surface of BiOI nanosheets increases as x increases from 3 to 6 (Fig. S1, in the Supplementary material). Furthermore, the energy dispersive X-ray spectra (EDS) elemental mapping [Figs. 2(d)–2(i)] analysis of BC-5 displays the homogeneous distribution of elemental Bi, I, Cd, S, and O, which further confirms the coexistence of BiOI and CdS, thus the CdS nanoparticles are tightly deposited on the surface of BiOI.
SEM images of (a) BiOI, (b) CdS, and (c) BC-5. (d) Electronic image of BC-5 and the corresponding EDS mappings of elements (e) Bi, (f) I, (g) Cd, (h) S, and (i) O.

Transmission electron microscopy analysis
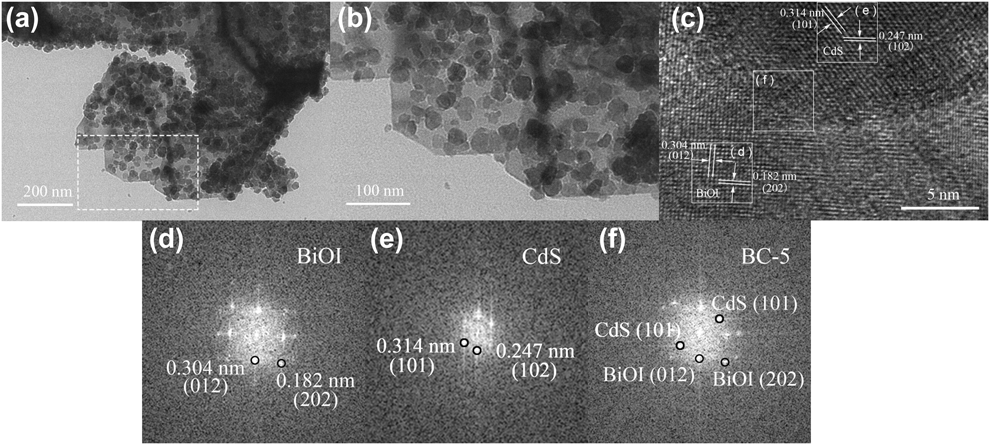
To further investigate the morphology of BC-5, transmission electron microscopy (TEM) and high-resolution TEM (HRTEM) characterizations were performed and the results are shown in Fig. 3. As can be seen from Figs. 3(a) and 3(b), CdS nanoparticles with an average size of 20–30 nm are uniformly deposited on the surface of BiOI. The HRTEM image of BC-5 is displayed in Fig. 3(c). The lattice spacing distance of 0.304 and 0.182 nm may correspond to (012) and (202) lattice planes of tetragonal phase BiOI, while the lattice fringes with 0.314 and 0.247 nm spacing can be assigned to (101) and (102) facets of CdS. Figures 3(d) and 3(e) represent the fast-Fourier transform (FFT) diffraction patterns of the BiOI and CdS regions, respectively. Figure 3(f) displays the FFT of the selected regions in the CdS/BiOI heterojunction. The diffraction points in the corresponding simulated FFT pattern can be indexed to the (202) and (012) planes of BiOI [Fig. 3(d)]. The diffraction points in region (e) correspond to the (101) and (102) facets of CdS [Fig. 3(e)]. The diffraction points in the FFT pattern of region (f) can be well indexed to the planes of BiOI and CdS [Fig. 3(f)]. The HRTEM results and simulated FFT patterns of BC-5 composite are consistent with the XRD results, revealing that the CdS–BiOI heterojunction was successfully constructed.
TEM image of (a) BC-5, (b) the area of square outlines in a, and (c) HRTEM image of BC-5. (d–f) Simulated FFT patterns and the indexed diffraction spots separated from the area of square outlines in c.

Ultraviolet–visible DRS analysis
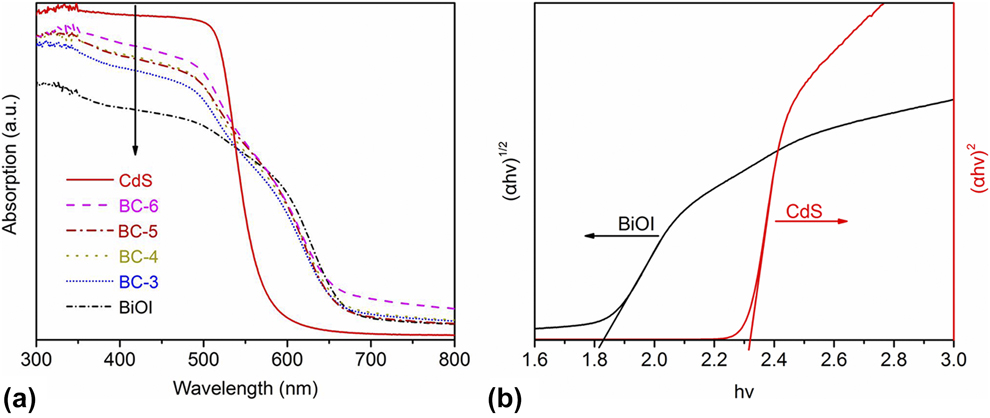
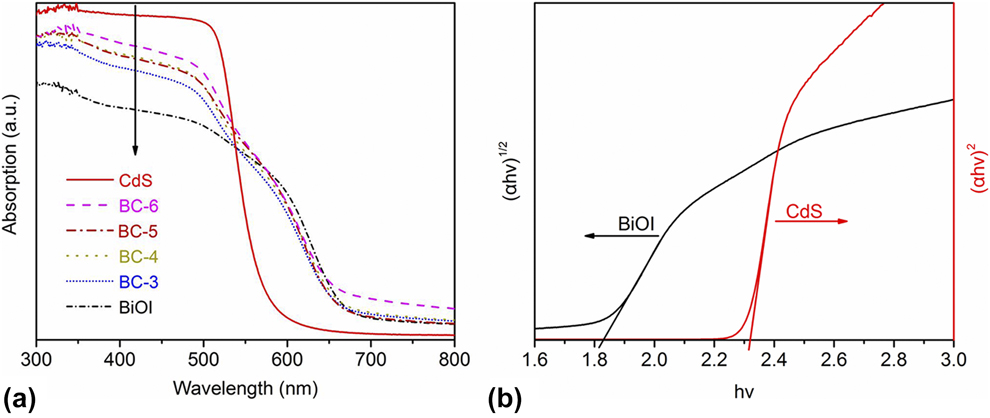
The optical properties of BiOI, CdS, and CdS/BiOI composites were determined by Ultraviolet–visible (UV-vis) diffuse reflectance spectra (DRS), and the results are shown in Fig. 4(a). Pure BiOI has broad absorption in visible region with an absorption edge of around 680 nm, whereas the absorption edge of CdS is located at about 550 nm. The absorption edges of BC-x are in the middle of BiOI and CdS. It should be noted that the absorption in the visible light region is enhanced with the increase in CdS content in the CdS/BiOI composites. As a crystalline semiconductor, the band gap can be calculated according to Eq. (1) [Reference Wei, Wang, Li, Zhang, Yao and Li27]:
 $$\alpha h\nu = A{\left( {h\nu - {E_{\rm{g}}}} \right)^{{n / 2}}}\quad ,$$
where α, hν, A, and E g represent the absorption coefficient, photon energy, a constant, and band gap energy, respectively. Furthermore, n is determined by the type of optical transition of a semiconductor (n = 1 for direct transition and n = 4 for indirect transition). According to the previous literature [Reference Zhang, Wang, Xiao, Liu, Xu and Du12, Reference Zhang, Li, Liu, Wang and Xie28], BiOI has the value of n = 4 and CdS has the value of n = 1. Figure 4(b) shows the corresponding Tauc plots of BiOI and CdS. Accordingly, E g of BiOI and CdS is calculated to be approximately 1.82 and 2.32 eV, respectively.
(a) UV-vis DRS of all samples and (b) the corresponding Tauc plots of BiOI and CdS.
Band gap level analysis
The band gap structure can be estimated according to valence band X-ray photoelectron spectroscopy (XPS) combined with band gap (E g) [Reference Guan, Xiao, Zhang, Fan, An, Cheng, Xie, Zhou, Ye and Xie29]. Figures S2(a) and S2(b) show the valence band XPS of BiOI and CdS, respectively. According to the linear intersection method [Reference Zhang, Chen, Li, Xu, Li, He and Lu30], E VB of BiOI and CdS is determined to be 2.40 and 1.73 eV (versus normal hydrogen electrode [NHE]), respectively. Correspondingly, the conduction band (E CB) can be calculated by the equation E CB = E VB − E g [Reference Feng, Zeng, Chen, Ma, Zhao, Jin, Lu, Wu and He4], and E CB values of BiOI and CdS are 0.58 and −0.59 eV, respectively. Accordingly, a schematic diagram of the band gap positions of BiOI and CdS is given in Fig. S3. These results confirm that BiOI and CdS form an overlapping band structure, implying a potential improvement of charge separation efficiency [Reference Reza Gholipour, Dinh, Beland and Do31].
XPS analysis
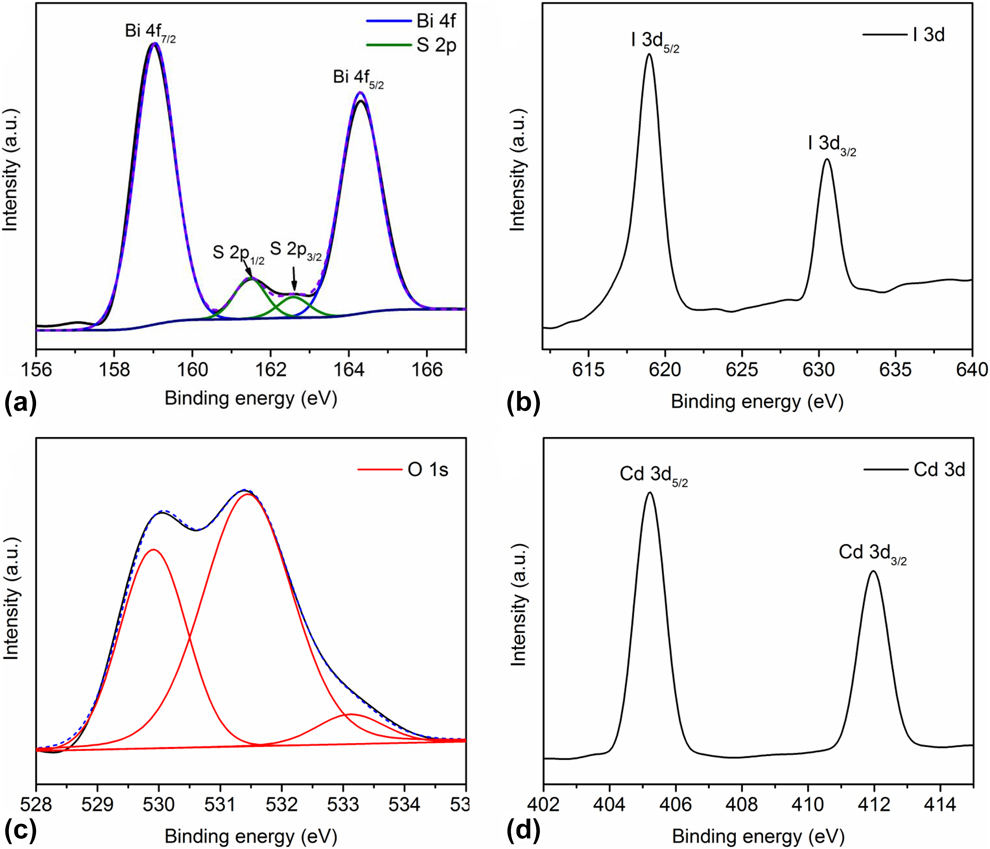
The surface compositions and the elemental chemical states of the typical sample BC-5 are determined by XPS (Fig. 5). The survey XPS spectrum of BC-5 shows the presence of elements Bi, O, I, Cd, and S (Fig. S4). Two symmetric peaks positioned at 159.0 and 164.3 eV with a peak difference of 5.30 eV are observed in Fig. 5(a), which can be ascribed to Bi 4f 7/2 and Bi 4f 5/2, respectively. The chemical state of Bi may be trivalent (Bi3+), according to previous reports [Reference Dai, Yu and Liu32]. Besides, the S 2p peak centered at 161.5 and 162.6 eV. These peaks are attributed to S 2p 1/2 and S 2p 3/2, respectively, confirming the presence of sulfur in −2 oxidation state [Reference Pawar and Lee33]. The I 3d XPS spectra are shown in Fig. 5(b): two strong peaks centered at 618.9 and 630.5 eV assigned to I 3d 5/2 and I 3d 3/2, respectively. And it means that the valence state of iodine species is −1 [Reference Zhang, Wang, Xiao, Liu, Xu and Du12]. For O 1s spectra [Fig. 5(c)], two distinct peaks at 530.0 and 531.4 eV and a low intensity peak at 533.3 eV are observed. The first peak is attributed to the lattice oxygen of layer-structured Bi2O22+, and the second one is surface-adsorbed H2O, while the last peak with low intensity at around 533.3 eV may be ascribed to C–O/C=O [Reference Yun, Ingole, Choi, Kim and Lee34]. The Cd 3d 5/2 and Cd 3d 3/2 peaks are observed at 405.2 and 411.9 eV [Fig. 5(d)], respectively, indicating that the Cd species exist as +2 [Reference Li, Liu, Luo, Li, Huang, Li, Fang, Xu and Zhu35]. The XPS results further prove the coexistence of BiOI and CdS in BC-5.
High-resolution XPS spectra of (a) Bi 4f and S 2p, (b) I 3d, (c) O 1s, and (d) Cd 3d of BC-5.

Brunauer–Emmett–Teller analysis
N2 adsorption–desorption isotherms were performed to determine the surface area of the as-prepared photocatalysts and the results are displayed in Fig. S5. The Brunauer–Emmett–Teller (BET) surface areas (S BET) of BiOI, BC-3, BC-4, BC-5, and BC-6 are 4.98, 6.03, 7.52, 8.88, and 10.37 m2/g, respectively. The results show the S BET of BC-x increases with the increase in CdS content. However, there is no linear relationship between the yields of products and the content of CdS; the BC-6 with the largest specific surface area does not exhibit the highest photocatalytic activity, as shown below. Consequently, the result suggests that the specific surface area is not the main factor affecting the photocatalytic activity of CdS/BiOI composites.
Photocatalytic activity
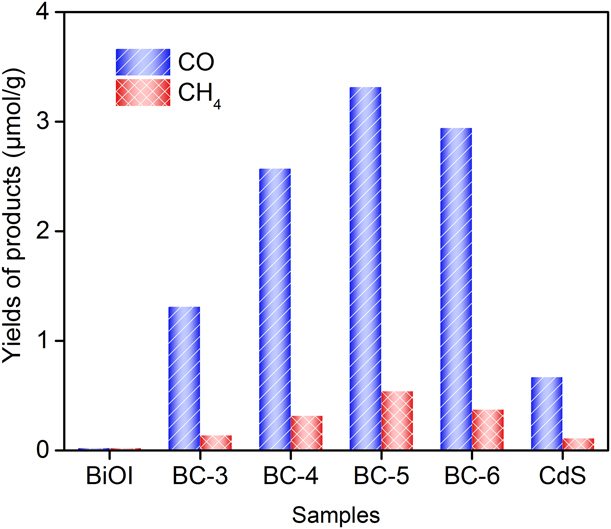
To investigate the activity of the as-prepared samples, photocatalytic CO2 reduction measurements were carried out in the presence of water vapor under visible light irradiation (λ > 400 nm). As shown in Fig. 6, when pure BiOI is used as photocatalyst, no products are detectable. The yields of CO and CH4 for pure CdS are 0.65 and 0.10 μmol/g after 3 h irradiation, respectively. Interestingly, after loading CdS nanoparticles, CdS/BiOI samples exhibit enhanced photocatalytic activity. It is noteworthy that CO is the major product and CH4 is the minor product. The photocatalytic activity of BC-x increases as x increases from 3 to 5. At x = 5, a maximum photocatalytic activity is achieved and the yields of CO and CH4 attain 3.32 and 0.54 μmol/g, respectively. The yields of CO and CH4 are about 5.0 times those of pure CdS photocatalyst. When the content of CdS continues to increase (x > 5), the yields of CO and CH4 decrease instead. The reason is that excessive CdS nanoparticles hinder the light absorption of BiOI, resulting in the reduction of photocatalytic activity [Reference Jin, Yu, Guo, Cui and Ho25].
Yields of CO and CH4 for all samples under visible light irradiation for 3 h.

Figure S6(a) shows the photocatalytic activity of the optimal BC-5 composites under visible light irradiation for different time. As can be seen, the total yields of CO and CH4 increase with time. The yields of CO and CH4 for BC-5 after 5 h irradiation are 5.66 and 0.80 μmol/g, respectively. The diagram of production rate [Fig. S6(b)] indicates that the production rates of CO and CH4 first increase and then decrease slightly. The maximal yield rates of CO and CH4 are found at 3 h irradiation, which attain 1.26 and 0.22 μmol/(g h), respectively. The increased tendency of CO and CH4 yield is gradually subsided with a subsequent visible light irradiation, possibly due to the coverage of products or intermediate products on the surface of photocatalyst [Reference Tu, Zhou, Feng, Xu, Li, Wang, Xiao and Zou36].
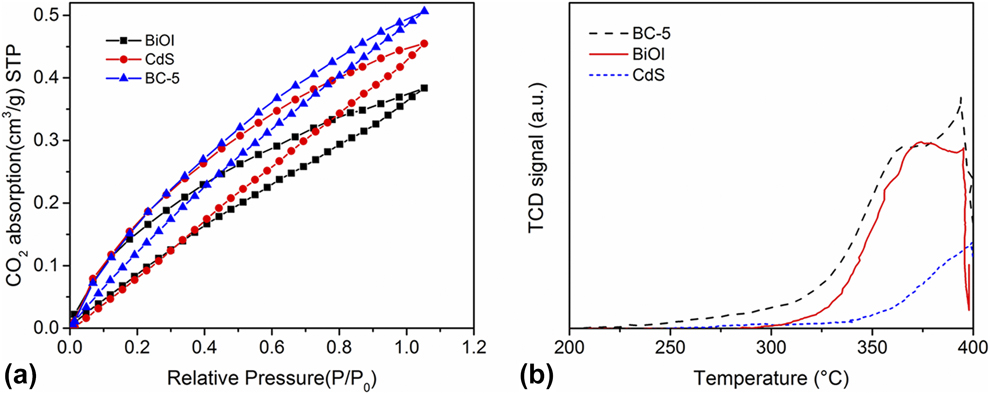
In general, the photocatalytic CO2 conversion is affected by substrate adsorption properties greatly [Reference Bai, Yang, Wang, Xie, Dang and Ye37]. The CO2 absorption–desorption experiment and the CO2 temperature programmed desorption (CO2-TPD) test were conducted to confirm the CO2 accessibility of CdS, BiOI, and BC-5. As shown in Fig. 7(a), CO2 uptake capacity is 0.39 and 0.46 cm3/g for the pristine BiOI and CdS, respectively, while for the composite BC-5, it is 0.51 cm3/g. As can be seen, the BC-5 exhibits enhanced CO2 gas absorption ability compared with BiOI and CdS. Figure 7(b) displays the CO2-TPD profiles of pure BiOI, CdS, and BC-5; the peak areas follow the order of BC-5 > BiOI > CdS, indicating that BC-5 can absorb CO2 more feebly than pure BiOI and CdS. The CO2-TPD result is consistent with the result of photocatalytic activity data in Fig. 6.
(a) The CO2 absorption–desorption isotherms and (b) CO2-TPD profiles of BiOI, CdS, and BC-5.
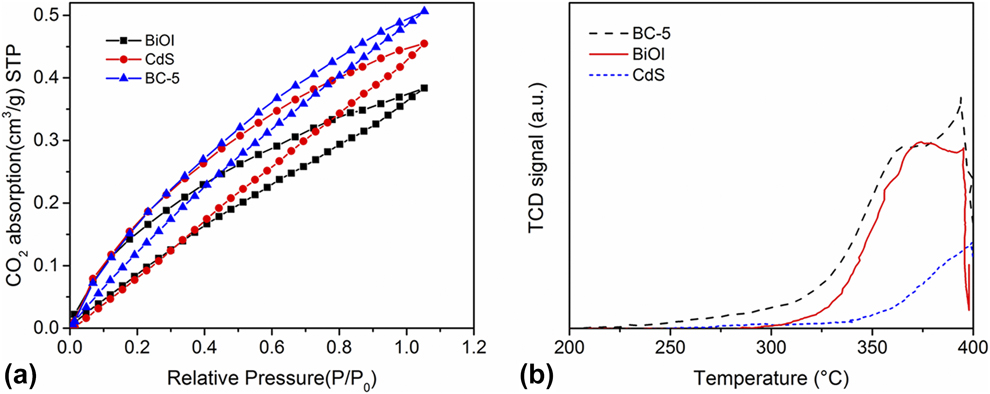
Based on the above results, we can conclude that BC-5 can absorb more CO2 to participate in the photocatalytic reaction, which will be more conductive to improve the activity of photocatalytic CO2 reduction.
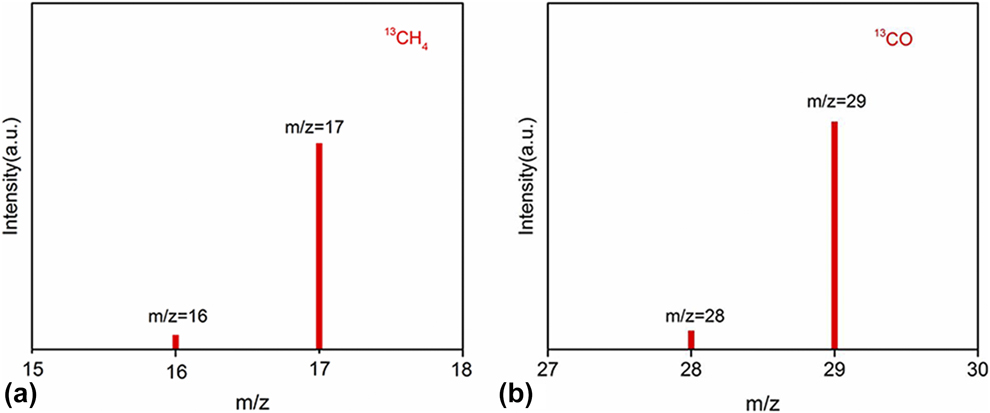
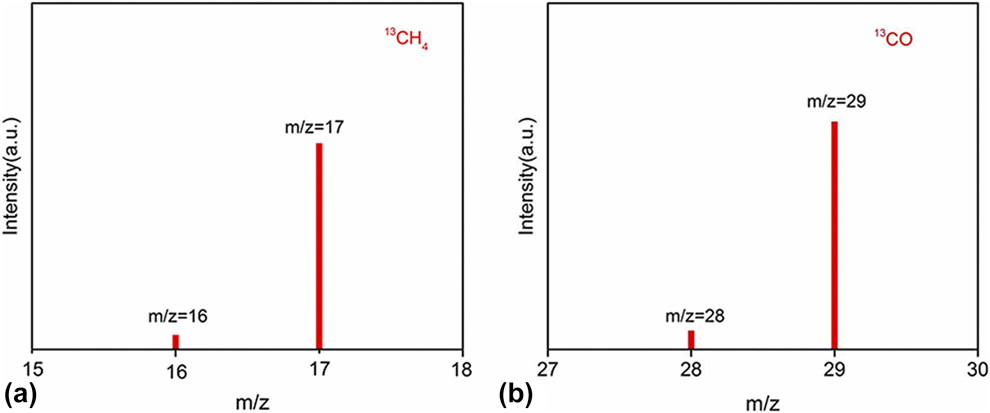
To confirm the source of C element in products (CO and CH4) being from CO2 reactants, some control experiments were performed. Figure S7 shows the yields of CO and CH4 for BC-5 under various reaction conditions for 3 h irradiation. When there were no photocatalysts in the reaction system (Fig. S7, column 1), only a very small amount of CO (0.18 μmol/g) was generated and no CH4 was detected. The next control experiment was performed in dark in the presence of photocatalyst (Fig. S7, column 2); obviously, no products were detected. It suggests that CO2 reduction should be driven by light irradiation. Another control experiment was conducted to replace CO2 reactants with N2 (Fig. S7, column 3); only a small amount of CO (0.1 μmol/g) was detected. Finally, under the normal condition (Fig. S7, column 4), the yields of CO and CH4 substantially increase to 3.32 and 0.54 μmol/g, respectively. The results of control experiments show that CO and CH4 mainly come from CO2 reactants, not from the organic impurities on the surface of reaction container or photocatalysts. To provide powerful proof of carbon source, the 13CO2 isotope experiment was performed. The gas chromatography–mass spectrometry (GC–MS) analysis results are shown in Fig. 8. The overwhelming signals of m/z = 17 and m/z = 29 root in 13CO2 carbon source demonstrate that the produced CO and CH4 stem from photocatalytic reduction of CO2 rather than any other contaminant carbon species.
The mass spectra of (a) 13CH4 and (b) 13CO generated under 13CO2 atmosphere.
The cyclic stability of photocatalyst is an important criterion for judging the quality of the photocatalyst. As we know, CdS suffers from serious photocorrosion, which restricts the application in photocatalysis [Reference Tu, Zhou, Feng, Xu, Li, Wang, Xiao and Zou36]. Exactly, the yields of photoreduction CO2 to CO and CH4 of pure CdS are reduced by 85.3 and 95.6% after four cycles, indicating the extremely poor cyclic stability (Fig. S8). While those for BC-5 after four cycles are only reduced by 19.1 and 20.3% (Fig. S9), which are far below than those of CdS. The results show that the photocorrosion of CdS has been inhibited by forming heterojunctions between CdS and BiOI, and the cycle stability of the composites is greatly improved. Furthermore, the XRD patterns of BC-5 before and after four cycles almost have no change (Fig. S10). The result indicates that the crystal structure of the sample is stable and the sample can be reused. Therefore, CdS/BiOI composite is considered as an attractive photocatalyst used in photocatalytic CO2 reduction.
Possible photocatalytic mechanism
According to the band energy level analysis, the CB edge of CdS (−0.59 eV versus NHE) is more negative than that of BiOI (0.58 eV versus NHE), while the VB edge of BiOI (2.40 eV versus NHE) is more positive than that of CdS (1.73 eV versus NHE). Considering the band gap energy levels of BiOI and CdS, two main modes of charge separation can be considered: Z-scheme and double-charge transfer.
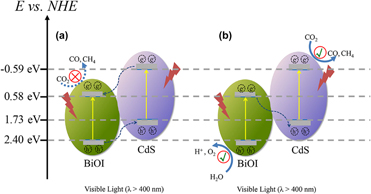
For photocatalytic CO2 reduction, the CB edge position of a semiconductor photocatalyst should be more negative than the reduction potential of CH4/CO2 (−0.24 V versus NHE) and CO/CO2 (−0.53 eV versus NHE). Meanwhile, the VB edge position should be more positive than the oxidation potential of O2/H2O (0.82 eV versus NHE) [Reference Tahir and Amin38]. Given that the photogenerated carriers transfer through the common double-charge transfer mode in the CdS/BiOI heterojunction, the electrons in the CB of BiOI (0.58 eV versus NHE) are unable to reduce CO2 [Fig. 9(a)]. Therefore, a Z-scheme transfer mode is applicable as follows. As shown in Fig. 9(b), under visible light irradiation (λ > 400 nm), the photogenerated electrons in the VB of BiOI and CdS can be excited up. Then, the photogenerated electrons in the CB of BiOI tend to transfer to the VB of CdS and recombine with the photogenerated holes of CdS. Thereby, a large number of electrons and holes accumulated on the CB of CdS and VB of BiOI, respectively. The enriched electrons on the CB of CdS likely reduce CO2 into CO and CH4 and holes on the VB of BiOI can oxidize water to produce oxygen. The Z-scheme heterojunction interface formed in the CdS/BiOI can effectively separate electron–hole pairs, resulting in enhanced photocatalytic CO2 reduction activity.
Schematic diagram of photoexcited electron–hole separation processes: (a) double-charge transfer mechanism and (b) Z-scheme mechanism.

To provide compelling evidence for Z-scheme transfer mode, the reactive species trapping experiments were performed to investigate the main active species in the photocatalytic process. The radical trapping test, which is an indirect method, is often used to determine several active species in the solution of photodegradation of rhodamine B (RhB) [Reference Zou, Wang and Wang39]. Ammonium carbonate (AC), isopropyl alcohol (IPA), and benzoquinone (BQ) were used as h+,·OH, and •O2− radical scavengers, respectively. As shown in Fig. S11, when AC, BQ, and IPA were introduced, the degradation rate of RhB decreases significantly. These results indicate that h+, •O2−, and •OH play a key role in the degradation of RhB. Considering that the CB bottom of BiOI is more positive than the standard reduction potential of  $E_{{{{{\rm{O}}_2}} / {{{\rm{O}}^{2 - }}}}}^\theta$ (−0.046 eV versus NHE), the electrons on BiOI have no capacity to reduce O2 into •O2− species. O2 is reduced by the photoelectrons clustered on the CB of CdS. That is to say, the Z-scheme mechanism is the charge transfer mode in CdS/BiOI composites.
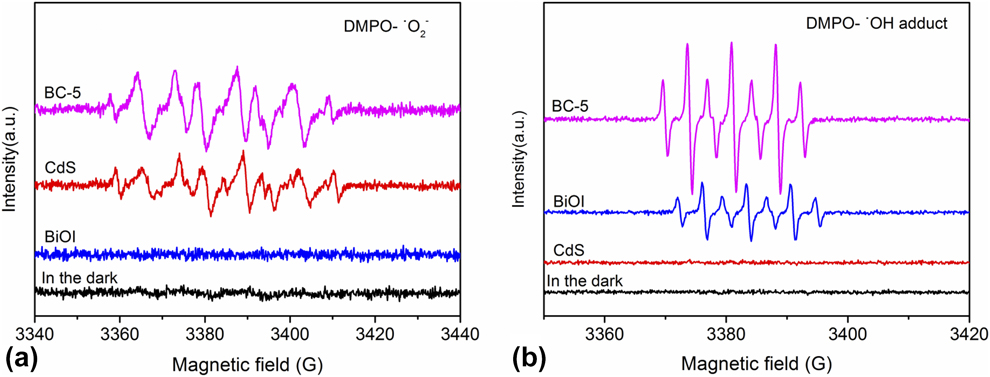
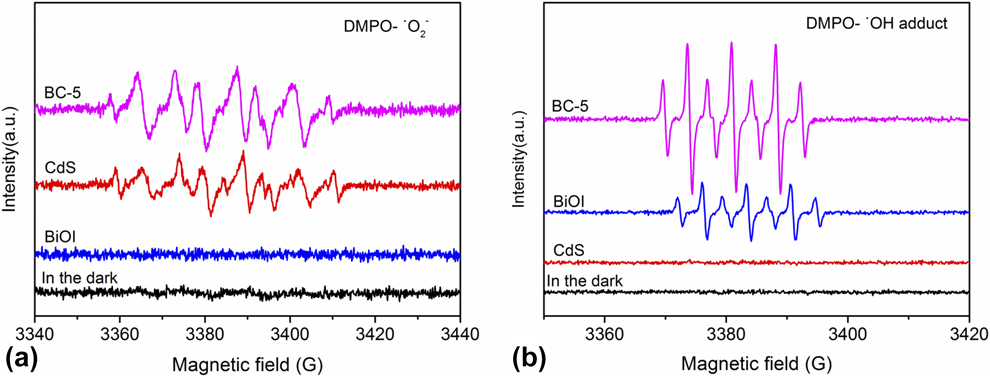
To further prove the generation of active species in the photocatalytic process, the electron paramagnetic resonance (EPR) tests of pure BiOI, CdS, and BC-5 were carried out. In the dark, no signals of DMPO-•O2− were detected for all the prepared samples. Similarly, no signals of DMPO-•O2− were detected for pure BiOI even under visible light irradiation, as shown in Fig. 10(a). While for CdS and BC-5, both exhibit enhanced •O2− signals and the characteristic peaks of •O2−, similar to the previous literature [Reference Ning, Ding, Lin, Lin, Zhang, Lin, Long and Wang40, Reference Song, Feng, Shi and Liu41]. Moreover, BC-5 exhibits stronger •O2− signals than CdS. The result implies that the •O2− can be enhanced in the presence of illumination for BC-5 during the photocatalytic reaction. This also proves that the photoinduced electrons in the CB of CdS are not transferred to the CB of BiOI. The •OH can be captured to form DMPO-•OH adduct [Reference Velasco, Maurino, Laurenti and Ania42]. Figure 10(b) shows the typical EPR spectrum of the DMPO-•OH adduct of pure BiOI, CdS, and BC-5. No signals of DMPO-•OH adduct were detected in dark for all the prepared samples, and there is no signal of DMPO-•OH adduct over pure CdS under the visible light irradiation. Moreover, the peak intensity of BC-5 is stronger than that of BiOI, indicating that BC-5 can produce more •OH. According to the results of reactive species trapping experiments and EPR tests, we can confirm that the charge transfer mode in CdS/BiOI composites is Z-scheme mechanism.
DMPO spin-trapping EPR spectra of BiOI, CdS, and BC-5. EPR signals of (a) DMPO-•O2− and (b) DMPO-•OH adduct.
The number of electrons consumed by CO2 reduction should be equal to the number of holes consumed by water oxidation [Reference Moustakas and Strunk43]. To verify charge balance during CO2 reduction, we detected the yield of O2, CO, and CH4 under visible light irradiation for 10 h (Fig. S12). The generation of 1 mol CO and 1 mol CH4 requires 2 and 8 mol electrons, respectively, whereas the formation of 1 mol O2 needs 4 mol holes. The total yields of CO and CH4 are 10.70 and 1.23 μmol/g, respectively, equivalent to the consumed electrons of 31.27 μmol/g. The total yield of O2 is 8.10 μmol/g, equal to the consumed holes of 32.40 μmol/g. The corresponding calculated results indicate that the holes consumed by water oxidation are equal to the electrons consumed by CO2 reduction. The balance of photogenerated electrons and holes is thus verified, and the oxidation of H2O is confirmed.
Combining the results of photocatalytic activity tests, free radical trapping test, EPR test, and oxygen content test, Z-scheme charge transfer mode is confirmed in the CdS/BiOI composites under our experimental conditions.
To investigate the interfacial charge separation efficiency, the transient photocurrents of CdS, BiOI, and BC-x were measured [Reference Duan, Liang, Lv, Li and Li44]. As can be seen from Fig. S13, photocurrent intensity follows the order of BC-5 > BC-6 > BC-4 > BC-3 > CdS > BiOI, suggesting the separation efficiency of photogenerated electrons and holes is improved by the formation of heterojunction between CdS and BiOI. BC-5 shows the most efficient separation of photogenerated electron–hole pairs, which is consistent with the results of photocatalytic activity. Electrochemical impedance spectroscopy (EIS) was performed to measure the transfer efficiency of photogenerated electron–hole pairs [Reference Li, Wu, Ho, Lv, Li, Li and Lee45]. As shown in Fig. S14, BC-x shows a smaller semicircle than pure CdS and BiOI, revealing that composites have a faster interfacial electron transfer capability. Among them, BC-5 exhibits the smallest semicircle, indicating that electrons migration speed of BC-5 is faster than others. Besides transient photocurrent and EIS, photoluminescence (PL) emission spectra also provide powerful supports for the efficient separation of electron–hole pairs by forming heterojunction (Fig. S15) [Reference Wei, Wang, Li, Zhang, Yao and Li27]. The PL intensity of BC-5 is lower than that of pure BiOI. It indicates that BC-5 exhibits higher separation efficiency of photogenerated charges after constructing heterojunctions with CdS. In general, the formation of Z-scheme heterojunction between CdS and BiOI not only greatly reduces the recombination of the photogenerated charges but also improves the charge transfer efficiency significantly.
Conclusions
In summary, a series of visible light–responsive CdS/BiOI composites were synthesized by depositing CdS nanoparticles on the surface of BiOI nanosheets in this work. The photoreduction CO2 activity test results show that all the as-synthesized composites exhibit enhanced photocatalytic activity compared with pure CdS and BiOI. The optimal composite BC-5 shows the best performance, achieving 3.32 μmol/g for CO and 0.54 μmol/g for CH4 after 3 h irradiation. The enhanced photoactivity of the composites is attributed to the efficient separation of the photogenerated electron–hole pairs via Z-scheme transfer mode. Furthermore, the stability of the samples is improved greatly in comparison with pure CdS, as testified by cycle tests.
Experimental
Materials
All the reagents, including bismuth nitrate pentahydrate (Bi(NO3)3·5H2O), potassium iodide (KI), cadmium acetate (Cd(CH3COO)2·2H2O), and thiourea (CN2H4S), were obtained from Sinopharm Chemical Reagent Co., Ltd. (Shanghai, China) and used without further purification.
Preparation of BiOI nanosheets
BiOI nanosheets were synthesized by the hydrothermal method. Ten milliliters of KI aqueous solution (0.5 mol/L) was dropped into 10 mL Bi(NO3)3·5H2O ethanol solution (0.5 mol/L) under magnetic stirring. The solution was stirred at room temperature for 1 h. Then, the solution was transferred to 25 mL autoclave and maintained at 180 °C for 12 h. The precipitates were collected by centrifugation and then washed with distilled water for several times. Finally, the obtained precipitates were dried at 70 °C for 12 h.
Preparation of CdS/BiOI composites
Cd(CH3COO)2·2H2O with different moles was dissolved in 50 mL of deionized water, and 0.25 mmol BiOI powder (0.088 g) was added to the above solution. Then, the mixture was treated by ultrasonic process for 0.5 h. Next, 10 mL of a certain concentration of thiourea aqueous solution (Table SI) was dropped into the above solution with vigorous stirring for 20 min. Finally, the mixture was heated at 90 °C for 2.5 h. The obtained product was washed with distilled water for several times and dried at 70 °C for 12 h.
According to the Cd/Bi molar ratio of synthetic materials, the prepared powders were labeled as BC-x (x = 3, 4, 5, or 6). Pure CdS was also prepared for comparison. To verify the actual percentage of CdS in the final CdS/BiOI composites, the EDS of elements and chemical analysis were carried out and the results are shown in Table SII. The results of EDS mapping show that the actual weight percentages of CdS in BC-x are 11.4%, 16.7%, 24.6%, and 30.4%, respectively.
Characterization
The crystal phase of the samples was characterized by X-ray diffractometer (XRD; PANalytical X′pert PRO). Field emission scanning electron microscopy (FESEM; Sigma 500) equipped with an EDS analyzer and a TEM (TECNAI G2 F20-S-TWIN) was used to observe the morphology of samples. Meanwhile, HRTEM was performed. Scan UV-vis spectrometer (Cary 5000) with integrating sphere detector was employed to determine the UV-vis DRS. The chemical components and valence states of samples were analyzed by XPS (PerkinElmer PHI 5300). BET surface area measurements were carried out by N2 adsorption–desorption at 77 K using a Quantachrome Autosorb-IQ2 instrument. The CO2 adsorption–desorption measurements were conducted on the Quantachrome Autosorb-IQ2 instrument under the ambient condition of 273 K. CO2-TPD was recorded by Autosorb-iQ. 13CO2 isotope experiment was performed with a GC–MS (Agilent GC-7890B and OmniStar GSD). A Bruker EPR EMX-Plus spectrometer was used for measurements of the EPR signals of radical spin trapped by DMPO (5,5-dimethyl-1-pyrroline N-oxide). The PL spectra were investigated on a Hitachi F-4600 spectrometer equipped with an EPL488 laser diode.
Photoelectrochemical measurements
Photoelectrochemical measurements of the samples were measured by a CHI 660E electrochemical workstation (Shanghai Chenhua Instruments Co., Ltd.) with a common three-electrode system. Pt wire was used as the counter electrode, Ag/AgCl (saturated KCl) was used as the reference electrode, and photocatalyst is the working electrode. The electrolyte was 0.5 mol/L Na2SO4 solution. A 300 W xenon arc lamp with UV cutoff filter (λ > 400 nm) was used as light source. The procedure for preparing the working electrode is as follows: 0.040 g photocatalyst was dispersed in 5 mL distilled water, then 200 μL perfluorinated resin solution was added to the above solution. Then, the mixture was coated on 2.0 cm × 1.0 cm fluorine-doped SnO2 (FTO) glass substrates by dropping method. Last, the working electrodes were dried at 70 °C for 1 h. Transient photocurrent and EIS were carried out at 1.0 V (versus Ag/AgCl) and 0.6 V (versus Ag/AgCl) in Na2SO4 aqueous solution, respectively.
Photocatalytic activity tests
Photocatalytic activity of the as-obtained catalysts was determined in gaseous phase in a 180 mL stainless steel container. A 300 W xenon arc lamp with a UV cutoff filter (λ > 400 nm) was used as light source. 0.020 g of the catalyst powders were taken into the reaction container, then the container was stamped with the seal. Before entering the reaction gas, the reaction setup was vacuum-treated and then high-purity CO2 gas (99.995%) as purging and reaction gas was introduced into the reaction system for several times. The compressed high-purity CO2 gas was passed through a water bubbler to generate a mixture of CO2 and H2O vapor. This operation was repeated three times. Then, the container was filled with CO2 gas until the system pressure was up to 0.3 MPa. Finally, the xenon lamp was turned on and the powders were irradiated under visible light. Gas products from the reactor were fed into a 7820A gas chromatograph (GC; Agilent Technology) at an interval of 1 h to detect carbon monoxide and methane. Besides, control experiments were carried out to confirm that the carbon source of formed CO and CH4 was CO2 reactants.
Radical trapping experiments
The radical trapping experiment was performed by photodegradation of RhB. The light source is the same as that used in photocatalytic CO2 reduction activity test. Before adding catalyst, a certain amount of scavenger was added to RhB solution (10 mg/L), and the concentration of scavenger was controlled at 0.01 mol/L. Then, 50 mg of catalyst was added to the above solution and the solution was stirred in darkness for 60 min to achieve adsorption–desorption equilibrium. The samples were withdrawn every 15 min and centrifuged to separate solid particles, then the resulting RhB solution was analyzed. The concentration of RhB solution was evaluated by TU-1810PC UV-vis absorption spectrometry at 554 nm. The relationship between C/C 0 and reaction time was plotted to express photodegradation activity. C 0 represents the concentration of RhB after adsorption process and C represents the time-dependent concentration of RhB on irradiation.
Supplementary material
To view supplementary material for this article, please visit https://doi.org/10.1557/jmr.2019.354.
Acknowledgments
We would like to thank the financial supports of the National Natural Science Found of China (Nos. 2167117 and 21471133) and National Training Program of Innovation and Entrepreneurship for Undergraduates (No. 2019cxcy492).