Introduction
The compositions and assemblages of common minerals in igneous rocks provide invaluable information on the origin of the magmas, the evolving physicochemical conditions of the melt during crystallisation, and post-solidus modifications of the resulting rocks (Abbott and Clarke, Reference Abbott and Clarke1979; Helmy et al., Reference Helmy, Ahmed, El Mahallawi and Ali2004). Amphibole and biotite thermobarometry have been used widely to estimate the emplacement pressure (P) and temperature (T) of calc-alkaline igneous rocks (Anderson and Smith, Reference Anderson and Smith1995; Putirka, Reference Putirka, Putirka and Tepley2008; Ridolfi et al., Reference Ridolfi, Renzulli and Puerini2010). Similarly, the halogen (F, Cl) contents of biotite and hornblende have been used to investigate the characteristics and the evolution of the magmas and associated hydrothermal fluids (Imai, Reference Imai2000; Selby and Nesbitt, Reference Selby and Nesbitt2000; Boomeri et al., Reference Boomeri, Nakashima and Lentz2009, Reference Boomeri, Nakashima and Lentz2010; Xianwu et al., Reference Xianwu, Ruizhong, Hanley, Mungall, Jiantang, Linbo, Kaixing, Yan, Hongli and Xiaoyan2009; Siahcheshm et al., Reference Siahcheshm, Calagari, Abedini and Lentz2012).
Zircon (ZrSiO4) is commonly used as a geothermometer in studies of crustal petrogenesis to determine temperatures of magmatic systems and high-grade metamorphism. The relationship between Zr concentrations of granitic melts and the Ti concentration in zircons are used to calculate the crystallisation temperatures (Watson and Harrison, Reference Watson and Harrison2005). As the Ti concentration of zircon is dependent on melt composition and temperature while being only weakly dependent on pressure (Watson and Harrison, Reference Watson and Harrison2005), this permits calculation of zircon crystallisation temperature and, by extension, the temperature of the melt.
The textures and compositions of igneous rocks provide important information about magmatic processes. Textural features depend on the rate of magma cooling and crystal nucleation, growth rate and residence time (Vernon, Reference Vernon2004). Quantitative analyses of textures (i.e. crystal size, form and orientation) are a basis to understand the physical characteristics of magma crystallisation (Higgins, Reference Higgins2006; Jerram and Higgins, Reference Jerram and Higgins2007). Crystal size distribution (CSD) is one of the most common quantitative textural measurement methods for igneous rocks rich in plagioclase feldspar (Cashman and Marsh, Reference Cashman and Marsh1988; Higgins, Reference Higgins2006). As employed here, CSD provides a methodology to use crystal abundances and sizes to infer magmatic processes, and a relationship between the natural logarithm of the population density (n) versus crystal length (L) can be used to interpret single- or multi-stage crystallisation histories (Cashman and Marsh, Reference Cashman and Marsh1988; Higgins, Reference Higgins2002; Castro et al., Reference Castro, Cashman and Manga2003).
This paper presents whole-rock and mineral compositions obtained by electron microprobe analysis (EMPA), rare-earth element (REE) abundances obtained by split-stream laser ablation of zircon, Ti-in-zircon, zircon saturation thermometry, biotite and apatite crystallisation temperatures and CSD from the quartz diorite to tonalite rocks of the Ardestan area. Babazadeh et al. (Reference Babazadeh, Ghorbani, Bröcker, D'Antonio, Cottle, Gebbing, Mazzeo and Ahmadi2017) presented isotopic evidence to evaluate the magmatic processes related to the parental Ardestan magmas. The principal objective of this investigation is to explore mineralogical evidence that bears on our earlier geodynamic interpretation and to estimate the P–T conditions of pluton emplacement. We present zircon trace-element data to evaluate further the magmatic or hydrothermal characteristics of the Ardestan samples. Our data reveal a contribution of Cadomian crust as a mixing component in their petrogenesis and indicates that Ardestan rocks have undergone different post-magmatic conditions than the surrounding altered potassic and phyllic alteration zones at Kahang and the Zafarghand porphyry copper deposit (Afshooni et al., Reference Afshooni, Mirnejad, Esmaeily and Asadi Haroni2013). We attribute the control of incorporation of F and Cl in biotite to X Mg [=Mg2+/(Mg2++Fe2+)], and rule out the infiltration of hydrothermal fluids beyond the alteration zones.
Geological setting
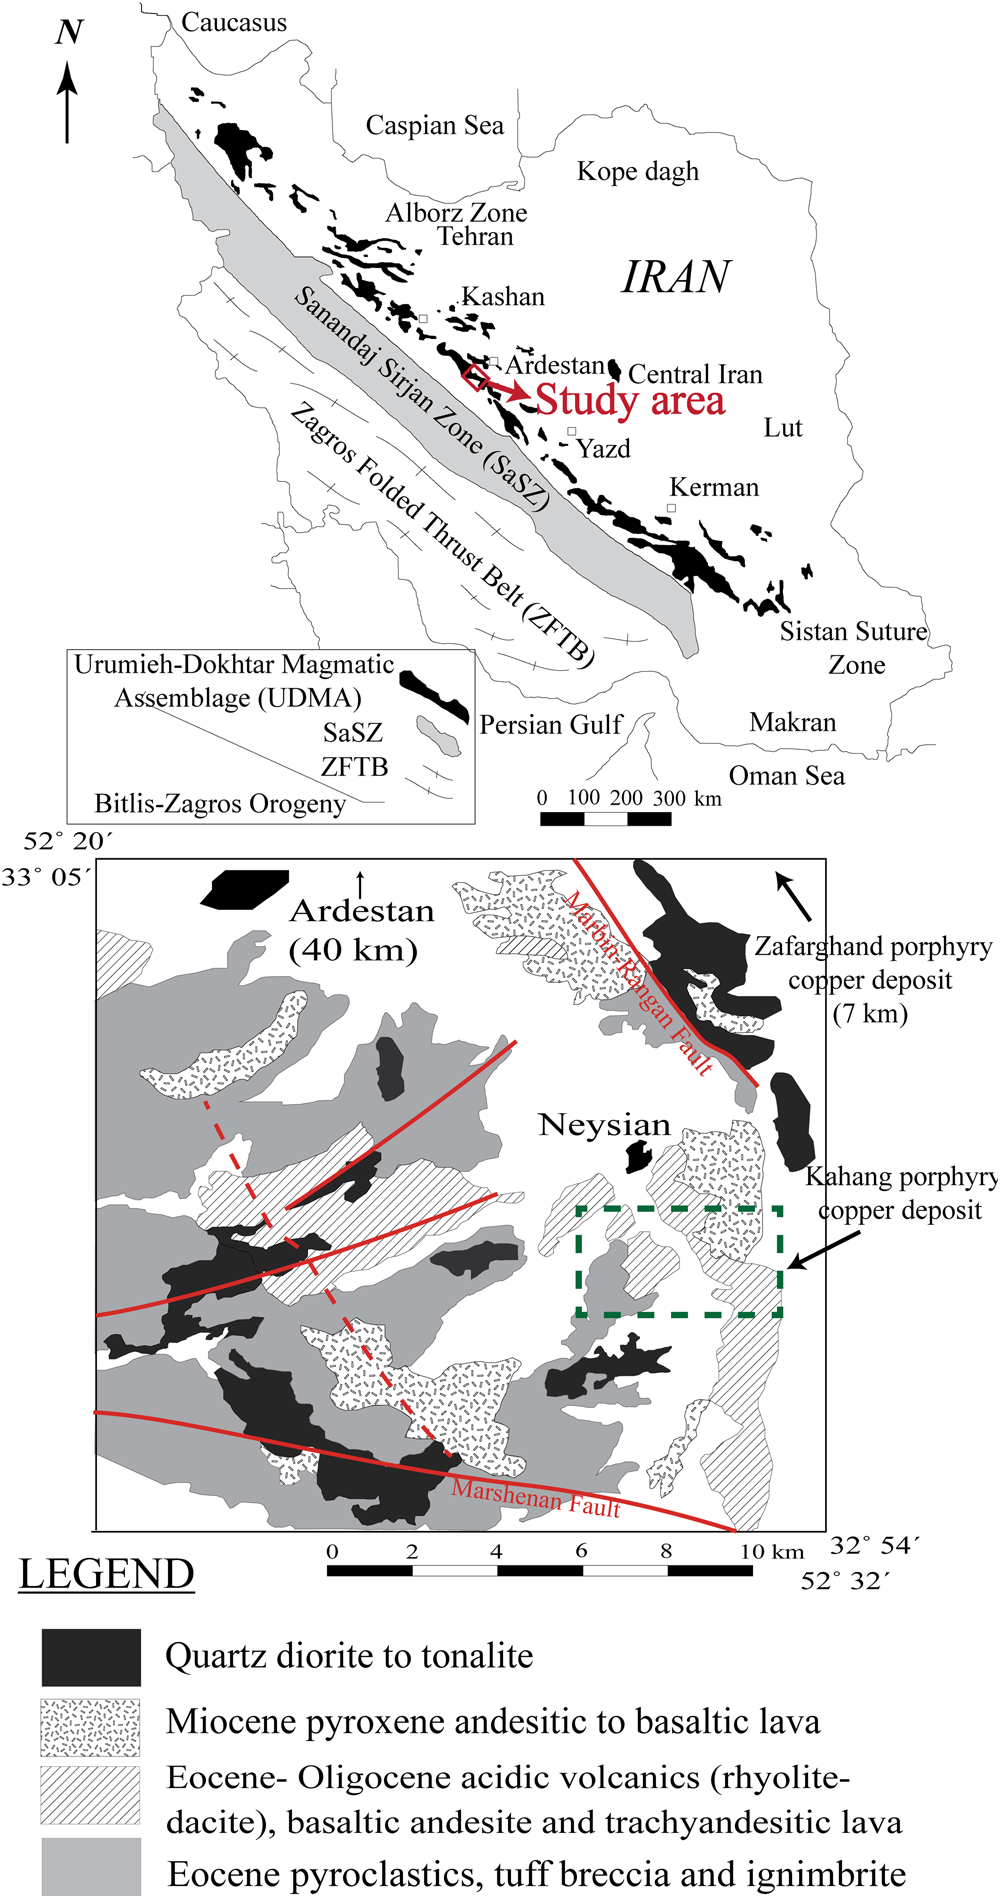
The Zagros orogenic belt (Fig. 1) consists of three parallel tectonic zones (Alavi, Reference Alavi2004): (1) the Urumieh–Dokhtar magmatic assemblage; (2) the Sanandaj–Sirjan zone; and (3) the Zagros folded-thrust belt. The Urumieh-Dokhtar magmatic assemblage is characterised by Cenozoic extrusive and intrusive rocks of Eocene–Quaternary age and associated volcanoclastic units. Magmatic rocks in the Urumieh-Dokhtar magmatic assemblage are interpreted to have formed as a consequence of the subduction of Neotethyan oceanic lithosphere beneath the Iranian plate during the Mesozoic and Cenozoic (e.g. Chiu et al., Reference Chiu, Chung, Zarrinkoub, Mohammadi, Khatib and Iizuka2013; Azizi et al., Reference Azizi, Beiranvand and Asahara2015; Nouri et al., Reference Nouri, Azizi, Stern, Asahara, Khodaparast, Madanipour and Yamamoto2018). Late Paleozoic plutons have rarely been recognised in this region (e.g. Bea et al., Reference Bea, Mazhari, Montero, Amini and Ghalamghash2011; Alirezaei and Hassanzadeh, Reference Alirezaei and Hassanzadeh2012). Regardless of protracted and presumably continuous subduction along the northern Neotethyan margin during most of the Mesozoic and Cenozoic, arc volcanism across the Urumieh-Dokhtar magmatic assemblage appears to be dominated by an Eocene magmatic pulse or ‘flare-up’ (Berberian and King, Reference Berberian and King1981; Omrani et al., Reference Omrani, Agard, Whitechurch, Benoit, Prouteau and Jolivet2008; Verdel et al., Reference Verdel, Wernicke, Hassanzadeh and Guest2011). Verdel et al. (Reference Verdel, Wernicke, Hassanzadeh and Guest2011) argued that this episode of increased magmatic activity lasted for ~17 m.y. (from 55 to 37 Ma). Rossetti et al. (Reference Rossetti, Nasrabady, Theye, Gerdes, Monie, Lucci and Vignaroli2014) attributed an Eocene age to the transition from an extensional to a compressional plate margin along the Arabia–Eurasia convergence zone, which caused perturbation of the stress regime in the upper plate of the Neotethyan subduction system. The Urumieh-Dokhtar magmatic assemblage records abundant Tertiary magmatism, mainly related to continental arc (Berberian and Berberian, Reference Berberian and Berberian1981; Moien-Vaziri, Reference Moien-Vaziri1985; Babazadeh et al., Reference Babazadeh, Ghorbani, Bröcker, D'Antonio, Cottle, Gebbing, Mazzeo and Ahmadi2017, Reference Babazadeh, Ghorbani, Cottle and Bröcker2019) or island-arc settings (Alavi, Reference Alavi1996; Shahabpour, Reference Shahabpour2007).
Simplified overview map of Iran showing the major structural units (modified after Alavi, Reference Alavi1996) and the location of the area investigated. SaSZ – Sanandaj–Sirjan zone; ZFTB – the Zagros folded-thrust belt.

The area investigated is located ~40 km south of Ardestan in the central part of the Urumieh-Dokhtar magmatic assemblage (Fig. 1). The plutonic rocks are primarily quartz diorites and tonalites exposed discontinuously across a ~16 km ×12 km area. The Eocene volcanic succession lies unconformably on the Triassic unit and begins with light-green tuff and nummulitic limestone of Early-to-Middle Eocene age (Amidi, Reference Amidi1975). This fossiliferous unit is overlain by a sequence of volcanic and pyroclastic rocks, including basaltic, andesitic, acidic volcanics (rhyolite–dacite), tuff breccias, and ignimbrites that erupted in the Late Oligocene to Early Miocene.
Tectonic evolution of the central part of the Urumieh-Dokhtar magmatic assemblage is interpreted in terms of two main stages: (1) formation of main thrusts during shortening and exhumation of older rocks in the Urumieh-Dokhtar magmatic assemblage after the Eocene–Oligocene; and (2) transpressional movements reactivating the main thrust faults to reverse-dextral strike-slip faults during the Pliocene–Quaternary (Beygi et al., Reference Beygi, Nadimi and Safaei2016). The present-day deformation of the Urumieh-Dokhtar magmatic assemblage is dominated mostly by strike-slip movements. These two stages are interpreted as reflecting a change in the convergence vector between Arabian and Eurasian plates (Beygi et al., Reference Beygi, Nadimi and Safaei2016). The Ardestan plutonic bodies are associated with the NW–SE- and E–W-trending Marbin–Rangan and Marshenan Faults (Fig. 1), intruded volcanic rocks of Oligocene–Early Miocene age (Yeganehfar et al., Reference Yeganehfar, Ghorbani, Shinjo and Ghaderi2013); available data for the age of these volcanic and plutonic rocks range from 35 to 10 Ma (Babazadeh et al., Reference Babazadeh, Ghorbani, Bröcker, D'Antonio, Cottle, Gebbing, Mazzeo and Ahmadi2017, Reference Babazadeh, Ghorbani, Cottle and Bröcker2019).
Analytical methods
Major- and trace-element abundances were determined on 10 samples (Supplementary Table S1). Rock chips were washed with deionised water and then dried in an oven at 120°C. Subsequently the material was checked for quality under a binocular microscope and ~50 g of the freshest pieces were handpicked for pulverisation. The samples were washed again with deionised water and dried at 120°C; powders were produced in a steel mill. Aliquots (5 g) of the powdered samples were prepared for determination of major elements, LOI and Zr concentration. Geochemical analyses were performed at the Geochemical Laboratory at the Geological Survey of Iran using X-ray fluorescence (Philips PW 2404 X-RAY Spectrometer) (Table S1). Precision is ±1–5% for major elements, with the exception of P (<10%).
Zircon was separated from three samples using standard crushing, heavy liquid, and isodynamic separation techniques (Bulgariu, Reference Bulgariu2002) at the Geological Survey of Iran. Zircon trace-element data were acquired simultaneously using laser ablation ‘split stream’ instrumentation consisting of a Photon Machines Excimer 193 nm laser ablation unit coupled to a Nu Plasma multicollector inductively coupled plasma mass spectrometer and an Agilent 7700S quadrupole inductively coupled plasma mass spectrometer, housed at the University of Santa Barbara, California (for detailed methodology see Cottle et al., Reference Cottle, Waters, Riley, Beyssac and Jessup2011, Reference Cottle, Burrows, Kylander-Clark, Freedman and Cohen2013; Kylander-Clark et al., Reference Kylander-Clark, Hacker and Cottle2013).
Seven thin sections were selected for quantitative optical microscopy, electron microprobe analysis and CSD studies. Mineral compositions (plagioclase feldspar, amphibole and biotite) were analysed at the Pennsylvania State University Materials Research Institute using a Cameca SX Five Electron Probe Micro Analyser. Analyses were performed at 15 kV accelerating voltage and 20 nA probe current. The beam was operated in spot mode with a beam diameter of <1 µm. Most elements (Mg, Al, Si, Ca, Mn, Fe, P, Zn, Sr, F and Cl) were measured for 30 s; Na and K were measured for 20 s; and Ti, Cr and Ni were measured for 60 s. Prior to each session the microprobe accuracy and precision were optimised through repeat analysis of natural and synthetic standards. Mosaic images were obtained at the Geological Survey of Iran for quantifying mineral abundance and size. Measured parameters include length, width, area and crystal orientation. The mosaics were used to draw precise images of plagioclase crystals in preparation for measurement of crystal length and width using ImageJ (NIMH, 2019) and JMicroVision 1.2.7 software (Roduit, Reference Roduit2019). The procedure was monitored with continual comparison with optical images and direct microscope investigation. The CSDslice template (Morgan and Jerram, Reference Morgan and Jerram2006) and database were used to estimate three-dimensional crystal habits from the two-dimensional measurements. These data were input to CSD Corrections 1.6.0 software (Higgins, Reference Higgins2006) environment to draw CSD patterns (Fig. 10).
Results
Petrography
Medium-grained quartz dioritic and tonalitic rocks are petrographically nearly identical, and display distinctive mineral assemblages that include plagioclase feldspar (~70 vol.%; grain size <4 mm), quartz (<22 vol.%), hornblende (~4–8 vol.%; grain size <0.5 mm) and biotite (4–8 vol.%) (Fig. 2). All plutonic rocks contained accessory Fe–Ti oxides + apatite + zircon ± titanite. Plagioclase feldspar occurs mainly as euhedral-to-subhedral tabular crystals with well-developed twin lamellae; most plagioclase crystals are zoned. Hornblende commonly occurs as subhedral-to-anhedral grains. Anhedral grains of quartz occur in diverse sizes (2–5 mm) (Fig. 2a,b). Brown biotite occurs commonly as euhedral-to-subhedralgrains with small inclusions of apatite and zircon (Fig. 2c,d). In some instances, hornblende, biotite and subordinate magnetite occur as interstitial clots between quartz and plagioclase. Texturally and mineralogically, the Ardestan plutonic rocks are typical I-type granitoids with no mineralogical preferred orientation or solid-state deformation textures (Chappell and White, Reference Chappell and White1974, Reference Chappell and White.2001). The analysed crystals of plagioclase and amphibole show a granular texture, are subhedral in form, and lack reaction rims, consistent with equilibrium crystallisation (Fig. 2) and an important prerequisite for the application of the Al-in-hornblende geobarometer (Hammarstrom and Zen, Reference Hammarstrom and Zen1986; Schmidt, Reference Schmidt1992; Anderson and Smith, Reference Anderson and Smith1995; Stein and Dietl, Reference Stein and Dietl2001).
Photomicrographs of Ardestan plutonic rocks. Mineral assemblages of plagioclase, hornblende and biotite in the medium-grained quartz dioritic – tonalitic rocks. (a) Sample AR14; (b) sample AR10; (c) sample AR2; and (d) sample AR22. Pl = plagioclase; Hbl = hornblende; Bt = biotite; Qtz = quartz.

Whole-rock geochemistry
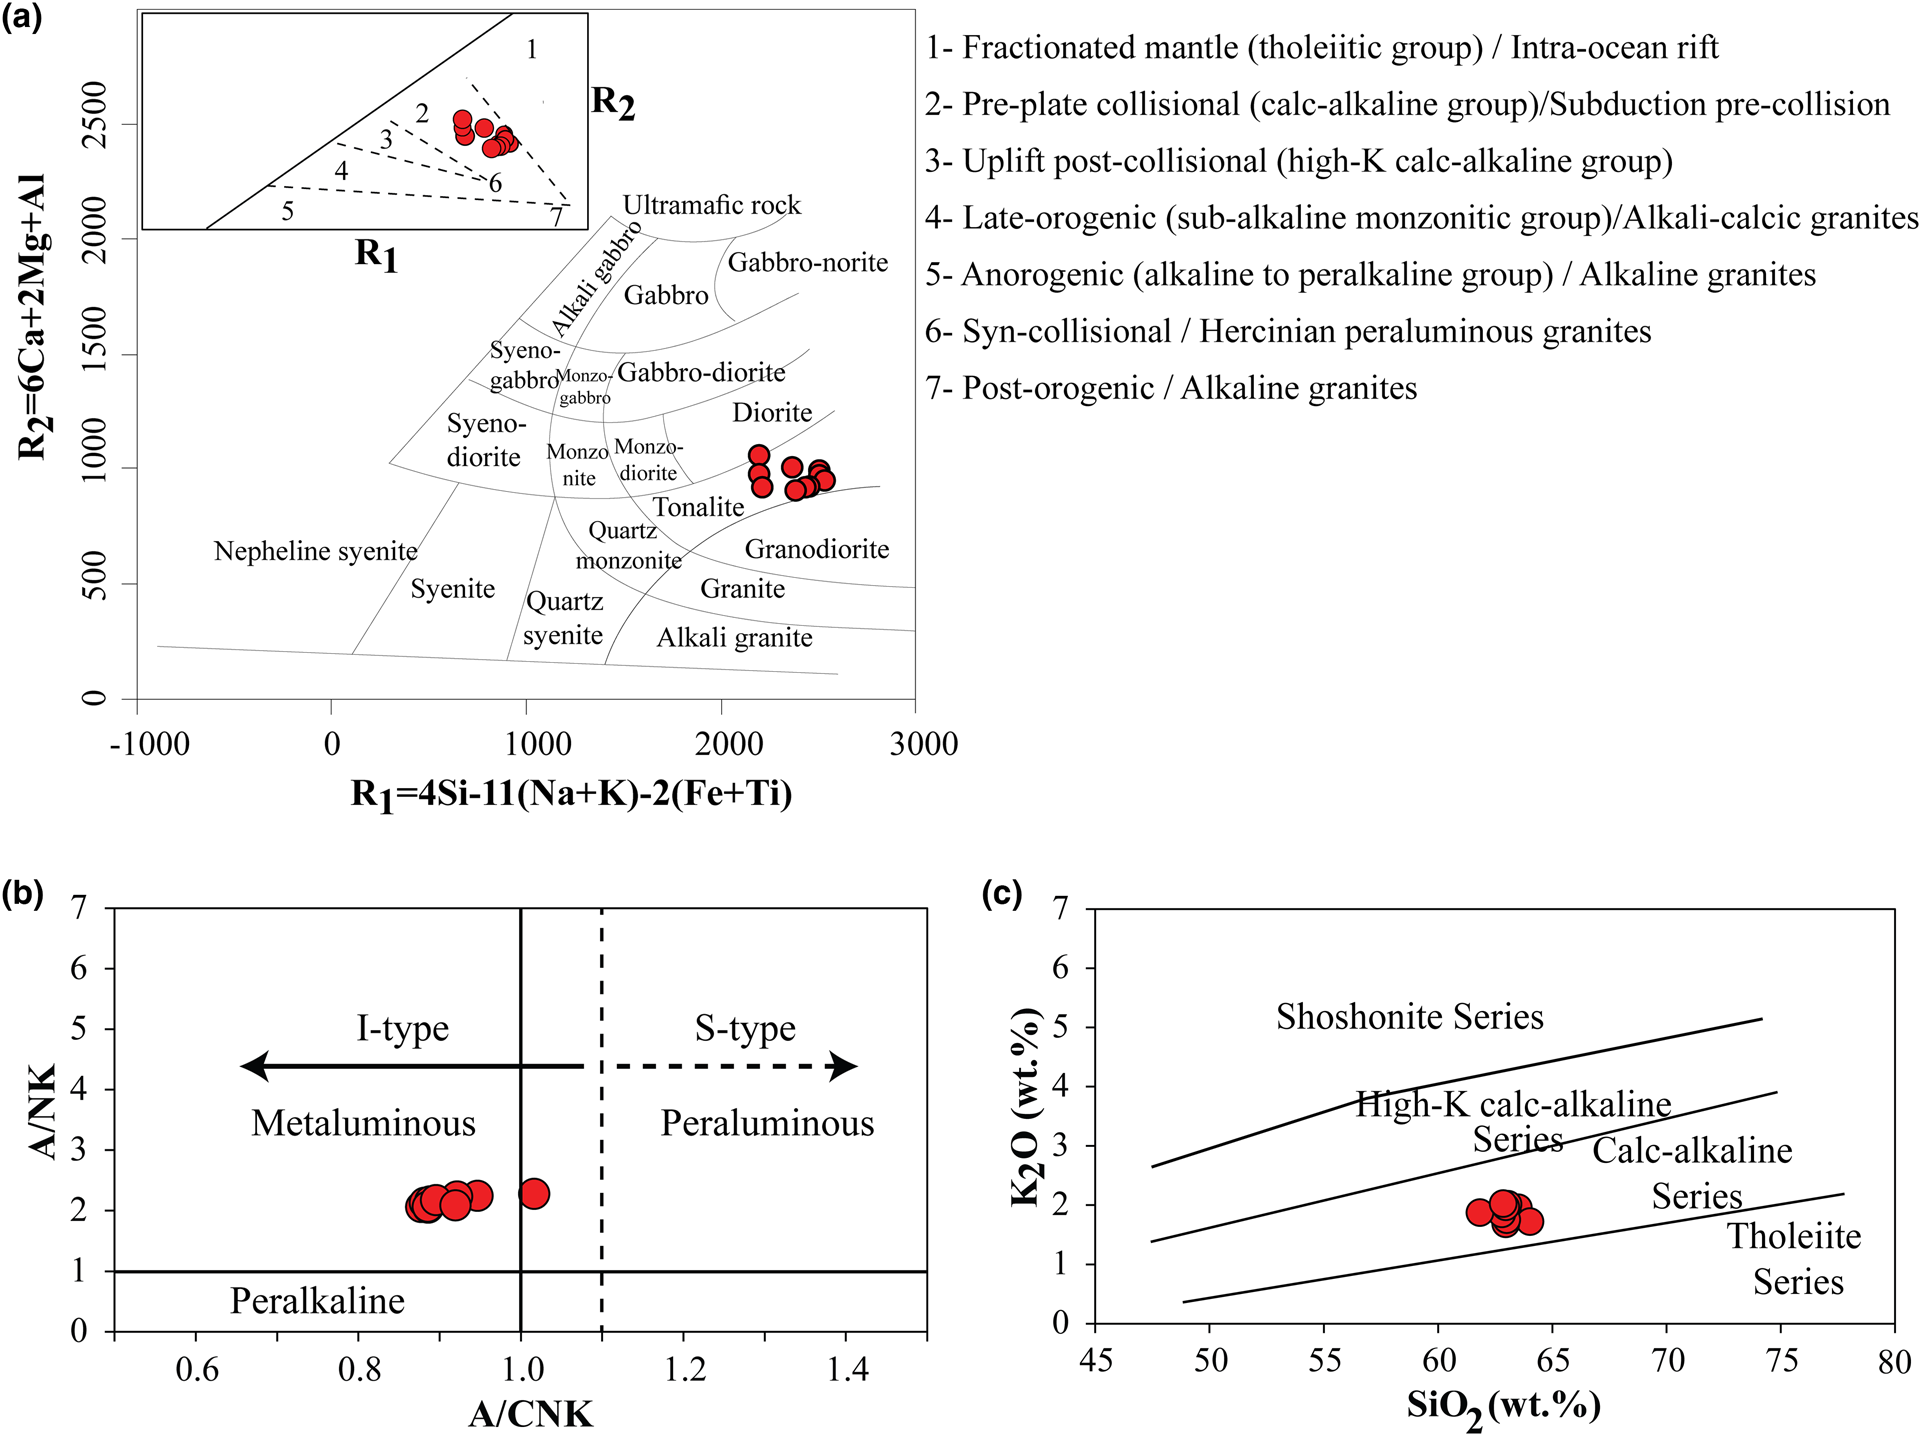
The Ardestan plutonic rocks are geochemically and petrographically characterised as calc-alkaline tonalites. Petrographic investigations reveal that most of the samples have been subjected to low degrees of alteration, which is also evident from their LOI contents (0.73–1.20 wt.%). The samples span a narrow compositional range with SiO2 contents between 61.85–64.03 wt.% and bulk-rock Zr between 78–192 ppm (Table S1). The bulk compositions place these rocks in the diorite–tonalite field on an R 1–R 2 diagram (De La Roche et al., Reference De La Roche, Leterrier, Grande Claude and Marchal1980; Fig. 3a), consistent with petrographic observations. The rocks are metaluminous, with A/CNK values clustering around 0.86–0.95 (Fig. 3b; Zen, Reference Zen1986), and are classified as calc-alkaline on the basis of their K2O and SiO2 contents (Fig. 3c). The rocks have sodic compositions with Na2O/K2O ≈ 5 and can be classified as magnesian I-type granites on the basis of low Fe#, (FeOtot/[FeOtot+MgO] <0.7).
Bulk geochemical classification diagrams for plutonic rocks from the Ardestan intrusions. (a) The parameters R 1 and R 2 (De la Roche et al., Reference De La Roche, Leterrier, Grande Claude and Marchal1980) and multi-cation tectonic discrimination diagram of Batchelor and Bowden (Reference Batchelor and Bowden1985) indicate a calc-alkaline tonalitic to dioritic composition. (b) A/CNK vs. A/NK (Maniar and Piccoli, Reference Maniar and Piccoli1989) indicate that the melts are metaluminous I-type granitoids. (c) SiO2vs. K2O variations demonstrate that the samples belong to the calc-alkaline series.

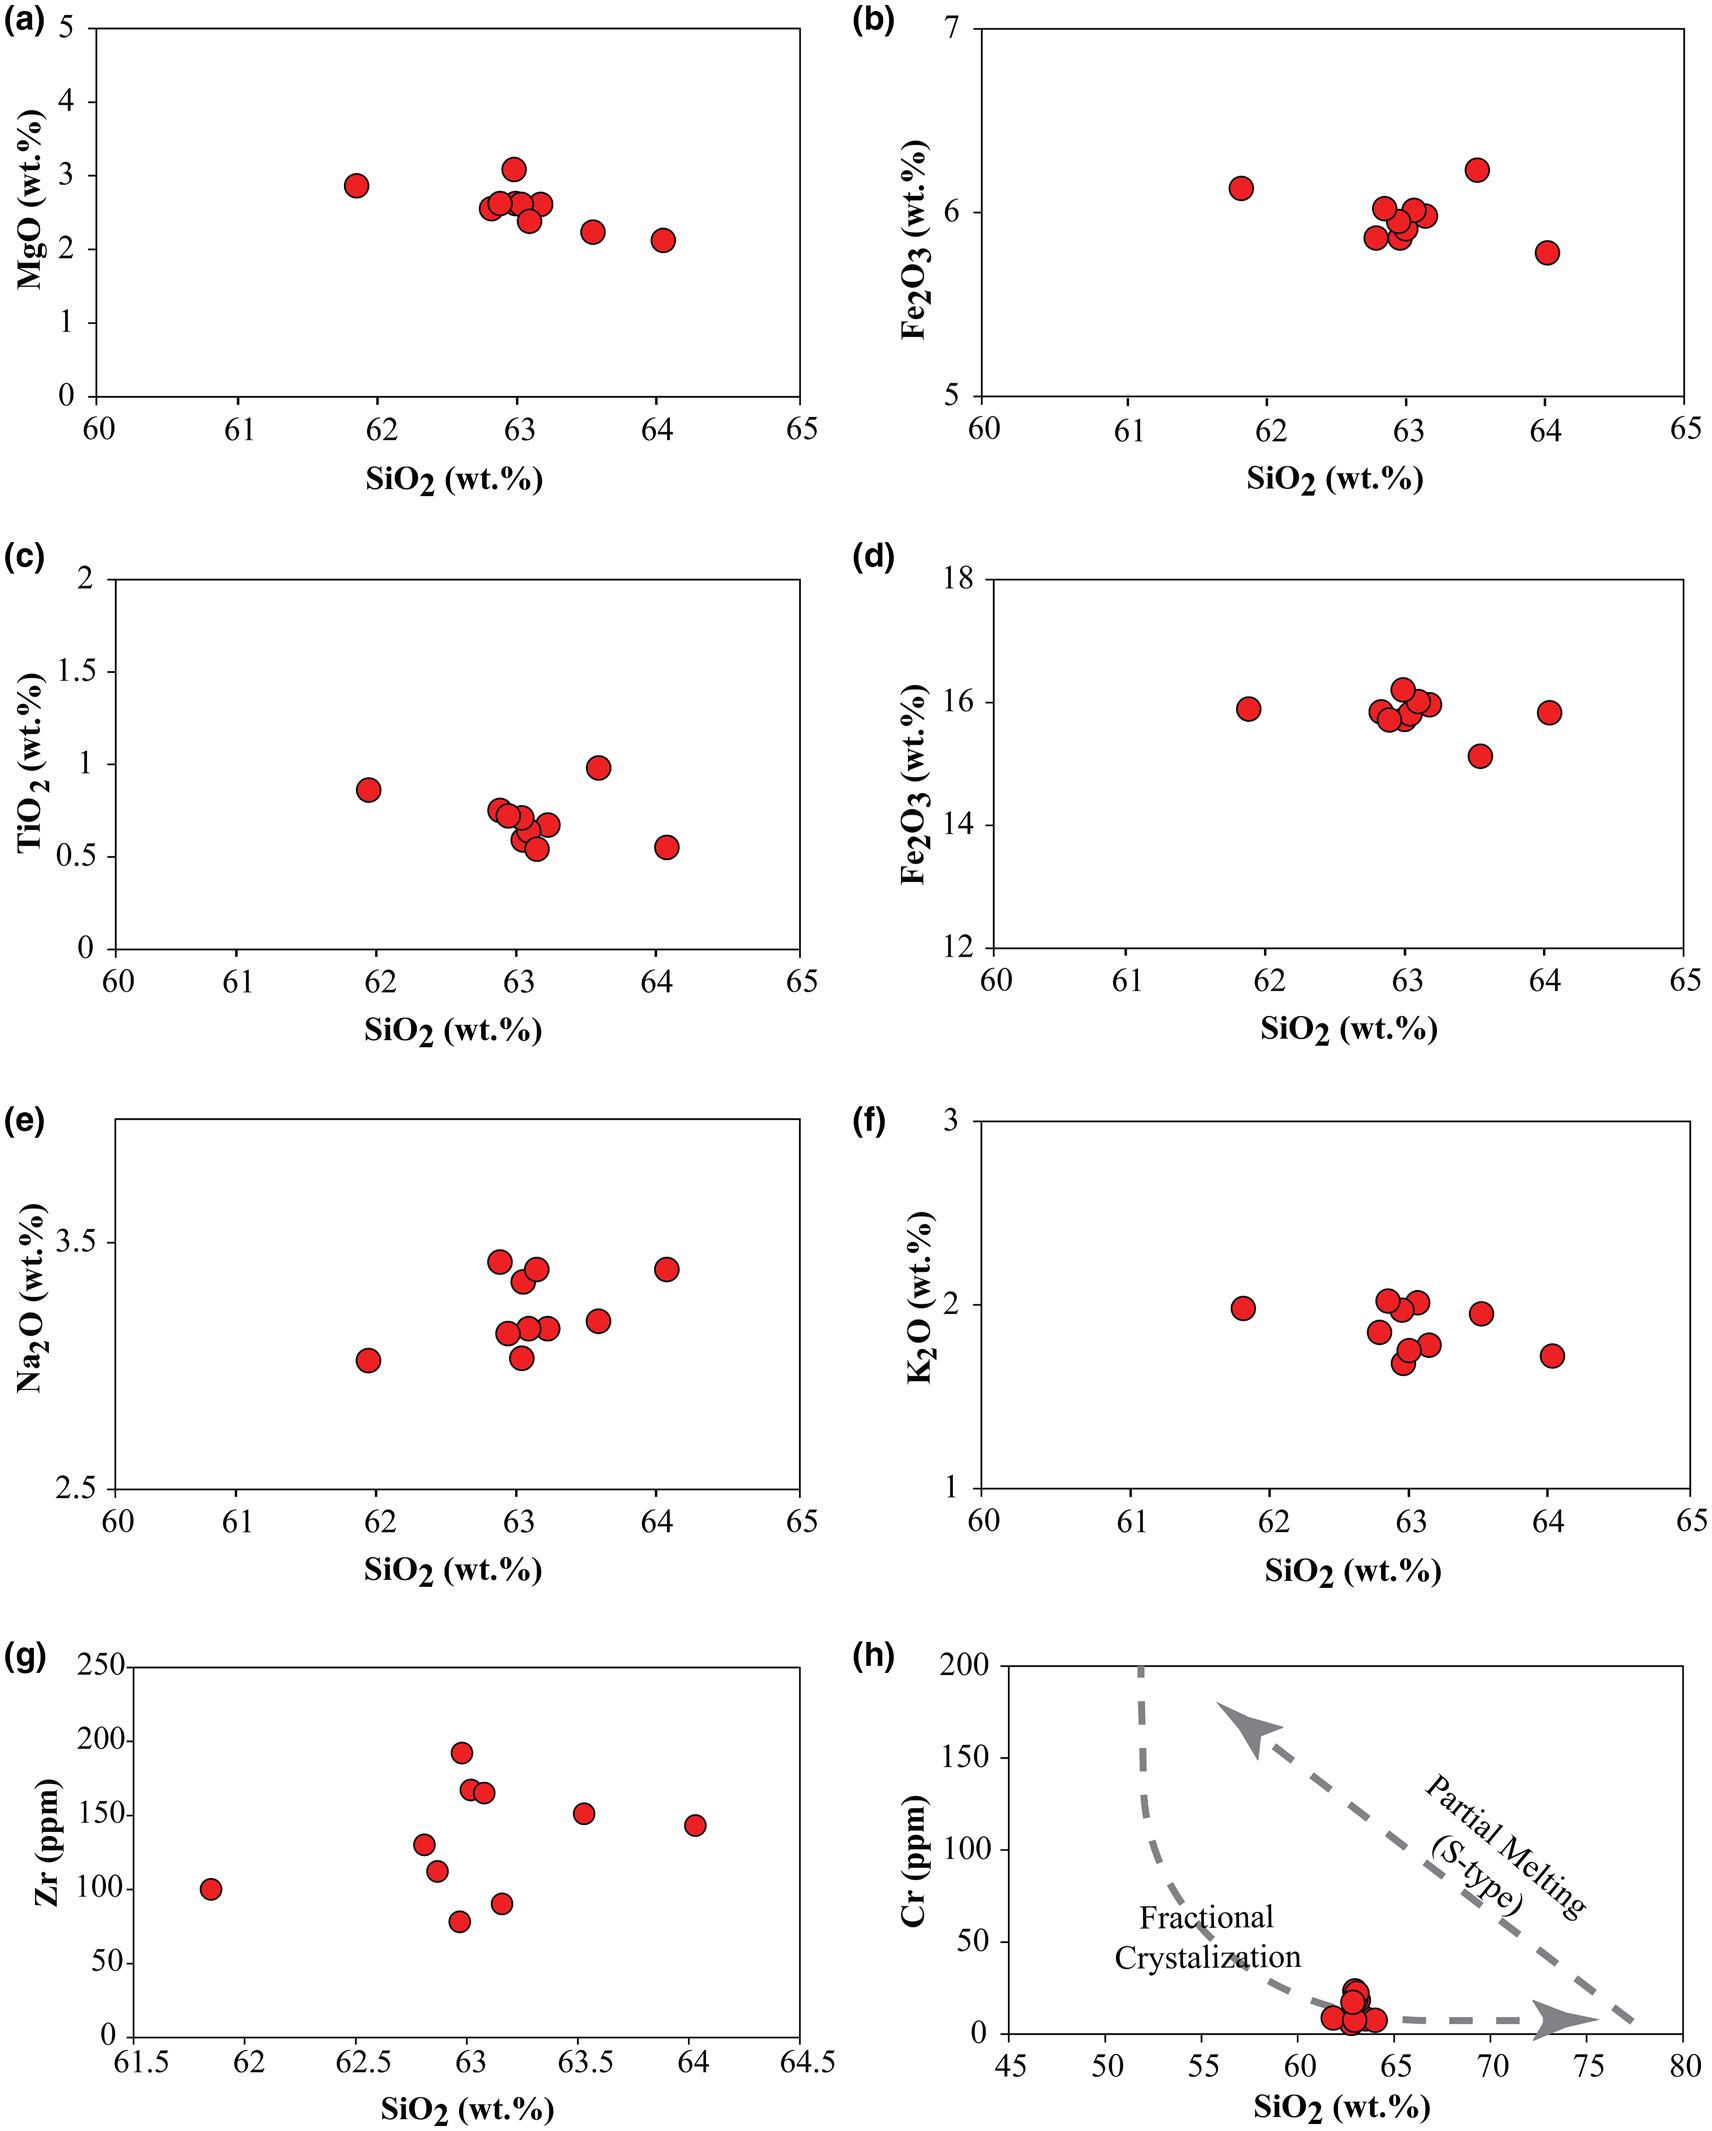
The Ardestan plutonic rocks have relatively high Mg# (0.42 to 0.51) (Table S1), indicating the involvement of basic components that may include mantle-derived magmas (Rapp and Watson, Reference Rapp and Watson1995), and are classified as ‘pre-collisional’ on an R 1–R 2 diagram (Fig. 3a). On Harker variation diagrams, the plutonic rocks exhibit overall linear trends for most major elements (Fig. 4). Coherent trends on the diagrams suggest that fractional crystallisation has played a dominant role in the evolution of these rocks. Abundances of Al2O3, Fe2O3, MgO and TiO2 decrease with increasing SiO2, whereas Na2O increases. These variations are consistent with petrographic observations indicating that plagioclase, hornblende and magnetite were the major differentiating phases (Kamgang et al., Reference Kamgang, Chazot, Njonfang, Ngongang Tchuimegnie and Tchoua2013). Low Cr contents (<40 ppm) in the plutons further support the role of fractional crystallisation process in their petrogenesis (Foden et al., Reference Foden, Turner, Sandiford, Mitchell, Elliot, Bay, Valley and Hill2002; Fig. 4h)
Major- and selected trace-element Harker variation diagrams from the Ardestan plutonic rocks.

Plagioclase feldspar composition
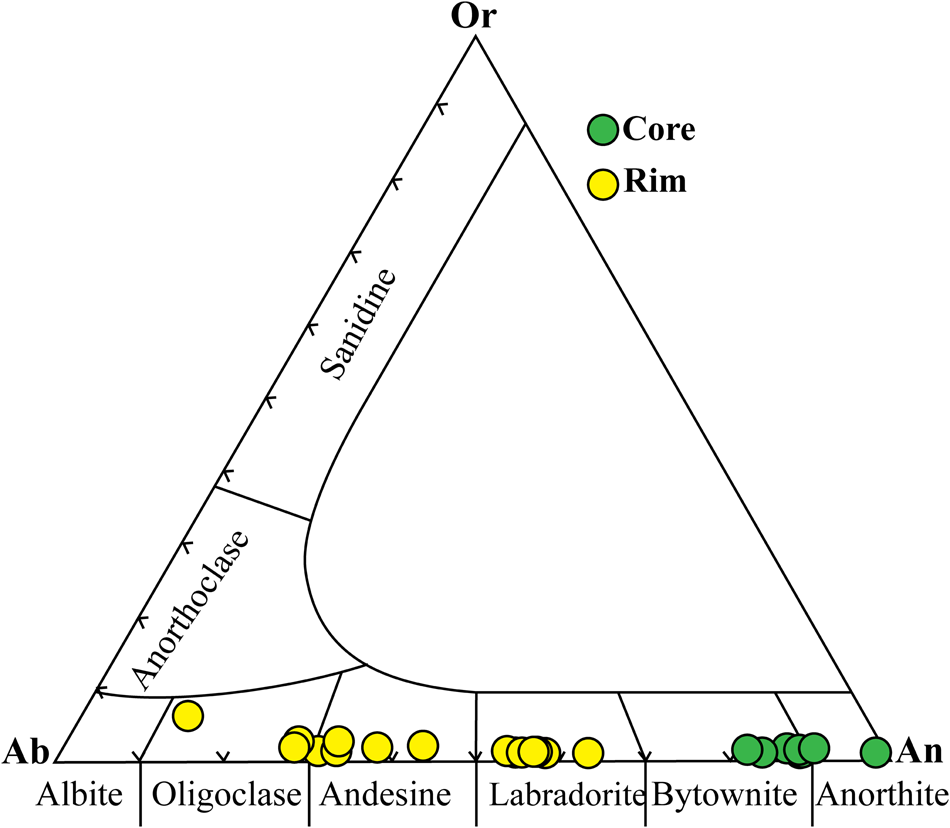
Plagioclase feldspar is the most abundant mineral in the rocks investigated. It occurs as phenocrysts, micro-phenocrysts and microlites. Core compositions are mainly bytownite (An80–90), whereas rims are labradorite and andesine (An30–67). (Table S2, Fig. 5). This feature is consistent with a significant role for fractional crystallisation affecting the evolving magma composition in the chamber.
Ab–An–Or ternary plot of compositions (mol.%) of the cores and rims of plagioclase feldspar.

Amphibole composition
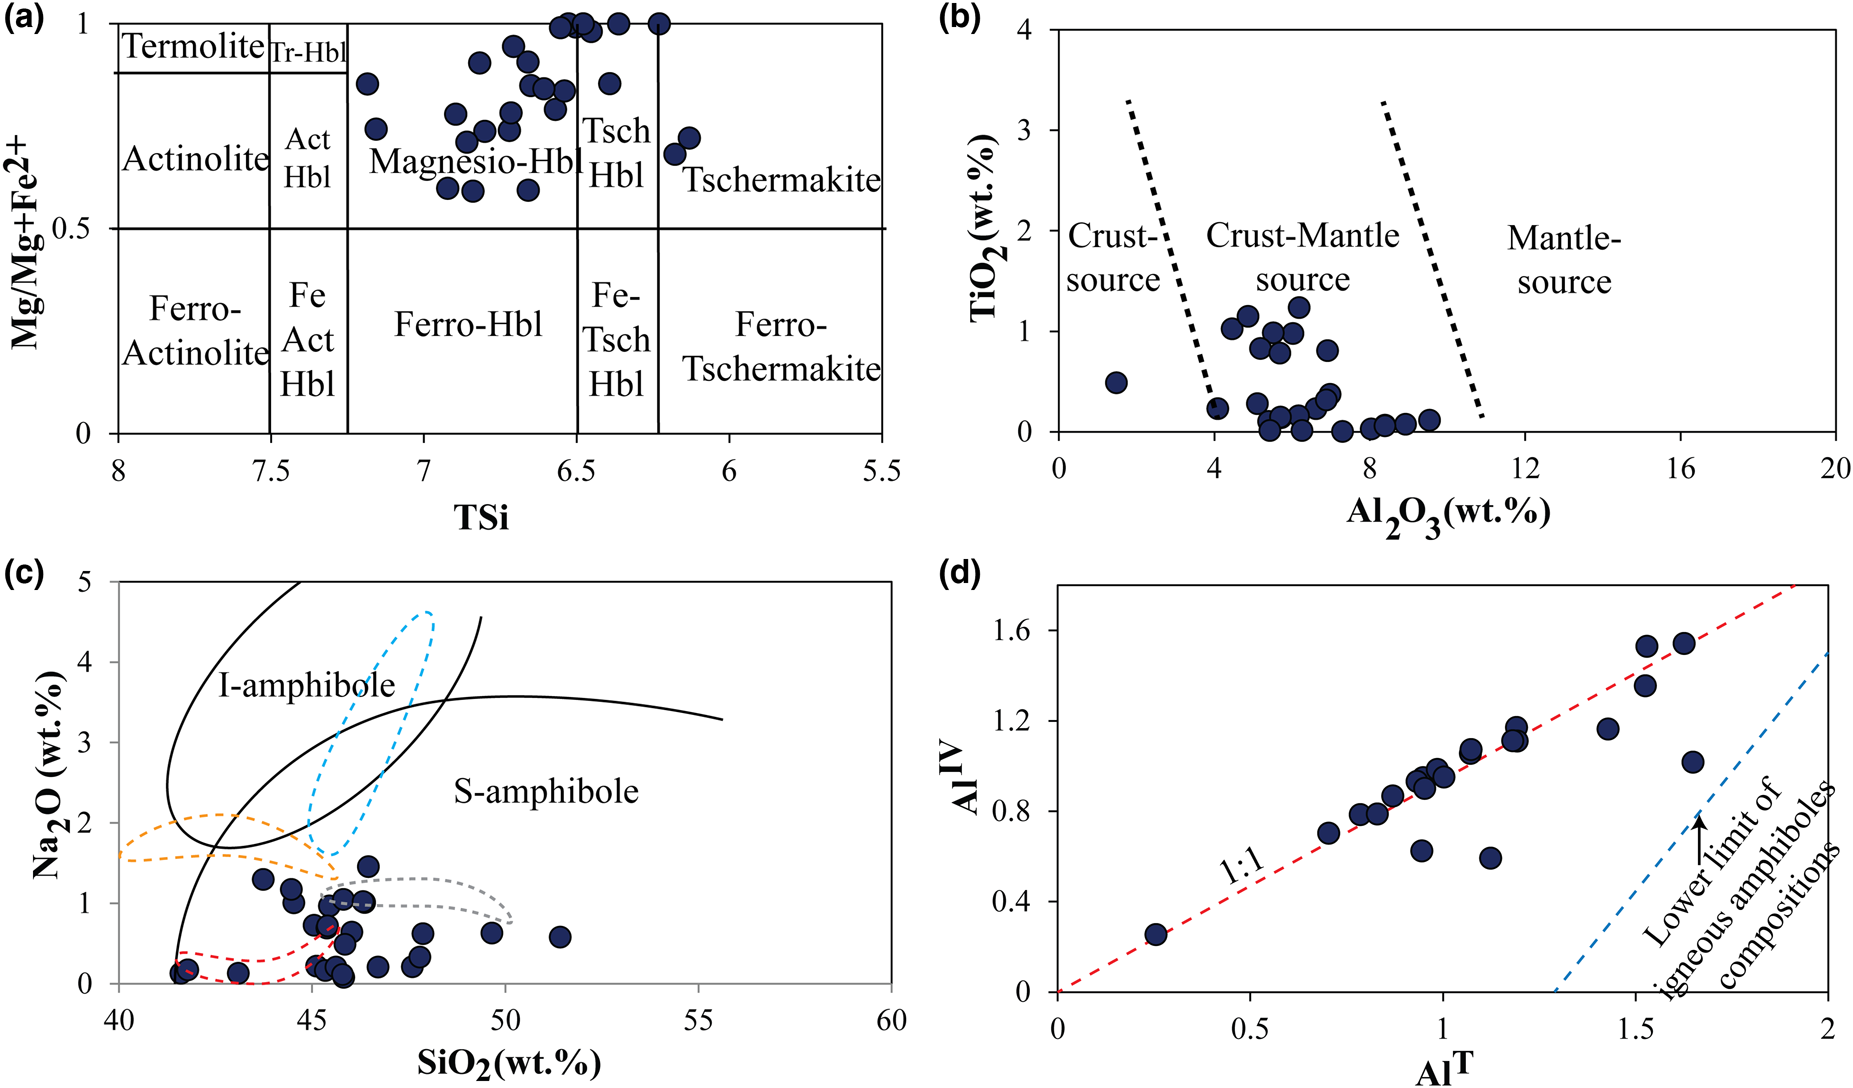
Amphiboles from the Ardestan plutonic rocks exhibit a narrow range of compositional variation (Table S3). Structural formulae, calculated on an anhydrous basis assuming 23 oxygen atoms per half unit cell, indicate that all Ardestan amphiboles are calcic (Ca >1 atoms per formula unit, apfu) and belong primarily to the magnesio-hornblende group according to the classification scheme of Leake et al. (Reference Leake, Woolley, Birch, Burke, Ferraris, Grice, Hawthorne, Kisch, Krivovichev, Schumacher, Stephenson and Whittaker2004) (Fig. 6a). TiO2 and Al2O3 contents of the amphiboles are in the crust–mantle mixed source field (after Jiang and An, Reference Jiang and An1984) (Fig. 6b). The relatively high Mg2+/(Mg2++Fe2+) ratios of Ardestan samples are in accordance with ranges prescribed for calc-alkalic granitoids (Mason, Reference Mason, Pitcher, Atherton, Cobbing and Beckinsale1985). Si contents vary from 6.29 to 6.97 apfu. Amphiboles in intraplate tectonomagmatic settings have more Na2O and TiO2 than those in subduction-zone settings (Coltorti et al., Reference Coltorti, BonaDiman, Faccini, Grégoire, O'Reilly and Powell2007); amphiboles from the Ardestan pluton plot in the subduction field (Fig. 6c). Figure 6d illustrates a consistent and positive correlation between IVAl and AlT in the amphiboles, and all values clearly plot within the field of magmatic (igneous) compositions (Hammarstrom and Zen, Reference Hammarstrom and Zen1986).
(a) Cationic Si vs. Mg/(Mg + Fe2+) variations in Ardestan amphiboles classifies them primarily as magnesio-hornblende. (b) TiO2vs. Al2O3 contents of Ardestan amphiboles (after Jiang and An, Reference Jiang and An1984) indicate mixing between mantle- and crustally-derived magmas. (c) Na2O vs. SiO2 diagram for intraplate (I) and subduction (S) amphiboles (Coltorti et al., Reference Coltorti, BonaDiman, Faccini, Grégoire, O'Reilly and Powell2007) indicates that the Ardestan samples reflect a subduction environment. Granitoids of intraplate and subduction settings are shown for comparison: Nova Scotia granite (Papoutsa and Pe-Piper, Reference Papoutsa and Pe-Piper2014); Ludwigshoöhe (Stein and Dietl, Reference Stein and Dietl2001); Guangdong granites (Huang et al., Reference Huang, Li, Li and Li2013); and Eastern Pontides (Temizel et al., Reference Temizel, Abdioğlu, Arsalan, Kaygusuz and Aslan2018). (d) Relationship between IVAl and AlT in amphiboles from the granitoids show magmatic affinities (Leake, Reference Leake1971). Blue dotted line: Nova Scotia granite (intraplate setting); orange dotted line: Guangdong granite (intraplate setting); red dotted line: Ludwigshöhe granite (subduction setting); and grey dotted line: Eastern Pontides granite (subduction setting).

Biotite compositions
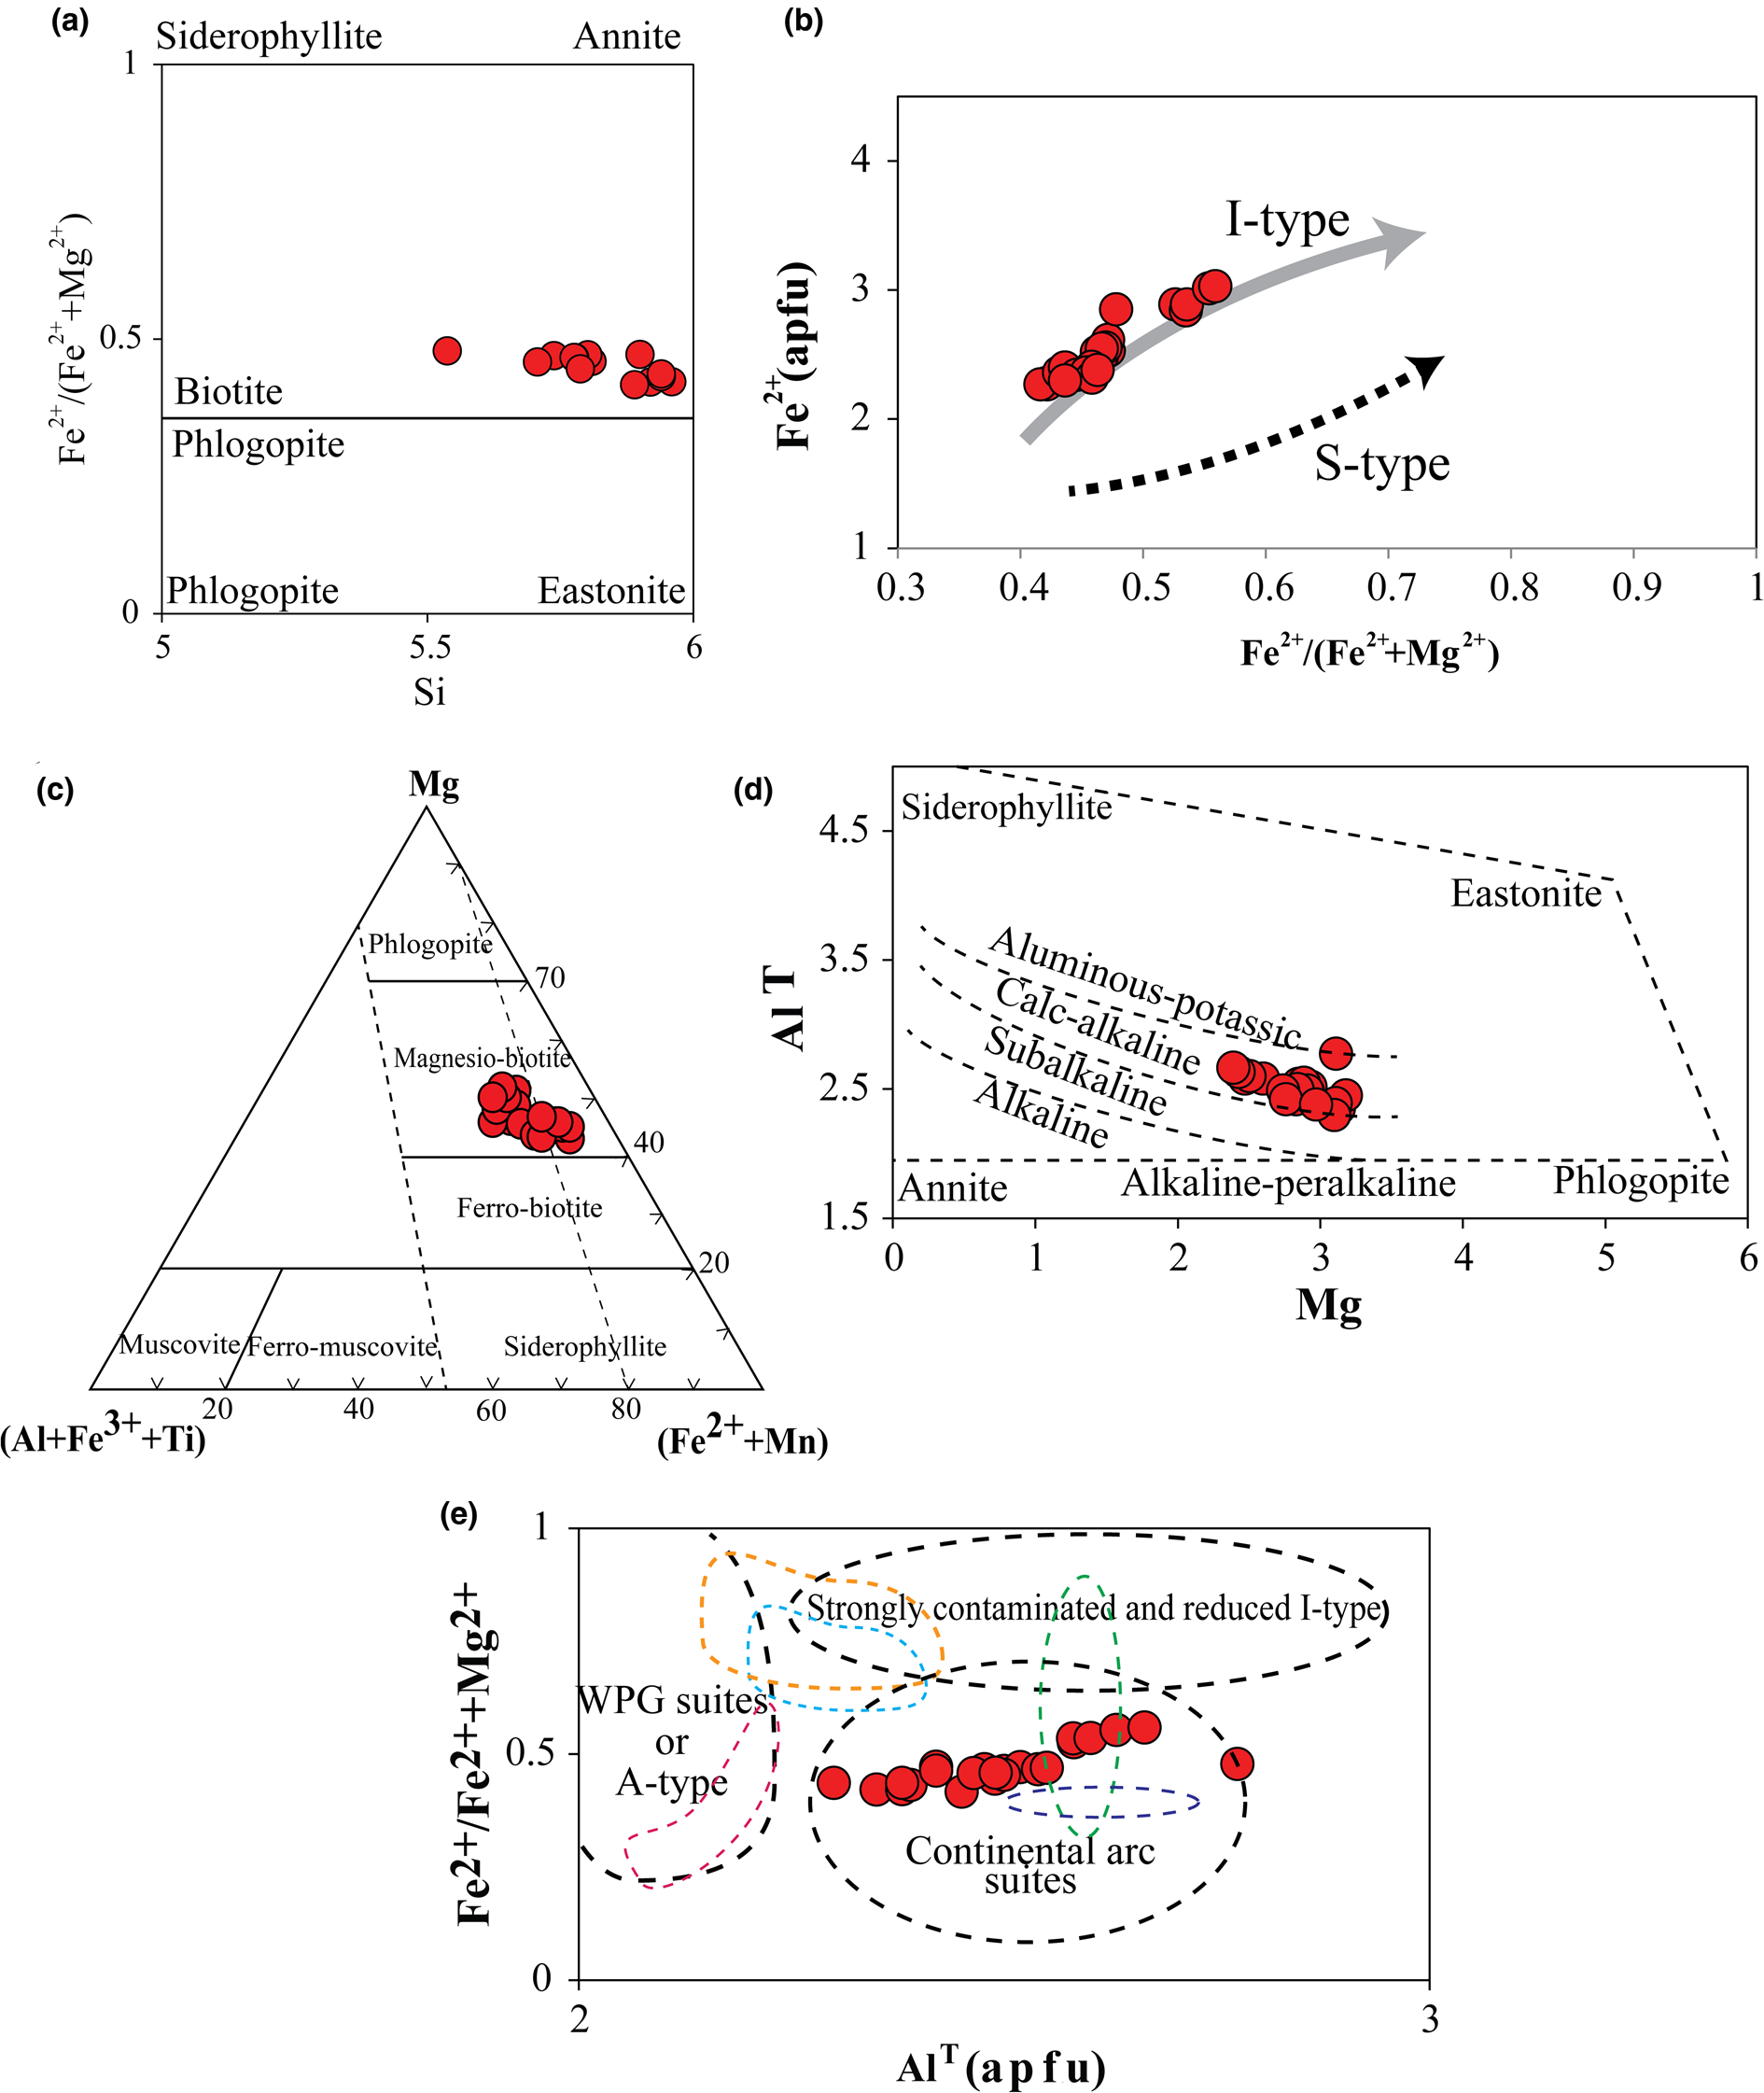
Representative compositions of mica from the Ardestan plutonic rocks are given in Table S4; mica formulae were recalculated on an anhydrous basis of 22 oxygens per formula unit. The composition of Ardestan biotites in the annite–siderophyllite–phlogopite–eastonite quadrilateral are shown in Fig. 7a. Biotite from Ardestan plutonic rocks exhibit a moderate range of Fe2+ values (~2.1–3.1 apfu) at a much narrower range of Fe2+/(Fe2++Mg2+) values (0.42–0.56; Fig. 7b). Vacancies in the octahedral position and deficient interlayer occupancy can account for the low total sum of cations of the biotite, suggesting there is enough Al3+ to fill the tetrahedral site together with Si and also to enter the octahedral site with Fe, Mg, Ti and Mn (Villaseca et al., Reference Villaseca, Ruiz-Martinez and Pérez-Soba2017). In general, I-type biotite shows higher Si and Fe and lower VIAl contents than S-type biotite; the Ardestan compositions define a trend for I-type granites (Fig. 7b).
(a) Composition of biotite from Ardestan plutonic rocks plotted in the annite–siderophyllite–phlogopite–eastonite quadrilateral. (b) Ardestan biotites define an I-type granite trend in the Fe2+/(Fe2++Mg2+) vs. Fe2+ classification diagram (Villaseca et al., Reference Villaseca, Ruiz-Martinez and Pérez-Soba2017). (c) Biotite from the study area (after Foster, Reference Foster1960) is classified as Mg-rich biotite. (d) Compositional variations of biotite in the AlTvs. Mg binary diagram (fields of Nachit et al., Reference Nachit, Razafimahefa, Stussi and Carron1985) support a calc-alkaline affinity for the Ardestan samples. (e) Composition of biotite from the Ardestan plutonic rocks expressed in the Fe2+/(Fe2++Mg2+) vs. AlT diagram indicate their affinity to a continental arc setting. Sources of data: Nova Scotia granite (Papoutsa and Pe-Piper, Reference Papoutsa and Pe-Piper2014); Guangdong granites (Huang et al., Reference Huang, Li, Li and Li2013); Holy Moses granite (Anderson et al., Reference Anderson, Barth, Mazdab, Putirka and Tepley2008); East Antarctica (Li et al., Reference Li, Tainosho, Shiraishi and Owada2003); Eastern Pontides (Temizel et al., Reference Temizel, Abdioğlu, Arsalan, Kaygusuz and Aslan2018). Pale blue dotted line: Nova Scotia granite (intraplate setting); orange dotted line: Guangdong granite (intraplate setting); red dotted line: Holy Moses granite (intraplate setting); green dotted line: Humber granite (subduction setting); and solid blue dotted line: Eastern Pontides granite (subduction setting).

The X Fe and X Fe values determined from cation fractions are defined as Fe2+/(Fe2+ + Mg2+) and (Fe2+ + VIAl)/(Fe2+ + Mg2+ + VIAl), respectively (following Zhu and Sverjensky, Reference Zhu and Sverjensky1992; Loferski and Ayuso, Reference Loferski and Ayuso1995). Following Foster (Reference Foster1960), micas from the Ardestan plutons plot in the Mg biotite field of Mg – (VIAl + Fe3+ + Ti) – (Fe2++ Mn) ternary diagram (Fig. 7c). TiO2 contents exceed 6.1 wt.% and imply a titanian-rich primary magma. Mg2+/(Mg2+ + Fe2+) ratios between 0.44–0.58 suggest growth in a tonalitic magma.
Nachit et al. (Reference Nachit, Razafimahefa, Stussi and Carron1985) proposed a classification system based on total amounts of structural Al and Mg to distinguish biotite from various types of host magmas (i.e. alumino-potassic, calc-alkaline, subalkaline, alkaline and peralkaline). Using this approach, the magmatic biotite compositions belong to the calc-alkaline suite (Fig. 7d). Compositions of biotite from the Ardestan plutonic rocks show a range of Fe2+/(Fe2++Mg2+) ratios that is nearly identical to those defined by continental arc suites (Fig. 7e). These observations are consistent with the host whole-rock geochemical signatures which plot in the field of calc-alkaline, continental I-type granites in all common discrimination diagrams.
Ardestan biotites are characterised by a narrow range of titanium contents (0.34–0.72 apfu), dominantly high Fe3+/(Fe2+ + Fe3+) ratios, an absence of Mn, barely detectable Cr, AlT<3.0, low F (0.14–0.24 apfu) and low Cl (0.05–0.09 apfu). These signatures are in accord with their metaluminous calc-alkaline affinity (Lalonde and Bernard, Reference Lalonde and Bernard1993). Variation of some of the oxide contents of biotite versus mole fraction of Mg (X Mg) (Fig. 8) show that X Mg is correlated negatively with Al2O3 and FeO but is not significantly correlated with (K2O + Na2O) and TiO2.
(a) X Mgvs. Al2O3 (wt.%); (b) X Mgvs. FeOtotal (wt.%); (c) X Mgvs. TiO2 (wt.%); (d) X Mgvs. K2O + Na2O (wt.%) plots for magmatic Ardestan biotites.

Zircon composition
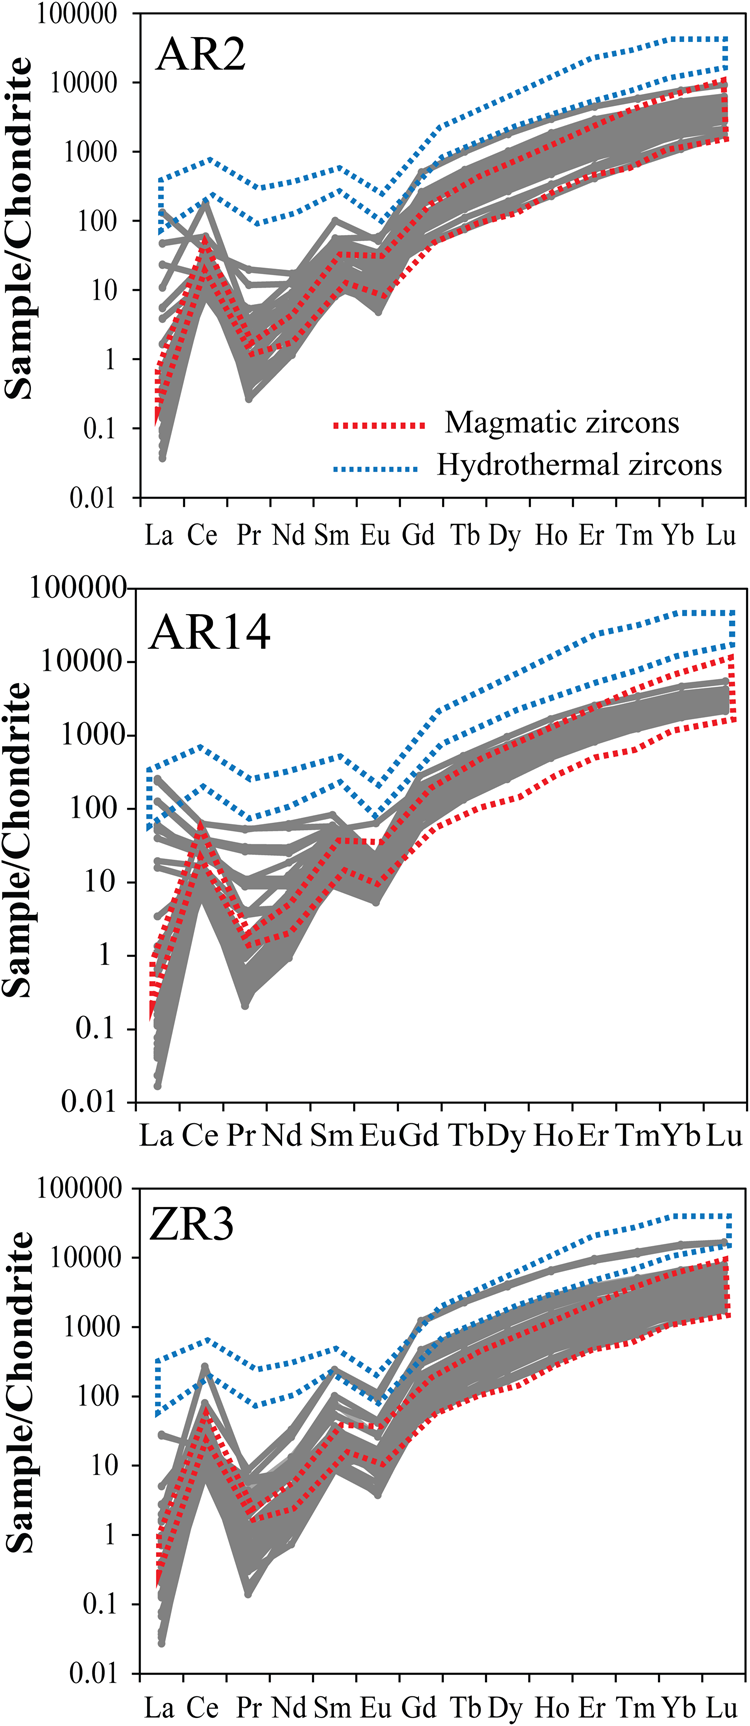
The total REE contents of zircon from Ardestan plutonic rocks exhibit wide variation (101–6632 ppm) (Table S5). The individual HREE (heavy REE) patterns of zircons from each rock sample are almost parallel with restricted ranges of high (Gd/Yb)N (0.03–0.07), while in some patterns the LREE and MREE (light and middle, respectively) segments exhibit variation (Fig. 9). Zircon grains from the Ardestan plutonic rocks are depleted in LREE and enriched in HREE with significant positive Ce anomalies (Ce/Ce*= 0.4–113) and negative Eu anomalies (Eu/Eu* = 0.13–0.30) (Fig. 9). This pattern is characteristic of magmatic zircon (Hoskin and Schaltegger, Reference Hoskin, Schaltegger, Hanchar and Hoskin2003). The negative anomaly of Eu may be attributable to the existence of Eu2+ due to reducing conditions in the host magma and/or plagioclase fractionation, which reflects earlier Eu depletion of the melt or fluid from which the zircon crystallised (Hoskin et al., Reference Hoskin, Kinny, Wyborn and Chappell2000). The lack of correlation between Ce and Eu anomalies (i.e. positive Ce anomaly coexisting with negative Eu anomaly) implies that  $f_{{\rm O}_{\rm 2}}$ is not the only factor controlling Ce4+/Ce3+ and Eu3+/Eu2+ in magmas (Maas et al., Reference Maas, Kinny, Williams, Froude and Compston1992). We note that crystallisation of zircon following substantial fractional crystallisation of plagioclase under oxidising conditions in the magma chamber will lead to development of a positive Ce anomaly, whilst the formation of a positive Eu anomaly will be suppressed because the magma has already been depleted in Eu3+. We note that the Ardestan zircons have significantly lower LREE contents than hydrothermal zircons and their high (Sm/La)N (>10) ratios associated with low La (<1 ppm) provide further support for a magmatic origin. Enrichment in LREE and moderate to negative Ce anomalies can be related to compositional changes in the host magma and/or crystallisation of zircon under high aqueous fluid activity at the end of magmatic crystallisation (Hoskin and Schaltegger, Reference Hoskin, Schaltegger, Hanchar and Hoskin2003). High U/Yb ratios (0.23–1.12) of Ardestan zircons are in accord with their continental affinity (Grimes et al., Reference Grimes, John, Kelemen, Mazdab, Wooden, Cheadle, Hanghøj and Schwartz2007).
Chondrite-normalised distribution REE patterns for Tertiary zircons. Fields of ‘magmatic’ and ‘hydrothermal’ zircons are from Hoskin (Reference Hoskin2005). Red field: magmatic zircon, blue field: hydrothermal zircon.

Crystal size distribution (CSD)
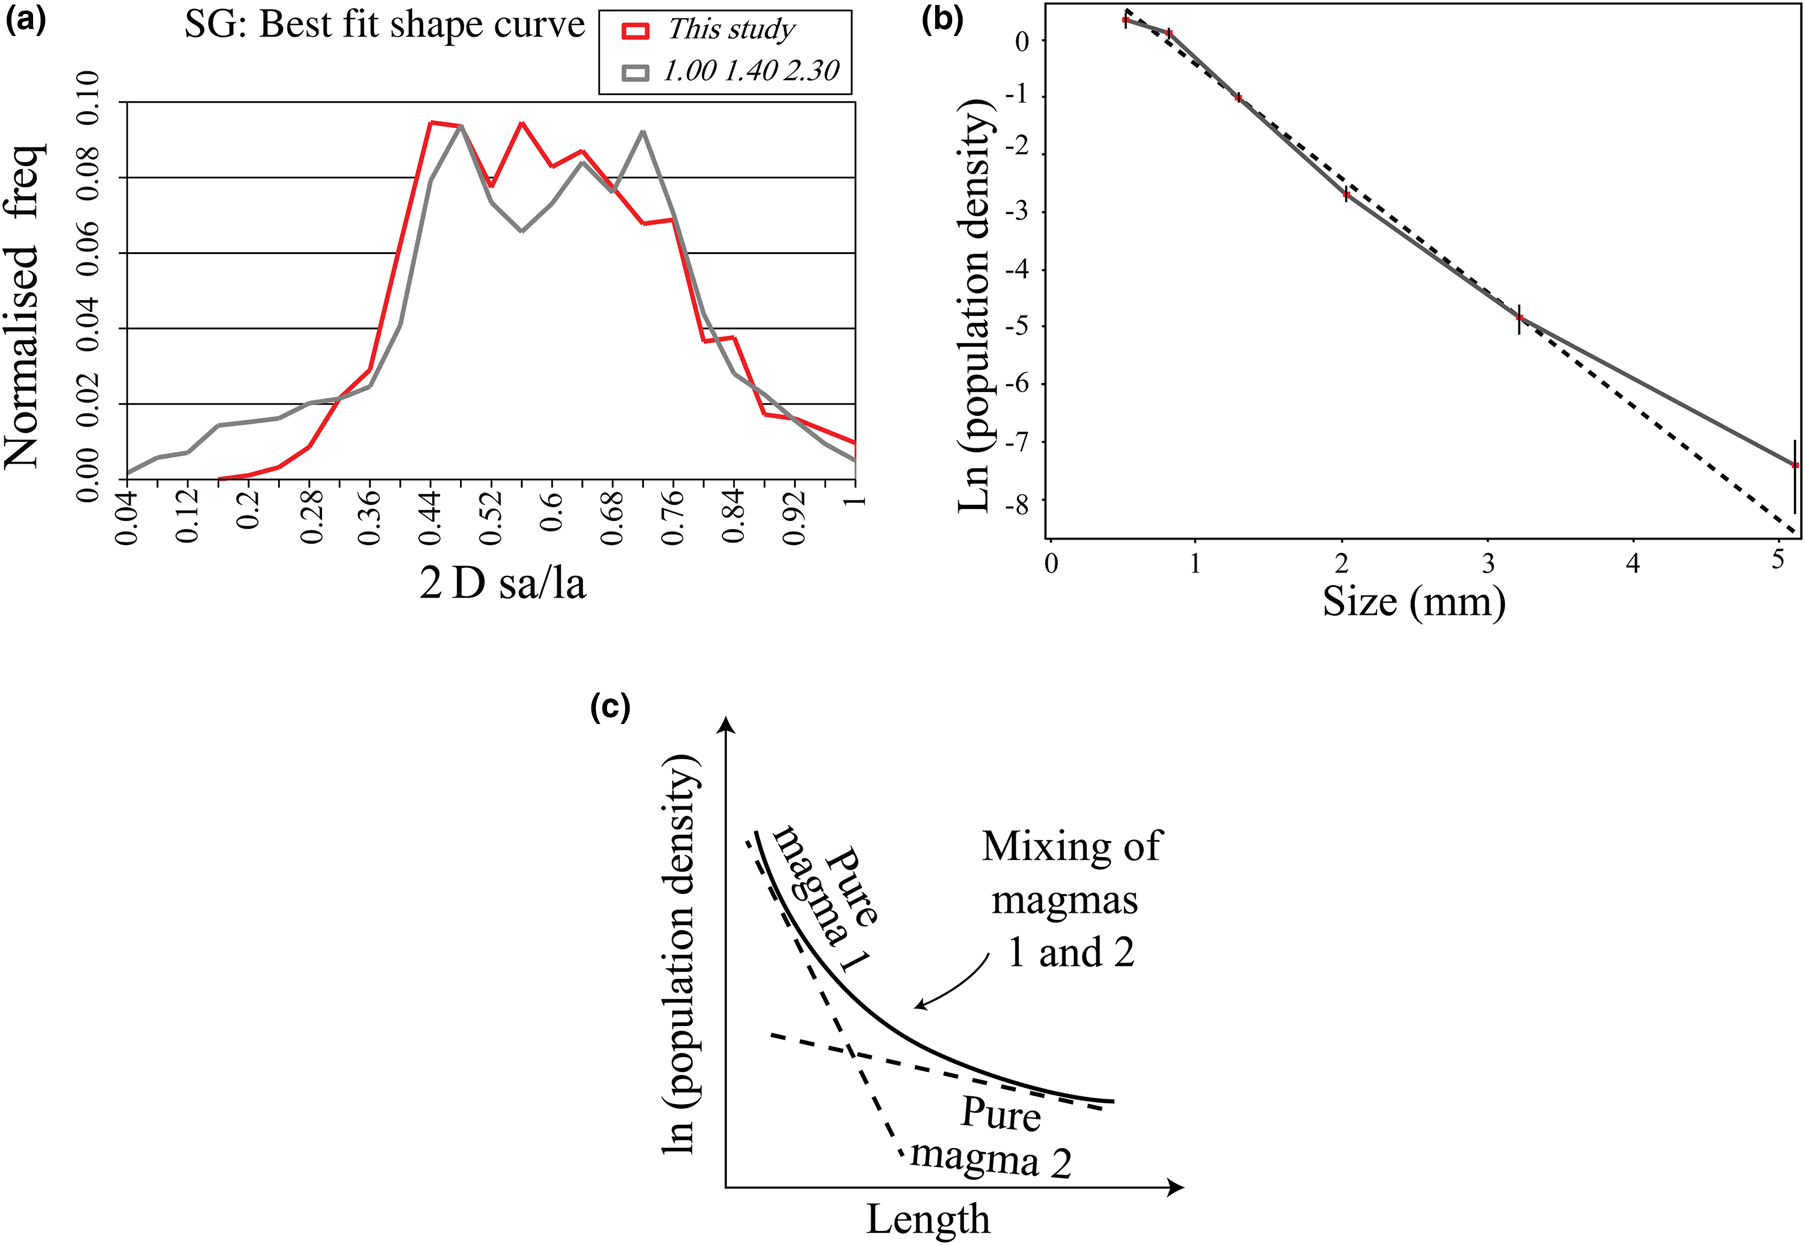
The distribution of 2D length and width (intersection dimensions) of 930 measured grains and the calculated crystal shape data is presented in Table S6. Intermediate (I) / Long (L) and short (S) / intermediate (I) factors were calculated from the data. The frequency versus 2D sa/la (short axis/long axis) histograms together with the best-fit shape output by CSDSlice are shown in Fig. 10a. Dotted lines show the most similar crystal shapes to our data, and have been considered to be similar to our sample crystal factors.
(a) Binary images and 2D sa/la (short axis/long axis) width/length distributions for the range of values of all samples (red line) are shown along with their best fit crystal habit (grey line) as determined by CSDSlice (Morgan and Jerram, Reference Morgan and Jerram2006). The numbers on the left corner of the CSDSlice diagram represent the aspect ratios as represented by short axis: intermediate axis: long axis of the crystal. (b) CSD diagrams of the plagioclase crystals from Ardestan granitoids. Note the non-linear trend of the diagram. Dotted lines are the calculated regression lines based on the frequency of crystal sizes. (c) CSD patterns may change in response to physical processes in the magma chamber. Mixing of two magmas with different crystal density or coarse-grained crystals can result in concave-up CSD patterns (Higgins, Reference Higgins2006).

Slopes of the CSD curve for Ardestan plagioclase (Table S7; Fig. 10b) are used to calculate an average crystal residence time by employing the equation: Tr = (–1/G×m)/31,536,000. Where Tr is the residence time (years), G is the growth rate of crystals (mm/s), m is the slope of the CSD curve of the log-linear data, and the 31,536,000 coefficient converts seconds to years (Higgins, Reference Higgins2006). Investigations by Garrido et al. (Reference Garrido, Kelemen and Hirth2001) of igneous bodies emplaced in the shallow crust indicate a growth rate of ~10–10 mm/s, and we have used this rate in this calculation. The pattern of CSD for the Ardestan granitoids shows influence of the physical processes on magma during plagioclase crystallisation. Cashman (Reference Cashman1993) suggested a residence period <1000 years for the final ascent of shallow intrusive bodies related to the final stages of solidification for compositions such as those in the Ardestan region. Calculated residence times for Ardestan plagioclase crystals of ~630 years support field evidence that these plutons were emplaced at shallow depths (Table S7).
Discussion
Magma mixing
There is abundant mineralogical evidence to support a history of magma mixing in the Ardestan plutonic rocks. In particular, the abundant microgranular mafic enclaves provide clear physical evidence for the interaction between basic and acidic magmas. Further evidence for pervasive magma mixing comes from the zoning in plagioclase feldspar crystals, the medium Al2O3 and MgO contents in hornblende and biotite, respectively, and the relatively high log $f_{{\rm O}_{\rm 2}}$ and ∆FQM for biotite.
The complex zoning in plagioclase which is widespread in Ardestan plutonic rocks, indicates a significant role for intimate mixing of basic and acidic magmas. In intermediate rocks, the existence of mineral oscillatory zoning, sieve textures, and crystal dissolution margins indicate changes in temperature, pressure, melt composition and  $f_{\rm H_2O}$, which generally relate to feeding of the magma chamber with new pulses of magma. Ardestan plagioclase feldspars display normal zoning from a bytownite composition in the core to a labradorite–andesine composition at the rim (Fig. 5). The consistent abrupt decrease in An content might represent one pulse of mixing with a more evolved magma within the shallow plutonic chamber. After the mixing, the magma system changes from open to closed, leading to the crystallisation of the plagioclase domains with smoothly decreasing An content. We infer that mantle-derived basic magma which is more primitive than tonalite accounts for the crystallisation of high-An plagioclase (i.e. An75–90 in core) in a deep, hot and active convective system. This magma transferred into the upper crust and invaded an existing acidic magma chamber, leading to re-crystallisation under stable conditions and subsequent growth of low-An plagioclase rims (An70–30).
These features are supported by the shape of the CSD patterns of the Ardestan rocks which we use to distinguish closed- and open-system behaviours. In general, a linear slope on a CSD diagram indicates simple monotonic cooling of magma, but if the diagram exhibits kinks or changes of slope additional processes must have been superimposed upon the cooling. Deviation from the ideal patterns is generally due to physical processes in the magma chamber such as mixing of magmas and differential coarsening of individual mineral grains (Higgins, Reference Higgins2006). Each of these processes can affect the CSD through changing characteristic features of the residence time regime (Marsh, Reference Marsh1988) and therefore indicate processes occurring in the magma chamber. The Ardestan CSD diagrams (Fig. 10) do not display straight lines. The kinked, or upward concave, lines record the presence of several crystallising systems and the consequent magma mixing in a magma chamber prior to or during ascent and emplacement.
Our data are consistent with recent research conducted on Ardestan plutonic rocks, revealing several distinct age groups (ca. 550 to <10 Ma) and a modest variation in (87Sr/86Sr)i from 0.706 to 0.707 (Babazadeh et al., Reference Babazadeh, Ghorbani, Bröcker, D'Antonio, Cottle, Gebbing, Mazzeo and Ahmadi2017; Reference Babazadeh, Ghorbani, Cottle and Bröcker2019). From a geodynamic point of view, Moghadam et al. (Reference Moghadam, Li, Stern, Santos, Ghorbani and Pourmohsen2016) defined ~550 Ma calc-alkaline granitoids (tonalite–granodiorite in composition) of Biarjmand as the epitome of Cadomian crust of Iran and suggested that the geotectonic setting during late Ediacaran and early Cambrian time was a continental magmatic arc. The presence of a small ~550 Ma zircon population in the Ardestan plutonic rocks is consistent with Cadomian continental crust zircon inheritance and confirms a minor crustal contribution in their petrogenesis. We note that chondrite-normalised REE profiles of these older inherited zircons, which are not presented here, share the same geochemical signatures with the Tertiary Ardestan zircons (Babazadeh et al., Reference Babazadeh, Ghorbani, Cottle and Bröcker2019). This coherence also reveals that Iranian continental crust produced and affected by ~550 Ma magmatism had a similar geochemical signature to the Urumieh-Dokhtar magmatic assemblage juvenile mantle.
Geothermometric estimates
Ti-in-Zircon
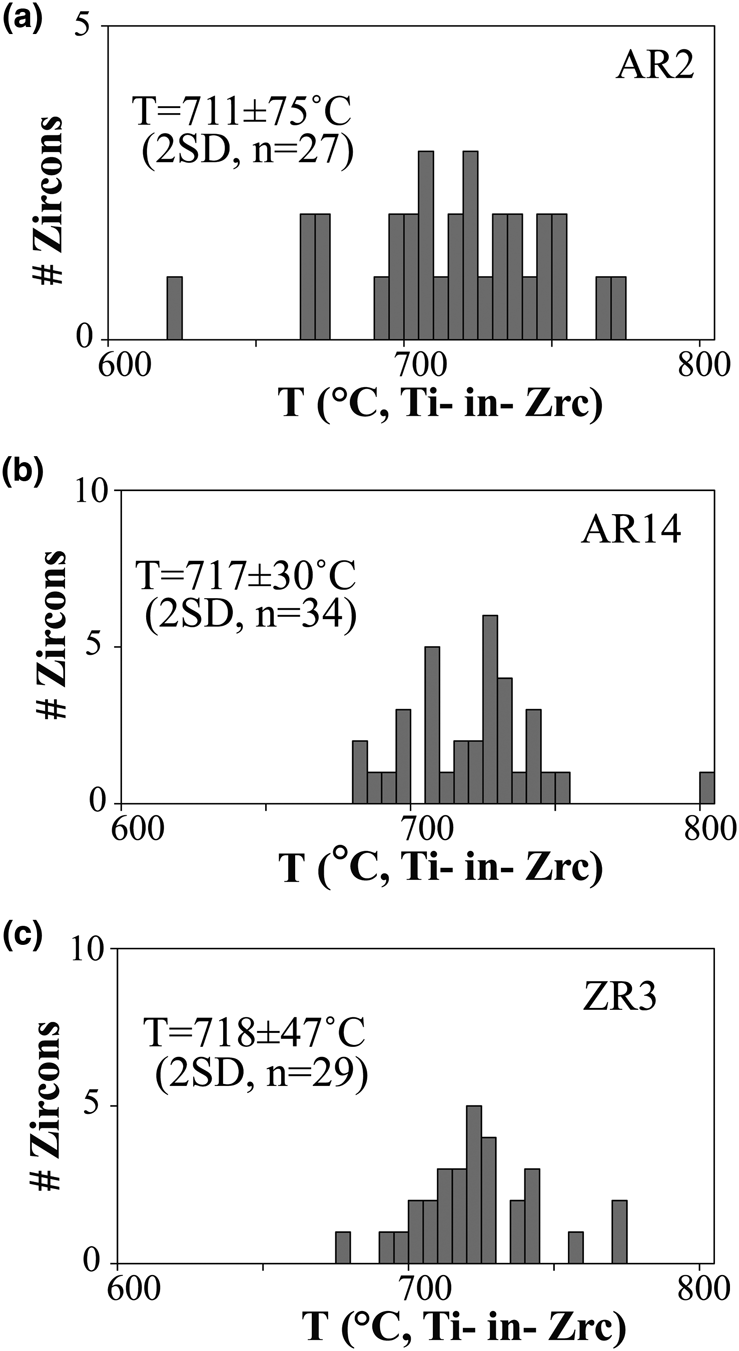
The Ti contents in zircon and calculated temperatures are listed in Table S8 and shown in Fig. 11. Ti-in-zircon thermometry yielded average crystallisation temperatures of 711 ± 75°C, 717 ± 30°C and 718 ± 47°C for south Ardestan plutonic rocks AR2, AR14 and ZR3 respectively. We recognise that the ablation of Ti-rich inclusions (ilmenite, titanite or rutile) or Ti-rich cracks in zircons (Harrison and Schmitt, Reference Harrison and Schmitt2007) can significantly increase Ti values and T Zr.Ti°C, and attribute scattered spots with higher temperatures to this phenomenon.
Histograms of Ti-in-zircon temperatures for three Ardestan plutonic rocks. Abbreviations in parentheses: SD: standard deviation, n: number of zircon grains analysed.

The application of the Ti-in-zircon thermometer (Watson et al., Reference Watson, Wark and Thomas2006) to petrogenetic studies has become central to the debate on the thermal state and dynamics of the early crust, as based on Ti-in-zircon thermometry on Archean and Hadean zircons (Watson and Harrison, Reference Watson and Harrison2006; Harrison et al., Reference Harrison, Watson and Aikman2007; Fu et al., Reference Fu, Mernagh, Kita, Kemp and Valley2009; Hiess et al., Reference Hiess, Nutman, Bennett and Holden2008; Ickert et al., Reference Ickert, Williams and Wyborn2011; Siégel et al., Reference Siégel, Bryan, Allen and Gust2018). Watson et al. (Reference Watson, Wark and Thomas2006) demonstrated that the incorporation of Ti into the zircon structure is controlled chiefly by activities of TiO2 (aTiO2) and SiO2 (aSiO2) and temperature but is essentially independent of pressure (Watson et al., Reference Watson, Wark and Thomas2006; Ferry and Watson, Reference Ferry and Watson2007). The co-existence of zircon, quartz and titanite in the Ardestan rocks leads to considering the aSiO2 and aTiO2 equivalent to 1.0, and temperatures are calculated using equation 1 (Ferry and Watson, Reference Ferry and Watson2007).
 $$\lsqb {{\rm log} \lpar {{\rm ppm\ Ti} \hbox{-} {\rm in} \hbox{-} {\rm zircon}} \rpar {\rm} + {\rm logSi}{\rm O}_2\ndash {\rm logTi}{\rm O}_2} \rsqb {\rm} = {\rm} \lpar {5.711{\rm} \pm {\rm} 0.072} \rpar {\rm} \ndash {\rm} \lpar {4800{\rm} \pm {\rm} 86/T\lpar K \rpar } \rpar $$
The high calculated temperatures of some Ardestan samples (i.e. T Zr.Ti°C >800) may be attributed to the ablation of Ti-rich minerals while the lower temperatures probably represent re-equilibration during continued growth as the pluton cooled.
Estimation of zircon and apatite liquidus temperatures
Whole-rock Zr abundances can be used to estimate the crystallisation temperature of zircon in Zr-saturated granitic melts because the distribution coefficient of Zr in zircon is extremely sensitive to temperature and less affected by other factors (Watson, Reference Watson1980). Zircon saturation is considered to approach the liquidus temperature of the magma, which may not represent the zircon crystallisation temperature or the ambient temperature of a crystal-rich magma (Siégel et al., Reference Siégel, Bryan, Allen and Gust2018). For a well-formed (euhedral) zircon, one can obtain the magma temperature using the Zr content of the zircon crystal (Miller et al., Reference Miller, McDowell and Mapes2003). Zircon solubility is correlated empirically with SiO2, the cation ratio (M = [(K + Na + 2Ca)/(Si.Al)]cat) and temperature (Watson and Harrison, Reference Watson and Harrison1983; Hanchar and Watson, Reference Hanchar, Watson, Hanchar and Hoskin2003; Fig. 12a,b).
Thermometric calculations for Ardestan granitoids. (a) Whole rock Zr vs. SiO2. (b) Zircon saturation temperature (T Zr.sat°C) vs. compositional parameters M and Zr of Watson and Harrison (Reference Watson and Harrison1983) (after Siégel et al., Reference Siégel, Bryan, Allen and Gust2018). The graphs illustrate how M and Zr are the key parameters for generating a wide range of T Zr.sat°C. (c) Ti vs. Mg2+/(Mg2++Fe2+) for biotite (after Henry et al., Reference Henry, Guidotti and Thomson2005) showing temperatures of biotite formation. (d) Summary of thermometric calculations in Ardestan plutonic rocks shows emplacement at ~730 ± 50 °C.

Zirconium concentration, a secondary control on Zr saturation, appears to be the key parameter for T Zr.sat.°C. The model of Watson and Harrison (Reference Watson and Harrison1983) for estimating saturation temperature can be applicable for rocks with M values of 0.9–1.9. The Ardestan plutons contain 78 to 192 ppm Zr and have M values between 1.65–1.90 (Table S1) and thus yield saturation temperatures of 711–767°C (Fig. 12) that correspond closely to the Ti-in-zircon temperatures calculated above. T Zr.sat.°C correlates with the Zr content in the sampled whole rocks (Siégel et al., Reference Siégel, Bryan, Allen and Gust2018). Low bulk-rock Zr contents may result from Zr compatibility during fractional crystallisation of major mineral phases (including zircon), thereby decreasing Zr content of the residual melt (Fig. 4h).
Watson (Reference Watson1980) and Green and Watson (Reference Green and Watson1982) quantified the conditions under which apatite can precipitate in common magma types; temperature and silica content of the magma are critical in determining the P2O5 content required for apatite to crystallise. Using only samples with M values suitable for the estimation of saturation temperature (see above) the T Ap.sat°C calculated for the south Ardestan plutonic rocks ranges from 836 to 889°C (Table S1). These values approximate a near-liquidus temperature of the magma from which apatite started crystallising (Watson, Reference Watson1980). Estimated saturation temperatures for apatite are clearly higher than those calculated for zircon, confirming relatively late saturation of zircon during the evolution of the Ardestan magma. We suggest that the parental I-type magmas evolve towards their final compositions prior to transfer to upper crustal intrusive sites. This tendency is a result of the high water contents and low temperatures of the I-type magmas, which, upon ascent, exsolve water, causing an increase in the solidus temperature and triggering crystallisation (Foden et al., Reference Foden, Sossi and Wawryk2015).
Single mineral Ti-in-biotite geothermometer
Experimental investigations have demonstrated that Ti solubility in mica increases with temperature and decreases with pressure (Robert, Reference Robert1976). As a result, Ti substitution in biotite can be useful in geothermometric estimation (Henry et al., Reference Henry, Guidotti and Thomson2005). The concentration of Ti in biotite is very sensitive to temperature and oxygen fugacity, making it possible to use biotite to obtain reliable temperature estimates in igneous and metamorphic rocks (Patino Douce, Reference Patino Douce, Johnston and Rice1993). Henry et al. (Reference Henry, Guidotti and Thomson2005) proposed that the fit to the Ti-saturation surface can be reformulated as the geothermometric expression:
 $$T\lpar {^\circ {\rm C}} \rpar {\rm} = {\rm} \lpar {\lsqb {{\rm ln} \lpar {{\rm Ti}} \rpar {\rm} \ndash a\ndash c\lpar {X_{{\rm Mg}}} \rpar 3} \rsqb /b} \rpar ^{0.333}$$
in which T is temperature in °C, Ti is apfu normalised on the basis of 22 O atoms, X Mg is Mg2+/(Mg2++Fe2+), a = –2.3594, b = 4.6482 × 10⁻⁹ and c = –1.7283. The calibration range for this expression is X Mg = 0.275–1.000, Ti = 0.04–0.60 apfu, and T = 480–800°C.
In addition, Wu and Chen (Reference Wu and Chen2015) proposed Ti-in-biotite geothermometry based on empirical calibration over a wide range of pressure conditions:
 $$ \eqalign{ T\lpar {^\circ {\rm C}} \rpar {\rm} = \,& {\rm Exp} \lsqb {6.313{\rm} + {\rm} 0.224{^\ast}{\rm ln}\lpar {X_{{\rm Ti}}} \rpar {\rm} \ndash {\rm} 0.228{^\ast}{\rm ln}\lpar {X_{{\rm Fe}}} \rpar {\rm} }\cr&{ \ndash {\rm} 0.499{^\ast}{\rm ln}\lpar {X_{{\rm Mg}}} \rpar {\rm} + {\rm} 1.5{^\ast}P} \rsqb $$
Where P is in kbar; cations in the biotite formula are calculated on a 22 oxygen basis; X Z = Z/(Fe2+ + Mg + VIAl + Ti); and Z = Fe2+, Mg, Ti.
The X Mg and Ti values of eligible biotite fall within the conditions for the X Mg–Ti in biotite (Fig. 12c). Application of the Ti-in-biotite geothermometer gives temperatures that average 730 ± 56°C, i.e. only slightly higher than obtained temperatures by conventional Ti-in-zircon grains and similar to the average T Zr.sat°C calculated above. On the basis of these multiple approaches, we conclude that the Ardestan plutons were emplaced at temperatures around 730 ± 50°C (Fig. 12d).
Summary of geothermometric findings
We have employed several different mineral geothermometers to constrain the crystallisation conditions of the Ardestan granites. These results are summarised (Fig. 12d) and present a consistent picture of the magmatic environment. The mineralogical evidence indicates crystallisation over a range of temperatures from ~800–600°C, with the majority of data supporting extensive crystal growth in the narrower range around ~725 ± 25°C. Apatite saturation temperatures are consistently higher, probably reflecting early and protracted growth of this mineral.
Pressure
The depth and temperature of mineral crystallisation and the amount of post-crystallisation exhumation are important for understanding the evolution of the plutons. Both geological and petrological features can be used to evaluate the emplacement depth of a pluton. Uchida et al. (Reference Uchida, Endo and Makino2007) documented a strong positive correlation between the total Al (AlT) content of a biotite grain and the solidification pressure (P) of the granitic host rocks, as determined using sphalerite and hornblende geobarometers and mineral assemblages within the surrounding rocks. These data lead to the following empirical equation:
 $$P\lpar {{\rm kb}} \rpar {\rm} = {\rm} 3.03{\rm} \times {\rm A}{\rm l}^{\rm T}\ndash {\rm} 6.53{\rm} \lpar { \pm 0.33} \rpar $$
Using equation 4, the calculated pressures (Table S4) are 4.8–6.2 kbar (~12–16 km depth) for the biotite-bearing Ardestan plutonic rocks.
Oxygen fugacity and petrogenesis
On the basis of petrographic evidence (i.e. grain size, textural relationships) and the calculated P–T conditions, it is difficult to determine whether biotite crystallised before or after hornblende in these rocks. We suggest that biotite was the first mafic phase to form, as indicated by the occurrence of mainly euhedral biotite grains in the cores of hornblende grains and the higher calculated pressures. Primary crystallisation of biotite before hornblende suggests that the initial magma composition was undersaturated in H2O (Sinha et al., Reference Sinha, Whalen and Hogan1997).
Magnesium-rich biotite is typically found in the same rocks as Fe–Ti oxides, and contemporaneous growth is indicative of a relatively high oxygen fugacity ( $f_{{\rm O}_{\rm 2}}$) in the melt (Wones and Eugster, Reference Wones and Eugster1965). As oxygen fugacity increases in magmatic systems, the Fe3+/Fe2+ ratio in the melt increases, leaving progressively less Fe2+ able to compete with Mg2+ for site occupancy in mafic minerals. Accordingly, as
 $f_{{\rm O}_{\rm 2}}$ increases, the Mg# of mafic minerals will increase and high Mg# in mafic minerals appears to be characteristic of high-
 $f_{{\rm O}_{\rm 2}}$ magmas. Oxygen fugacity values can be calculated from the Fe2+/(Fe2++Mg2+) ratio of the biotite by using the calibration curves of Wones and Eugster (Reference Wones and Eugster1965) in
 $f_{{\rm O}_{\rm 2}}$–T space (Yavuz, Reference Yavuz2003). Further, the presence of Mg-rich amphiboles and euhedral titanite and magnetite as early crystallising phases in felsic rocks indicates that the magma was relatively oxidised (Enami et al., Reference Enami, Suzuki, Liou and Bird1993). The assemblage titanite + magnetite + quartz in granitoid rocks permits an estimate of the relative oxygen fugacity (Wones, Reference Wones1989), which is presented as:
 $${\rm log}\;\,f_{{\rm O}_{\rm 2}} = \ndash 30930/T + 14.98 + 0.142 \lpar {P\ndash 1} \rpar T\lpar 5 \rpar $$
where T is the temperature (in K) and P is pressure (in bar). For the Ardestan plutonic rocks, we calculated oxygen fugacity using a pressure of 4.8 or 6.2 kbar, i.e. the range calculated for these rocks.
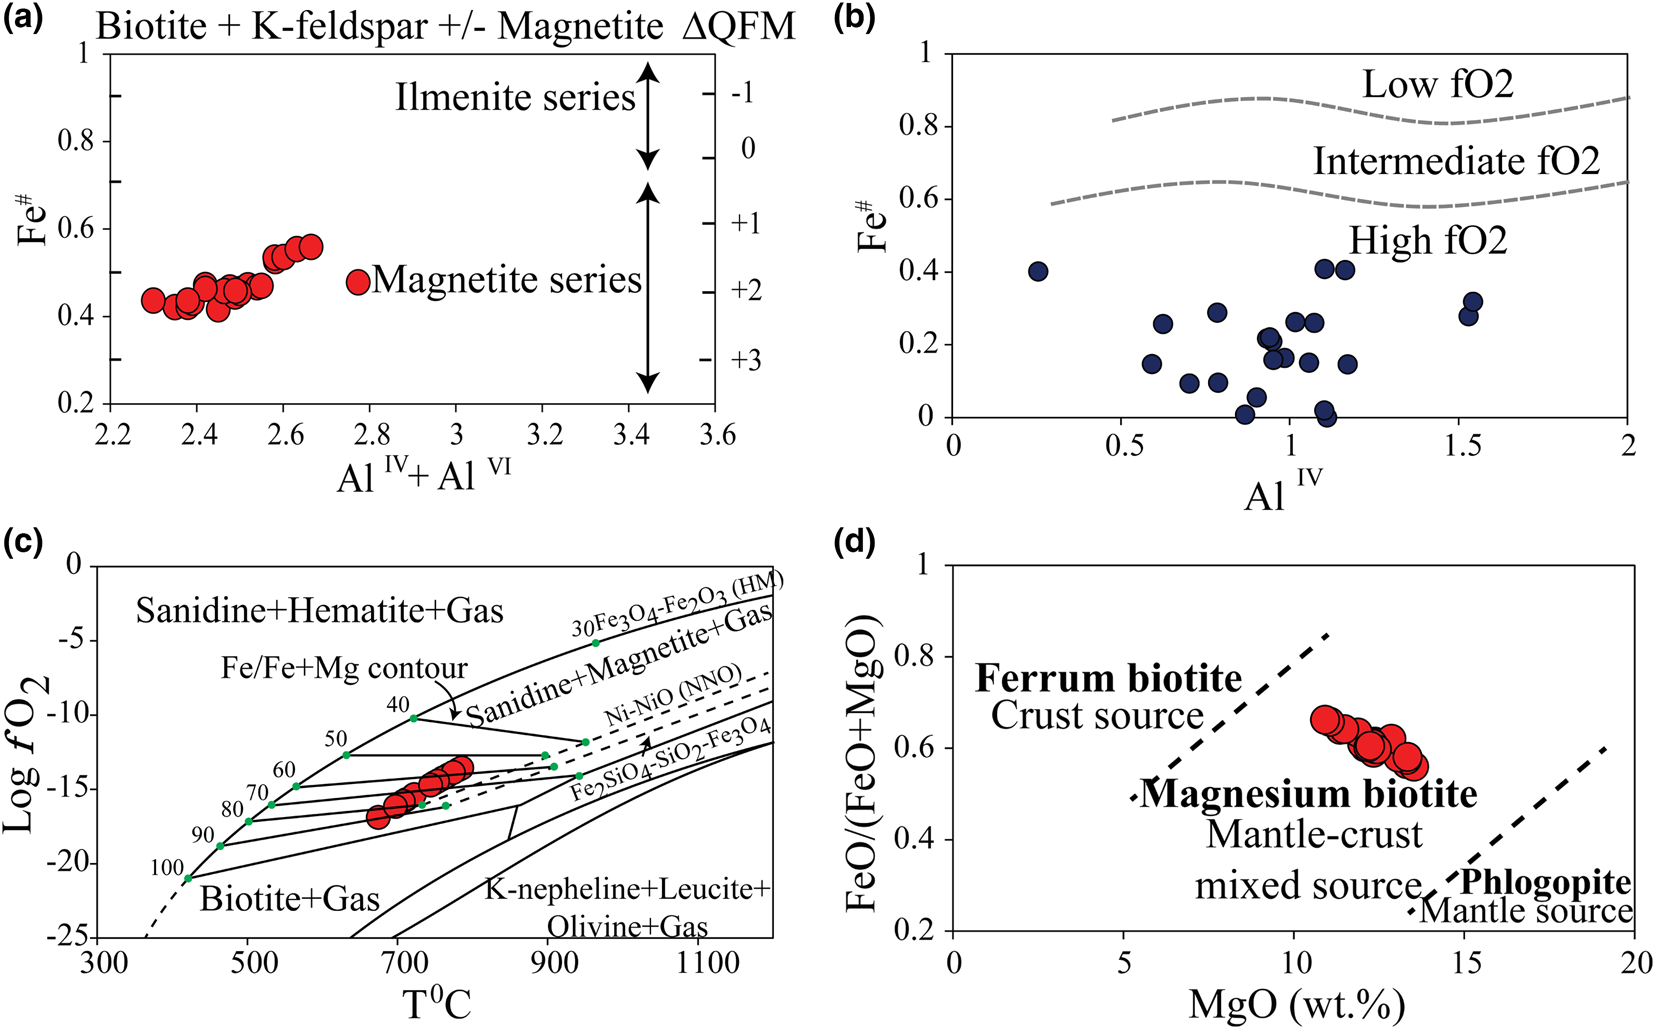
The resulting estimated  $f_{{\rm O}_{\rm 2}}$ values show a narrow range of log f O2 = –13.6 to –16.9 for the Ardestan samples, i.e. between the Ni–NiO (NNO) and Fe2O3–Fe3O4 (HM) buffers. Most of biotite compositions in the Ardestan samples have an Fe# ranging from 0.42 to 0.56, which results in ∆FQM ~ +1.0 to +2.0 (Fig. 13a). Taken together, our observations suggest crystallisation of the Ardestan plutonic rocks under fairly high
 $f_{{\rm O}_{\rm 2}}$ conditions. Increasing oxygen fugacity leads to progressive changes in amphibole structure as high
 $f_{{\rm O}_{\rm 2}}$ enhances the entrance of Fe3+ in place of Al into hornblende (Hollister et al., Reference Hollister, Grissom, Peters, Stowell and Sisson1987; Anderson and Smith, Reference Anderson and Smith1995; Stein and Dietl, Reference Stein and Dietl2001). As shown in Fig. 13b, Ardestan amphiboles crystallised under high
 $f_{{\rm O}_{\rm 2}}$ conditions. Wones and Eugster (Reference Wones and Eugster1965) proposed the log
 $f_{{\rm O}_{\rm 2}}$–T diagram to evaluate the magmatic oxygen fugacity balanced with the biotite + sanidine + magnetite. T–
 $f_{{\rm O}_{\rm 2}}$ estimates for the Ardestan granitoids equilibrated at an oxygen fugacity between –13.6 to –16.9; show crystallisation conditions between Ni–NiO (NNO) and Fe2O3–Fe3O4 (HM) for all the samples studied, indicating a relatively high oxidation condition during magma crystallisation (Fig. 13c).
Redox condition estimates during the crystallisation of the studied plutons. (a) Binary IVAl+VIAl (22 oxygens) vs. Fe# plot of Anderson et al. (Reference Anderson, Barth, Mazdab, Putirka and Tepley2008) for biotite with approximate  $f_{{\rm O}_{\rm 2}}$ relative to the FQM (fayalite–quartz–magnetite) buffer (P H2O = P total) based on the calibration of Wones (Reference Wones1989). (b) Binary IVAl vs. Fe# [Fe2+/(Fe2++Mg2+)] plot (apfu) for amphibole (
 $f_{{\rm O}_{\rm 2}}$ fields after Anderson and Smith, Reference Anderson and Smith1995). (c) Log
 $f_{{\rm O}_{\rm 2}}$–T diagram based in biotite chemistry (after Wones and Eugster, Reference Wones and Eugster1965) illustrating the redox conditions of Ardestan biotites. (d) Variations in the FeO/(FeO + MgO) ratio vs. MgO in biotites from the study area; diagram after Zhou (Reference Zhou1986).

Upper mantle-derived magmas tend towards lower oxygen fugacity ∆FQM (–4 to + 3) than do crustally-derived magmas (∆FQM = –2 to + 5) (McCammon, Reference McCammon2005). Fairly high  $f_{{\rm O}_{\rm 2}}$ (∆FQM ~ +1.0 to +2.0) of Ardestan samples permit both mantle and crustal contributions but allow for volumetrically significant mantle contributions. These findings are in accord with mineralogical data plotting in a mantle–crust mixed source field in FeO/(FeO + MgO) versus MgO in biotite and TiO2 versus Al2O3 in amphibole diagrams (Fig. 13d) and clearly confirm the mantle–crust interaction hypothesis proposed by Babazadeh et al. (Reference Babazadeh, Ghorbani, Bröcker, D'Antonio, Cottle, Gebbing, Mazzeo and Ahmadi2017) for the Ardestan plutonic rocks.
Halogen compositions of biotite
The calculated parameters of log ( $f_{\rm H_2O}$/f HF), log (
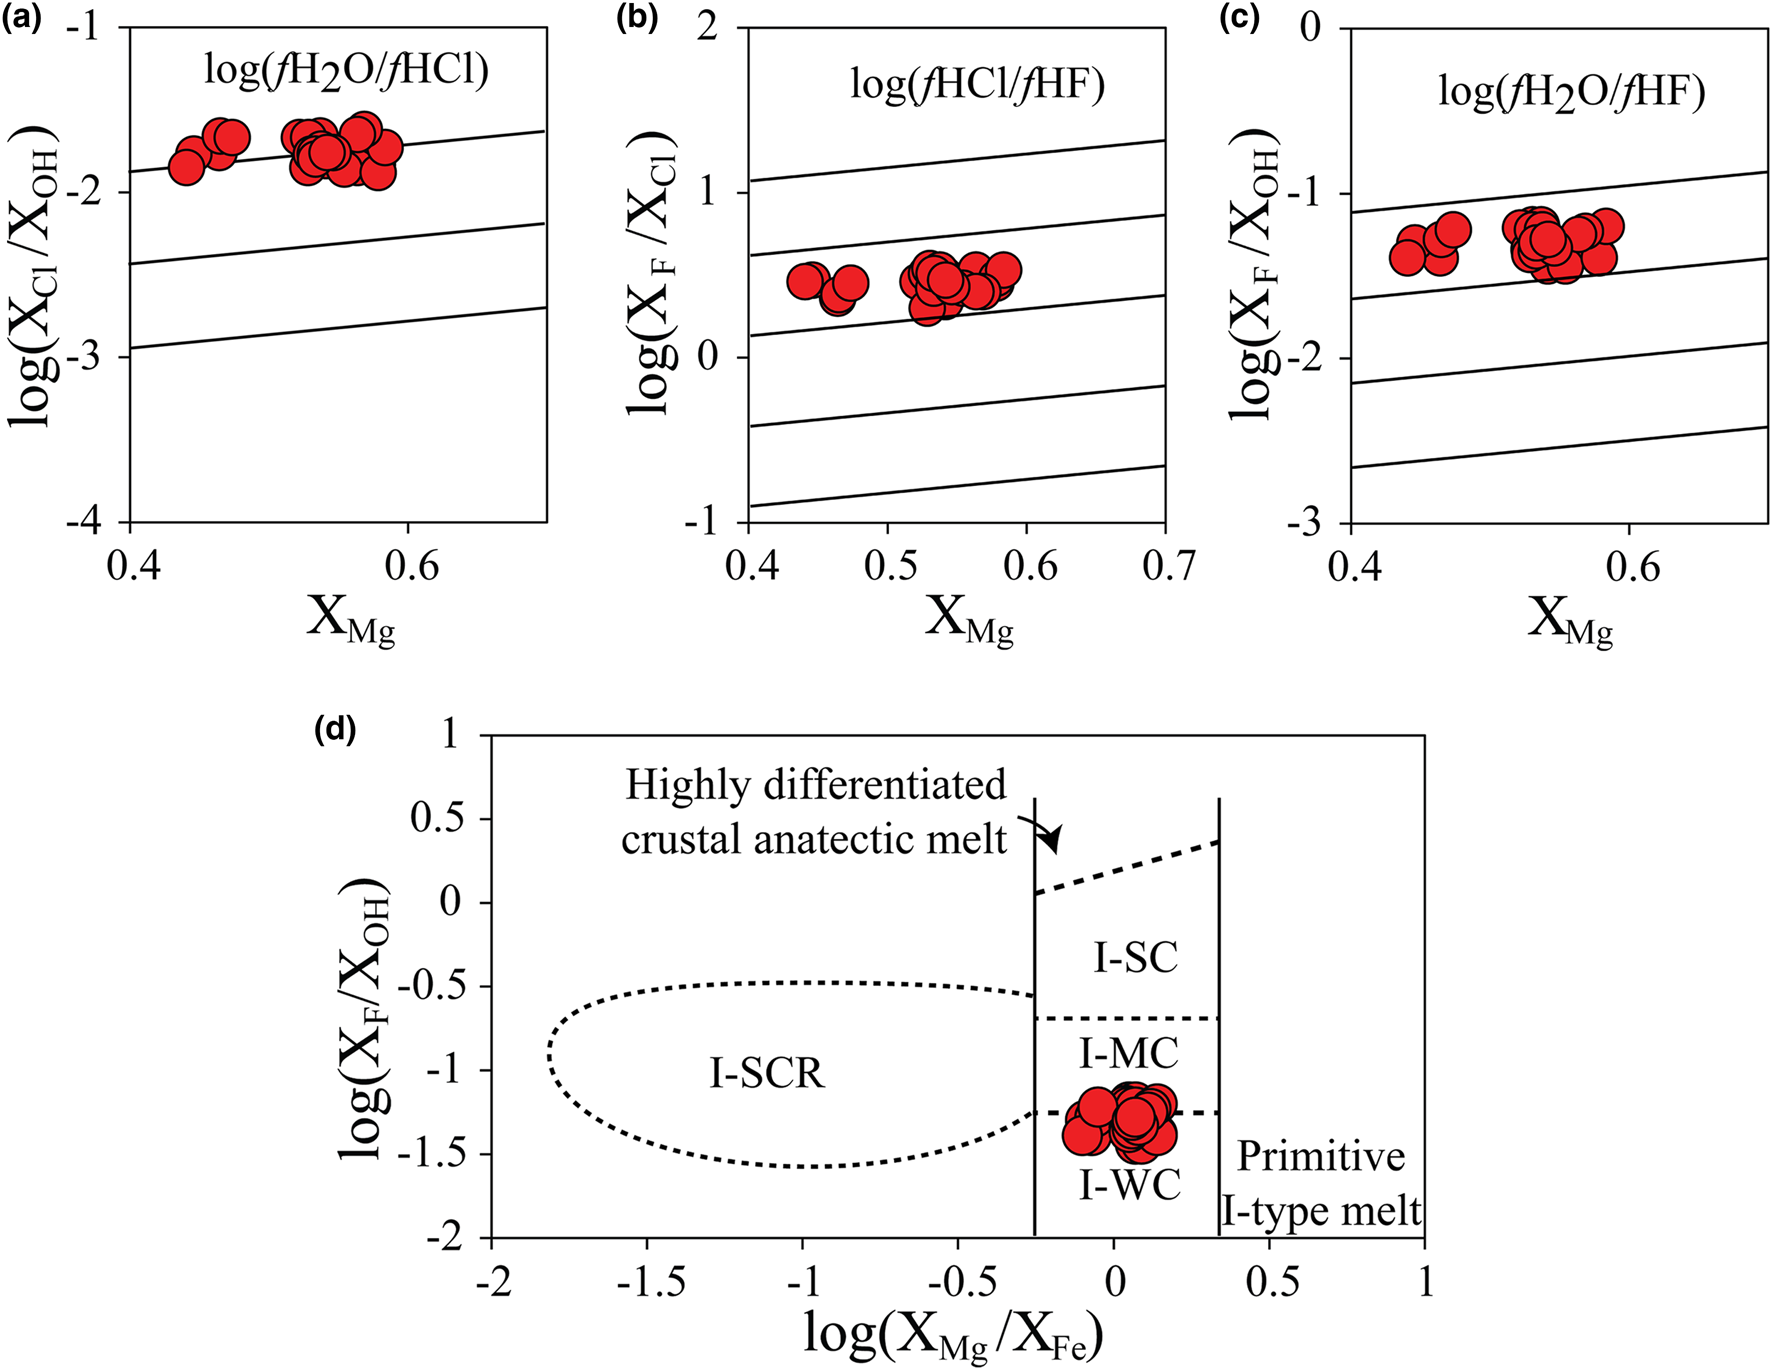
 $f_{\rm H_2O}$/f HCl), and log (f HF/f HCl) values for Ardestan plutons are shown in Table S4 and Fig. 14, where it is seen clearly that these parameters have very limited variation among the Ardestan granitoids. Values of log (
 $f_{\rm H_2O}$/f HF) range from 4.90 to 5.36 and values of log (
 $f_{\rm H_2O}$/f HCl) range from 1.78 to 3.13. X Mg, X sid and X an of biotites were used to calculate the halogen intercept values IV(F), IV(Cl), and IV(F/Cl) following Munoz (Reference Munoz and Bailey1984). The IV(F), IV(Cl), and IV(F/Cl) in the Ardestan biotites vary between 2.15 to 2.95, −3.60 to −4.40 and 6.30 to 7.20, respectively (Table S4).
(a,b,c) X Mgvs. log (X Cl/X OH), log (X F/X OH) and log (X F/X Cl) for the primary Ardestan biotites. (d) Plots of the Ardestan biotite in log (X Mg/X Fe) vs. log (X F/X OH) discrimination diagram of Brimhall and Crerar (Reference Brimhall, Crerar, Carmichael and Eugster1987): I-MC: I-type moderately contaminated; I-SC: I-type strongly contaminated; ISCR, I-type strongly contaminated and reduced; I-WC: I-type weakly contaminated.

The HCl/HF ratios in magmatic Ardestan biotites vary from 0.5 in sample AR2 to 0.15 in sample AR10. These changes may reflect the bulk geochemical evolution of the Ardestan magmas, i.e. the later sample is more evolved relative to the first. This relationship between chlorine and fluorine was attributed to the greater propensity for chlorine to partition into fluid that was continually off-gassed (Rasmussen and Mortensen, Reference Rasmussen and Mortensen2013). The halogen content of biotite grains (Figs 14a–c) indicate that the log (X F/X OH), log (X Cl/X OH) and log (X F/X Cl) values plotted against X Mg of Ardestan biotites are parallel to the lines representing the logs of ( $f_{\rm H_2O}$/f HCl), (f HCl/f HF) and (
 $f_{\rm H_2O}$/f HF). Zhu and Sverjensky (Reference Zhu and Sverjensky1992) showed that biotite phenocrysts which formed under similar T, P and fluid composition display linear trends on log (X Cl/X OH) versus X Mg plot.
The Ardestan biotite chlorine intercept values (IV(Cl) = –4.47 to –4.93; Table S4) are related to Cl values in biotites from igneous rocks, as noted by Munoz (Reference Munoz and Bailey1984). Smaller fluorine intercept values are correlated with higher relative degrees of fluorine enrichment in fluid and more negative chlorine intercept values correlate with higher chlorine enrichment. Low IV(F/Cl) values of Ardestan biotites correspond to a high F/Cl ratio. The relatively narrow range of F and Cl values in Ardestan biotites shows similar and narrow ranges of IV(F) and IV(Cl), respectively. This indicates that incorporation of F and Cl in biotite in the Ardestan plutonic rocks was mainly controlled by X Mg in the octahedral site of biotite. This evidence clearly rules out the interaction of the composition of Ardestan biotite with hydrothermal solutions.
Variations in the Mg/Fe and F/OH ratios in magmatic biotite can be used to investigate contamination of magmas derived from upper mantle or subducted slabs with continental crustal source components by such processes as partial melting, magma mixing, and assimilation in the igneous rocks (Ague and Brimhall, Reference Ague and Brimhall1988). I-type granitoids containing biotite with log (X Mg/X Fe) > –0.21 have been divided by Brimhall and Crerar (Reference Brimhall, Crerar, Carmichael and Eugster1987) into three subgroups based upon increasing F/OH ratios (Fig. 14d). The three subgroups of the I-type granitoids are characterised by high oxidation states. The granitoids containing biotite with log (X Mg/X Fe) < –0.21 have been classified as extensively contaminated and reduced (I-SCR type). Ardestan biotites with (X Mg/X Fe) > –0.21 indicate the crystallisation of biotite from weakly to moderately crustal-contaminated, I-type granitic magma (Fig. 14d).
Summary of barometric, oxygen fugacity and halogen findings
Estimated crystallisation parameters reveal a consistent range of pressure and temperature in the study area. Application of the Al-in-biotite barometer on Ardestan rocks indicates crystallisation under mid-crustal pressure (~5.5 kbar) and temperature (~740–780°C) conditions. The mineralogical evidence reveals fairly high  $f_{{\rm O}_{\rm 2}}$ (∆FQM ~ +1.0 to +2.0) and H2O contents of their parent magmas, which are in accordance with the appearance of Mg-rich biotite in the Ardestan granitoids. Taken together, these observations allow for the possibly of a minor crustal contribution in their petrogenesis.
Constraints on silica content, T Zr.sat°C and T magma temperatures
Zircon and bulk-rock Zr-based thermometric parameters have become fundamental to petrogenetic models of magmatism, from which broader geochronological and tectonic implications are being made. T Zr.sat°C changes during magma crystallisation, and essentially increases as fractional crystallisation proceeds, whereas true magmatic temperatures (T magma) decrease (Siégel et al., Reference Siégel, Bryan, Allen and Gust2018). Low-silica magma (<64 wt.% SiO2; Siégel et al., Reference Siégel, Bryan, Allen and Gust2018) is assumed to be Zr-undersaturated (e.g. Charlier et al., Reference Charlier, Wilson, Lowenstern, Blake, Van Calsteren and Davidson2005). Thus zircon crystals in such rocks are assumed to either be inherited or have crystallised from late-stage extremely fractionated magma. In contrast, Zr-saturated high-silica magmas (>64 wt.% SiO2; Siégel et al., Reference Siégel, Bryan, Allen and Gust2018) contain autocrystic zircons. Zircon saturation temperatures (T Zr.sat°C) calculated from bulk-rock compositions provide minimum estimates of temperature if the magma was undersaturated, but maximum temperatures if it was saturated.
The comparison of T Zr.sat°C and T Magma for an igneous suite is instructive in identifying Zr-undersaturated and Zr-oversaturated magmas. The cross-over of T Zr.sat°C and T Magma in T–SiO2 space is magmatic system dependent and is also affected by the choice of calibration used for the T Zr.sat°C calculations (Watson and Harrison, Reference Watson and Harrison1983; Boehnke et al., Reference Boehnke, Watson, Trail, Harrison and Schmitt2013; Gervasoni et al., Reference Gervasoni, Klemme, Rocha-Jönior and Berndt2016). Miller et al. (Reference Miller, McDowell and Mapes2003) concluded that T Zr.sat°C and zircon inheritance distinguish two distinct classes of intrusive rocks: (1) cold inheritance-rich granitoids which appear to form at temperatures too low (T Zr.sat°C <800°C) for dehydration melting involving biotite or hornblende and probably require fluid influx; and (2) hot inheritance-poor granitoids which form through dehydration melting (T Zr.sat°C >800°C) and, if produced in the crust, require a substantial transient heat flux. Cold granites are relatively crystal rich and unlikely to erupt, whereas hot granites are drier, contain fewer crystals and are highly eruptible. Ti-in-zircon for most Ardestan plutonic zircons recorded lower temperatures than T Zr.sat°C of their host rocks. Moreover, the low silica content of Ardestan magma (<64 wt.% SiO2) which is compatible with Zr-undersaturation and provides minimum estimates of temperature, indicates zircon crystallised from fractionated magmas. Fu et al. (Reference Fu, Mernagh, Kita, Kemp and Valley2009) also suggested that Ti-in-zircon temperatures significantly below the expected conditions of zircon saturation might be attributed to crystallisation from a late evolved hydrous melt that is significantly different from the bulk rock. We note that hornblendes in the Ardestan plutonic rocks are characterised typically by low IVAl and low crystallisation temperatures, suggesting that they are derived from a cold magma (<800°C). This interpretation is supported by the petrographic observations, because hornblendes coexist with a mineral assemblage involving quartz, biotite, plagioclase, titanite, apatite and zircon, common to intermediate magmas.
The evolution of Ardestan magmas
Geodynamic evolution
The tectonic evolution of the Zagros orogeny is related to subduction of the Neotethyan oceanic crust beneath the Central Iran plate. Two major models have been proposed to account for the geodynamic evolution of the Zagros orogeny within the frame of the Arabia–Eurasia collision. Verdel et al. (Reference Verdel, Wernicke, Hassanzadeh and Guest2011) attributed the Urumieh–Dokhtar Paleogene magmatism to an extensional stage which has been prompted by an episode of slab retreat or slab rollback. Agard et al. (Reference Agard, Omrani, Jolivet, Whitechurch, Vrielynck, Spakman, Monié, Meyer and Wortel2011) suggested that the Late Paleocene–Eocene witnessed a magmatic shift from the Sanandaj–Sirjan zone to the Urumieh-Dokhtar magmatic assemblage and an increase in magmatic activity, probably as a consequence of restart of oceanic slab subduction below the Iranian plate. Agard et al. (Reference Agard, Omrani, Jolivet, Whitechurch, Vrielynck, Spakman, Monié, Meyer and Wortel2011) considered the Oligocene time as a dormant period with strongly reduced or absent magmatic activity. Yeganehfar et al. (Reference Yeganehfar, Ghorbani, Shinjo and Ghaderi2013) concluded that the Oligocene–Miocene basic magmatism in the central part of Urumieh-Dokhtar magmatic assemblage is compatible with a geodynamic model that includes asthenospheric mantle upwelling prompted by or accompanied by a slab rollback in a subduction-related mantle wedge.
From a geodynamic point of view, Babazadeh et al. (Reference Babazadeh, Ghorbani, Bröcker, D'Antonio, Cottle, Gebbing, Mazzeo and Ahmadi2017) proposed that subduction of the Neotethyan plate may have been initiated in the Early Cenozoic and the low-dip slab penetrated the mantle beneath central Iran. With significantly enhanced convergence rates during Cenozoic, the subducted slab descended more quickly with a higher dip, resulting in decompression melting and an influx of magma sources to shallower depths. Backwards migration of the descending slab into the asthenospheric mantle (slab rollback) could result in strong upwelling of the asthenosphere. With the continuous supply of hot mantle-derived magmas, the basic melts formed magma chambers in the crust. Because of the hotter and lower viscosity of basic melt than the crustal melt, the interaction between basic and acidic melts in magma chambers would remain as distinct physical entities until they reach thermal equilibrium and comparable viscosities. Therefore, the melts have experienced assimilation and fractional crystallisation processes; this led to exchange in thermal, mineral and chemical diffusion.
Conclusions
The Ardestan plutonic suite provides thermobarometric and compositional constraints on the evolution of the Urumieh–Dokhtar Magmatic Assemblage in central Iran. Specifically, our results include the following:
(1) High-An content plagioclase (i.e. An70–90 in the core) in Ardestan samples nucleated in mantle-derived magma which is more basic than the sampled granitoids. Crystallisation of low-An plagioclase (i.e. An70–30 in the rim) probably indicates transfer of magma into a shallow crustal feldspar-rich magma chamber (pressure <6.5 kbar).
(2) The shape of CSD curves in the Ardestan samples is consistent with this scenario of magma mixing. Oscillatory zoning and the presence of sieve texture along with the medium Al and Mg contents in amphibole and biotite, respectively, show variable physical-chemical conditions in the magma chamber and the possible occurrence of magma mixing during plagioclase crystallisation in the Ardestan plutonic rocks.
(3) Young Ardestan zircons (i.e. not the small ~550 Ma population) have a continental affinity (high U/Yb ratios) and magmatic origin (Sm/LaN >10). Enrichment in LREE and moderate- to- negative Ce anomalies in some zircons is attributed to a change in the host magma composition and/or crystallisation of zircon under high aqueous fluid activity at the end of magmatic crystallisation.
(4) The Ti-in-biotite geothermometer gives temperatures that average 730 ± 56°C and are slightly higher than temperatures obtained by conventional Ti-in-zircon thermometry, and similar to the average T Zr.sat°C. The low SiO2 content of Ardestan magmas is compatible with Zr-undersaturated conditions and provides a minimum temperature estimate, indicating zircon crystallised from fractionated magma.
Acknowledgements
SB is grateful to the Geological Survey of Iran for their assistance in obtaining XRF analyses. IL thanks the Brazilian Scientific Mobility Program for sponsoring her educational experiences in the US. We collectively express our gratitude to two anonymous reviewers whose comments have strengthened the paper, and to Helen Kerbey for her patient assistance throughout the editorial process
Supplementary material
To view supplementary material for this article, please visit https://doi.org/10.1180/mgm.2019.44.