1. Introduction
With emissions from land use change representing up to 20 per cent of anthropogenic greenhouse gas (GHG) emissions, reducing emissions from deforestation and degradation (REDD) has been proposed as a potentially inexpensive and plentiful source of emission abatement. Proposals for including REDD in the global response to climate change have gained momentum in recent years and found broad support at the global level, which culminated in an agreement at the United Nations Climate Change Conference in Cancún in 2010 on REDD+ (including the enhancement of forest carbon stocks in developing countries). Besides the establishment of REDD as an instrument of international climate policy, the Cancún agreement and its further developments at the 2011 climate change conference in Durban will mobilise substantial financial flows from industrialised to developing countries that undertake REDD policies including conservation and sustainable management of forests.
While the basic premise of REDD is universal to all proposals – that emissions are avoided through reductions in the rate of deforestation – virtually all other aspects, from measurement methodologies to financing sources, are still being debated. In the context of the overall global approach to climate change, REDD is an important test of the ability of developed and developing nations to cooperate in addressing mitigation of carbon emissions. A number of REDD proposals identify global funds or emissions trading markets, or both, as preferred sources of funding. Advocates of market-based approaches refer to the benefits of allocative efficiency and the ability to mobilise the large amounts of capital required to enable large emissions reductions. In this context, the Eliasch Review emphasised the importance of including the forest sector in international emissions trading schemes, as this would substantially reduce the costs of reducing global carbon emissions, and lower costs would enable more ambitious overall emissions targets (Eliasch, Reference Eliasch2008).
However, for a REDD market mechanism to advance, two key prerequisites will need to be addressed: that REDD credits be environmentally equivalent to other compliance units and that REDD units not ‘flood’ emissions markets with excess supply. Regarding the first issue, in particular the adequate estimation of reduced emissions remains a challenge, and linking distribution of carbon finance to countries’ efforts in slowing deforestation rates has been proposed (Combes Motel et al., Reference Combes Motel, Pirard and Combes2009). Regarding the second prerequisite, the European Commission notes that the introduction of REDD units into the EU Emissions Trading System (EU ETS) could result in a serious supply and demand imbalance (European Commission, Reference Commission2008; European Union, 2008). Previous studies have argued that extensive offset-crediting via REDD could induce an excess of supply over demand leading to lower prices and a destabilisation of the compliance market, unless regulatory reforms improve the efficiency and environmental performance of the existing mechanisms (Carbon Trust, Reference Trust2009; Michaelowa and Dutschke, Reference Michaelowa, Dutschke, Palmer and Engel2009; Schmidt, Reference Schmidt2009).
The associated diminishing of carbon price signals could restrain technological change towards a low-carbon economy. Regarding the EU perspective, Caparrós et al. (Reference Caparrós, Ovando, Oviedo and Campos2010) investigate carbon accounting rules for a post-Kyoto world, opting for a change in focus of EU subsidies from reforestation to avoided degradation. Also the scope and costs of REDD credit supply itself are thus far uncertain: questions about the exact baseline rate of deforestation, regional differences in carbon sequestration potential, as well as the opportunity costs of REDD (in terms of foregone land use returns and forest product prices) remain unanswered.
In the same vein, Angelsen (Reference Angelsen2008) raises important questions to be addressed before the REDD mechanism can become a viable climate policy option, such as the accurate measurement of emission reductions, ensuring additionality of reductions beyond business-as-usual (BAU), leakage and permanence effects – proposing appropriate monitoring and accounting methods as well as liability schemes. Regarding the risk of ‘market flooding’ by the integration of REDD, Angelsen (Reference Angelsen2008) proposes including REDD in a global climate agreement in which overall emission targets could be more ambitious without raising overall costs. Also Ebeling and Yasué (Reference Ebeling and Yasué2008) argue that the success of REDD in terms of climate change mitigation, forest conservation and economic development will strongly depend on accompanying measures and carefully designed incentive structures.
Motivated by these insights, we focus on the carbon market implications of REDD by studying the role of carbon market regulations and future emissions reduction commitments, as well as uncertainties in REDD credit supply. Restricting the supply and demand of REDD credits has been proposed to limit a flooding of the post-2012 carbon market. Alternatively, an increase in the commitments of industrialised countries would increase credit demand and thus limit adverse price impacts. Uncertainties in the scope and costs of REDD credit supply might substantially alter the associated carbon market effects.
The economic aspects of international emissions trading have been assessed in a number of previous quantitative studies of the Kyoto Protocol and the EU ETS (e.g., Weyant and Hill, Reference Weyant and Hill1999; Böhringer et al., Reference Böhringer, Hoffmann, Lange, Löschel and Moslener2005; Klepper and Peterson, Reference Klepper and Peterson2006) as well as in the context of poverty alleviation in developing countries (Ojha, Reference Ojha2009). The quantitative economic literature assessing deforestation in the context of climate policy is comparably scant. Linking a forestry model to a climate-economy model, Sohngen and Mendelsohn (Reference Sohngen and Mendelsohn2003) analyse the general role of forests in GHG mitigation, predicting that forest sequestration will account for about one-third of global carbon abatement within the next century. Tavoni et al. (Reference Tavoni, Sohngen and Bosetti2007) study the contribution of forestry management to long-term CO2 stabilisation policies, finding that increased forest sequestration could significantly lower the global costs of climate policy. Studies focusing on the emissions-market implications of REDD include Anger and Sathaye (Reference Anger and Sathaye2008), who provide a first assessment of the economic implications of crediting REDD for the post-Kyoto carbon market. Cabezas and Keohane (Reference Cabezas and Keohane2008) find that forest carbon credits from developing countries, including REDD credits, have considerable potential to help limit the costs of compliance with cap-and-trade systems in the EU and the USA. While the principle economic interactions between REDD and carbon markets have been assessed before, these previous studies abstract from three important issues: the role of policies which restrict REDD credit demand or supply, the potential for expanded commitments through REDD, and REDD cost and supply uncertainties.
Against this background, this paper analyses the carbon-market impacts of integrating REDD in future climate policy with a three-fold contribution: we study the economic implications of (i) policies restricting REDD credit demand or supply, (ii) REDD cost and supply uncertainties, and (iii) the potential for expanded emission reduction commitments through REDD as an additional mitigation option. To this aim we employ a numerical multi-country equilibrium model of the global carbon market in the year 2020 which incorporates marginal cost functions for carbon abatement from reduced deforestation. The model covers international emissions trading at the government level as facilitated by a post-Kyoto agreement and enables an explicit assessment of international carbon permit trade flows generated from the introduction of REDD.
The remainder of this paper is organised as follows. Section 2 provides a brief theoretical background on carbon market regulations. Section 3 presents our numerical model framework. The quantitative simulation results are presented in section 4. Section 5 discusses the limitations of this study. Section 6 concludes.
2. Theoretical background
This section aims to explain the theoretical economic intuition of carbon-market impacts associated with the REDD policy scenarios described in the next section. For brevity, we focus on the two most relevant cases: restrictions of supply and demand of REDD credits. We further study the implications of expanding emission reduction commitments for these two market regulations.
Figure A1 in online appendix B (which contains all the figures for this paper), available at http://journals.cambridge.org/EDE, describes the international market for REDD credits, denoting upward-sloping credit supply by tropical rainforest regions with S and downward-sloping credit demand by Annex I countries with D, as well as prices for REDD credits by P and quantities by Q, respectively. The carbon-market implications of restrictions on the demand for REDD credits are as follows. The implementation of a demand limit changes the demand curve to D′, which results in a new market equilibrium with a lower price level and a lower quantity of REDD credits. This new market situation implies diminished producer rents for the supplying tropical rainforest regions (by the aggregate area a+b in figure A1) and augmented consumer rents for the purchasing Annex I countries (by the aggregate area a−c in figure A1). The overall deadweight loss through demand-side REDD market regulation is thus given by areas b and c.
Figure A2 illustrates the consequences of restrictions on the supply of REDD credits. The implementation of a supply limit alters the supply curve to S’, which results in a new market equilibrium with a higher price level and a lower quantity of REDD credits.
This new market situation implies higher producer rents of tropical rainforest regions (by the aggregate area d–f in figure A2) and lower consumer rents of Annex I countries (by the aggregate area d + e in figure A2). The overall deadweight loss through supply-side REDD market regulation is thus given by areas e and f.
We now turn to the carbon-market implications of expanding emission reduction commitments of Annex I countries for the two cases of market regulation. For a carbon market with restrictions on demand for REDD credits, expanding Annex I commitment levels induces an upward shift of the REDD credit demand curve only within the range of the demand limit (shown in figure A3). As a consequence, the carbon-market equilibrium remains unchanged by the commitment expansion.
Finally, in a carbon market with restrictions on the supply of REDD credits, expanding commitments induce an upward shift of the REDD credit demand curve to the new demand function D’ (shown in figure A4). This results in a new market situation with a higher price level but – due to the supply limit – unchanged quantity of REDD credits. Consequently, the economic rents of tropical rainforest regions are augmented, while those of Annex I countries are diminished.
3. Numerical framework
3.1. Model framework
In order to quantify the carbon market impacts of reducing deforestation we employ a numerical equilibrium model of the global carbon market, which incorporates marginal abatement cost functions for reduced deforestation.
3.1.1. Accounting for the forestry sector in tropical regions
In order to represent the response of the forestry sector to changes in future carbon prices, we incorporate data from the dynamic partial equilibrium model Generalized Comprehensive Mitigation Assessment Process (GCOMAP), which was employed in several comparable studies before (Sathaye et al., Reference Sathaye, Makundi, Dale, Chan and Andrasko2005, Reference Sathaye, Makundi, Dale, Chan and Andrasko2006). This model is suitable for our exercise as it explicitly analyses the carbon benefits of forestation globally in 10 regions and of carbon-price-driven reduced deforestation in four important tropical rainforest regions (FAO, 2005): Africa, South-East Asia, Central America and South America. It establishes a reference case level of land use, absent carbon prices, for 2000–2100 before simulating the response of forest land users to changes in prices in forest land and products, as well as prices emerging in carbon markets. The model's objective is to estimate the land area that land users would plant above the reference case level, or prevent from being deforested, in response to carbon prices. As a result, GCOMAP estimates the net changes in carbon stocks while meeting the annual demand for timber and non-timber products. For a more detailed explanation of GCOMAP, please see online appendix C.
Clearly, there are other factors of land use that go beyond the scope of our modelling exercise. Angelsen and Kaimowitz (Reference Angelsen and Kaimowitz1999) argue that in particular macroeconomic factors such as infrastructure, labour market conditions or foreign debt play a role and that consequently policy reforms included in current economic liberalisation and adjustment efforts may increase the pressure on forests.
In order to consider the role of institutional barriers for crediting carbon abatement from reducing deforestation, GCOMAP accounts for the transaction costs of forestry projects and programmes (hereafter also referred to as projects, see Antinori and Sathaye, Reference Antinori and Sathaye2007). Such transaction costs may arise from project search and feasibility studies, as well as negotiation, monitoring and verification, regulatory approval, and insurance costs.
Proposals for the inclusion of REDD credits in international carbon markets have included provisions for project-based crediting and for national-level crediting. Under national-level crediting, individual nations are compensated for their performance in reducing deforestation. In order to achieve reduced national deforestation, nations aggregate projects at the domestic level and implement relevant policies and measures. While GCOMAP explicitly models projects, we generalise the resultant regional marginal abatement cost functions to represent regional aggregations of national-level crediting cost functions.
In our analysis, we assume full fungibility between REDD credits and carbon credits generated in the energy sector. Thus, it is assumed that REDD emission reductions are environmentally equivalent to emission reductions in the energy sector: each ton of CO2 equivalent reduced via REDD in rainforest regions (vs. a historical deforestation baseline) would generate one credit that is equivalent to and interchangeable with a standard emission allowance of the energy sector of Annex I countries. While this market design ensures maximum liquidity on the carbon market, alternative market designs have been proposed that limit the fungibility of REDD credits and thus their impacts on the carbon market. Such limiting can either be ensured via ‘credit discounting’ (requiring a higher than one-to-one ratio of REDD credits when used as a substitute for other carbon credits) or through preliminary market insulation (the so-called ‘dual markets’ approach), in which REDD credits are not interchangeable with other carbon credits (WWF, 2009). For our assessment we choose the full fungibility option as a reference case, as our objective is to ceteris paribus analyse the carbon market impacts of REDD credit supply and demand regulations as compared to unlimited REDD trade.
3.1.2. Modelling the global carbon market including reduced deforestation
In order to quantitatively assess the emissions market impacts of reducing deforestation we employ a numerical multi-country, two-sector partial equilibrium model of the global carbon market in 2020. For each region, the model incorporates calibrated marginal abatement cost functions for energy-intensive and non-energy-intensive sectors. Building on the modelling framework of Anger (Reference Anger2008), the core model represents parallel carbon markets for (i) companies covered by the EU ETS and emerging schemes outside Europe, as well as (ii) post-Kyoto governments in 2020 and accounts for emissions reductions via the CDM. For this study, we focus on the carbon market for post-Kyoto governmental compliance. The objective of the model is to minimise compliance costs of achieving targeted carbon emissions reductions by means of international emissions trading. For a more detailed explanation of the model, please see online appendix C.
To generate marginal abatement cost (MAC) functions by region and sector we use data simulated by the well-known energy system model POLES (Criqui et al., Reference Criqui, Mima and Viguier1999), which explicitly covers energy technology options for emissions abatement in various world regions and sectors for the base year 2020. In the geographic disaggregation of the model, the world is divided into 38 key regions. For each region, the model articulates four main modules dealing with final energy demand by main sector, new and renewable energy technologies, the conventional energy and electricity transformation system, as well as fossil fuel supply. The model thus enables us to produce detailed long-term world energy outlooks with demand, supply and price projections, as well as marginal abatement cost curves for CO2 emissions by region.
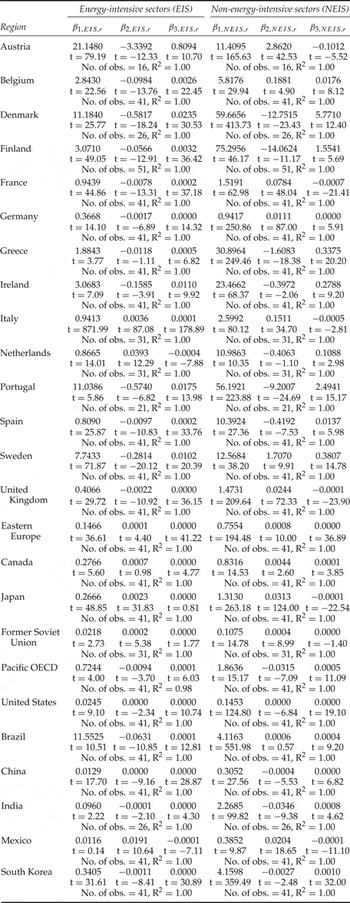
In the POLES simulations a sequence of carbon taxes (e.g., US$ 0 to 100 per ton of carbon) is imposed on the respective regions, resulting in associated sectoral emissions abatement. Based on these data sources, we then estimate the coefficients for MAC functions in 2020 by an ordinary least squares (OLS) regression of tax levels (i.e., marginal abatement costs) on associated emissions abatement. Following Böhringer et al. (Reference Böhringer, Hoffmann, Lange, Löschel and Moslener2005), in order to assure for functional flexibility, a polynomial of third degree is chosen as the functional form of MAC functions.Footnote 1 For region r and sector i this results in the following equation (here, EIS and NEIS denote energy-intensive and non-energy-intensive sectors, respectively):

with MAC ir as marginal abatement cost in region r and sector i ∈ {EIS, NEIS}, β1,ir, β2,ir and β3,ir as marginal abatement cost coefficients, e 0ir as baseline emissions level in 2020, and e ir as emissions level after abatement. Table 1 shows the resulting least-square estimates of MAC coefficients by region and sector in 2020.Footnote 2
Marginal abatement cost coefficients (and corresponding statistics) for conventional abatement options (€2005)

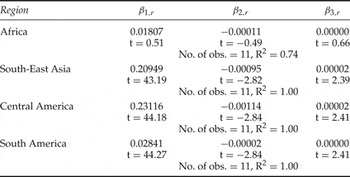
Following Anger and Sathaye (Reference Anger and Sathaye2008), MAC functions for reducing deforestation are generated by imposing a sequence of carbon prices (here: US$ 0 to 100 per ton of carbon) in four tropical rainforest regions with the GCOMAP model: Africa, South-East Asia, Central America and South America. This results in a sequence of regional net carbon stock changes and the corresponding carbon emissions reductions due to avoided deforestation. Based on these price-quantity pairs we are able to estimate the coefficients of regional MAC functions in 2020 by means of an OLS regression. Finally, these MAC coefficients are implemented into the carbon market model by covering tropical rainforest areas as explicit model regions.
Regarding data on the key deforestation parameters, GCOMAP uses the following sources of information. First, data for the carbon density parameter are derived from the FAO (2005) Global Forest Assessment. The carbon density values of forest stock include above- and below-ground living biomass, dead wood and litter, which vary by country. Second, the opportunity cost of reducing deforestation includes the net present value (NPV) of timber that might be harvested prior to removal or burning of the live and dead wood from the forested area, and the NPV of the revenue stream from the planting of annual or perennial crops, timber plantations and cattle ranching. Third, the baseline is estimated on the basis of FAO historical deforestation rates for each region – baseline values are described in Sathaye et al. (Reference Sathaye, Makundi, Dale, Chan and Andrasko2006).
In sum, the GCOMAP model and the POLES model are employed to generate supply functions (i.e., marginal abatement cost functions) of the forestry sector and the energy sector, respectively. These supply functions serve as input for our carbon market model, which represents the carbon market equilibrium where supply of and demand for REDD credits are settled. Within our linked model framework, tropical rainforest regions may export emissions reduction credits from reducing deforestation to industrialised model regions via the global carbon market. Table 2 presents the estimated marginal abatement cost coefficients for avoided deforestation for the four tropical regions in 2020. In table 2, comparing the slope coefficients β1,ir across regions implies that Africa features the lowest marginal abatement costs among REDD regions. This is due to Africa's low opportunity costs of foregone land use and its low rate of export of wood products into international markets. In particular, the amount of illegal logging and hence timber harvested prior to REDD in Africa is small relative to that in the other regions, which results in a relatively low opportunity cost of reducing emissions from deforestation in Africa. Previous studies have already shown that abatement costs may differ largely across countries (Grieg-Gran, Reference Grieg-Gran2008).
Marginal abatement cost coefficients (and corresponding statistics) for reduced deforestation (€2005)

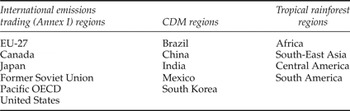
Table 3 presents the regional groupings of the carbon-market model as well as the classification of regions into Annex I regions, CDM host countries and tropical rainforest regions.Footnote 3
Regional participation in 2020

3.2. Baseline emissions and reduction targets
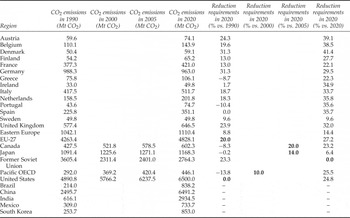
Baseline or BAU CO2 emissions trajectories are based on van Vuuren et al. (Reference van Vuuren, Lucas and Hilderink2006) who provide a nationally downscaled data set from the implementation of the standard global IPCC-SRES scenario B2 (IPCC, 2000) into the environmental assessment model IMAGE 2.2. Thus, here the IMAGE model is used exclusively to provide baseline emission levels for the energy sector. Baseline emission levels for the forestry sector are taken from FAO (2005).
Our study assumes that the framework established under the Kyoto Protocol is retained for the 2012–2020 period. In particular, it is assumed that Kyoto mechanisms remain in place and that the parties with commitments are restricted to those parties in Annex I that have commitments under Kyoto. Of course, these matters are currently the subject of negotiation.
Our modelling uses post-Kyoto emissions reduction targets for Annex I PartiesFootnote 4 based on public announcements through October 2008. Three of the largest Annex I players have yet to make declarations akin to those announced by most other Annex I Parties: the United States, Russia and the Ukraine. The United States is not participating in the Kyoto Protocol. President Barack Obama, however, advocates a national cap-and-trade scheme for emissions and a target of reducing US emissions to 1990 levels by 2020 (Obama and Biden, Reference Obama and Biden2008).
Russia and the Ukraine are expected to have surplus AAUs at the end of the first commitment period.Footnote 5 However, whether either would agree to deeper reductions than those they agreed under Kyoto is open to question.
The final assumptions about commitments are as follows. If countries announced two targets, with the higher depending on full international agreement, the lower target was chosen: the EU applies its target of 20 per cent reduction from 1990 levels, rather than 30 per cent;Footnote 6 the United States participates in a post-2012 agreement with a target of a 0 per cent reduction in emissions relative to 1990 levels; Canada has a target of reducing emissions by 20 per cent relative to 2006 levels by 2020 (Government of Canada, 2008); Japan has a target of reducing emissions by 14 per cent relative to 2005 levels by 2020 (Fukuda, Reference Fukuda2008); the Pacific OECD (Australia and New Zealand) has a target of 10 per cent reduction relative to 2000 levels by 2020;Footnote 7 and the former Soviet Union has a target of no increase over current projections for 2020 emissions.Footnote 8 An overview of baseline emissions and reduction targets is provided in table 4.
Baseline emissions and emission reduction targets by region in 2020 (announced commitments in bold numbers)

3.3. Policy scenarios
Restricting the supply and demand of REDD credits has been proposed as a means to limit a flooding of the post-2012 carbon market. Alternatively, an increase in commitments of industrialised countries would increase credit demand and thus limit adverse price impacts.
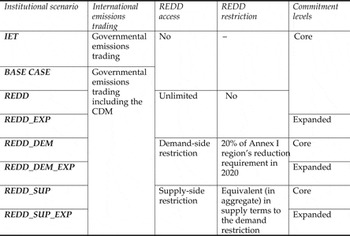
Against this background, in the following we present our policy scenarios of integrating REDD into the intergovernmental carbon market in 2020. The set of scenarios is summarised in table 5.
Carbon market scenarios for 2020

First, the international emissions trading (IET) scenario represents intergovernmental trading of carbon permits at the core emission reduction commitments laid out in the previous section and, for comparability, abstracts from CDM access for industrialised countries. Our Base Case scenario includes the option of unlimited CDM offset credit imports by Annex I regions from undertaking emission reduction projects in the developing world as well as core commitments, but assumes a carbon market that develops without crediting reduced deforestation. Against this Base Case, scenario REDD describes the access for industrialised economies to carbon abatement options in tropical rainforest regions via REDD credits. This scenario tests the impact of unlimited REDD fungibility and represents the maximum credit exchange case. It also provides a metric against which the other policy scenarios can be measured.
Managed (or restricted) exchange of REDD units has been proposed to mitigate concerns about both the quality of REDD units and the impact of REDD units on emissions markets. One way of restricting the fungibility of REDD units is by imposing demand restrictions on market participants via a supplementarity requirement that limits the proportion of emission reduction commitments which can be offset by imported units (scenario REDD_DEM). Another approach to limit total credits from reduced deforestation available to the market is to impose supply restrictions, in which supplying regions are only able to export a specified quantity of units (scenario REDD_SUP). For our demand-side restriction, each region subject to commitments is restricted to importing a maximum of 20 per cent of the required emissions reductions in 2020. For the supply-side restriction scenario, the total export of REDD units is limited to 20 per cent of the aggregate Annex I emission reduction requirements in 2020. Each REDD supply region is restricted to exporting a share of these units proportional to the REDD region's share of current term deforestation emissions.
For our three REDD scenario cases, we also study increased demand for REDD units through expanded commitments (represented in scenarios REDD_EXP, REDD_DEM_EXP and REDD_SUP_EXP). In each scenario, for comparability, Annex I commitment levels are expanded by an extent that yields similar Annex I compliance costs as our Base Case scenario, which assumed core commitments and the absence of REDD credits on the carbon market.
4. Simulation results
4.1. Results and assessment for core commitments
This section presents and discusses the simulation results for the core emissions reduction commitments of Annex I countries across the alternative policy scenarios. A complete set of quantitative results is presented in the tables of online appendix A, while online appendix B includes all relevant figures that will be discussed below.
We begin our quantitative analysis by assessing the carbon price impacts of alternative climate policy designs in the year 2020. The carbon constraints of Annex I countries result in an international permit price of roughly 38 per ton of CO2 if only governmental emissions trading is allowed (scenario IET).Footnote 9 The global carbon price decreases to €16 under our Base Case when we account for unlimited access by industrialised countries to the CDM, as the Annex I region is able to import carbon credits from low-cost emission abatement options in developing countries (scenario BASE CASE). This finding is consistent with previous studies (see, e.g., Böhringer et al., Reference Böhringer, Hoffmann, Lange, Löschel and Moslener2005; Klepper and Peterson, Reference Klepper and Peterson2006).
Against this background, figure A5 illustrates the carbon price impacts of introducing REDD into a future climate policy regime. We find that the international permit price is reduced by 45 per cent relative to the Base Case (which only includes the CDM) to roughly €9 per ton of CO2 if Annex I countries are granted unlimited access to carbon credits from avoided deforestation (scenario REDD). This price impact reveals the greater availability of carbon abatement options from REDD with lower marginal abatement costs than those CDM options used in the original carbon market equilibrium. This reflects the relatively low returns on land use and forest products in tropical regions and the resulting low opportunity cost of reducing deforestation. The increased competition on the supply side of the emissions market thus decreases the international permit price to the level of the REDD credit price.
Figure A5 further shows that restricting supply or demand for REDD credits to 20 per cent of each Annex I region's emission reduction requirement in the year 2020 limits the price-decreasing impacts of introducing REDD. We find that the international permit price generated under both the scenario REDD_SUP and scenario REDD_DEM is roughly €13 per ton of CO2, which represents a more moderate price decrease of 20 per cent compared to the Base Case. The reason is that in both cases the amount of low-cost REDD credits on the market is lower than in the case of unlimited REDD fungibility. However, in the case of a demand-side restriction, the REDD credit price decreases substantially to €4 per ton of CO2: a REDD demand restriction thus drives a wedge between the REDD credit price and the international permit price.
We now turn to the total costs for complying with the assumed emissions reduction commitments across alternative policy designs in the year 2020. Total compliance costs reflect the carbon-price effects discussed above, including the cost-decreasing effect of unlimited CDM access (shown in figure A6). Most importantly, we find that integrating reduced deforestation on the international carbon market yields large economic efficiency gains, decreasing Annex I compliance costs by more than one-third.
As noted above, the potential reduction in carbon price resulting from allowing unrestricted REDD access has raised concerns that this could cause critical delays in effecting crucial technological changes, such as the development of carbon capture and storage, necessary for achieving long term emissions targets. For this reason, restrictions on either the flows of REDD units onto emissions markets (supply restrictions) or the use of REDD units for compliance purposes (demand restrictions or ‘supplementarity’) have been proposed.
Against this background, figures A6 and A7 together indicate that mitigation of REDD carbon price impacts through the restriction of REDD supply or demand occurs at the expense of economic efficiency. While the total compliance costs for industrialised countries are still diminished through the introduction of REDD as compared to CDM access only, the cost savings from REDD are considerably lower when REDD supply and demand are regulated. However, figure A6 shows that compliance costs are significantly lower in the case of limited REDD demand as compared to the case of restricted supply – Annex I cost savings from REDD amount to 30 per cent for a demand limit, but only 15 per cent for the supply limit. This central result can be explained as follows: while restricting REDD demand decreases the REDD credit price, thereby reducing the producer surplus for tropical rainforest regions and increasing the consumer surplus of Annex I regions, restricting REDD supply has the opposite effect (compare again figures A1 and A2). In other words, the wedge between the REDD and the international permit price caused by a demand-side restriction decreases the total costs of REDD credit imports for Annex I regions and thus induces lower total compliance costs than a supply-side regulation.
In conclusion, of the two options for maintaining the international permit price, the option that best limits Annex I compliance costs is restricting REDD demand. However, demand restriction is the less desirable option for developing countries because they earn less from REDD activity, as shown in figure A7.
We now discuss the implications for the international trade of carbon permits. Figure A8 presents regional net REDD credit exports across our policy scenarios (see also table A6).Footnote 10 It shows that for unlimited REDD fungibility, Africa is the dominant credit exporter to Annex I countries, followed by South America. In comparison, the tropical regions of South-East Asia and Central America play a rather minor role on the market for REDD credits. The reason for Africa's dominance is the relatively low opportunity cost of abatement in this region combined with a large quantitative potential of reducing deforestation (in terms of forest area and projected deforestation activity).Footnote 11 In particular, Africa features relatively low opportunity costs of reducing emissions from deforestation as the amount of illegal logging and hence the timber harvested prior to deforestation is small relative to that in the other regions.
The situation is somewhat different under restricted REDD supply which results in a REDD price equal to the international permit price. This results in greater REDD activity in the regions other than Africa because competition between rainforest regions is restricted (each supplying region has its own cap) and a higher resultant price leads to increased REDD activity in other regions. Under this scenario REDD credits from Africa are roughly equal to South American exports and the level of REDD activity relative to BAU is similar in all tropical rainforest regions. Table A1 (online appendix A) presents the corresponding regional reductions of carbon emissions.
As well as improving overall efficiency by reducing Annex I compliance costs, the other key impact of REDD is to reduce the activity of the CDM through increased credit supply competition, as shown in figure A9. Base Case CDM credit exports are reduced by around a half under unrestricted REDD access and by around a quarter under the supply and demand restrictions, as shown in table A5. This occurs because some REDD emissions abatement occurs at a lower marginal cost than conventional CDM abatement options.
The substitution of REDD exports to Annex I countries for CDM credits translates into substantially lower net benefits to CDM host regions, as shown in table A2. In particular, under the unrestricted REDD access scenario (Scenario REDD) net economic benefits to CDM host regions drop to roughly one-third of that for the Base Case without REDD, and decrease to less than two-thirds in the case of supply or demand restrictions. This suggests that the combination of unlimited REDD access with no increase in Annex I commitments may significantly reduce CDM activity because of the greater economic attractiveness of REDD for Annex I regions.
4.2. Results for expanded commitments
This section presents and discusses the simulation results for expanded emission reduction commitments of Annex I countries across the alternative policy scenarios. Our central findings are illustrated in the figures in appendix B (the complete set of quantitative results is presented in table A2).
Taking advantage of the low cost of REDD abatement allows Annex I commitments to be extended by a significant degree with a consequent increase in emission reductions. As noted in section 3.3, for comparability we have maintained Annex I compliance costs at the same level in our expanded commitments scenarios as under the Base Case.Footnote 12
Unrestricted access to REDD allows Annex I commitments to be tightened by 23 per cent relative to our Base Case. This results in an average Annex I emissions target 25 per cent lower than business as usual, or 15.5 per cent lower emissions than 1990 levels in the year 2020 (shown in figure A10 and table A7). This corresponds to a tripling of the Annex I target under the Kyoto Protocol, which foresees a 5.2 per cent reduction vs. 1990 levels by the year 2012.
With REDD unit supply (demand) restrictions, Annex I commitments can only be increased by 7 (16) per cent relative to the Base Case at constant compliance costs. This results in an average Annex I emissions target of 21 (23) per cent lower than business as usual (shown in figure A10).
Despite the constant compliance costs through the expansion of commitments with REDD access in comparison to the Base Case (shown in figure A11), the impact on the carbon price differs across scenarios.
Figure A12 first illustrates that expanding commitments with unlimited REDD access at constant compliance costs (scenario REDD_EXP) increases the international permit and REDD credit price as compared to a REDD regime with core commitments (scenario REDD). However, tighter carbon constraints with REDD decrease the carbon price as compared to the Base Case and even induce a lower carbon value than REDD supply and demand restrictions at core commitments. Moreover, also expanding commitments with REDD restrictions at constant compliance costs does not increase the carbon price as compared to the Base Case. In these expansion cases, we find that demand-side restrictions induce a higher international permit price (and a lower REDD credit price) than supply-side measures, as in the first case credit demand is diverted to the non-REDD carbon market.
The impact of expanded Annex I commitments under the unrestricted REDD access scenario is to increase exports of REDD credits relative to the core commitments scenario, as shown in figure A13. The expanded demand for abatement by Annex I countries increases relatively low-cost REDD credit imports first, yielding a new market equilibrium at a higher REDD price. Put differently, REDD supply that was not economic under core commitments becomes economic under the higher emissions price that results from increased commitments.
Figure A13 also shows that REDD credit exports remain fixed with expanded commitments under both the supply and demand restrictions. These results correspond to the economic intuition in figures A3 and A4. Figure A3 illustrated that the impact of expanded commitments with a demand restriction is to shift the demand curve outward within the range of the restriction, resulting in an unchanged price and exports of REDD units. Figure A4 showed the effect of a supply restriction is also an outward shift of the REDD demand curve but with supply unchanged, which results in an increase in the price for REDD units (see figure A12). The effect of the increased price under the latter scenario is a transfer of rents from Annex I to REDD-supplying nations.
4.3. Sensitivity analysis
In the introduction we emphasised the importance of uncertainties around the cost and scope of REDD credit supply. As these uncertainties are derived from both REDD policy choices and the uncertainties in the forestry data input we have utilised, we now provide a sensitivity analysis around REDD marginal abatement cost. The corresponding simulation results are also presented in the tables of online appendix A.
The analysis illustrates the dynamics of the carbon market in 2020 over a broad range of REDD costs. The low-cost scenario (REDD_MAC) halves the marginal costs of REDD units supplied at any given REDD quantity as compared to the REDD scenario, while the high-cost scenario (REDD_MAC+) doubles the cost of supplied REDD units at any given REDD quantity compared to the REDD scenario. These two scenarios are otherwise identical to the REDD scenario and thus demonstrate the impact of a range of REDD cost assumptions on carbon prices, associated compliance costs, and transfers.Footnote 13
We find that international carbon permit prices are relatively robust to the tested changes in REDD supply functions. The impact on the international carbon price is within the +/− 20 per cent range – a level that is moderate given the large swing in REDD supply costs (shown in table A3). The impact on CDM host countries, however, is greater, with CDM exporters receiving a windfall of an additional 50 per cent net economic benefit with REDD supply costs increased, and losing 40 per cent of the economic benefit of the REDD scenario with REDD supply costs decreased.
In order to account for different levels of supply under expanded targets, two additional scenarios are modelled at the expanded commitment level for unlimited REDD access (i.e., at a 23 per cent expansion of core commitments). Again, marginal REDD supply costs are halved and doubled at each REDD quantity in these scenarios, which are denoted REDD_MAC_EXP and REDD_MAC+_EXP, respectively. We find that also for expanded commitments the carbon price impacts of alternative supply costs remain within the 20 per cent range. Impacts on CDM supplying regions are even less pronounced under expanded commitments with the net economic benefit within a +/− 35 per cent range of the benefit under the REDD expanded commitments scenario. The corresponding compliance cost impacts are provided in table A2.
The economic implications of crediting carbon abatement from avoided deforestation may also be influenced by the baseline against which the reductions in deforestation are measured. Anger and Sathaye et al. (2008) simulated the economic implications of a higher deforestation baseline of South America and found that the region almost doubled its exports of carbon-offset credits in that case. Furthermore, a higher baseline of one region affects the economic impacts for others via the carbon market: both the remaining tropical rainforest regions and traditional CDM host countries exhibit lower permit exports.
5. Caveats
This study is subject to a number of limitations. While our fairly transparent approach incorporates explicit marginal abatement cost functions of the carbon market and the forestry sector, the partial equilibrium frameworks can only provide a focused description of economic reactions to international climate policy. One potential drawback of partial analysis is the neglect of interactions with other (non-carbon and non-forestry markets) and associated spillover effects (see, e.g., Böhringer and Rutherford, Reference Böhringer and Rutherford2002). Moreover, terms-of-trade effects on fossil fuel markets induced by carbon abatement policies may alter the direct costs of abatement. However, these effects may only be addressed in a general equilibrium framework.
By simulating the response of forest land users (i.e., farmers) to changes in prices in forest land and products vs. prices emerging in carbon markets, our modelling approach takes into account the opportunity cost of land use and the corresponding optimisation by the farmers. There are, however, external factors such as bioenergy policies which induce competition with REDD policies and impact on REDD credit supply and demand. We abstract from such competition here, as the respective analysis would go beyond the scope of this paper. However, the topic remains an interesting area for future research.Footnote 14
6. Conclusions
Given the currently proposed Annex I commitments, an unrestricted integration of REDD units into the post-Kyoto international carbon market could substantially lower the international price of carbon in 2020. While this reduction leads to substantial compliance cost savings for developed countries in the short term, concerns prevail that the incentives for increased domestic abatement are decreased in the medium term and development of clean infrastructure and technologies may be delayed.
Our quantitative analysis shows that demand-side and supply-side restrictions on the import of REDD units into compliance markets can support prices, but would fail to encourage further progress toward more ambitious GHG reduction goals by simultaneously restricting economic efficiency. While demand-side restrictions will please the cost conscious in developed countries, maintaining a reasonably high international price of carbon while enabling REDD units to be acquired at a mere third of that price may cause disaffection among supplying nations.
We find that for the assumed emission reduction targets in the year 2020, unrestricted exchange of REDD units reduces the international carbon price by half and cuts compliance costs by roughly one-third. However, as negotiators prepare for the UN climate change conference in Durban 2012, consideration should be given to another option: expanding commitments beyond what Annex I Parties may currently be contemplating. The cost savings to Annex I Parties which would occur with REDD integration could justifiably be reinvested in deeper commitments.
In investigating a scenario which could fully mitigate the concerns over excessive costs through expanded commitments, we describe an option which is calibrated to yield compliance costs similar to that which occurs in the Base Case. While the additional 23 per cent reduction from core commitmentsFootnote 15 for Annex I is ambitious, it takes full advantage of the efficiency gains of intersectoral trading between domestic Annex I, CDM and REDD emissions reductions. The result is GHG mitigation yielding 15.5 per cent lower emissions than 1990 levels in the year 2020, corresponding to a tripling of the Annex I target under the Kyoto Protocol. Although industrialised countries would not yet reach the IPCC range of a 25–40 per cent reduction in emissions by Annex I nations compared to 1990 levels to stabilise atmospheric carbon at 450 ppm CO2e (Gupta and Tirpak, Reference Gupta, Tirpak and Metz2007), our REDD constant-cost option represents a first step towards this goal.
Our analysis aimed to demonstrate that policy restrictions on the integration of REDD into international carbon markets may detract from the very motivation for its integration in the first place, i.e., the recognition of economic efficiencies. Nevertheless, a potential barrier to unrestricted integration could include opposition from CDM supplying nations, who might lose a large portion of their net economic benefit from the CDM compared to the Base Case. Our simulations show that the implementation of REDD shifts wealth transfers among developing countries (from traditional CDM host countries to rainforest regions) due to increased competition on the supply side of the carbon market. Furthermore, for a viable market-based REDD regime, prevailing concerns around the permanence of mitigation and the environmental integrity of REDD units will need to be successfully addressed in the design of a REDD framework.
This study shows that if the above-mentioned issues are addressed, REDD provides a large opportunity for both economic efficiency gains and significant future emission reductions for combating global climate change. Nevertheless, an essential issue for the post-2012 negotiations remains: is the industrialised world willing to cost-effectively increase its commitments by means of substantial financial transfers to developing countries? On the one hand, unrestricted access to REDD coupled with Annex I targets as a large source of emission reductions would provide significant benefits in terms of both increased mitigation and potential poverty alleviation. On the other hand, industrialised countries may be hesitant to agree to increased climate policy responsibility without corresponding concessions from the developing world.
Supplementary materials and methods
The supplementary material refered to in this paper can be found online at journals.cambridge.org/EDE.