Introduction
A dichotomy exists in patent and innovation studies: as firms increasingly optimize in-house research and development (R&D), the proportion of patents held by corporations increases, whereas that held by individual inventors decreases, from a macro-statistical perspective. However, the increase in corporate patents not only indicates the progress of organized invention but also reveals broader aspects of economic growth. Studies analyzing patenting not from a macro perspective, but from a micro, business-historical perspective, to explain economic growth are still insufficient. This study uses bibliographic data on Japanese patents in the electrical industry to unpack the inventors of corporate patents. It reveals that the growth of corporate patents has historically affected not only the linkage between technology transfer and local technological development but also patent management (Nishimura Reference Nishimura2004, Reference Nishimura2016), the formation of a national system of innovation (Freeman Reference Freeman1995; Lundvall Reference Lundvall, Dosi, Freeman, Nelson, Silverberg and Soete1988), and the growth of individual inventions, all of which are fundamental to modern economic growth.
Research aimed at identifying typical patent experiences is still in its early stages, and studies are being conducted in various countries on the development of patent institutions and how inventors have participated in innovation systems. Within this context, studies using patent data to analyze technological development and the growth of modern economies have progressed, particularly over the last two decades. These studies, which initially focused on major industrialized countries and recently expanded to include a broader range of countries, address two primary issues of the late nineteenth and early twentieth centuries.
The first is whether domestic inventive activities or technologies introduced abroad promote technological development. In a study on Japan, where there was strong interest in the international impact on economic growth as early as the 1980s, Otsuka (Reference Otsuka, Minami and Kiyokawa1987) argued that imports of capital goods stimulated domestic technological innovation more than technology introduction through patenting. Nicholas (Reference Nicholas2011a, Reference Nicholas2013) argued that domestic innovation – rather than the introduction of technology – enabled Japan to achieve parity with other industrialized nations. These studies compared the number of patent registrations by splitting them between domestic and foreign nationals or between native and modern industries. They contend that Japan’s modern economic ascent was principally driven by internal innovation rather than the adoption of foreign technology. On the other hand, some studies focusing on countries other than Japan attributed economic growth to global technology transfer. In recent years, some studies have used patent data analysis to shed light on the cross-border spread of innovation in nineteenth-century Germany (Donges and Selgert Reference Donges and Selgert2019), the global patent system in Jamaica under the British Empire (Graham Reference Graham2020), and the influences of foreign companies on Australia’s mining sector (Fleming et al. Reference Fleming, Liu, Merrett and Ville2023). Gibbons and Oxley (Reference Gibbons and Oxley2023) examined foreign patent applications to identify the factors contributing to the growth of patent applications in New Zealand.
The second issue concerns the originators of the innovations: whether inventions by independent inventors or organized ones contributed more to economic growth. Analyses of patent data show that in the United States (Nicholas Reference Nicholas2010), the United Kingdom, and Japan (Nicholas Reference Nicholas2011b), patents held by independent inventors accounted for more than half the number of all patents in the 1930s and were of high quality. Furthermore, in Spain (Sáiz Reference Sáiz2012), Norway (Basberg Reference Basberg2015), and Italy (Nuvolari and Vasta Reference Nuvolari and Vasta2015), many patents were registered by independent inventors or individuals with industry connections, which played an important role in the industrialization of these countries. An invention created by an individual inventor for industrial purposes must be traded unless the inventor implements it themselves, from the perspective of the technology market, where inventions are exchanged between inventors and those who apply them. Therefore, there also exists an ongoing debate on the historical formation and role of agents and patent attorneys in this market (Andersson and Tell Reference Andersson and Tell2016; Lamoreaux and Sokoloff Reference Lamoreaux, Sokoloff, Lamoreaux, Raff and Temin1999, Reference Lamoreaux, Sokoloff, Engerman, Hoffman, Rosenthal and Sokoloff2003; Nicholas and Shimizu Reference Nicholas and Shimizu2013). However, this research trend focuses on individual inventors and market transactions, leaving the broader effects of corporate patents largely unexplored.
Combining those two streams of research could lead to the conclusion that the efforts of individuals, or nonorganized, domestic inventors, promoted Japan’s economic growth. However, the historiographic literature overlooks the significant role of entrepreneurs, corporations, foreign firms, and their Japanese subsidiaries in promoting Japan’s industrialization. Because the roles of individuals and organizations in technology acquisition and commercialization are asymmetric, even if individuals hold more registered patents than corporations, the effects of the two on economic growth cannot be simply compared. Macro-level statistical analysis of patents may account for a significant share of economic growth. However, micro-level patent analysis from a business-history perspective can offer insights that macro-level analysis cannot. In cases outside of Japan, some studies have combined these two issues. Sáiz (Reference Sáiz2012), who studied the Spanish case, analyzed registered patents from the perspectives of both domestic and foreign nationals and individual inventors and corporations and found that personal networks of engineers and commercialization have a greater influence on technology transfer. Regarding the role of multinational corporations (MNCs) in international technology transfer, Sáiz (Reference Sáiz2012) and Sáiz and Pretel (Reference Sáiz, Pretel, Donzè and Nishimura2014) reveal that firms from some countries have played an important role in introducing technology to Spain. From the MNCs’ perspective, Cantwell (Reference Cantwell1995) found that in the electrical and chemical industries, MNCs in advanced industrial countries not only transfer technology to the host country but also engage in local R&D and use it as a resource for their own competitive advantage. This finding indicates that technology transfers by corporations play a significant role in the technological development of the host country. However, no prior studies have examined the Japanese case, in which these two issues intersect.
This study analyzes corporate patents to clarify the implications of their growth for technology transfer, technological development, the organization of patent management, the formation of a national system of innovation, and the growth of individual inventors. That is, this article clarifies, from a microscopic perspective, how increased corporate patents contributed to innovation and economic growth.
The rationale for focusing on Japan is that, although the institution of patent law was relatively late compared to the West, it became socially established early on (Imaizumi, Reference Imaizumi2022), and Japan is one of the countries that has achieved economic growth through technology transfer from abroad. Not only during the turn of the century but also during the period of rapid economic growth following World War II, Japanese companies successfully introduced advanced technologies from abroad while also developing their own proprietary technologies, emerging as global leaders in several industries by the end of the twentieth century. A microanalysis of corporate patents in Japan illustrates a typical model of economic growth driven by the patent system. Among the industries that supported economic growth, the electrical industry played a significant role. One characteristic of the industry was that while continuous technological development took place primarily in Europe and the United States from the late nineteenth century onward, active international technology transfer occurred simultaneously, and Japan was integrated into this global technology-flow network (Jones Reference Jones2005). Throughout modern economic growth, the electrical companies played a crucial role by introducing advanced technology abroad and pursuing organized R&D to leverage it (Kohama Reference Kohama2007; Morris-Suzuki Reference Morris-Suzuki1994; Uchida Reference Uchida, Okochi and Uchida1980). Well-developed electrical machinery dramatically increased factory productivity by providing electric lighting and electrifying power sources and was of critical importance to economic growth. Since the systems and equipment involved in power generation and transmission required complex, advanced technology, and given the rapid, global nature of advancements in electrical engineering, the ability of entrepreneurs and companies to secure patents as quickly as possible became a key factor in determining their competitive advantage. Japan’s electrical industry can therefore be considered a representative case for analyzing the role of corporate patents in economic growth.
The following section examines Japanese patent data and defines corporate patents. We then clarify the growth in corporate patents across Japan. Subsequently, we analyze the factors driving the increase in corporate patents within the electrical machinery industry by analyzing individual inventors, followed by several case studies. Finally, we discuss the economic significance of corporate patents.
Methodology
The dataset used in this study comprises bibliographic data (patent number, registration date, classification, and patentees’ and inventors’ addresses and names). This study analyzes 127,897 patents issued from 1899 to 1941 in Japan.Footnote 1
While the bibliographic patent data contains rich information, its implications must be clarified before it can be used in research. This study examines the changes in patentees, inventors, and their combination. Analysis of the patentee reveals who links the patent to its economic value. Because obtaining and maintaining a patent is costly, most patentees expect to gain profits from using a patent that exceeds the costs. Therefore, we can assume that the patentee pursues economic benefits. Because the patent system in each country leads to technological development through the economic activities of patentees, clarifying the level of performance associated with different entities can further our understanding of economic growth. A patent’s performance includes aspects that are defined by its attributes. First, patentees can be categorized as residents (domestic) or non-residents (foreign).Footnote 2 The behavior and economic utility of domestic economic actors within the country and those with their home base in a foreign country are likely to differ. Second, the behavior differs depending on whether the patentee is an individual, corporation, government, or a public entity.Footnote 3 This study focuses on corporate patents held by residents and non-residents in these categories.
Analysis of inventors reveals the originators of the inventions that are socially realized through patentees, clarifying their distribution across technologies, geographic regions, or the social groups that generate them. When examining the influences of global technology networks on economic growth, it is crucial to determine whether inventions were generated domestically or transferred to Japan from abroad. Furthermore, understanding the relationship between domestic inventions and the introduction of foreign inventions is vital for assessing technological development.
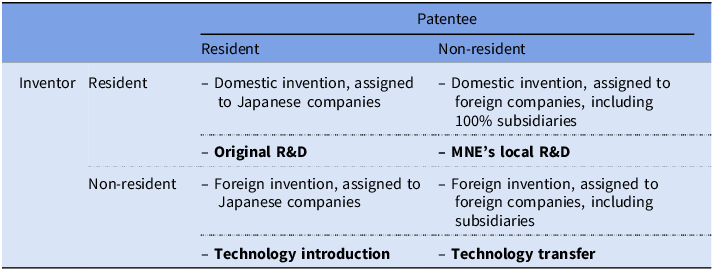
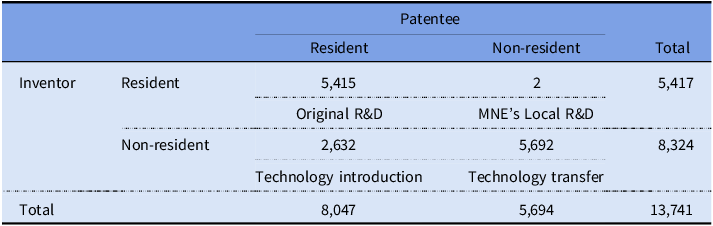
This study classifies corporate patents into four categories based on the geographic attributes of the patentee and inventor (Table 1). Resident corporations’ patents are further divided into two groups, depending on whether the invention was made domestically or abroad. Patents for inventions made domestically and transferred to resident corporations can be considered the result of original Japanese R&D. Patents for inventions in foreign countries acquired by resident corporations indicate technology introduction. Patents in which inventions were made domestically and transferred to non-resident corporations represent the multinational enterprise’s (MNE) local R&D. Patents in which inventions were made abroad and transferred to non-resident corporations signify technology transfers by foreign companies. By examining the trends in these four categories of corporate patents, we clarify technology transfer, technological development, and the organization of patent management.
Four types of corporate patents, by addresses

Table 1 Long description
A table categorizing corporate patents by inventor and patentee residency. The table has 2 rows and 2 columns. The row labels are Inventor and Patentee, with subcategories Resident and Non-resident. The columns are labeled Resident and Non-resident. Row 1: Inventor Resident, Patentee Resident - Domestic invention, assigned to Japanese companies. Row 1: Inventor Resident, Patentee Non-resident - Domestic invention, assigned to foreign companies, including 100 percent subsidiaries. Row 2: Inventor Non-resident, Patentee Resident - Foreign invention, assigned to Japanese companies. Row 2: Inventor Non-resident, Patentee Non-resident - Foreign invention, assigned to foreign companies, including subsidiaries. The table also includes grouped rows for Original R&D, MNE’s local R&D, Technology introduction, and Technology transfer.
Source: Author.
However, identifying inventors and their attributes from bibliographic information using patent gazettes alone is challenging. Generally, when an inventor obtains a patent, that inventor becomes the patentee. However, in early Japan, the status of inventors was not standardized. As of 1908, there were no provisions for employee inventions, and employees could obtain patents. Patent specifications issued between 1899 and 1909 occasionally explicitly named the inventor, but many specifications listed only the names of the patentees.Footnote 4 The 1909 law stipulated that, unless otherwise specified by contract, the rights to employee inventions belonged to the employer. From the Patented Inventions Specifications issued that same year, the names of inventors and patentees began to be recorded separately. However, even in the early 1910s, it was not easy to distinguish between independent and employee inventors, as observed in cases such as Shibaura Engineering Works, where engineers within the company sometimes obtained patents themselves (Kimura Reference Kimura1940: 182). After 1920, however, the right to obtain patents was held primarily by the inventor, who usually assigned employee inventions to the company (Tokkyo-cho 1984: 422). Nevertheless, it remained difficult to clearly distinguish who the inventor was – whether an independent inventor or an employee inventor working within an organization, such as a company. This study treats inventors listed on corporate patents as employees engaged in organizational inventions, even if they may have been independent inventors.
This study analyzes technology transfer and technological development using the number of registered patents. However, the validity of using these data to evaluate innovation has been criticized (Degner and Streb Reference Degner, Streb, Donzé and Nishimura2014; Fleming et al. Reference Fleming, Liu, Merrett and Ville2023; Nicholas Reference Nicholas2011a; Pavitt Reference Pavitt1985). To make patent counts better represent innovation, methods have been proposed to evaluate the value of a patent based on citation numbers (Nicholas Reference Nicholas2011a) and duration (Degner and Streb Reference Degner, Streb, Donzé and Nishimura2014). However, Japan had not adopted a citation system at the time, rendering value measurement via citation counts impossible. Nicholas (Reference Nicholas2011a) measures value using Japanese inventions filed in the US; however, patents filed abroad are limited, imposing constraints on representing the whole. Furthermore, measuring by patent duration is currently impractical because of the lack of comprehensive historical data. On the other hand, this study limits its scope to Japan’s electrical machinery industry, thereby avoiding jurisdiction- and industry-specific biases. Bias stemming from differences in corporate behavior can be mitigated to some extent by clarifying firms’ competitive positions and patent management practices. While even such procedures cannot fully ensure that the number of registrations perfectly represents innovation, they can sufficiently clarify the key points of where and how corporations acquire inventions.
Growth of corporate patents
Resident and non-resident patents
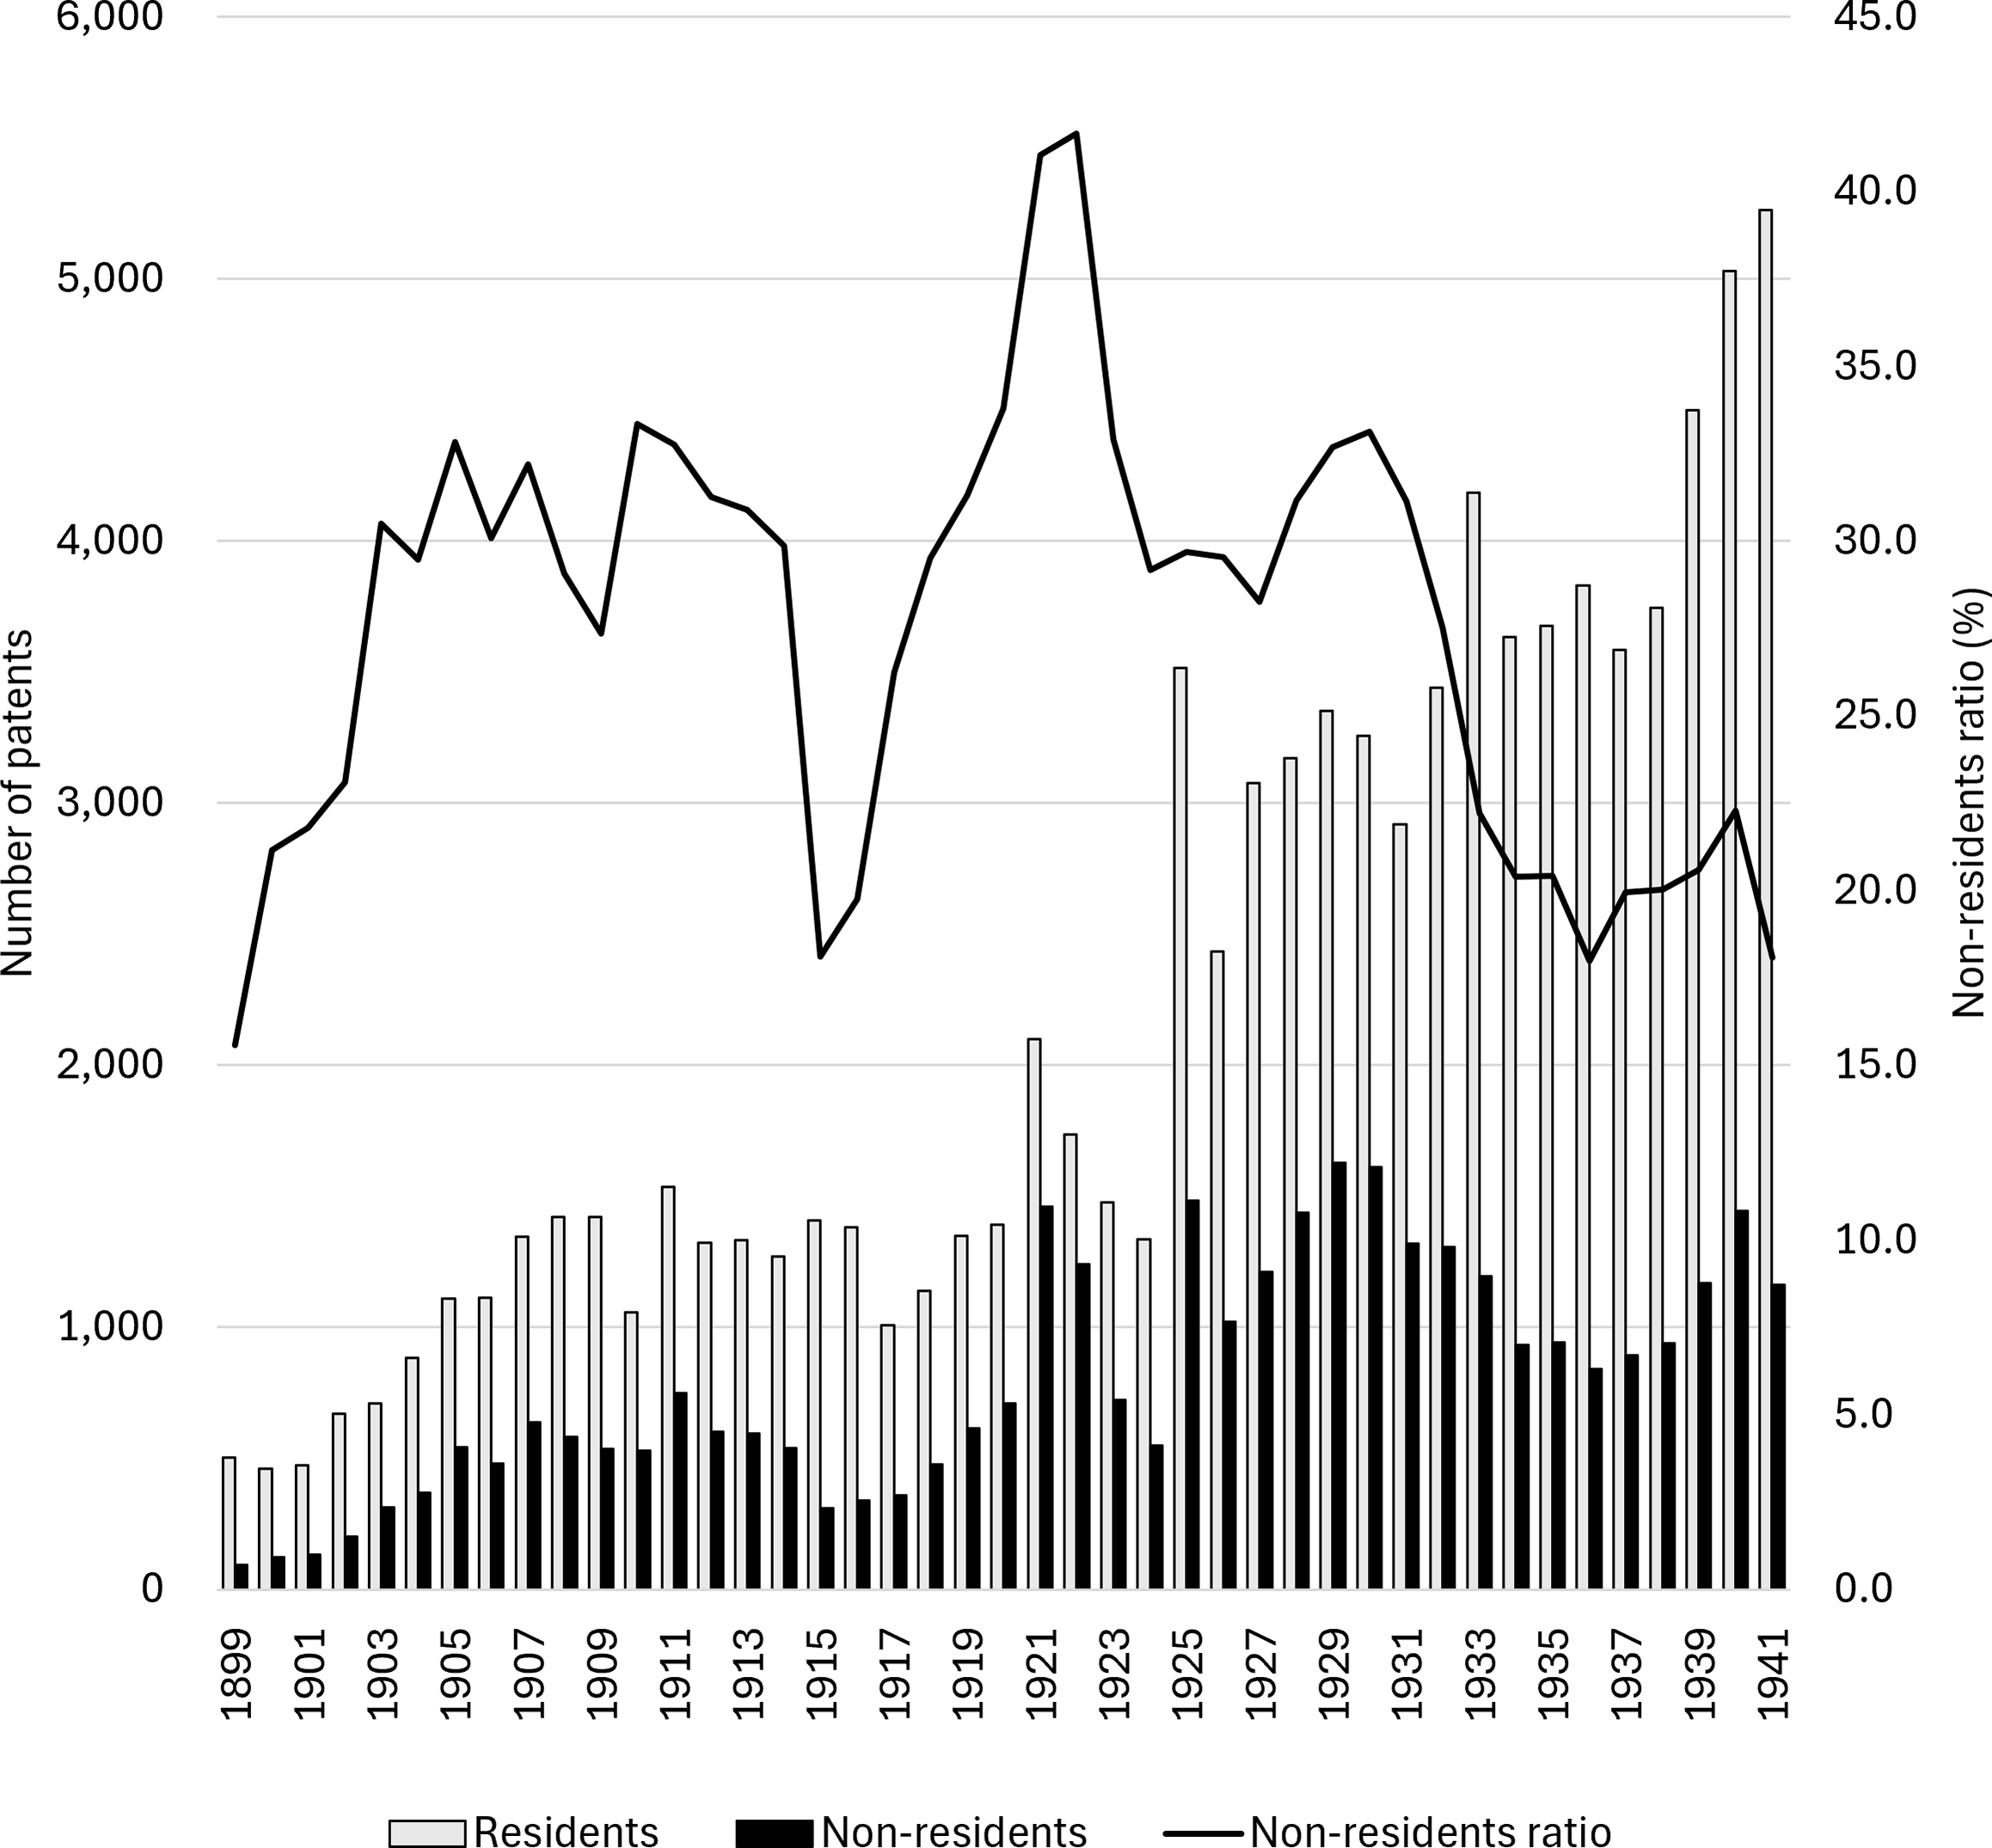
Japan’s patent system began with the Monopoly Patent Ordinance of 1885; however, only Japanese nationals were eligible to register inventions at the time. Foreigners could not obtain patents until 1899, when Japan joined the Paris Convention for the Protection of Industrial Property and revised its patent laws (Tokkyo-cho 1984: 150–51, 202–5). Once Japan’s patent system was opened to the world, many patent applications from foreign countries were filed. Figure 1 shows the number of patents registered by Japanese residents and non-residents from 1899 to 1941 and the percentage of non-resident patents. The following can be observed from the data: First, residents registered more patents than non-residents. Second, although resident patents had increased since 1899, they increased rapidly from the mid-1920s; the average annual number of registrations was 1,190 up to 1924 and 3,683 from 1925 onward. Third, non-resident patents exhibited the same trend as resident ones until the 1920s. However, the number of such patents decreased in the 1930s owing to the Great Depression. Fourth, although there was a significant change owing to World War I, the percentage of non-resident patents among Japanese patent registrations was 29.0 percent on average until 1924, 30.7 percent from 1925 to 1930, and 21.9 percent from 1931 onward. Throughout the entire period, the proportion of non-resident patents was 26.8 percent. According to Nicholas (Reference Nicholas2011a), the percentage of non-resident patents for Canada, Hungary, Russia, Switzerland, Belgium, and Austria was high, ranging from 67 percent to 84 percent. In contrast, the ratio for Japan was low among the countries that actively engaged in technology introduction. The data on these patentees suggest that domestic inventions contributed more to Japan’s industrialization than technologies invented abroad.
Trends of resident and non-resident patents.
Sources: For the period from January 1899 to October 1909, two volumes of the Patented Inventions Classification General Catalog (Tokkyo-kyoku 1909, 1914a) were used as the primary source, with patentees corrected using the list of registered patents published in the Patent Gazette issued during the same period. For the period from November 1909 to December 31, 1941, data are collected from the list of registered patents published in the Patent Gazette and the table of contents of the Patented Inventions Specifications.
Note: The non-resident ratio is the percentage of patents registered each year in which the patentee is a non-resident.

Figure 1. Long description
Panel A: A bar graph comparing the number of patents by residents and non-residents from 1899 to 1941. The horizontal axis represents the years, while the vertical axis represents the number of patents. The graph includes two sets of bars for each year: one for residents (in light gray) and one for non-residents (in dark gray). The number of patents by residents generally increases over time, with notable increase from the mid-1920s. The number of patents by non-residents also shows an increasing trend but with more fluctuations. Panel B: A line graph showing the non-residents ratio percentage from 1899 to 1941. The horizontal axis represents the years, while the vertical axis represents the non-residents ratio percentage. The line graph shows the percentage of patents by non-residents relative to the total number of patents. The non-residents ratio fluctuates over the years, with notable peaks around 1921.
Three types of patentees
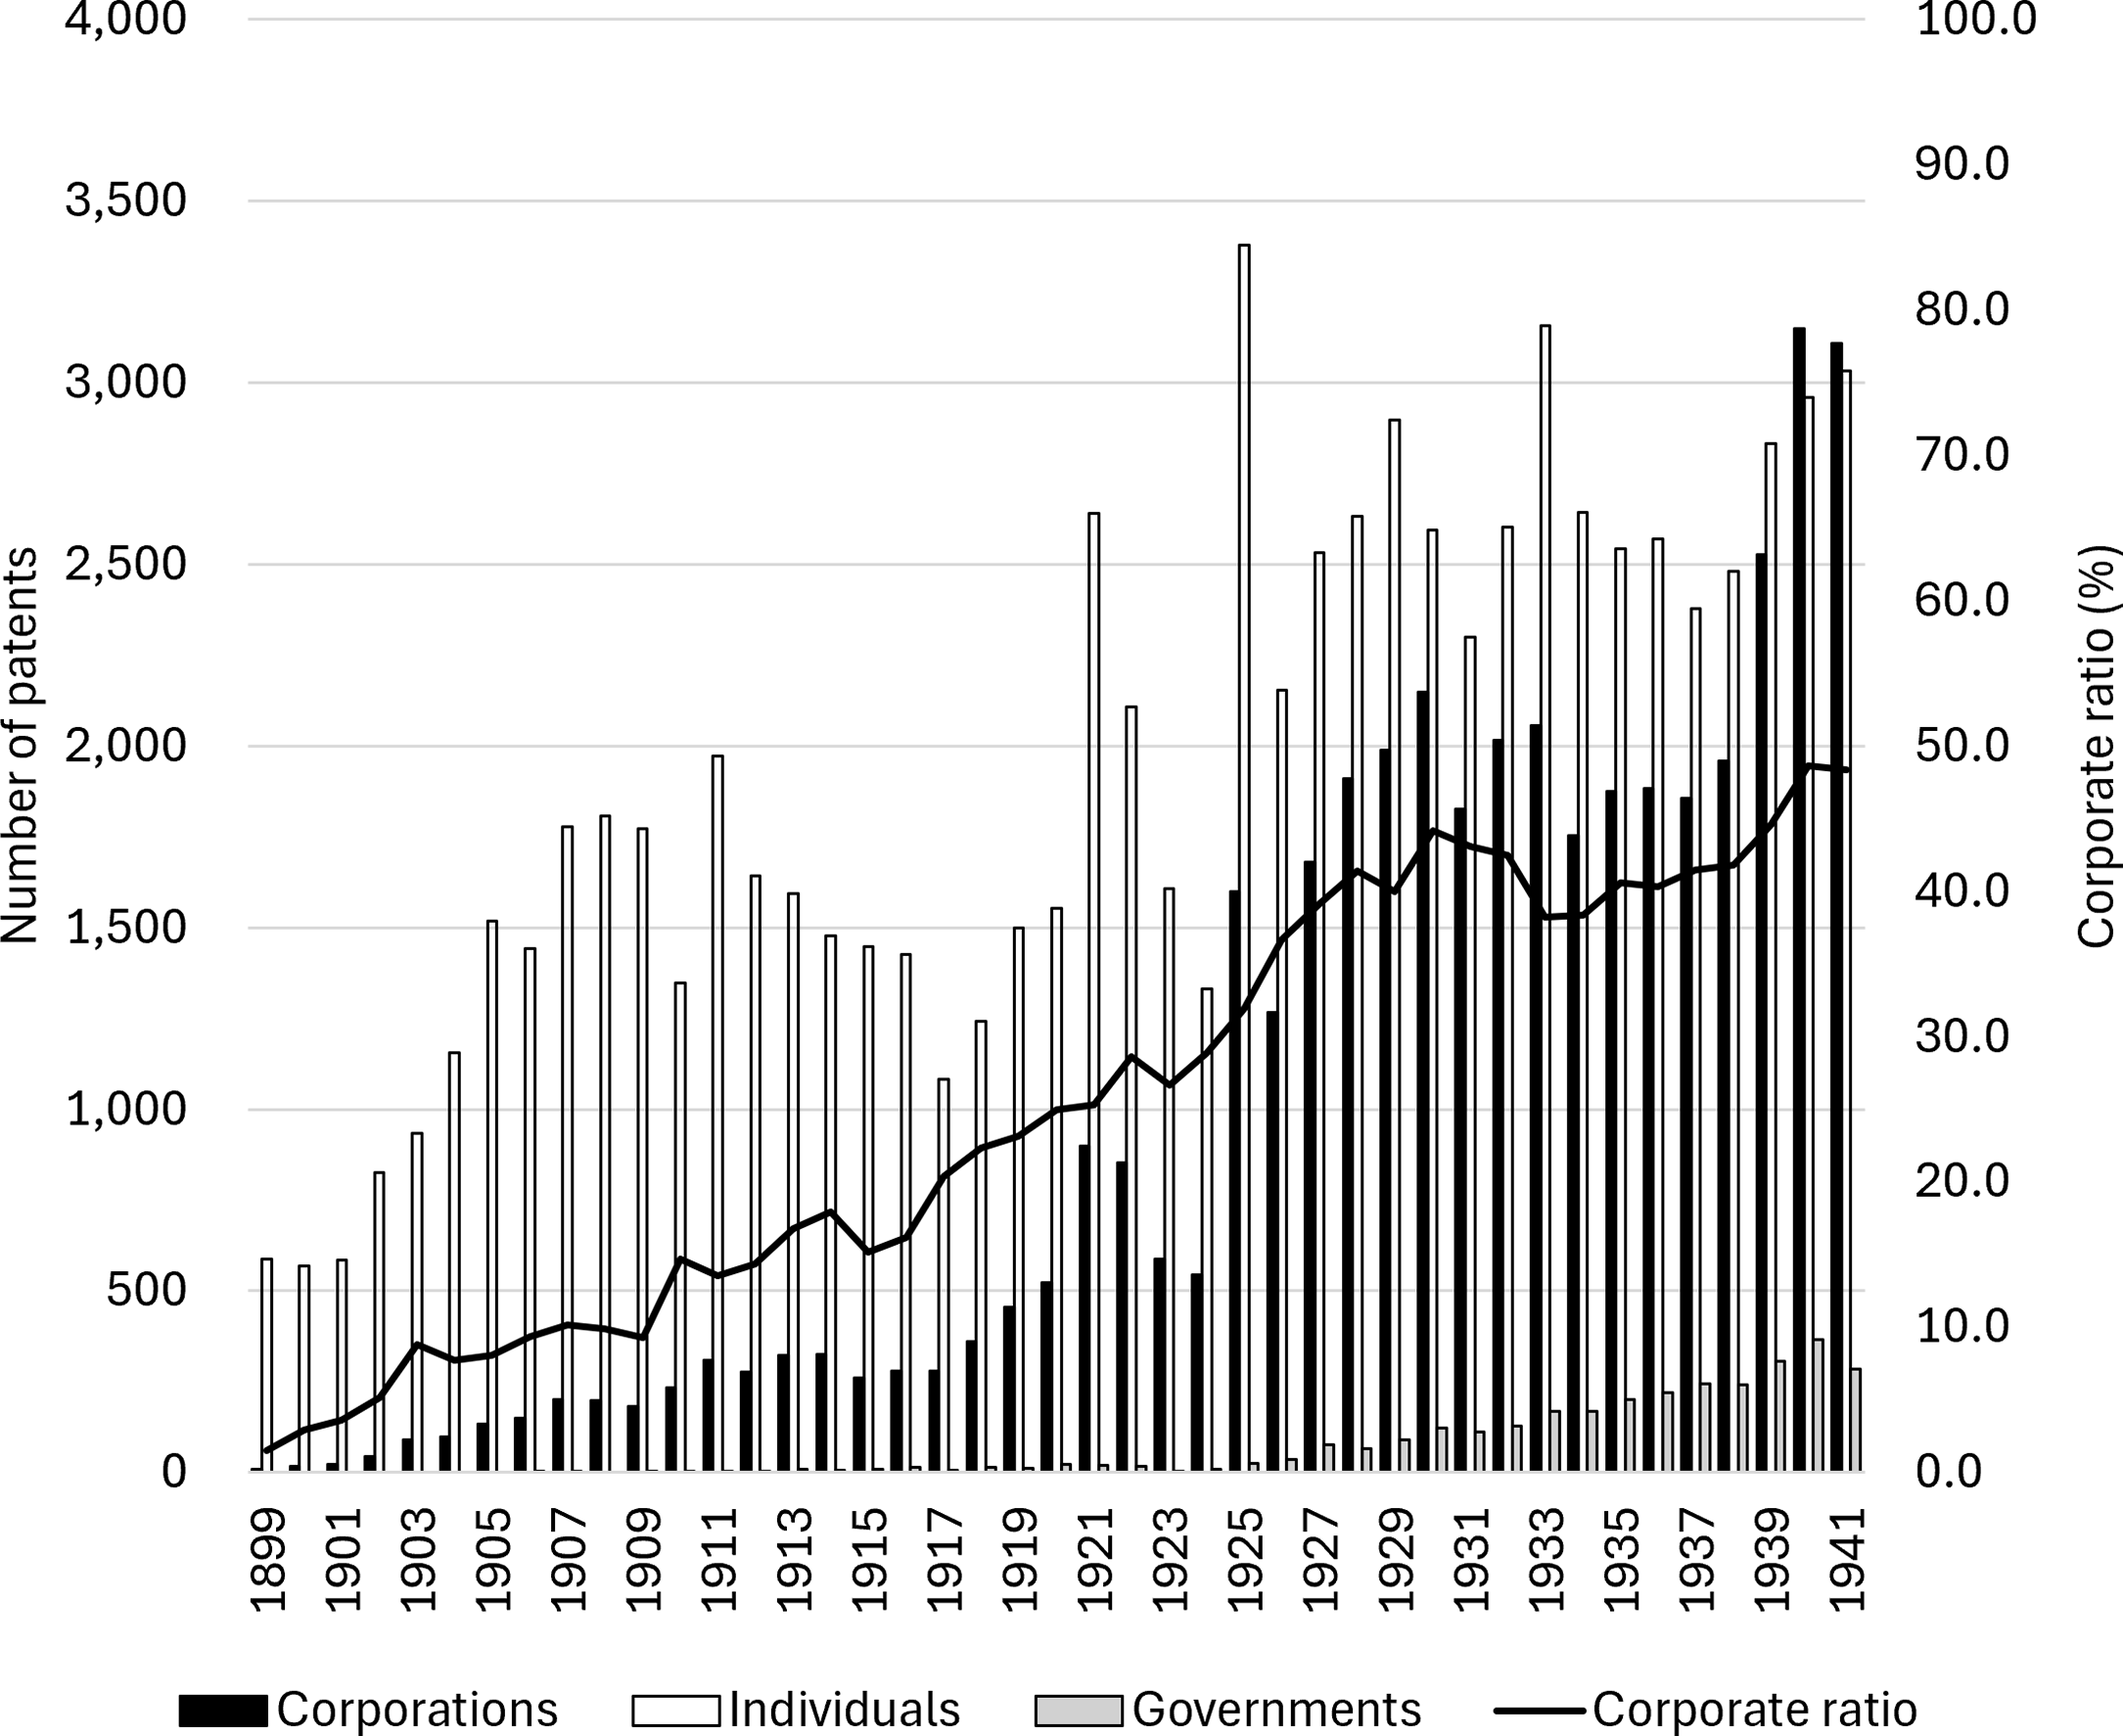
Patents can also be divided into individual, corporate, and government-owned, based on the type of patentee. Between 1899 and 1941 (including residents and non-residents), 82,625 individual patents (64.6 percent), 42,247 corporate patents (33.0 percent), and 3,025 government-owned patents (2.4 percent) were registered in Japan. Figure 2 illustrates the number of registered patents of the three types of patentees and the proportion of corporate patents.
Trend of patent registration by type of patentees.
Sources: For the period from January 1899 to October 1909, two volumes of the Patented Inventions Classification General Catalog (Tokkyo-kyoku 1909, 1914a) were used as the primary source, with patentees corrected using the list of registered patents published in the Patent Gazette issued during the same period. For the period from November 1909 to December 31, 1941, data are collected from the list of registered patents published in the Patent Gazette and the table of contents of the Patented Inventions Specifications.
Note: The non-resident ratio is the percentage of patents registered each year in which the patentee is a non-resident.

Figure 2. Long description
Panel A: A bar graph comparing the number of patents by corporations, individuals, and governments from 1899 to 1941. The horizontal axis represents the years, while the vertical axis represents the number of patents. The graph includes three sets of bars for each year: one for corporations (in black), one for individuals (in light gray), and one for governments (in dark gray). The number of patents by corporations increases notably from the mid-1920s. The number of patents by individuals also shows an increasing trend. Panel B: A line graph showing the corporate patent ratio percentage from 1899 to 1941. The horizontal axis represents the years, while the vertical axis represents the corporate patent ratio percentage. The line graph shows the percentage of patents by corporations relative to the total number of patents. The corporate patent ratio grew over the years, with notable peaks around 1940.
Corporate patent growth can be categorized into four periods based on changes in the patent system and external events, with distinct characteristics in each period. The first period was from 1899 to 1920, before the revision of the Patent Law. The number of corporate patents increased from nine in 1899 to 524 in 1920, and the percentage of total patents increased from 1.5 percent to 25.0 percent. The second period was from 1921 to 1930, when revisions were made to the patent law, affecting corporate patents. The new Patent Law of 1921 introduced the first-to-file system, and significant changes were made to account for employee inventions. Under the previous Patent Law of 1909, the right to receive a patent was assigned to the employer. In contrast, the new law stipulated that the right to receive a patent belonged to the employee inventor (Tokkyo-cho 1984: 421–22). In response to this change, companies began creating new internal regulations and establishing organizations to manage their patents. After 1921, the number of corporate patents rapidly increased. The decline in 1923 and 1924 reflects the Great Kanto Earthquake, which damaged the Patent Office, causing registrations to be suspended, and the recovery period experienced considerable confusion. Although there was a decline, corporate patents expanded by approximately 2.4 times from 900 in 1921 to 2,149 in 1930. During the same period, the proportion of corporate patents increased from 25.3 percent to 44.1 percent. The third period was from 1931 to 1938, when the effects of the Great Depression began to manifest. During this period, the number of corporate patents stopped growing, and the average number of registrations per year was 1,903, with the ratio of corporate patents falling slightly to 40.8 percent. The fourth period was from 1939, when the effects of the Sino-Japanese War began, to 1941, when the Pacific War began. During this period, there was a resurgence in the number of corporate patents, and in 1940 and 1941, the number of corporate patents exceeded that of individual patents. In 1940, the number of corporate patents was 3,148, comprising 48.6 percent of the total, which was the highest ratio recorded.
Distribution by industry and address
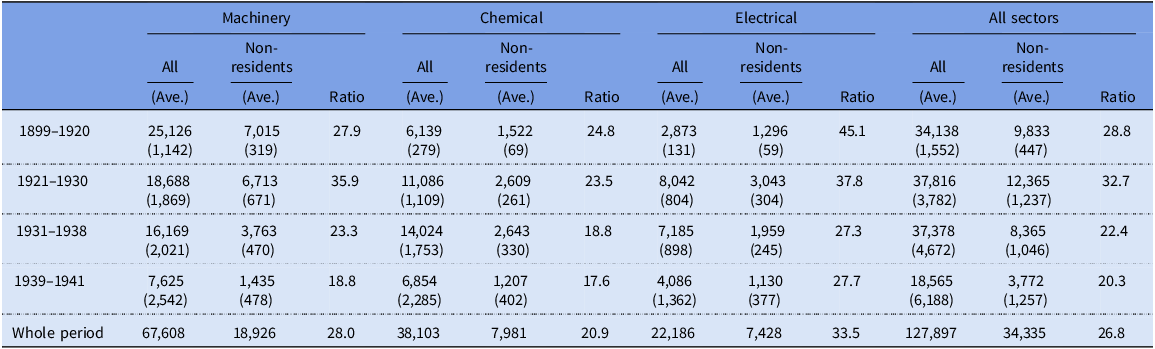
We now examine the characteristics of patentees by industry. The Japanese classification system, which came into effect in 1921, divides patents into 207 categories. Of these classes, 1–143 cover inventions related to the mechanical industry; 144–186 related to the chemical industry; and 187–207 associated with the electrical industry. Table 2 presents the number of patents and ratio of non-resident patents by industry, according to the period classification used earlier. In terms of the total number of patents, the machinery industry had the highest number at 67,608 (52.9 percent), followed by patents related to the chemical industry at 38,103 (29.8 percent) and those related to the electrical industry at 22,186 (17.3 percent). The machinery industry comprised a high number of patents because of its broad scope, encompassing inventions related to leading industries of the time, such as textiles and looms, as well as diverse consumer products. The ratio of non-resident patents was the highest in the electrical industry (33.5 percent), followed by the machinery (28.0 percent) and chemical (20.9 percent) industries. Because the number of years differs for each term, the number of patents on a one-year average is presented in parentheses. The ratio of non-resident patents was high in the machinery industry in the 1920s and increased slightly in the electrical industry after 1939; however, the ratio of foreign patents declined overall.
Non-resident patents ratio by sectors (number of patents, %)

Table 2 Long description
The table presents data on the number of patents and the ratio of non-resident patents by industry over different periods. It is divided into three main sectors: Machinery, Chemical, and Electrical. Each sector is further divided into columns for all patentees and non-residents, with average values and ratios provided. The periods covered are 1899-1920, 1921-1930, 1931-1938, 1939-1941, and the whole period. Row 1: 1899-1920, Machinery All (Ave.) 25,126 (1,142), Non-residents (Ave.) 7,015 (319), Ratio 27.9, Chemical All (Ave.) 6,139 (279), Non-residents (Ave.) 1,522 (69), Ratio 24.8, Electrical All (Ave.) 2,873 (131), Non-residents (Ave.) 1,296 (59), Ratio 45.1, All sectors All (Ave.) 34,138 (1,552), Non-residents (Ave.) 9,833 (447), Ratio 28.8. Row 2: 1921-1930, Machinery All (Ave.) 18,688 (1,869), Non-residents (Ave.) 6,713 (671), Ratio 35.9, Chemical All (Ave.) 11,086 (1,109), Non-residents (Ave.) 2,609 (261), Ratio 23.5, Electrical All (Ave.) 8,042 (804), Non-residents (Ave.) 3,043 (304), Ratio 37.8, All sectors All (Ave.) 37,816 (3,782), Non-residents (Ave.) 12,365 (1,237), Ratio 32.7. Row 3: 1931-1938, Machinery All (Ave.) 16,169 (2,021), Non-residents (Ave.) 3,763 (470), Ratio 23.3, Chemical All (Ave.) 14,024 (1,753), Non-residents (Ave.) 2,643 (330), Ratio 18.8, Electrical All (Ave.) 7,185 (898), Non-residents (Ave.) 1,959 (245), Ratio 27.3, All sectors All (Ave.) 37,378 (4,672), Non-residents (Ave.) 8,365 (1,046), Ratio 22.4. Row 4: 1939-1941, Machinery All (Ave.) 7,625 (2,542), Non-residents (Ave.) 1,435 (478), Ratio 18.8, Chemical All (Ave.) 6,854 (2,285), Non-residents (Ave.) 1,207 (402), Ratio 17.6, Electrical All (Ave.) 4,086 (1,362), Non-residents (Ave.) 1,130 (377), Ratio 27.7, All sectors All (Ave.) 18,565 (6,188), Non-residents (Ave.) 3,772 (1,257), Ratio 20.3. Row 5: Whole period, Machinery All (Ave.) 67,608 (18,926), Non-residents (Ave.) 18,926, Ratio 28.0, Chemical All (Ave.) 38,103 (7,981), Non-residents (Ave.) 7,981, Ratio 20.9, Electrical All (Ave.) 22,186 (7,428), Non-residents (Ave.) 7,428, Ratio 33.5, All sectors All (Ave.) 127,897 (34,335), Non-residents (Ave.) 34,335, Ratio 26.8.
Source: For the period from January 1899 to October 1909, two volumes of the Patented Inventions Classification General Catalog (Tokkyo-kyoku 1909, 1914a) were used as the primary source, with patentees corrected using the list of registered patents published in the Patent Gazette issued during the same period. For the period from November 1909 to December 31, 1941, data are collected from the list of registered patents published in the Patent Gazette and the table of contents of the Patented Inventions Specifications.
Note: The patent classification system has changed several times. The patent class under the 136-classes system, used from 1885 to 1921, converted to the 207-classes system by using Tokkyo-kyoku (1924). The method for distinguishing between residents and non-residents is the same as in Figure 1. Machinery covers patent classes 1–143, Chemical covers classes 144–186, and Electrical covers classes 187–207. The average represents the annual average number of patents.
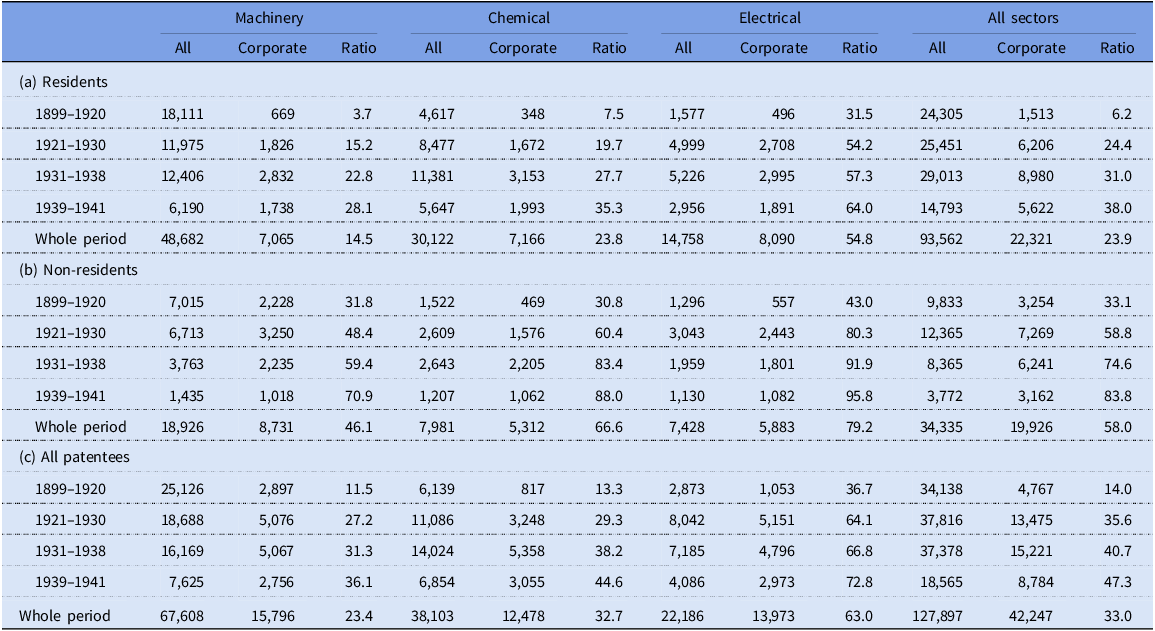
Table 3 presents the growth in corporate patents by industry and resident/non-resident status. First, the ratio of corporate patents held by residents was 23.9 percent of all patents in all industries, compared to a higher proportion of 58.0 percent held by non-residents. Additionally, the ratio of corporate patents varies significantly by industry, with the highest ratio being 63.0 percent in the electrical industry, followed by 32.7 percent and 23.4 percent in the chemical and machinery industries, respectively. When categorized into resident and non-resident patents, all industries showed a higher proportion of corporate patents among non-resident patents than resident patents. In the electrical industry, this ratio was as high as 79.2 percent. Furthermore, for both resident and non-resident patents, the proportion of corporate patents gradually increased in all industries. In the electrical industry, the proportion of non-resident patents increased from 43.0 percent before 1920 to 95.8 percent after 1939, most of which were corporate patents. In the same industry, the ratio of corporate patents among resident patents was also high, increasing from 31.5 percent before 1920 to 64.0 percent after 1939, and over the entire period, it was at 54.8 percent, accounting for more than half the number of patents.
Growth of corporate patenting by sectors (number of patents, %)

Table 3 Long description
The table presents data on the growth of corporate patenting by sectors, categorized by residents and non-residents. It includes three main sections: Machinery, Chemical, and Electrical, with columns for total patents, corporate patents, and the ratio of corporate patents. Each section is further divided into time periods: 1899-1920, 1921-1930, 1931-1938, and 1939-1941, along with a summary for the whole period. The table also includes a summary row for all sectors combined. Panel A: Residents. Panel B: Non-residents. Panel C: All patentees. Each panel shows the number of patents and the ratio of corporate patents for each sector and time period. Notable trends include an increase in the ratio of corporate patents over time across all sectors and resident statuses.
Source: For the period from January 1899 to October 1909, two volumes of the Patented Inventions Classification General Catalog (Tokkyo-kyoku 1909, 1914a) were used as the primary source, with patentees corrected using the list of registered patents published in the Patent Gazette issued during the same period. For the period from November 1909 to December 31, 1941, data are collected from the list of registered patents published in the Patent Gazette and the table of contents of the Patented Inventions Specifications.
Note: Regarding the definition of machinery, chemical, and electrical industry, see the footnote of Table 2. The method for distinguishing between residents and non-residents and for identifying corporate patents is described in the footnotes of Figures 1 and 2, respectively.
Inventors of corporate electrical patents
In the electrical industry, the proportion of corporate patents was higher than in other industries, both for resident and non-resident patents, and this proportion had been increasing annually. By focusing on corporate patents in the electrical industry and analyzing their inventors, we examine the role that corporate patents play in expanding technology transfer and technological development.
Table 4 classifies the corporate patents in the electrical industry from Table 3 into the four types of technology acquisition listed in Table 1, based on the geographic attributes of the patentee and inventor. Over the entire period, the number of resident patents was 8,090, whereas 5,883 patents were non-resident. After November 1909, when inventors began being explicitly named in patent specifications, the figures were 8,047 and 5,694, respectively; these are the patents that we analyze. Categorizing them by inventor address reveals 5,415 patents indicating original R&D (where both patentee and inventor were resident) and 2,632 patents indicating technology introduction (where the patentee was resident and the inventor was non-resident). Thus, even among the patents held by Japanese corporations, 32.7 percent represented inventions originating abroad. Only two patents indicate MNEs’ local R&D, where the patentees are foreign corporations and the inventors are Japanese. Patents indicating technology transfer, where both the patentee and inventor are foreign, totaled 5,692. Thus, categorizing corporate patents into these four types reveals two key points: first, technological advancement in the electrical machinery industry was driven by systematic in-house R&D and technology introduction by resident corporations. Second, non-resident firms also conducted large-scale technology transfers.
Distribution of electrical corporate patents by four types, by addresses (number of patents)

Table 4 Long description
A table categorizing corporate patents in the electrical industry by technology acquisition types and geographic attributes. The table has four rows and four columns. Column headers are Resident, Non-resident, and Total under the Patentee category. Row labels are Resident and Non-resident under the Inventor category. The table is further divided into Original R&D, MNE’s Local R&D, Technology introduction, and Technology transfer. Row 1: Resident, Resident, 5,415; Resident, Non-resident, 2; Resident, Total, 5,417. Row 2: Non-resident, Resident, 2,632; Non-resident, Non-resident, 5,692; Non-resident, Total, 8,324. Row 3: Total, Resident, 8,047; Total, Non-resident, 5,694; Total, Total, 13,741.
Source: For the period from January 1899 to October 1909, two volumes of the Patented Inventions Classification General Catalog (Tokkyo-kyoku 1909, 1914a) were used as the primary source, with patentees corrected using the list of registered patents published in the Patent Gazette issued during the same period. For the period from November 1909 to December 31, 1941, data are collected from the list of registered patents published in the Patent Gazette and the table of contents of the Patented Inventions Specifications. The individual specifications were obtained from the National Center for Industrial Property Information and Training’s J-PlatPat.
Note: For the distinction between resident and non-resident and the identification of corporate patent, refer to notes for Figures 1 and 2. Since the list of registered patents published in the Patent Gazette and the table of contents of the Patent Specifications do not include inventor information, inventor details are obtained by retrieving the front page of the patent specification from J-PlatPat using the patent number. The names of inventors appear from patent specifications issued after November 1909. Patents whose inventors are unknown are excluded.
However, these four classifications of corporate patents alone are insufficient to explain technology introduction and technology development. In other words, the relationships among the four patent categories cannot be fully understood based solely on the distinctions in Table 4. To clarify how the number of patents classified into each category was generated and their historical significance, it is necessary to focus on individual companies. This is because the attitude toward technology introduction and development – and the resulting characteristics of the patents – are strategic and company-specific.
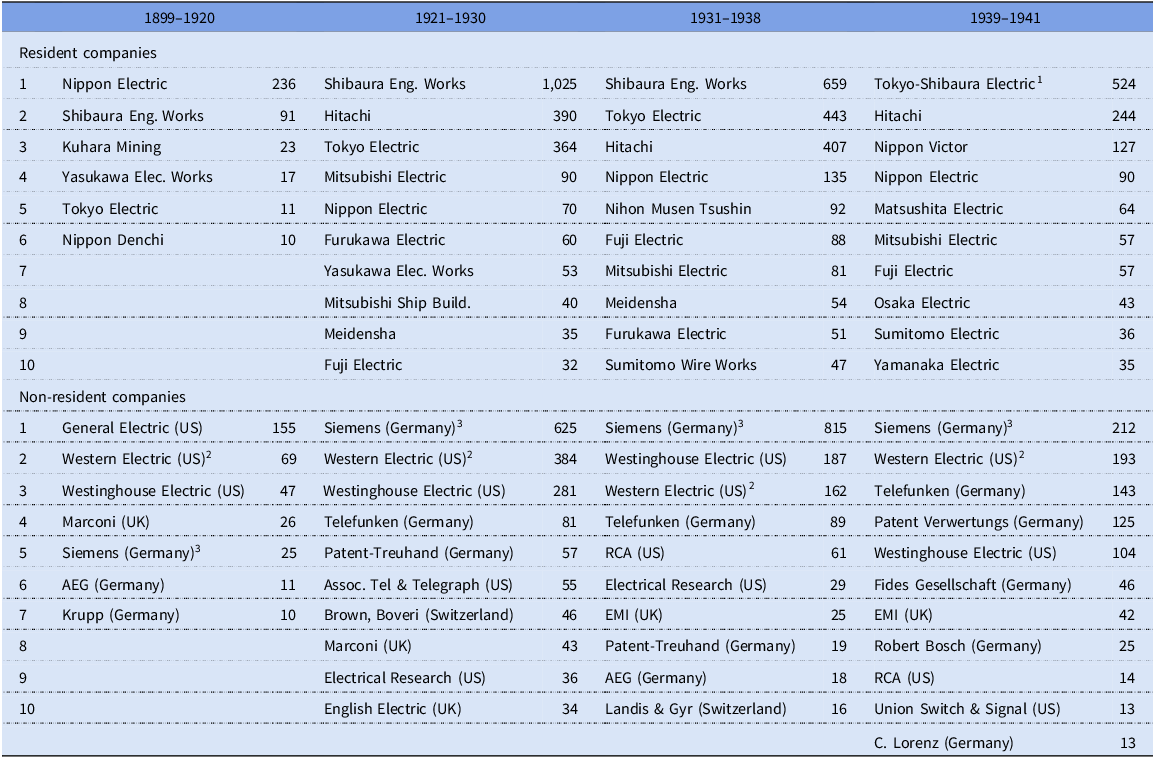
First, we examine the trends in patent data to understand how major companies have introduced and developed technologies. Table 5 lists the top ten companies that obtained ten or more patents for domestic and foreign corporations in each period. Among domestic corporations, major companies such as Nippon Electric Company (NEC), Tokyo Electric, Shibaura Engineering Works, Tokyo Shibaura Electric (established in 1939 through the merger of Tokyo Electric and Shibaura Engineering Works), Mitsubishi Electric, Fuji Electric, and Hitachi Ltd. obtained many patents throughout the entire period. Japanese corporate patents include those based on domestic and foreign inventions (see Table 4). The details are explained in the following paragraphs. Among the patents held by Japanese corporations, some were also held by Japanese subsidiaries of foreign companies. The Nippon Victor Phonograph, which registered 127 patents between 1939 and 1941, was a wholly owned subsidiary of the Victor Talking Machine, established in the United States in 1927. RCA became its parent company in 1931. Until the 1920s, there were many patent registrations by American companies, such as General Electric (GE), Westinghouse Electric, and Western Electric. However, after the 1920s, while Westinghouse Electric and Western Electric continued to register patents, the number of GE’s patents decreased, eliminating it from the top ten. By contrast, German companies such as Siemens and Telefunken, as well as Patent-Treuhand Gesellschaft für Elektrische Glüehlampen, Patent Verwertungs Gesellschaft, and Fides Gesellschaft für die Verwaltung und Verwertung von Gewerblichen Schutzrechten, a patent management association, increased their patent applications. These foreign companies conducted business by transferring inventions made in their home countries to Japan, exporting technological products protected by patents to Japan, or through technology transfers by licensing to Japanese companies.
Major corporations in the electrical industry (number of patents)

Table 5 Long description
The table lists the top ten resident and non-resident companies in the electrical industry based on the number of patents obtained during four distinct periods: 1899-1920, 1921-1930, 1931-1938, and 1939-1941. The table has 10 rows for resident companies and 10 rows for non-resident companies, with columns for each period. Resident companies include Nippon Electric, Shibaura Eng. Works, Kuhara Mining, Yasukawa Elec. Works, Tokyo Electric, Nippon Denchi, Furukawa Electric, Yasukawa Elec. Works, Mitsubishi Ship Build., and Meidensha. Non-resident companies include General Electric (US), Western Electric (US), Westinghouse Electric (US), Marconi (UK), Siemens (Germany), AEG (Germany), Krupp (Germany), Brown, Boveri (Switzerland), Electrical Research (US), and English Electric (UK). Each row lists the number of patents obtained by each company during the specified periods. Notable trends include the dominance of companies like Nippon Electric and Siemens across different periods, with fluctuations in the number of patents obtained by various companies over time.
Source: For the period from January 1899 to October 1909, two volumes of the Patented Inventions Classification General Catalog (Tokkyo-kyoku 1909, 1914a) were used as the primary source, with patentees corrected using the list of registered patents published in the Patent Gazette issued during the same period. For the period from November 1909 to December 31, 1941, data are collected from the list of registered patents published in the Patent Gazette and the table of contents of the Patented Inventions Specifications.
Note: The table lists the top ten corporations with more than ten patents. A foreign company’s local subsidiary, which was registered in Japan, is identified as a resident company. (1) Tokyo-Shibaura Electric, which was established by consolidating Tokyo Electric and Shibaura Engineering Works, includes both previous companies’ patents. (2) Western Electric includes its foreign subsidiary, International Western Electric, and International Standard Electric. (3) Siemens includes Siemens und Halske and Siemens-Schuckertwerke.
Among the major domestic corporations, Hitachi Ltd. has acquired 1,041 patents since 1921, all of which were inventions by residents. This stems from Hitachi’s organizational approach to R&D, which was based on the philosophy of pursuing independent technological development rather than aiming for domestic production by importing electrical machinery or introducing foreign technology. Beyond Hitachi, Japanese companies gradually internalized and organized their R&D activities, accumulating patents categorized as original R&D. On the other hand, the 2,632 patents held by domestic corporations for inventions by foreigners were not simply purchased by domestic corporations from the technology market but were obtained through partnerships with specific foreign companies. The primary combinations of such domestic and foreign companies were Nippon Electric and Western Electric, Tokyo Electric/Shibaura Engineering Works/Tokyo Shibaura Electric and GE, Mitsubishi Electric and Westinghouse Electric & Manufacturing, and Fuji Electric and the Siemens Group.
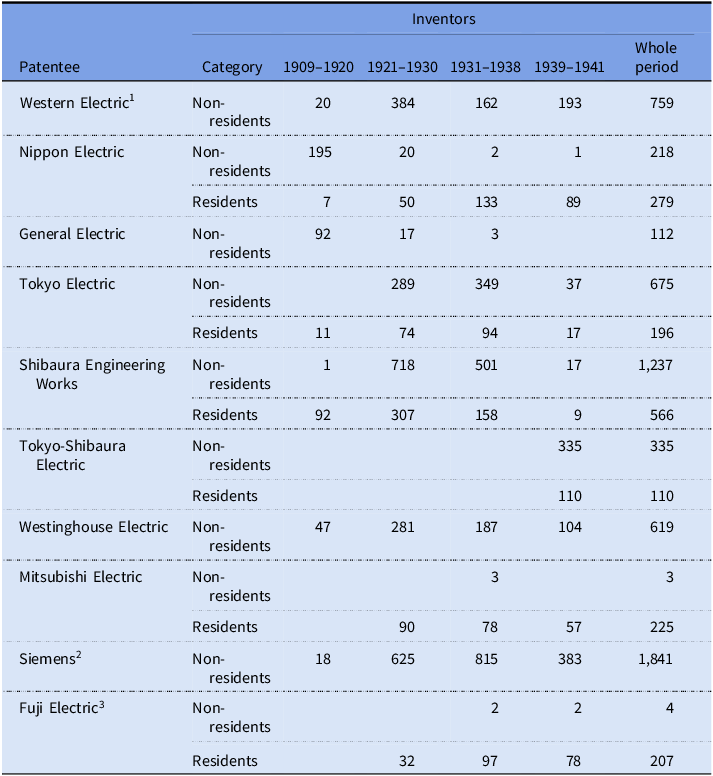
Table 6 compares the distribution of patent counts and inventors between foreign companies and their Japanese partners. Western Electric and its subsidiaries, International Western Electric (IWE) and International Standard Electric (ISE), consistently obtained patents in Japan based on non-resident inventions. Their partner, Nippon Electric, acquired numerous patents based on non-resident inventions prior to 1920; 195 of 202 patents (96.5 percent) were on account of this acquisition. After the 1920s, patents based on in-house inventions became the majority, whereas those based on foreign inventions virtually disappeared. Examining the entire period, 218 of 497 patents (43.9 percent) were based on non-resident inventions. GE began partnering with Shibaura Electric Works and Tokyo Electric in the early twentieth century. GE registered non-resident inventions under its own name until 1920 but almost ceased doing so after the 1920s. Conversely, its partner Shibaura Engineering Works increased its patents based on non-resident inventions. Between 1899 and 1941, it acquired 1,803 electrical patents, of which 1,237 (68.6 percent) were of inventions made abroad and registered as its own patents. Similarly, Tokyo Electric, partnering with GE, acquired numerous patents based on foreign inventions, and 675 (77.5 percent) of its 871 registered patents were based on foreign inventions. Tokyo Shibaura Electric, established through a merger of these two companies, continued to acquire patents based on foreign inventions. Between 1939 and 1941, 335 of 445 patents (75.3 percent) were based on non-resident inventions. It is also important to note that the number of patents based on resident inventions increased among Japanese companies partnering with GE. This indicates that internal technological development progressed in parallel with technology imports. Westinghouse Electric continuously registered patents for non-resident inventions. Mitsubishi Electric, which began a technical partnership with Westinghouse in 1923, advanced development alongside technology introduction and acquired patents for domestic inventions. Among Mitsubishi Electric’s patents, those based on foreign inventions accounted for 3 out of 228 (1.3 percent). The Siemens group registered patents in Japan for inventions made in Germany. In 1923, Fuji Electric was established through a joint investment with Furukawa Zaibatsu. The vast majority of the patents acquired by Fuji Electric were based on resident inventions; only four out of 211 patents (1.9 percent) were based on non-resident inventions.
Inventors of corporate patents (number of patents)

Table 6 Long description
The table compares the number of patents by inventors for various electric companies over different time periods. It has 11 rows and 6 columns. The columns are labeled Patentee, Category, 1909-1920, 1921-1930, 1931-1938, 1939-1941, and Whole period. The rows are labeled with the names of different electric companies and their categories as residents or non-residents. Row 1: Western Electric, Non-residents, 20, 384, 162, 193, 759. Row 2: Nippon Electric, Non-residents, 195, 20, 2, 1, 218. Row 3: Nippon Electric, Residents, 7, 50, 133, 89, 279. Row 4: General Electric, Non-residents, 92, 17, 3, 112. Row 5: Tokyo Electric, Non-residents, 289, 349, 37, 675. Row 6: Tokyo Electric, Residents, 11, 74, 94, 17, 196. Row 7: Shibaura Engineering Works, Non-residents, 1, 718, 501, 17, 1,237. Row 8: Shibaura Engineering Works, Residents, 92, 307, 158, 9, 566. Row 9: Tokyo-Shibaura Electric, Non-residents, 335, 335. Row 10: Tokyo-Shibaura Electric, Residents, 110, 110. Row 11: Westinghouse Electric, Non-residents, 47, 281, 187, 104, 619. Row 12: Mitsubishi Electric, Non-residents, 3, 3. Row 13: Mitsubishi Electric, Residents, 90, 78, 57, 225. Row 14: Siemens, Non-residents, 18, 625, 815, 383, 1,841. Row 15: Fuji Electric, Non-residents, 2, 2, 4. Row 16: Fuji Electric, Residents, 32, 97, 78, 207.
Source: For the period from January 1899 to October 1909, two volumes of the Patented Inventions Classification General Catalog (Tokkyo-kyoku 1909, 1914a) were used as the primary source, with patentees corrected using the list of registered patents published in the Patent Gazette issued during the same period. For the period from November 1909 to December 31, 1941, data are collected from the list of registered patents published in the Patent Gazette and the table of contents of the Patented Inventions Specifications. The individual specifications were obtained from the National Center for Industrial Property Information and Training’s J-PlatPat.
Note: (1) Western Electric includes Western Electric, International Western Electric, and International Standard Electric. (2) Simens includes Siemens und Halske, Siemens-Schuckertwerke, Patent Verwertungs Gesellschaft mbH Hermes, and Fides Gesellschaft für die Verwaltung und Verwertung von Gewerblichen Schutzrechten mbH. (3) Fuji Electric includes Fuji Electric and its subsidiary Fuji Tsushinki (Fujitsu).
Progress in organized R&D and technology interactions
This analysis of patent data reveals that resident companies have been advancing their own R&D alongside technology introduction (Table 4), with major non-resident firms obtaining numerous patents for foreign inventions in Japan and advanced technology transfer, while resident firms have simultaneously pursued their own organized R&D (Table 5), and that non-resident firms partnering with Japanese companies and their Japanese counterparts, regardless of whether the patentees were resident or non-resident firms, advanced technological development alongside technology introduction (Table 6). However, understanding how the introduction of technology and technology transfer from abroad is related to resident firms’ technological development – specifically, the relationship between local R&D, technology introduction, and technology transfer as shown in Table 4 – requires a business history approach to clarify each firm’s strategy and organization. Furthermore, the actual scale of MNEs using local R&D, which amounts to only two as revealed in Table 4, also needs to be clarified to understand how multinational corporations utilized Japanese firms’ R&D. Below, we examine the cases that exhibit the progression of organized R&D in Japan during the first half of the twentieth century, focusing on the nature of technology introduction and R&D. We categorize these into three patterns: imitation and improvement, technology introduction and development through partnerships, and the development of proprietary technology.
Imitation and improvement
The approach to technology introduction and R&D varied depending on the period and product field. In the field of wireless communication equipment prior to 1920, technology introduction and R&D were conducted in the form of imitation and improvement. In the early days of wireless equipment in Japan, the technology was introduced not by importing wireless telegraph equipment already in use in Europe, but by making prototypes based on these examples and developing them into domestic products. The Ministry of Posts and Telecommunications and the Army and Navy researched and developed wireless telegraph equipment. Ministry of Posts and Telecommunications-style spark transmitters and TYK (Torigata–Yokoyama–Kitamura) wireless telephones were developed based on the original design. Their patents were initially taken by individual inventors before becoming government-owned. Private companies manufactured wireless equipment. Annaka Electrical Works – established in 1900 by Annaka Tsunejiro, an assistant at Tokyo Imperial University – manufactured wireless equipment under a license from the government (Nishimura Reference Nishimura2024: 926). In 1915, its predecessor Nihon Musen (Japan Radio) was established; it designed marine radio equipment and later internalized its production. The company developed a new type of wireless equipment that did not infringe on the patents of the Ministry of Posts and Telecommunications and created a device based on its own design, drawing inspiration from the Telefunken-type spark-gap wireless telegraph device (ibid.: 926). In Japan’s early wireless equipment industry, foreign technology was systematically copied and improved, and patents were registered either in the name of the government or with individuals. As shown in Table 3, the ratio of individual patents to domestic ones was high during this period.
Technology introduction and development through partnerships
In the fields of telephone equipment, electric light bulbs, electrical machinery, and radio equipment, systematic technology introduction and development were conducted over the long term. Corporations established in Japan included those forming joint ventures with foreign companies and those in which Japanese companies later formed capital alliances with foreign firms to become affiliates. In both cases, technology transfer from abroad and independent technological development progressed. Furthermore, in some cases, inventions made by Japanese affiliates had to be notified to the parent company and patented. This indicates that the original R&D shown in Table 4 also possessed characteristics of the MNE’s local R&D.
Nippon Electric and Western Electric
Foreign companies actively transferred technology in the field of telephone equipment. Walter T. Carleton of Western Electric and Kunihiko Iwadare jointly invested in establishing Nippon Electric in 1899. The company not only imported American-made telephone equipment but was also considered one of Western Electric’s overseas manufacturing plants, and many telephone equipment-related technologies were imported (Nippon Denki Shashi Hensan Shitsu 2001: 43–45). During this process, Nippon Electric registered numerous patents for foreign inventions. As shown in Table 6, almost all the patents held by Nippon Electric during this period were non-resident inventions. For some time after its establishment, Nippon Electric’s business consisted of introducing Western Electric telephones and telephone technology into Japan and installing and implementing them. Although a technical department was established in 1908, its primary purpose was to assimilate Western Electric technology. By 1920, a research department was newly established within the technical department, but its work never progressed beyond assimilating technology imported from abroad.
However, by the 1920s, original R&D began. Yasujiro Niwa – who joined the company in 1924 upon request (having previously researched electrical technology at the Ministry of Communications’ Electrical Testing Laboratory) – proposed that “the technology was overly reliant on WE Company and lacked autonomy, necessitating independent research” (Nippon Denki KK. 1972: 130). This proposal led to the expansion of the R&D organization, with Niwa appointed as technical department manager. Niwa defined the direction of the technical department’s research division, which then dedicated itself to independent R&D. The result was the development of an NE-type photographic transmission device in 1928, Japan’s first original facsimile machine. Through this process, patents based on original R&D at Nippon Electric increased from seven in 1899–1920 to 50 in the 1920s (averaging five per year) and to 133 in 1931–38 (16.6 per year) and further to 89 in the three years starting from 1939 (29.7 per year) (Table 6).
Tokyo Electric, Shibaura Engineering Works, and GE
In the fields of electric light bulbs and electrical apparatus, American companies secured Japanese patents early on while importing and selling these products. Around the same time, Japanese companies were endeavoring to produce electrical goods domestically. However, catching up with rapidly evolving foreign electrical technology and competing with imported foreign products proved challenging. Consequently, they accepted capital from foreign companies and entered into agreements to obtain patent licenses and introduce advanced technology.
Tokyo Electric originated in Hakunetsusha and was established in 1890 by Ichisuke Fujioka and Shoichi Miyoshi. Since its founding, it pursued the domestic production of light bulbs, establishing a laboratory as early as 1899 to improve bulbs and their manufacturing methods (Yasui Reference Yasui1940: 6, 508–9). However, it faced limitations in its ability to produce electrical products. Failing to develop a competitive domestic light bulb, Tokyo Electric entered a capital and technical partnership with GE in 1905 to introduce light bulb technology (Yasui Reference Yasui1940: 99; Uchida Reference Uchida, Okochi and Uchida1980: 155–57). The initial contract with GE did not permit R&D activities at Tokyo Electric, positioning it solely as GE’s light-bulb factory in the Far East. However, due to intense lobbying by Japanese managers and engineers, these restrictions were eased by 1912, allowing the expansion of an organization dedicated to R&D (Hasegawa Reference Hasegawa1995: 130, 141; Yasui Reference Yasui1940: 510–11). By 1918, the laboratory became an independent research institute (Yasui Reference Yasui1940: 524–25), and by 1920, it had registered eleven patents.
Shibaura Engineering Works traces its origins to 1875, when Hisashige Tanaka established Tanaka Manufacturing Works to produce telegraph equipment, machinery, and naval weapons. Facing financial difficulties owing to reduced naval orders following the Yokosuka Naval Arsenal’s facility expansion, Tanaka Manufacturing Works came under Mitsui’s control. Subsequently, it restructured its operations and organization, focusing primarily on electrical machinery. In 1904, it became independent and was rebranded as Shibaura Engineering Works (Kimura Reference Kimura1940: 11–23). In 1906, Shibaura also pursued systematic R&D and established a laboratory within its inspection department. This laboratory conducted product inspections, collected design reference materials, performed preliminary experiments, and explored new materials (Kimura Reference Kimura1940: 293–96). However, it was recognized that collaboration with foreign companies was necessary to keep pace with the rapid technological development abroad. Consequently, in 1909, Shibaura entered into a capital and technical partnership with GE (Kimura Reference Kimura1940: 53; Uchida Reference Uchida, Okochi and Uchida1980: 154). The introduction of technology from foreign companies stimulated R&D in Shibaura, resulting in 92 patents registered by 1920 as outcomes of original R&D.
The characteristic feature of patent registrations by Tokyo Electric and Shibaura Engineering Works, both affiliated with GE from the 1920s onward, was the simultaneous rapid expansion of patents for inventions developed abroad (i.e., technology-introduction patents), as shown in Table 6, along with the parallel expansion of patents based on original R&D. This expansion in technology-introduction patents stemmed from the revision of their existing patent agreements with GE in 1919, which led to the establishment of new agreements. Under the 1919 contracts, GE transferred inventions to Tokyo Electric and Shibaura, which then managed the patents within their respective Japanese territories (Nishimura Reference Nishimura2004: 116–17). In other words, GE entrusted patent management in Japan to its local affiliates, using this framework to expand technology transfer from the United States to Japan. The scale was substantial: 1,007 patents (an annual average of about 100) for Tokyo Electric and Shibaura combined during the decade of the 1920s, and 850 patents (an annual average of approximately 106) over the eight years starting in 1931. Meanwhile, both Japanese companies pursued technological advancement through a dual approach: large-scale technology introduction coupled with investment in their own R&D (Nishimura Reference Nishimura2016: 116–20, 155–64). As noted previously, Tokyo Electric had established an independent research institute in 1918 and further expanded its organization. Shibaura also elevated its research section to a full-fledged research institute in 1931, enhancing its organizational R&D capabilities (Kimura Reference Kimura1940: 293–96). As a result, the number of patents invented and registered internally by Tokyo Electric increased from 11 until 1920 to 74 (7.4 per year) in the 1920s and further expanded to 94 (11.6 per year) between 1931 and 1938. In Shibaura, the number of patents increased from 92 in 1920 to 307 (30.7 patents per year) during the 1920s. In the 1930s, the number of patents based on Shibaura’s original R&D decreased to 158 (19.8 patents per year). However, this was because of deteriorating business performance caused by the Great Depression, which led to the disposal of unnecessary patents (Kimura Reference Kimura1940: 297). The company’s commitment to actively pursue technological development remained unchanged.
Meanwhile, patent agreements between GE and Japanese companies after 1912 included provisions such as license-back clauses. That is, inventions made by Japanese companies had to be notified to GE, and GE could then obtain patents for those inventions in the United States and other regions as its own. Although the number of patents transferred from Tokyo Electric and Shibaura Engineering Works to GE totaled only approximately seventy between the two companies (Nishimura Reference Nishimura2016: 159–60), the patents acquired by Japanese companies collaborating with foreign firms can be said to have possessed the characteristics of MNE’s local R&D (Table 4).
Mitsubishi Electric and Westinghouse Electric
In the early twentieth-century electrical machinery market, domestic products from Shibaura Engineering Works competed with imported goods. However, by the 1920s, new companies entered the expanding market. One such company was Mitsubishi Electric, which was divested from Mitsubishi Shipbuilding in 1921. To enter the electrical machinery market, Mitsubishi Electric, which had been manufacturing ship fittings, was in need of new technology. Consequently, the company formed a technical partnership with Westinghouse Electric in 1923 and simultaneously accepted a 10 percent equity investment (Mitsubishi Denki KK. Shashi Henshu Iinkai 1951: 67). Rather than simply imitating the technology introduced by Westinghouse, Mitsubishi Electric pursued its own R&D based on foreign expertise. The company established a machine tool research section within its factory in 1926 to conduct systematic R&D, expanding it into the head office research section by 1935 (Nishimura Reference Nishimura2015: 39–40). Westinghouse obtained Japanese patents and licensed them to Mitsubishi Electric. The scale of this licensing was 281 patents (annual average of 28.1) in the 1920s, 187 patents (23.4) from 1931 to 1938, and 104 patents (34.7) in the three years starting from 1939. The number of patents based on Mitsubishi Electric’s original R&D increased to ninety in the 1930s (nine per year), seventy-eight from 1931 to 1938 (9.8 per year), and fifty-seven in the three years starting in 1930 (19 per year).
Fuji Electric and Siemens
Siemens had been exporting and installing German products in Japan since early on, but in 1923, it established Fuji Electric Manufacturing as a joint venture with the Furukawa Zaibatsu, transferring Siemens’ electrical technology to Japan and commencing manufacturing business (Donzè and Nishimura Reference Donzè and Nishimura2022: 204–5; Fuji Denki Seizo KK. 1957: 6–7; Fuji Tsushinki Seizo KK.1964: 9). The scale of technology transfer to Japan by Siemens and its German affiliates was considerable: 625 patents in the 1920s (annual average of 62.5), 815 patents from 1931 to 1938 (approximately 101.9), and 383 patents in the three years starting from 1939 (approximately 127.7). Indeed, Fuji Electric did not simply reproduce foreign technology; it advanced its own R&D based on the transferred technology. Fuji Electric established a research section in 1934, a research department within the production division in 1936, and an independent research institute in 1939 (Nishimura Reference Nishimura2022: 8–16). As a result of technology transfer from Siemens and systematic R&D, patents based on Fuji Electric’s original R&D – including its subsidiary Fuji Communications (Fujitsu) – expanded from thirty-two patents (annual average of 3.2 patents) in the 1920s to ninety-seven patents (average of approximately 12.1) during 1931–38 and to seventy-eight patents (average of 26) over the three years starting in 1939.
Development of proprietary technology
In the 1920s, Hitachi Ltd. began full-scale operations with the aim of establishing proprietary technology, significantly expanding its patent acquisition through original R&D. This is crucial for understanding the characteristics of the systematic technological development in Japan. Hitachi, founded by Namihei Odaira in 1910 and incorporated in 1920, sought to achieve the domestic production of electrical machinery using only Japanese technology without relying on foreign technology. Odaira’s entrepreneurship encouraged both managers and workers to adopt a technology-development-oriented attitude (Nishimura Reference Nishimura2018: 9–16). Furthermore, to develop proprietary technologies and establish their foundations, Hitachi organized in-house R&D. It established a testing section in 1914, which subsequently evolved into a research section in 1918. It expanded into a research laboratory in 1934 and was renamed the Hitachi Research Institute in 1939 (Sawai Reference Sawai2012: 48). The results of this entrepreneurial drive and systematic R&D were reflected in the number of registered patents. Hitachi’s patent count from 1899–1920 was only two (twenty-five if patents from its predecessor, Kuhara Mining, were included). However, in the 1920s, it reached 390 (an annual average of 39), with 407 patents (50.9 patents per year) between 1931 and 1938 and 244 patents (81.3 per year) in the three years starting from 1939.
While Hitachi’s technological development may appear unrelated to foreign technology, the company indeed conducted in-depth research on foreign innovations to learn the latest techniques and apply them to its own independent R&D. Hitachi systematically collected domestic and international patent information to advance its internal R&D efforts. Odaira began purchasing and compiling Japanese patent gazettes from the very first issue for use as R&D reference material. Around 1921, the company began purchasing the Abridgment of Specifications, a British patent abstract. Furthermore, in 1924, it began purchasing the Official Gazette – a compendium of US patents – thereby advancing the organization of patent information not only from Japan but also from the UK and the US (Nishimura Reference Nishimura2018: 5, 11–12). When developing unique domestic technology independent of foreign technology, systematic efforts are necessary to investigate competitors’ patents and establish development strategies.
In addition to Hitachi, Japanese companies that had not partnered with foreign companies began organizing internal R&D departments. By the 1930s, this led to a surge in patents based on the original R&D. Anritsu Electric, formed by the 1931 merger of Annaka Electric and Kyoritsu Electric, established a research organization upon its founding, which became a research department in 1934. The company acquired twenty-seven patents (an average of approximately 3.4 per year) between 1931 and 1938 and eighteen patents (an average of six per year) between 1939 and 1941. Furukawa Electric – one of the core companies of Furukawa Zaibatsu – had already begun systematic research in 1919, expanding its organization to a research section in 1929 and a research department in 1939. As a result, its patent acquisitions increased from sixty in the 1920s (average six per year) to fifty-one in 1931–38 (average approximately 6.4 per year) and then to twenty-six from 1939 to 1941 (average approximately 8.7 per year). Osaka-based Matsushita Electric Industrial (now Panasonic) established a laboratory in 1933, which became a chemical research department the following year (Sawai Reference Sawai2012: 48). Although patents were initially taken by individual inventors, the company began obtaining corporate patents in 1937. The number of patents obtained, which was seven over the two years of 1937 and 1938, expanded to 64 (approximately 21.3 per year) over the three years starting in 1939. Nippon Denchi in Kyoto established a research section within its head office in 1919, but as early as 1921, it advanced battery R&D as an independent organization (Nippon Denchi KK. 1937: 69). The number of patents based on the company’s original R&D was 10 until 1920, seven in the 1920s (annual average 0.7), thirty from 1931 to 1938 (annual average 3.75), and twelve in the three years starting in 1939 (annual average four).
Discussion
This study reveals the profound influence of corporate patents on economic growth – previously unseen within the individual-versus-corporate patent dichotomy – by analyzing the addresses of corporate patent inventors. It explicitly clarifies the effects of technology introduction and, particularly, its influence on the organized R&D activities of Japanese companies. Foreign firms promoted Japanese companies’ original R&D, whether they obtained Japanese patents themselves and licensed technology to partner firms (patents presented as Technology Transfer in Table 4) or obtained patents through partner firms and licensed technology (patents also presented as technology introduction). This indicates that the integration of technology introduction and development within the organization led to an increase in corporate patents, with this linkage becoming dominant in the electrical machinery industry. However, this integration of technology introduction and development was not limited to the 1920s and 1930s. During Japan’s period of high economic growth from the mid-1950s onward, proactive, organized technology introduction coupled with subsequent improvements and the development of proprietary technologies leveraging it became a key trajectory of Japan’s economic growth (Kohama Reference Kohama2007; Morris-Suzuki Reference Morris-Suzuki1994; Uchida Reference Uchida, Okochi and Uchida1980).
The influences of expanding corporate patents on innovation were threefold: patent management enabled a more effective link between technology introduction and development; the formation of patent management contributed to the development of the national system of innovation (Freeman Reference Freeman1995; Lundvall Reference Lundvall, Dosi, Freeman, Nelson, Silverberg and Soete1988); and finally, corporate patents, through the proliferation of periodicals such as patent specifications, promoted innovation not only within companies such as Hitachi that did not partner with foreign firms but also among other companies and individual inventors.
The growth in corporate patents generated patent management within companies. Shibaura Engineering Works, which established a patent manager in 1912 for internal and external inventions and technologies, was the first to engage in organized patent management. Tokyo Electric began processing patent applications internally in 1917. In 1923, both companies strengthened their organizations by recruiting experts from the Japan Patent Office as the heads of their departments (Nishimura Reference Nishimura2016: 83, 91, 123–25, 128). Mitsubishi also assigned a full-time patent manager to the head-office engineering department at Kobe Works in October 1923 (Nishimura Reference Nishimura2015: 40). At Fuji Electric, the Japanese subsidiary of Siemens initially handled patent management; however, in 1927, the patent department was transferred to Fuji Electric (Nishimura Reference Nishimura2022: 16–17). In Hitachi, the number of patent applications was low until 1920, when Odaira, the founder, handled patent management by himself. In 1921, a patent manager was appointed, and organizational management gradually began (Nishimura Reference Nishimura2018: 9–12).
Patent management served as one mechanism that linked technology introduction and development, functioning as a channel for receiving technical information from foreign companies and transmitting it to R&D departments. This mechanism is evident in cases such as Tokyo Electric, Shibaura Engineering Works, and Fuji Electric, which handled patent application procedures in Japan for inventions originating from foreign companies. While Tokyo Electric and Shibaura applied for and registered GE inventions under their own names, Fuji Electric applied for and registered inventions from Siemens and related companies under the names of German firms. However, in all cases, the patent departments handled the application processing for technologies that were continuously provided under comprehensive, long-term contracts.
Internalizing the patent application work for technology sources offered several advantages. First, it allowed access to patent information before it was disclosed publicly to other companies. Furthermore, technical information was shared within the organization, including the patent department, and efficiently transferred to R&D and manufacturing sites, leading to the expansion of in-house R&D (Nishimura Reference Nishimura2016: 164–68). By contrast, it took time for Mitsubishi Electric to reap such benefits. Having partnered with Westinghouse in 1923, Mitsubishi Electric not only received drawings, technical documents, and specifications from the technology provider but could also station two representatives at Westinghouse’s American factories to learn manufacturing methods and send up to five Mitsubishi engineers on apprenticeship courses. However, Westinghouse independently applied for Japanese patents and only granted Mitsubishi Electric a license. Mitsubishi Electric requested the handling of the application process for Westinghouse’s Japanese patents; however, this was initially refused. Ultimately, however, it began handling Westinghouse’s patent applications in 1936 (Nishimura Reference Nishimura2015: 41–43).
The establishment of patent management in these major electrical companies also played a role in the development of Japan’s national innovation system. Research collaboration among industry, universities, and national research institutions in Japan expanded in the 1930s, giving rise to a unique Japanese innovation system (Hiramoto Reference Hiramoto and Hiramoto2014). Amidst the movement, the Committee for the Investigation of the Domestic Production of Communication Equipment, which was the joint R&D program for vacuum tubes, was established in 1936; the committee included engineers from the Ministry of Posts and Telecommunications, universities, the military, and companies, as well as Takahashi Matsuji (head of the patent department) from Fuji Electric, Fujii Rinji (head of the patent department) from Tokyo Electric, and Rinjiro Shimizu from Nippon Electric (ibid.: 92). The patent managers dispatched by the companies managed technical transactions that crossed the organizational boundaries between their own companies and other enterprises. The development of patent management from the 1920s to the 1930s promoted the introduction of technology and technological development in each company but also contributed to the growth of the Japanese economy as a whole, transcending the boundaries of individual companies.
The increase in corporate patents stimulated innovation by individual inventors through periodicals such as the Patent Gazette and Patented Inventions Specifications. Even within the electrical industry, despite the rise in corporate patents, individual patents still accounted for nearly half of all filings. This raises the question of how individual inventors pursued technological development in this globally competitive industry. When attempting to create an invention or applying for a patent, it is necessary to refer to prior art. Such patent information was disseminated primarily through the Japan Patent Office, which obtained and distributed patent gazettes published by patent authorities worldwide. However, these patent gazettes were written in various languages (not only English but also German, French, etc.), rendering foreign language proficiency a prerequisite for understanding the technology. On the other hand, patents filed by foreign companies in Japan are published in Japanese. This renders technology far more likely to be disseminated domestically than if the periodicals were written in foreign languages. In the electric field, foreign corporations obtained 5,692 patents published in bulletins (Technology Transfer in Table 4), whereas Japanese companies acquired 2,632 patents through technology introductions from foreign partner companies (technology introduction). Including domestic inventions stimulated by these foreign technologies, knowledge was likely to spread widely, benefiting independent inventors as well. Not limited to electrical patents, examining the total print run of Patented Invention Specifications, 51 issues were published in the fiscal year 1910, the year following the commencement of publication, with a total print run of 25,017 copies. Of these, 19,356 were distributed to relevant government agencies, research institutes, libraries, and exhibition halls, and 4,146 were sold to the general public. Publication numbers increased in the 1920s. In 1925, 152 issues were published with 95,025 copies printed, of which 58,486 were distributed to relevant institutions, and 28,584 were sold to the public (Tokkyo-kyoku 1914b: 92). The number of published issues further increased in proportion to the expansion of patent registrations. By 1939, 161 issues were published, with a total print run of 134,360 copies. Distribution and sales increased to 89,323 and 44,154 copies, respectively (Tokkyo-kyoku 1941: 54). Not mentioned earlier, not only Hitachi but also major companies such as Nippon Denchi purchased and maintained these patent periodicals for their own internal R&D.Footnote 5 Small and medium-sized enterprises and individual inventors accessed bulletins at libraries and display facilities established throughout the country to obtain information to utilize in their inventions.
Conclusion
When examining whether independent inventors or corporations contributed more to technological development in Japan before World War II through a dichotomous lens, a higher number of individual patents suggests that independent inventors made a greater contribution. However, an analysis of the inventors behind corporate patents revealed that international technology transfer and R&D policies underpin an increase in corporate patents. In the electrical industry, organized technology transfer centered on corporations took place with the United States and Germany. Partnering Japanese companies actively linked technology introduction with technological development, making significant contributions to the industry’s technological progress since the 1930s. Even Hitachi – which stubbornly resisted partnerships with foreign firms and aimed to establish domestic technology – expanded its organized R&D under indirect stimuli within the broader industry-wide technology introduction and R&D movement. The expansion of corporate patents also strengthened the link between technology introduction and development in major firms through the formation of patent departments within each company during the 1920s. This further influences the formation of a national innovation system centered on large corporations and the promotion of R&D across the entire electrical machinery industry. The contribution of this article lies in its use of micro-level analysis grounded in business history to elucidate the economic significance of the increase in corporate patents – a phenomenon that has not been apparent in previous macro-level patent statistics.
Despite its contributions, this study has several limitations. First, it focuses solely on corporate patents in the electrical industry. While limiting the industry avoids industrial bias when using patent data (Pavitt Reference Pavitt1985: 95), as Pavitt indicates, the role of patents may differ across industries. What relationships do patents in the machinery or chemical industries reveal between individuals and corporations? Do corporate patents in sectors such as the electrical industry indicate the introduction of foreign technology and proprietary R&D? If so, then what was the nature of this relationship? Further research is required to address these questions. The second limitation concerns Japanese patent data. Documentation reflecting the early status of Japan’s patent system is considerably scarce compared with that of other countries, largely because of the destruction of the original registry during the 1923 Great Kanto Earthquake. It is impossible to determine with certainty whether the inventors of corporate patents were independent individuals, company employees, or personnel from other companies or government agencies. This study treated all inventors of corporate patents as employees; however, cross-referencing with other data sources is necessary. Furthermore, data on annual fee payments or patent durations, essential for measuring patent value, are also insufficient, necessitating the development of new approaches. Third, an international comparison of the economic impact of corporate patents remains a challenge. While studies have been conducted on patents of foreign firms in Germany (Degner and Streb Reference Degner, Streb, Donzé and Nishimura2014) and Spain (Sáiz Reference Sáiz2012; Sáiz and Pretel Reference Sáiz, Pretel, Donzè and Nishimura2014), there is a scarcity of research examining how patents held by firms – including foreign firms – contribute to economic growth in various countries. Research is needed to clarify the significance of corporate patents in a private-sector-centered economy.
Acknowledgments
This work was supported by JSPS KAKENHI Grant Numbers JP19H01512, JP22K01604, JP23H00842, and the Mitsubishi Foundation Research Fund.