I. INTRODUCTION
TiNi alloy has received a great deal of attraction in recent years because of its fascinating properties such as shape memory effect, pseudoelasticity, good biocompatibility, and excellent corrosion resistance. Reference Simões, Viana, Ramos, Vieira and Vieira1,Reference Patel, Moon, Kassegne and Morsi2 TiNi thin films have been successfully applied to sensors, actuators, and microvalves in microelectromechanical systems Reference Fu, Huang, Du, Huang, Tan and Gao3–Reference Ishida and Martynov6 and medical implants in human body. Reference de Miranda, Zamponi and Quandt7,Reference Lin, Wang, Xue, Lu, Qin and Zhang8 The intrinsic disadvantage in manufacturing TiNi alloys is that they respond slowly to the deformation due to their limitation in the cooling ratio, whereas manufacturing TiNi alloys in thin films can dramatically minimize the disadvantage. Reference Kim, Jeon, Park, Kim, Kim and Yeom9
During the past decade, various technologies have been developed to fabricate TiNi thin films. Sekiguchi et al. Reference Sekiguchi, Funami and Funakubo10 used vacuum evaporation to fabricate the TiNi thin film; however, homogeneous thin films could not be formed because of the different evaporation rates of Ti and Ni by the conventional vacuum evaporation technique. Then, Makino et al. Reference Makino, Uenoyama and Shibata11–Reference Makino, Shibata and Kato13 applied the flash evaporation technique to vacuum evaporation, in which the evaporation source was supplied as a small pellet of the original materials and therefore the negative effect of differences in vapor pressure could be suppressed to as small a degree as possible. In spite of the success in fabricating the TiNi film with the flash evaporation technique, Reference Makino, Mitsuya and Shibata12,Reference Makino, Shibata and Kato13 it was still difficult to realize its industrial application due to its relatively complex processes and high cost. Afterward, many researchers focused on preparing the TiNi thin films by dc or rf magnetron sputtering, with TiNi alloys used as the single-target materials. Reference Fu, Huang, Du, Huang, Tan and Gao3,Reference Lehnert, Tixier, Böni and Gotthardt14,Reference Ho and Carman15 Nevertheless, it is difficult to fabricate thin films using the conventional single-target sputtering method to attain a specific composition due to the low sputtering rate of Ti atoms compared to Ni atoms Reference Surbled, Clerc, Le Pioufle, Ataka and Fujita16 and higher oxygen contamination of Ti atoms than Ni atoms during sputtering. Reference Ho and Carman15,Reference Johnson17 For appropriate composition control, the co-sputtering method using a multitarget sputtering system was used to fabricate the Ti/Ni multilayer films, and then the multilayer films were heat treated to obtain the TiNi thin film by the interdiffusion of Ti and Ni. Reference Kim, Jeon, Park, Kim, Kim and Yeom9 Lehnert et al. Reference Lehnert, Tixier, Böni and Gotthardt14,Reference Pan, Cao, Wei, Xu, Shi and Meng18 also fabricated the desirable TiNi thin films by this method. In addition, other methods are also feasible to prepare the TiNi thin film, such as the pulsed-laser deposition experiment conducted by Chen, Reference Chen, Lu, Ren and Zhu19 in which the exciting source was a pulsed-laser beam.
The Ti–Ni interdiffusion phenomenon cannot be avoided in the process of preparing TiNi thin films with sputter deposition. The main intermetallic phases in the Ti–Ni system are Ti2Ni, TiNi, and TiNi3 according to the Ti–Ni equilibrium phase diagram. Reference Massalski and Kacprzak20 Many studies have focused on the growth rule of the three compounds in the Ti–Ni diffusion system. Bastin and Rieck Reference Bastin and Rieck21,Reference Bastin and Rieck22 reported the growth of the three intermetallic compounds and the intrinsic diffusion coefficient with different diffusion couples. Garay et al. Reference Garay, Anselmi-Tamburini and Munir23 studied the enhanced growth of the intermetallic phases in the Ti–Ni system with different current densities. Only a few researches have studied the formation sequence of the intermetallics. The three intermetallics had an equal possibility of nucleating in the Ti/Ni system because of their almost same free surface energies, according to Nizhenko's Reference Nizhenko24 report. But, according to Bastin and Rieck's study, Reference Bastin and Rieck21,Reference Bastin and Rieck22 the formation of Ti2Ni and TiNi3 occurred earlier than TiNi because they thought the TiNi nucleated and grew by consuming Ti2Ni and TiNi3. A big dispute about the formation sequence of the intermetallics in the Ti–Ni diffusion system exists and further work is necessary to reveal the formation sequence of Ti2Ni, TiNi, and TiNi3 in the diffusion process.
In this study, the prepared sandwiched Ni/Ti/Ni films by the chemical nickel-plating method is used to fabricate the TiNi thin films because of its lower cost compared with that of the sputtering method or the pulsed-laser deposition. It is important to note that no matter what method is chosen to fabricate the TiNi thin film, the selection of the optimum heating process parameters is a vital problem. So, we focus on the investigation of the influences of two important heating process parameters, diffusion temperature and the time for the formation of the homogeneous TiNi thin films by experiment and mixing energy (G mix) analysis. Reference Benedictus, Böttger and Mittemeijer25 Meanwhile, the Gibbs free energy of reaction and increasing interface energy theory Reference Liu, Wang, Zhu, Tao and Jin26 have been proposed to predict the formation sequence of the interfacial phases and many experiments also have been done to confirm the thermodynamic calculation results.
II. EXPERIMENTAL PROCEDURE
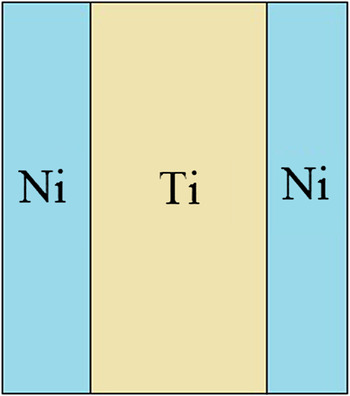
The samples with the sandwiched structure used in the experiments consisted of three metallic layers: the middle hot-rolled Ti layer between the bilateral chemical nickel-phosphate-plated Ni layers, as shown in Fig. 1. The whole thickness of the foils was about 50 µm and the atomic ratio of Ti and Ni was controlled to be approximately equal. The samples were cut into square specimens with an area of 5 × 10 mm by wire-electrode cutting and the small specimens were ultrasonic cleaned in acetone. The small foils were annealed at 1173 K for 1, 2, 3, and 4 h, at 1073 K for 5 h, and at 973 K for 120, 300, 600, 2400, 3600 s, and 30 h, respectively. The specimens were put in the silica capsules with a vacuum level better than 10−3 Pa to protect them from O and N contamination. After the heat treatment, the specimens were inlayed in epoxy resin sectioned parallel to the cross-section of the foils, and then were prepared to observe the microstructure by using the standard metallographic technique. Scanning electron microscopy (SEM) was used to characterize the microstructure of the diffusion interface and the intermetallic layers at an accelerating voltage of 20 keV. Meanwhile, energy dispersive x-ray spectroscopy (EDS) was conducted at an accelerating voltage of 20 keV to quickly analyze the element components of the various reaction zones.
The schematic diagram of Ti/Ni multilayers with sandwiched structure.

III. EXPERIMENTAL RESULTS AND DISCUSSIONS
A. Preparation of the TiNi thin films by diffusion
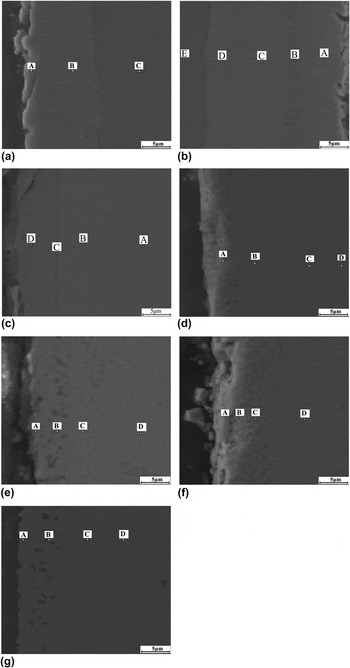
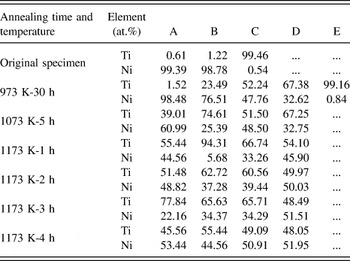
Figure 2 displays the SEM images of the interfacial morphology of the Ni/Ti/Ni sandwiched films annealed with different temperatures and times. Extended reactions occur at the Ti/Ni interfaces, and several emblematic zones are designated to analyze the atomic distribution. The EDS results of the atomic percentages of Ti and Ni are listed in Table I. Figure 2(a) shows the microstructure of the original specimen, which indicates that the Ni/Ti/Ni interfaces are clear and firm. Figure 2(b) shows the Ti/Ni diffusion zone annealed at 973 K for 30 h, and it can be found that the diffusion zone consists of five distinct layers, designated as layers A, B, C, D, and E. The residual Ni (layer E) is a single phase with Ti in solid solution and the residual Ti (layer A) is mainly the α-Ti phase, according to the EDS results listed in Table I and the report of Wei and Lin. Reference Wei and Lin27 The layer B adjacent to the Ni layer is composed of 23.49 at.% Ti and 76.51 at.% Ni, indicating the formation of the TiNi3 intermediate phase. The layer D abutting the Ti layer consists of 67.38 at.% Ti and 32.62 at.% Ni, corresponding to the Ti2Ni intermetallic compound. The layer C between the Ti2Ni and TiNi3 is mainly the TiNi phase with the atomic ratio Ti:Ni = 52.24:47.76. Figure 2(c) presents the microstructure of the diffusion interface of the Ti/Ni annealed at 1073 K for 5 h. It can be clearly observed that the interfaces of Ti2Ni and the interfaces of TiNi3 are unobvious, whereas the TiNi layer (the atomic ratio Ti:Ni = 51.50:48.50) is thicker than that annealed at 1073 K for 30 h. Figures 2(d)–2(f) show the interfacial morphology of the Ni/Ti/Ni films with annealing times of 1, 2, and 3 h, respectively, at 1173 K. The diffusion rates of Ti and Ni at 1173 K are much higher than that at 1073 and 973 K in terms of the Arrhenius equation. With the increase of the diffusion time, the Ti and Ni atoms are distributed more and more uniformly. The EDS results show that the atomic percentage ratio of Ti and Ni is moving toward the composition of the TiNi alloy, as listed in Table I. The microstructure of the diffused zone with an annealing time of 4 h at 1173 K is shown in Fig. 2(g). The atomic percentage of Ti at the emblematic zones A–D in Fig. 2(g) are 45.56, 55.44, 49.09, and 48.05, respectively, and the atom percentage of Ti in TiNi alloy is 48.40–50.83 (Ref. Reference Massalski and Kacprzak20), which indicates that homogeneous TiNi thin film is obtained under the specific heat treatment condition. Extended pores are found at the original Ni layer in every picture of Fig. 2, and the formation of these pores are due to the Kirkendall effect that Ni diffuses to the Ti side faster than Ti does to the Ni side. Reference Wei and Lin27
The SEM images of the interfacial morphology of the Ti/Ni diffusion film annealed with different temperatures and times; A, B, C, D, and E represent some typical zones with the analyses of EDS, respectively. (a) The original specimen; (b) the sample annealed at 973 K for 30 h; (c) the specimen annealed at 1073 K for 5 h; (d) the specimen annealed at 1173 K for 1 h; (e) the specimen annealed at 1173 K for 2 h; (f) the specimen annealed at 1173 K for 3 h; and (g) the specimen annealed at 1173 K for 4 h.

The atomic percentage of Ti and Ni at several emblematic zones (A, B, C, D, and E).

Then the mixing energy (G mix) is introduced into the binary (transition) metal–metal system to explain the reason that when the atomic ratio between Ti and Ni is 1:1, the homogeneous TiNi thin film would be formed. G mix is the change of the energy in the system when the diffusion phenomenon occurs. Reference Benedictus, Böttger and Mittemeijer25 When the diffusion proceeds with enough time, the mixed phases A x B1−x can form at the interface of the two original phases A and B, in which the variable x is the atomic percentage of the corresponding element. In the present research, A and B represent the elements Ti and Ni, respectively. G mix is a function of x and temperature T. The mixing enthalpy is estimated by the method of Miedema, Reference Li, Cui, Shi and Yang28 and is taken as the configurational entropy. As a result, the G mix is determined by the following equation Reference Benedictus, Böttger and Mittemeijer25,Reference De Boer, Boom, Mattens, Miedema and Niessen29 :
 $${G_{{\rm{mix}}}}(x,T) = x{\kern 1pt} F_{\rm{B}}^{\rm{A}}(x){\kern 1pt} \Delta H_{{\rm{A}}\;{\rm{in}}\;{\rm{B}}}^{{\rm{interface}}} - T\Delta {S_{{\rm{conf}}}}\quad ,$$
where
 $\Delta H_{{\rm{A}}\;{\rm{in}}\;{\rm{B}}}^{{\rm{interface}}}$
is the enthalpy change upon solution of one mole of A in B and ΔS
conf is the change in configurational entropy.
 $F_{\rm{B}}^{\rm{A}}(x)$
is the degree to which A atoms are surrounded by B atoms. The parameter is well estimated by
Reference Benedictus, Böttger and Mittemeijer25
 $$F_{\rm{B}}^{\rm{A}}(x) = C_{\rm{B}}^{\rm{S}}(x) = {{(1 - x)V_{\rm{B}}^{{2 \mathord{\left/ {\vphantom {2 3}} \right. \kern-\nulldelimiterspace} 3}}} \over {x\,V_{\rm{A}}^{{2 \mathord{\left/ {\vphantom {2 3}} \right. \kern-\nulldelimiterspace} 3}} + (1 - x)V_{\rm{B}}^{{2 \mathord{\left/ {\vphantom {2 3}} \right. \kern-\nulldelimiterspace} 3}}}}\quad ,$$
where
 $C_{\rm{B}}^{\rm{S}}(x)$
is the volume fraction of B. V
A and V
B are the molar volume of the pure crystalline solids [V
Ti = 10.6 cm3/mol, V
Ni = 6.5 cm3/mol (Ref. Reference Miedema, De Chatel and De Boer30 and Reference Miedema31)]. The enthalpy change
Reference Miedema, De Chatel and De Boer30,Reference Liu, Su, Xu, Luo, Guo and Fu32
and the ΔS
conf of the binary crystal system are defined as
 $$\Delta H_{{\rm{A}}\;{\rm{in}}\;{\rm{B}}}^{{\rm{interface}}} = {{2P{f_{\rm{A}}}\,V_{\rm{A}}^{{2 \mathord{\left/ {\vphantom {2 3}} \right. \kern-\nulldelimiterspace} 3}}} \over {n_{\rm{A}}^{{1 \mathord{\left/ {\vphantom {1 3}} \right. \kern-\nulldelimiterspace} 3}} + n_{\rm{B}}^{{1 \mathord{\left/ {\vphantom {1 3}} \right. \kern-\nulldelimiterspace} 3}}}}\left[ { - {{\left( {\Phi _{\rm{A}}^* - \Phi _{\rm{B}}^*} \right)}^2} + {Q \over P}{{\left( {n_{\rm{A}}^{{1 \mathord{\left/ {\vphantom {1 3}} \right. \kern-\nulldelimiterspace} 3}} + n_{\rm{B}}^{{1 \mathord{\left/ {\vphantom {1 3}} \right. \kern-\nulldelimiterspace} 3}}} \right)}^2} - {R \over P}} \right]\quad ,$$
 $$\Delta {S_{{\rm{conf}}}} = - R[x\ln (x) + (1 - x)\ln (1 - x)]\quad ,$$
where n
A and n
B are the electron density parameters (
 $n_{{\rm{Ti}}}^{{1 \mathord{\left/ {\vphantom {1 3}} \right. \kern-\nulldelimiterspace} 3}}$
= 1.47,
 $n_{{\rm{Ni}}}^{{1 \mathord{\left/ {\vphantom {1 3}} \right. \kern-\nulldelimiterspace} 3}}$
= 1.75) (Ref. Reference Miedema, De Chatel and De Boer30), which are the descriptions of the interface phenomena at an atomic scale. The parameters
 $\Phi _{\rm{A}}^*$
and
 $\Phi _{\rm{B}}^*$
are used to describe the ionicity in metals (
 $\Phi _{{\rm{Ti}}}^*$
= 3.65,
 $\Phi _{{\rm{Ni}}}^*$
= 5.20) (Refs. Reference Miedema, De Chatel and De Boer30 and Reference Miedema31). Q, R, and P are constants, and the values of Q/R, R/P, and P are 9.4, 1.9, and 12.35, respectively.
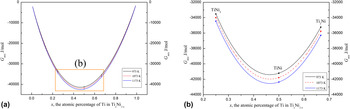
G mix is calculated from the above equations and the results are shown in Fig. 3. Figure 3(a) shows the variation of the value of mixing Gibbs energy with the atom percentage of Ti in Ti x Ni1−x . It can be easily observed that when the atom percentage of Ti is fixed, the mixing Gibbs energy of the Ti–Ni diffusion system decreases with the increasing of the heat treatment temperature. It can also be found that the G mix value decreases first and then increases when x is varied from 0.01 to 0.99 and falls to a minimum scope when the value of x is about 0.5. Figure 3(b) shows the G mix values of the three typical compounds TiNi3, TiNi, and Ti2Ni in the Ti–Ni diffusion system in detail. Obviously, the mixing Gibbs energy of the Ti–Ni diffusion system is the lowest when the formed compound is the TiNi with the x in the scope of 48.40–50.8, which indicates that the Ni/Ti/Ni laminar thin film can finally become the homogeneous TiNi alloy if the diffusion time is sufficient. This conclusion is in accordance with our experimental results as shown in Fig. 2.
The mixing Gibbs energy results of different solid solutions or compounds formed in the Ti/Ni diffusion system. The variable x is the atomic percentage of Ti in the new compounds and G mix is the mixing energy. (a) The x varied from 0.01 to 0.99 and (b) the x varied from 0.25 to 0.66.

B. Investigation of the formation sequence of the TiNi3, TiNi, and Ti2Ni in the Ti–Ni diffusion system by the thermodynamic analysis and experiment
1. Analysis of the formation sequence of the TiNi3, TiNi, and Ti2Ni by thermodynamic calculation
Based on the classical nucleation theory, the nucleation of a new phase involves the changes of the Gibbs free energies of reaction, ΔG f, and the interfacial energies, γ. When the elementary substances become a sort of compound, the Gibbs free energies of reaction ΔG f are always negative. And the bigger the absolute value of ΔG f is, the more easily the reaction can occur. The Gibbs free energies of reaction ΔG f as a function of T are Reference Barin, Sauert, Schultze-Rhonhof and Sheng33
 $$\Delta {G_{f,{\rm{AB}}}}(T) = {G_{{\rm{AB}}}}(T) - \sum {\left| {{\nu _{\varepsilon i}}} \right|} {G_{\varepsilon i}}(T)\quad ,$$
where νεi is the stoichiometric coefficient. The Gibbs free energies of the generated compounds G AB(T) and the Gibbs free energies of the reactive elements G εi (T) in Eq. (5) can be calculated by the following equations Reference Barin, Sauert, Schultze-Rhonhof and Sheng33 :
 $$G(T) = H(T) - TS(T)\quad ,$$
 $$H(T) = H(298.15) + \int_{298.15}^{{T_1}} {{C_{{\rm{P}}1}}} (T){\rm{d}}T + \Delta {H_{{T_1}}} + \int_{{T_1}}^{{T_2}} {{C_{{\rm{P}}2}}} (T){\rm{d}}T + \Delta {H_{{T_2}}} + \cdots \quad ,$$
 $$S\left( T \right) = S\left( {298.15} \right) + \int_{298.15}^{{T_1}} {{C_{{\rm{P}}1}}} {{\left( T \right)} \mathord{\left/ {\vphantom {{\left( T \right)} {T{\kern 1pt} {\rm{d}}T}}} \right. \kern-\nulldelimiterspace} {T{\kern 1pt} {\rm{d}}T}} + {{\Delta {H_{{T_1}}}} \mathord{\left/ {\vphantom {{\Delta {H_{{T_1}}}} T}} \right. \kern-\nulldelimiterspace} T} + \int_{{T_1}}^{{T_2}} {{C_{{\rm{P}}2}}} {{\left( T \right)} \mathord{\left/ {\vphantom {{\left( T \right)} {T{\kern 1pt} {\rm{d}}T}}} \right. \kern-\nulldelimiterspace} {T{\kern 1pt} {\rm{d}}T}} + {{\Delta {H_{{T_2}}}} \mathord{\left/ {\vphantom {{\Delta {H_{{T_2}}}} T}} \right. \kern-\nulldelimiterspace} T} + \cdots \quad . \cr}$$
In Eqs. (6)–(8), H(T) and S(T) are the enthalpy and entropy of the elements or compounds, respectively. C P, the heat capacity, is also a function of temperature, which can be described by the following polynomial over a relatively wide range of temperatures. Reference Barin, Sauert, Schultze-Rhonhof and Sheng33
 $${C_{\rm{P}}} = a + b \times {10^{ - 3}}T + c \times {10^5}{T^{ - 2}} + d \times {10^{ - 6}}{T^2}\quad ,$$
where a, b, c, and d are constants obtained in the thermochemical data of pure substances (II). Reference Barin, Sauert, Schultze-Rhonhof and Sheng33
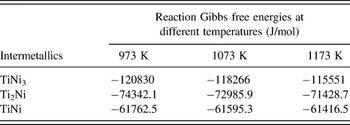
During the diffusing, the possible reactions in the Ti–Ni system are Ti + 3Ni = TiNi3, 2Ti + Ni = Ti2Ni, and Ti + Ni = TiNi according to the Ti–Ni phase diagram. The calculated values of the Gibbs free energies of reaction by Eqs. (5)–(9) are listed in Table II at 973, 1073, and 1173 K. Obviously, the Gibbs free energies of reaction of the three intermediate compounds are different enormously and the ΔG f values of TiNi3 and Ti2Ni are smaller than that of TiNi. From the above calculations, it is indicated that the occurrences of the reactions Ti + 3Ni = TiNi3 and 2Ti + Ni = Ti2Ni are much easier than that of Ti + Ni = TiNi. So according to the calculation of Gibbs free energies, the formation sequence of the intermediate phases could be TiNi3, Ti2Ni, and TiNi.
The reaction Gibbs free energies of TiNi3, Ti2Ni and TiNi.

Although ΔG f allows an immediate assessment of the stability of the substance, it is still insufficient to decide the formation sequence of the phases. Therefore, the interfacial energy, which plays a decisive role in the early stage of nucleation, is proposed.
Generally, the new phase with the smallest increasing interface energy will nucleate more easily. The calculations of the increasing interface energy involve the surface energies of new phases (γAB) and initial substances (γ i , i = A or B), the interfacial energy of the initial A/B interface (γA–B), and the interfacial energies of the new interface A/AB or B/AB (γA–AB or γB–AB). In the present research, the AB can be TiNi3, TiNi, or Ti2Ni. An empirical expression for the surface energies of the substances is given by Reference Spaepen and Meyer34
 $${\gamma _{\rm{A}}}\left( {{T_1}} \right) = {{{{\left( {{\gamma _{\rm{A}}}V_{\rm{A}}^{{2 \mathord{\left/ {\vphantom {2 3}} \right. \kern-\nulldelimiterspace} 3}}} \right)}^{T = 0}} + {b_{\rm{A}}}{T_1}} \over {{{\left( {V_{\rm{A}}^{{2 \mathord{\left/ {\vphantom {2 3}} \right. \kern-\nulldelimiterspace} 3}}} \right)}^{T = {T_1}}}}}\quad ,$$
where
 $\gamma _{\rm{A}}^{T = 0}$
is the surface energy at T = 0 K which can be estimated by the enthalpy for evaporation of one mole atoms divided by the atomic surfaces of one mole atoms; b
A [b
Ti = −0.47 × 10⁻⁷ J/K, b
Ni = −0.73 × 10⁻⁷ J/K (Ref. Reference Benedictus, Böttger and Mittemeijer25)] is a material constant and V
A is the molar volume of Ti or Ni. The surface energy of the compounds can be calculated by
Reference Benedictus, Böttger and Mittemeijer25,Reference Liu, Su, Xu, Luo, Guo and Fu32
 $${\gamma _{{\rm{AB}}}} = C_{\rm{A}}^{\rm{S}}{\gamma _{\rm{A}}} + C_{\rm{B}}^{\rm{S}}{\gamma _{\rm{B}}} - C_{\rm{A}}^{\rm{S}}C_{\rm{B}}^{\rm{S}}{{\Delta H_{{\rm{A}}\;{\rm{in}}\;{\rm{B}}}^{{\rm{interface}}}} \over {{C_0}V_{\rm{A}}^{2/3}}}\quad ,$$
where
 $C_{\rm{A}}^{\rm{S}}$
and
 $C_{\rm{B}}^{\rm{S}}$
are the volume fractions of A and B, and
 $\Delta H_{{\rm{A}}\;{\rm{in}}\;{\rm{B}}}^{{\rm{interface}}}$
is the enthalpy change upon solution of one mole of A in B mentioned in Eqs. (2) and (3). C
0 is a constant depending on the shape of the Wigner–Seitz cell of the A atoms and can be taken, on average, as ≈ 4.5 × 10⁸ (Ref. Reference De Boer, Boom, Mattens, Miedema and Niessen29). The energy of an interface, γA–B, between a solid phase A and a solid phase B contains two contributions
 $\gamma _{{\rm{A}}-{\rm{B}}}^{{\rm{mismatch}}}$
and
 $\gamma _{{\rm{A}}-{\rm{B}}}^{{\rm{interaction}}}$
(Refs. Reference Benedictus, Böttger and Mittemeijer25 and Reference Ewing35); thus the energy of an A–B interface is given as
 $${\gamma _{{\rm{A}}-{\rm{B}}}} = \gamma _{{\rm{A}}-{\rm{B}}}^{{\rm{mismatch}}} + \gamma _{{\rm{A}}-{\rm{B}}}^{{\rm{interaction}}} = {1 \over 3}\left( {{{{\gamma _{\rm{A}}} + {\gamma _{\rm{B}}}} \over 2}} \right) + {{\Delta H_{{\rm{A}}\;{\rm{in}}\;{\rm{B}}}^{{\rm{interface}}}} \over {{C_0}\,V_{\rm{A}}^{{2 \mathord{\left/ {\vphantom {2 3}} \right. \kern-\nulldelimiterspace} 3}}}}\quad ,$$
where
 $\gamma _{{\rm{A}}-{\rm{B}}}^{{\rm{mismatch}}}$
is related to the strain due to the mismatch at the interface between the two kinds of lattices and
 $\gamma _{{\rm{A}}-{\rm{B}}}^{{\rm{interaction}}}$
is related to the chemical interaction between A and B. Similarly, γA–AB and γB–AB can be defined as
 $${\gamma _{{\rm{A}}-{\rm{AB}}}} = {1 \over 3}\left( {{{{\gamma _{\rm{A}}} + {\gamma _{{\rm{AB}}}}} \over 2}} \right) + {{C_{\rm{B}}^{\rm{S}}\Delta H_{{\rm{A}}\;{\rm{in}}\;{\rm{B}}}^{{\rm{interface}}}} \over {{C_0}\,V_{\rm{A}}^{{2 \mathord{\left/ {\vphantom {2 3}} \right. \kern-\nulldelimiterspace} 3}}}}\quad ,$$
 $${\gamma _{{\rm{B}}-{\rm{AB}}}} = {1 \over 3}\left( {{{{\gamma _{\rm{B}}} + {\gamma _{{\rm{AB}}}}} \over 2}} \right) + {{C_{\rm{A}}^{\rm{S}}\Delta H_{{\rm{B}}\;{\rm{in}}\;{\rm{A}}}^{{\rm{interface}}}} \over {{C_0}V_{\rm{B}}^{{2 \mathord{\left/ {\vphantom {2 3}} \right. \kern-\nulldelimiterspace} 3}}}}\quad .$$
The increasing interface energies of TiNi3, Ti2Ni, and TiNi are listed in Table III according to Eqs. (2) and (3) and Eqs. (10)–(14). It can be concluded that the formation of the TiNi3 phase has the smallest increasing interface energy, which indicates that TiNi3 has the highest possibility to nucleate first.
The increasing interface energies of TiNi3, Ti2Ni, and TiNi.

The formation sequence of the second phase also depends on the x crit, reported by Gösele and Tu. Reference Gosele and Tu36 The parameter x crit is the critical thickness of the first intermetallic phase in any diffusion system. In the binary (transition) metal–metal system, two main possibilities exist if the supplied substances A (Ti) and B (Ni) are limited (such as the specimens in the present research). One possibility is that x f (the thickness of the reaction layers) < x crit when A or B is consumed, then the second intermetallic compound will nucleate and grow with the first intermetallic compound shrinking. The other possibility is if x f ≥ x crit before A or B is consumed, then the second compound will nucleate and grow, and at the same time, the first phase will grow continually. Reference Gosele and Tu36 From the experimental results of Hinotani and Ohmori Reference Hinotani and Ohmori37 and Garay, Reference Garay, Anselmi-Tamburini and Munir23 three compounds appeared in the Ti–Ni diffusion system and their total thickness was less than 50 µm. Therefore, the diffusion of the Ni/Ti/Ni thin film in this research with a thickness of 50 µm belongs to the second case, namely, before A or B is consumed, the thickness of the first phase x f is higher than the critical thickness and the second compound forms with the first phase growing continually. According to the discussion of the interfacial energies theory mentioned above, TiNi3 has been confirmed to appear first in the diffusion process. So the second phase could be Ti2Ni or TiNi.
After the formation of the TiNi3 phase, the new interfaces of Ti/TiNi3 and TiNi3/Ni are different from the original interface of Ti/Ni. However, the Benedictus′ equations cannot be used because the increasing interface energies theory is not suitable for explaining the formation sequence of the second phase. Although a normal equation or model to explain the formation sequence of the second phase is not established, Bastin Reference Bastin and Rieck21 found that the presence of the TiNi layer caused a strong decrease in the growth rate of Ti2Ni and Zhou Reference Zhou, Wang, Sun and Han38 also reported that the TiNi layer grew by consuming the TiNi3 and Ti2Ni layers. From their reports, it can be summarized that the nucleation and growth of the TiNi layer depend on the TiNi3 and Ti2Ni layers. It is indicated that the nucleation of the TiNi3 and Ti2Ni occurs earlier than that of TiNi. So the formation sequence of the three intermetallic compounds could be TiNi3, Ti2Ni, and TiNi.
In addition, the increasing interface energy of TiNi3 is 2.06 mJ higher than that of Ti2Ni by an analysis of the data in Table III. And the increasing interface energy of TiNi is 9.60 mJ higher than that of Ti2Ni and 11.95 mJ higher than that of TiNi3. The difference in the increasing interface energy of TiNi3 and Ti2Ni is only 2 mJ, which is too small to determine the formation sequence of TiNi3 and Ti2Ni. Although the increasing interface energy of TiNi is also a little higher than that of TiNi3 and Ti2Ni, the TiNi compound is nucleated after the TiNi3 and Ti2Ni because the nucleation and growth of TiNi depend on the formation of TiNi3 and Ti2Ni layers based on the x crit theory. In conclusion, there is another possibility about the formation sequence in the Ti–Ni diffusion system that the TiNi3 and Ti2Ni nucleate first and then the TiNi nucleates.
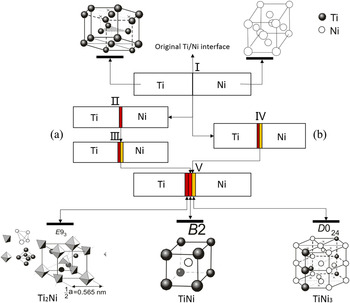
Figure 4 shows the two possibilities of the formation sequence with a schematic diagram based on the thermodynamic analysis. The yellow zone is the formed TiNi3 phase, of which the lattice of TiNi3 is the same with α-Ti, but the Ti2Ni has a complex face-centered cubic structure with 96 atoms per unit cell, Reference Taylor and Floyd39,Reference Yurko, Barton and Parr40 denoted as the dark red zone. The TiNi (designated as the shiny red zone) has a complex crystal structure which has three different phases, “austenitic” phase (B2 structure), Reference Li, Cui, Shi and Yang28 middle phase (rhombohedron), Reference Otsuka and Ren41 and “martensite” phase (monoclinic B19′-type structure). Reference Fukuda, Kakeshita, Houjoh, Shiraishi and Saburi42 One of the possibilities of the phase formation sequence shown in Fig. 4 is TiNi3 → Ti2Ni → TiNi, as the interfacial evolution of I → II → III → V shown. Symbols I and II represent the original Ti/Ni interface and the interface only with TiNi3 formed, respectively. Symbol III is the interface with Ti2Ni formed between TiNi3 and Ti and V is the interface with three compounds. The other possibility of the phase formation sequence is I → IV → V, in which the IV interface is different from the III interface. The symbol IV shows that the interface with TiNi3 and Ti2Ni forms almost simultaneously.
Two possibilities about the formation sequence of the intermetallics based on the thermodynamic analysis. (a) TiNi3 → Ti2Ni → TiNi and (b) TiNi3 and Ti2Ni → TiNi.

2. The formation sequence of TiNi3, TiNi, and Ti2Ni in Ti/Ni diffusion system by the experimental results
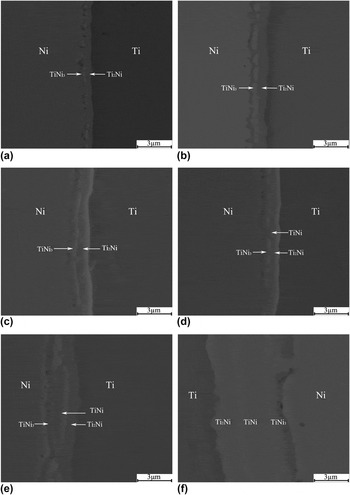
Figure 5 shows the diffusion interfaces with different annealing times of the Ni/Ti/Ni thin films at 973 K. Before heat treatment, no intermetallic compound nucleates at the Ti/Ni original interface, as shown in Fig. 2(a). However, two intermetallic layers form at the interface of Ti/Ni with 120 s annealing time at 973 K, as shown in Fig. 5(a). The intermetallic layer next to the Ni layer is TiNi3 and the intermetallic layer next to the Ti layer is Ti2Ni. Reference Wei and Lin27 Figures 5(b) and 5(c) display the interfacial morphology of the Ti/Ni diffusion zone with 300 and 600 s annealing time at 973 K, respectively, which has no obvious change except for the increasing thickness of TiNi3 and Ti2Ni compared with the interfacial morphology in Fig. 5(a). Figure 5(d) shows the interfacial morphology of another area in the Ti/Ni diffusion zone with 600 s annealing time at 973 K; it can be seen that a new phase begins to nucleate between the TiNi3 layer and the Ti2Ni layer, compared with Figs. 5(a)–5(c). And the new phase is the TiNi compound according to the result of EDS. The intermetallic TiNi grows sharply with the increasing annealing time but it still cannot form a coherent and separate TiNi layer with an annealing time of 2400 s at 973 K, as shown in Fig. 5(e), whereas all the three intermetallic layers appear when the diffusional time is 6000 s, as shown in Fig. 5(f). The above experimental results indicate that the nucleation of TiNi is later than that of TiNi3 and Ti2Ni, which is in accordance with the calculation results of the Gibbs free energies of reaction and the increasing interface energies. However, the formation sequence of TiNi3 and Ti2Ni is complex. Combined with the experimental results and the calculation results of the increasing interface energies of TiNi3 and Ti2Ni, it is concluded that the nucleation of TiNi3 and Ti2Ni occurs almost at the same time, or the difference between the nucleation time of TiNi3 and Ti2Ni is too small to be distinguished because both TiNi3 and Ti2Ni appear within only 120 s annealing time. The growth rates of TiNi3 and Ti2Ni are concerned with the diffusivity of Ti and Ni before the TiNi forms and the diffusivity of Ni in Ti is higher than that of Ti in Ni Reference Massalski and Kacprzak20 , so the growth rate of Ti2Ni is faster than that of TiNi3 before the nucleation of TiNi, as shown in Figs. 5(a) and 5(b). The growth rates of TiNi3 and Ti2Ni are also influenced by the consumption of TiNi3 and Ti2Ni when the TiNi phase begins to nucleate. The thickness of TiNi and Ti2Ni excluding TiNi3 is considered to grow according to the parabolic law Reference Spaepen and Meyer34 that the square of the intermetallic layer thickness shows a linear dependence on the annealing time. Besides, the pores observed at the TiNi3/Ni interface in Fig. 5 is caused by the Kirkendall effect, which is a result of the significant differences in the atomic size and diffusion coefficient of Ti and Ni. Reference Bahmanpour, Sun, Hu, Zhang, Wongsa-Ngam, Langdon and Lavernia43
SEM images of the diffusion interfacial morphology of Ti/Ni thin films annealed at 973 K for different times. (a) 120 s; (b) 300 s; (c) and (d) 600 s; (e) 2400 s; and (f) 3600 s.

IV. CONCLUSIONS
In this paper, TiNi thin films are prepared by the diffusion technology at various diffusion temperatures and times. In terms of the theory of mixing Gibbs free energy and the experimental results, the 1173 K is selected as the appropriate temperature to prepare homogeneous TiNi thin films. And the homogeneous TiNi thin film with a thickness of approximately 50 μm is obtained by 4 h diffusion at 1173 K. For the Ti–Ni diffusion couples, three main intermetallic compounds form in the process of diffusion and the intermetallic compounds from the Ti layer to the Ni layer are TiNi3, TiNi, and Ti2Ni, respectively. For better investigation of the behavior of the interdiffusion between the Ti and Ni atoms, the formation sequence of the three intermetallic compounds is theoretically analyzed by the Gibbs free energy of reaction theory and the interfacial energy theory. The increasing interface energies of TiNi3 and Ti2Ni are higher than that of TiNi and a little difference exists between the increasing interface energies of TiNi3 and Ti2Ni. So it can be concluded that TiNi3 and Ti2Ni nucleate first and then the TiNi nucleates in the Ti–Ni diffusion system. The experimental analysis of the morphology of the Ti/Ni diffusion zone obviously shows that the TiNi3 and Ti2Ni nucleate earlier than the TiNi and the nucleation sequence of TiNi3 and Ti2Ni cannot be distinguished within 120 s, which is in accordance with the thermodynamic analysis results.
ACKNOWLEDGMENTS
We would like to acknowledge the financial support provided by the National Nature Science Foundation of China under Grant No. 51371114, the 973 Program under Grant No. 2012CB619600, the China Postdoctoral Science Foundation under Grant No. 14Z102060027, and the Shanghai Postdoctoral Sustentation Fund under Grant No. 14R21410900.