I. Introduction
The theoretical relationship between corporate tax rates and leverage is well established (Modigliani and Miller (Reference Modigliani and Miller1963), Kraus and Litzenberger (Reference Kraus and Litzenberger1973)). However, empirical evidence shows a weaker relationship than expected based on theory (Graham (Reference Graham2006), Hanlon and Heitzman (Reference Hanlon and Heitzman2010)). The literature has attempted to reconcile this discrepancy by suggesting that the expected tax benefits of debt diminish when taxable profit can be negative in certain states of the world (DeAngelo and Masulis (Reference DeAngelo and Masulis1980)). Even when this factor is taken into account, the empirical relationship between corporate tax rates and leverage remains modest (Graham (Reference Graham1996), (Reference Graham2000), (Reference Graham2006), Hanlon and Heitzman (Reference Hanlon and Heitzman2010)).
I propose that companies actively pursue strategies to reduce taxable profit without relying on debt (non-debt tax avoidance), which increases the number of states of the world in which taxable profit is negative, thereby reducing the value of debt tax shields. Since each taxable euro can only be avoided once, greater non-debt tax avoidance crowds out debt-based tax avoidance. Therefore, non-debt tax avoidance and the debt tax shield can act as substitutes. Given the size of total non-debt tax avoidance, this effect can be sizable (Cobham and Janský (Reference Cobham and Janský2018), Bilicka (Reference Bilicka2019)).
The difficulty in showing the role of non-debt tax avoidance in determining the benefits of the tax shield is the measurement of tax avoidance. Although firms around the world can engage in tax avoidance strategies, these can be difficult to identify. Therefore, I exploit a setting in which tax avoidance is observable. I use the methodology of Huizinga and Laeven (Reference Huizinga and Laeven2008) to determine the incentives of multinational corporate groups to shift profits away from group members in high-tax jurisdictions, toward those in low-tax jurisdictions. I use this incentive-to-shift to estimate the profit shifted by a large sample of European multinationals. I then use these estimates to show that more profit shifted out of a country (outbound profit shifting) is associated with lower leverage in that country, while more profit shifted into a country (inbound profit shifting) is associated with higher leverage in that country.
According to trade-off theory, firms in high-tax countries should have the highest leverage. However, in high-tax countries, the benefit of non-debt tax avoidance is also the highest. In the context of a multinational group, group members located in a high-tax country have strong incentives for outbound profit shifting. This lowers taxable profit in the high-tax country, relative to the situation without non-debt tax avoidance. As a result of this reduction in taxable profits, there will be more states of the world in which taxable profit will be negative. Therefore, using a debt tax shield has less value, as there are more states of the world in which the company cannot benefit from the tax deduction on interest. Similarly, the multinational group’s firms located in low-tax countries have low incentives for taking on leverage based on trade-off theory, but will receive the inbound profit shifting. This results in fewer states of the world in which profit is negative. This increases the value of the debt tax shield. Consequently, the relationship between tax rates and leverage is expected to be stronger for inbound profit shifters than for outbound profit shifters, suggesting that the impact of tax rates on leverage depends on the extent of profit shifting.
For highly taxed firms, trade-off theory predicts higher leverage to reduce taxes by using the interest shield. However, I argue that non-debt tax avoidance crowds out the debt tax shield. The benefits of non-debt tax avoidance should be strong for high-taxed companies, and weak for low-taxed companies. As a result of these opposing effects of high tax rates, a test of trade-off theory that ignores non-debt tax avoidance can yield the weak results observed in the literature (Graham (Reference Graham2006), Hanlon and Heitzman (Reference Hanlon and Heitzman2010)). This is particularly important if the incentive for non-debt tax avoidance dominates the trade-off theory effect, since in that case the relationship between tax rates and leverage could even be negative. In this article, I show that the effect of tax rates on leverage is strong once I take into account the tax avoidance effect.
To examine how profit shifting affects the relationship between tax rates and leverage, I estimate this relationship across different quartiles of the profit shifting distribution. For firms in the top quartile of outbound profit shifters, the relationship between the tax rate and leverage is negative, indicating that profit shifting incentives outweigh the benefits of leverage. For firms in the top quartile of inbound profit shifters, the relationship between the tax rate and leverage is strongly positive. Due to this heterogeneity, testing trade-off theory across firms with varying levels of profit shifting would produce a weak relationship between tax rates and leverage, seemingly contradicting trade-off theory.
Moreover, different multinationals are located in different localities, which means that a firm in a country might be an inbound profit shifter for a given multinational group, while a different firm in the same country is an outbound profit shifter for a different multinational group. Therefore, for some firms in a country, the relationship between leverage and tax rates will be considerably stronger than for other firms in the same country. Failing to take into account this heterogeneity in tax avoidance creates noise in the estimates.
To show a causal link between non-debt tax avoidance and leverage, I use an exogenous shock to tax avoidance opportunities caused by a ruling of the European Court of Justice. The shock resulted from a European Court of Justice ruling that struck down anti-tax avoidance laws in several European countries for violating EU law. As a result, multinationals in affected countries found it easier to shift profits to low-tax jurisdictions. Comparing low-taxed subsidiaries of affected and unaffected multinationals, I find that affected subsidiaries experienced a rise in inbound profit shifting after the ruling. The increase in inbound profit shifting should result in an increase in leverage, and this is what I find.
To extend the analysis and ensure robustness, I perform several additional tests. I ensure that the results are not driven by changes to legislation specifically targeting debt-based tax avoidance (Chase-Dunn, Kawano, and Brewer (Reference Chase-Dunn, Kawano and Brewer2000), Buettner, Overesch, Schreiber, and Wamser (Reference Buettner, Overesch, Schreiber and Wamser2012), Panier, Pérez-González, and Villanueva (Reference Panier, Pérez-González and Villanueva2013), and Blouin, Huizinga, Laeven, and Nicodeme (Reference Blouin, Huizinga, Laeven and Nicodeme2014)), by excluding companies from countries that introduced such rules. A different concern could be that companies lobby for tax avoidance opportunities or tax rate changes. Based on insights from Hill, Kelly, Lockhart, and Van Ness (Reference Hill, Kelly, Lockhart and Van Ness2013) and Neretina (Reference Neretina2020), I exclude companies most prone to lobbying and show that this does not qualitatively change the results. Lastly, I ensure that the results are not driven by endogenous entry into low-tax countries by excluding any companies not present at the start of my sample.
This article contributes to several strands of literature. First, the literature on taxes and capital structure has focused on the effects of tax rate changes (Rajan and Zingales (Reference Rajan and Zingales1995), Graham (Reference Graham2000), Huizinga, Laeven, and Nicodeme (Reference Huizinga, Laeven and Nicodeme2008), Faulkender and Smith (Reference Faulkender and Smith2014), and Heider and Ljungqvist (Reference Heider and Ljungqvist2015)) and the introduction of rules specifically targeting the use of debt for tax avoidance (Buettner et al. (Reference Buettner, Overesch, Schreiber and Wamser2012), Panier et al. (Reference Panier, Pérez-González and Villanueva2013)). I show that failing to take into account tax avoidance will result in the effect of tax rates on leverage to be underestimated. This means that even if we see an exogenous change to tax rates, the effect on leverage will be underestimated if we do not account for tax avoidance.
Second, Graham and Tucker (Reference Graham and Tucker2006) show for a sample of 44 companies, which were caught and punished for tax evasion, that tax-evading companies have lower average debt than comparable companies. In contrast, I demonstrate that tax avoidance can influence firm leverage within a corporate group in both positive and negative directions. While the leverage will be lower for some of the firms making up a multinational, in other firms in the same multinational, leverage will, in fact, be higher than we would have otherwise expected. Furthermore, I show how tax avoidance heterogeneously affects the predictions of trade-off theory. Importantly, I provide evidence that the relationship between non-debt tax avoidance and leverage is causal. Lastly, I show that this trade-off between different methods of reducing the taxable profit is not unique to companies engaged in illegal activities, but is observable across a broad sample of firms. Contrary to Graham and Tucker (Reference Graham and Tucker2006), I do not find evidence for changes in leverage in the lead-up to tax-lowering activities.
II. Hypothesis and Methodology
A. Prior Literature
Modigliani and Miller (Reference Modigliani and Miller1963) showed that there are benefits to higher leverage as a result of tax policies. Most countries allow interest payments to be deducted from income, while similar deductions are not allowed on payments to equity holders. Empirically, the effect of tax rates on leverage seems small (Graham (Reference Graham1996), (Reference Graham2000), (Reference Graham2006), Hanlon and Heitzman (Reference Hanlon and Heitzman2010)).
DeAngelo and Masulis (Reference DeAngelo and Masulis1980) theoretically show that when there are non-debt tax shields, it can reduce the tax benefits of debt. Companies have to decide on their non-debt tax shields and tax shields without knowing what the state of the world will be. An increase in non-debt tax shields decreases taxable profit, which leads to more states of the world in which this profit is negative. Since governments do not credit taxes when profits are negative, any additional deductions from taxable profits do not generate a tax benefit. Therefore, the value of the debt tax shield decreases when a company has non-debt tax shields. This means that non-debt tax shields can crowd out the debt tax shield. While this effect can be mitigated by the ability for companies to carry losses forward to future years, the value of the tax shield still declines due to the time value of money.Footnote 1 Moreover, unless the number of bad states of the world declines in the following year, they once again will in expectation not benefit from the debt tax shield. This suggests that in the long run, maintaining levels of non-debt tax avoidance and a debt tax shield that creates many states of the world with negative profits is not beneficial.
Cobham and Janský (Reference Cobham and Janský2018) show that worldwide tax avoidance benefits exceed half a trillion. While little is known about the choice of tax avoidance method, every taxed euro can only be avoided once. Huizinga and Laeven (Reference Huizinga and Laeven2008) show that multinationals avoid taxes by shifting profits from high-tax firms to low-tax firms within their corporate structure.
B. Hypotheses
I predict that when more profit is shifted out of a country, there will be more states of the world in which taxable profit is negative. Since there are now more states of the world in which there is no benefit to be gained from the debt tax shield, the expected value of the debt tax shield is lowered, relative to a world without non-debt tax avoidance. The reduction in the value of the debt tax shield results in lower leverage.
Huizinga and Laeven (Reference Huizinga and Laeven2008) show that while profit is shifted out of the high-tax countries, it is shifted into low-tax countries. This results in a reduction in taxable profit in high-tax countries, while increasing taxable profit in low-tax countries. Therefore, profit shifting leads to more states of the world with negative profit for high-taxed companies. This reduces the benefit of the debt tax shield and, therefore, results in lower leverage, relative to a world without profit shifting.
Hypothesis 1. Non-debt tax avoidance crowds out the debt tax shield.
However, it simultaneously leads to fewer states of the world with negative profit for low-taxed companies, since the profit is moved into these companies. Therefore, the benefits of the tax shield increase in the low-taxed company.
Hypothesis 2. The relationship between tax rates and leverage is stronger for inbound profit-shifting companies.
Since Huizinga and Laeven (Reference Huizinga and Laeven2008) predict that high-taxed companies shift profit out, and low-taxed companies shift profit in, Hypotheses 1 and 2 contrast strongly with the predictions of trade-off theory (Modigliani and Miller (Reference Modigliani and Miller1963), Kraus and Litzenberger (Reference Kraus and Litzenberger1973)). The outbound profit shifting by high-taxed companies will reduce their taxable profit, lowering the value of the debt tax shield in exactly those countries in which trade-off theory predicts it to be high. The inbound profit shifting in the low-taxed companies increases the taxable profit, increasing the value of the debt tax shield, in the countries’ trade-off theory, which predicts this value to be low. Therefore, when testing trade-off theory on a broad sample of firms, we underestimate the effect of tax rates on leverage in the presence of non-debt tax avoidance. Once adequately taking into account the role of non-debt tax avoidance, the relationship between debt and tax rates should be stronger.
C. Empirical Strategy
1. Profit Shifting
In order to determine the effect of tax avoidance on leverage, I first need to identify tax avoidance. Tax avoidance is hard to observe, but multinational’s profit shifting is largely observable. Therefore, I use multinationals in this article.
I estimate profit shifting using the methodology from Huizinga and Laeven (Reference Huizinga and Laeven2008), who use an incentive-to-shift variable. The construction of this variable is discussed in the data section. In line with the literature, I indicate the incentive-to-shift with the letter “C” (Huizinga and Laeven (Reference Huizinga and Laeven2008)). A positive value of C indicates that the tax rate in that country is high, relative to tax rates faced by the same multinational group in the other countries it is active in. A negative value indicates that it wants to move profit into that country, because the tax rate is relatively low. Following Huizinga and Laeven (Reference Huizinga and Laeven2008), I use the natural logarithm of EBIT as a measure of profit shifted. This methodology will show the degree of profit shifting resulting from the incentive to shift, by using the following regression equation:

where “i” indicates the multinational group, “c” the country, and “t” the year. Control variables are similar to those used in Huizinga and Laeven (Reference Huizinga and Laeven2008), which include ln(labor costs), ln(fixed assets), interest rates, and ln(GDP per capita). Contrary to the usual industry fixed effects, I include a multinational fixed effect and year-fixed effects. This allows me to estimate how the differences in incentive-to-shift across the firms within the multinational’s group structure affect the profit shifted in the multinational. The coefficient of interest is
$ {\beta}_1 $
 . I expect a negative coefficient, which implies that profit is shifted out of firms that face relatively high-tax rates and into relatively low-taxed firms.
As a second method of determining profit shifting, I use an exogenous shock caused by a ruling of the European Court of Justice (2006). Schenkelberg (Reference Schenkelberg2018) shows that this ruling impacted profit shifting. This ruling was related to the so-called Controlled Foreign Company (CFC) rules. These rules impose an additional tax on profits made by foreign subsidiaries in low-tax countries. For instance, the U.K. government will tax profits made by an Irish subsidiary (12.5% tax rate) of an English parent (30% tax rate) with an additional 17.5% tax rate, but an Austrian subsidiary (25% tax rate) of the same parent will not face any additional tax. The purpose of these rules is to limit the benefits of shifting profit to low-tax countries. However, the European Court of Justice (2006) ruled that these CFC rules violate the free movement of capital in the EU. Therefore, EU countries can no longer apply these rules to subsidiaries in other EU countries.
I use a difference-in-difference approach to estimate the effect of the shock on profit shifting. The treated companies are the low-taxed EU subsidiaries of EU parent companies from countries with CFC rules. Denmark, Germany, Lithuania, Norway, Portugal, the United Kingdom, and Sweden had such rules in place.Footnote 2 I expect an increase in profit shifted into these low-taxed subsidiaries, as the CFC rules are now lifted. The European Court of Justice (2006) ruling only applies to relations between EU parent and EU subsidiaries; therefore, the control companies are subsidiaries in the same low-taxed EU countries but owned by parent companies from non-EU countries with CFC rules (Australia, Canada, Japan, New Zealand, the United States, and South Korea).
2. Leverage
Hypothesis 1 poses that non-debt tax avoidance crowds out leverage. Using the estimates for profit shifting, I employ two different methodologies to estimate the effect on leverage. First, I take the point estimates on the incentive-to-shift (
$ {\beta}_1 $
 in equation (1)) and multiply it by the value “C” that takes for that firm.
$ {\beta}_1 $
 is the within multinational estimate of the effect that “C” has on profit shifted. Multiplying this by “C” gives me the profit shifted by that multinational in and out of each country it operates in, which is unique to each firm in each multinational. I then estimate the effect of this profit shift on leverage. A positive value of profit shifted indicates that profit is shifted into the firm, while a negative value indicates profit was shifted out. Hypothesis 1 suggests that inbound profit shifting results in higher leverage, while outbound profit shifting results in lower leverage. Therefore, I expect a positive effect of the profit shift on leverage. I use the following regression equation:

where
$ c $
 indicates the country,
$ t $
 time, and
$ i $
 the multinational.
$ {\beta}_1 $
 captures the effect predicted in Hypothesis 1.
$ \mathbf{X} $
 is a vector of company-level control variables which includes tangibility, profitability, size, and depreciation (Rajan and Zingales (Reference Rajan and Zingales1995)).
$ \mathbf{Z} $
 is a vector of country-level controls, which includes the domestic corporate tax rates, ln(GDP per capita), and interest rates. I define leverage as interest-bearing debt over total assets. Following Faulkender and Smith (Reference Faulkender and Smith2014), I include year and multinational fixed effects to capture how within multinational differences in in- and outbound profit shifting affect leverage in the multinational. Moreover, Faulkender and Smith (Reference Faulkender and Smith2014) argue that both tax rates and variation in international operations are highly autocorrelated, making the use of multinational fixed effects preferable.Footnote 3 Standard errors are clustered at the multinational level, as tax avoidance decisions within a multinational are correlated (Huizinga et al. (Reference Huizinga, Laeven and Nicodeme2008)). I also use an alternative specification using bootstrapped errors clustered at the same level.
Second, I use the shock caused by the European Court of Justice (2006). The ruling made it easier to shift profit into low-tax subsidiaries. Hypothesis 1 suggests that this increase in inbound profit shifting should cause an increase in leverage. Therefore, I investigate the effect of the shock on leverage, expecting a positive coefficient.Footnote 4
Hypothesis 2 states that the relationship between leverage and tax rates is different for different levels of non-debt tax avoidance. Therefore, I split my sample into four groups based on the level of profit shifting obtained using equation (1). These are highest quartile inbound shifters, middle quartile inbound shifters, middle quartile outbound shifters, and highest quartile outbound shifters. I interact these categories with the domestic tax rate and estimate the effect of tax rates on leverage for the different subgroups.
As an additional test, I use one-off changes in tax rates to show how these changes impact inbound and outbound profit shifters differently. This is effectively a difference-in-difference approach, using tax rate changes as shocks. Firms in countries with a tax change are treated, while firms in countries without a tax change are control companies. Hypothesis 2 suggests that the change in tax rates should impact inbound profit-shifting companies more strongly than outbound profit-shifting companies.
III. Data and Summary Statistics
A. Accounting Data
In order to observe profit shifting, I map the group structure of a large sample of European multinationals.Footnote 5 One of the major benefits of using EU multinationals is that they are part of a common internal market in which the taxable effects of actions between parent and subsidiary firms are regulated by EU laws. This ensures uniform withholding taxes and double taxation rules for the companies in my sample.
Mapping the group structure and the profit shifting of these multinationals requires accounting and ownership data, which I obtain from the Orbis database. I use the historical files from Orbis and link every parent company to its subsidiaries, and each of those is then linked with its own subsidiaries, and so on (Kalemli-Ozcan, Sorensen, Villegas-Sanchez, Volosovych, and Yesiltas (Reference Kalemli-Ozcan, Sorensen, Villegas-Sanchez, Volosovych and Yesiltas2015)). The data set starts in 2005 and ends in 2011. The ownership data quality greatly improved from 2005 onward. Moreover, ending the sample in 2011 ensures that the period of high uncertainty about the future of profit shifting, caused by the OECD research committee on Base Erosion and Profit Shifting OECD (2014) is not included in the sample. Moreover, this period includes the shock caused by the European Court of Justice (2006), which will allow for a clean identification of the crowding out of debt by non-debt tax avoidance.
Following Huizinga and Laeven (Reference Huizinga and Laeven2008) and Brok (Reference Brok2024), I aggregate all accounting data at the multinational-country-year level to ensure that multinationals with many subsidiaries do not dominate the data sample.Footnote 6 Because I use this method of aggregation, I use unconsolidated accounts to observe profit being shifted within the multinational.
For the shock caused by the European Court of Justice (2006), the important unit of observation is the subsidiary of a treated or control parent. Therefore, a slightly different data set is used for the difference-in-difference estimates. This data set looks at the individual firms, rather than the data aggregated at the multinational-country level. This allows me to identify the particular low-taxed firms that have a parent in a country that had a CFC rule. To establish pre-trends, I add the year 2004 to the data.Footnote 7 Any firms not observed during the year of the shock and the two prior years are dropped from the sample. If a subsidiary has multiple parent companies, it is included in the treated group if one of those parents is from a treated country.
B. Variable Definition
The Huizinga and Laeven (Reference Huizinga and Laeven2008) measure of incentive-to-shift (“C”) is unique for each multinational-country-year observation and captures how high the domestic tax rate is relative to the foreign tax rates faced by that multinational. The authors define it as follows:

where
$ c $
 indicates the country,
$ t $
 time, and
$ i $
 the multinational. The measure is a sales-weighted average of tax differences within a multinational. C is positive for the firms that have an incentive to shift profit out and is negative for the firms that should receive that foreign profit.
Control variables are defined in Table 1.

TABLE 1 Long description
The table consists of three columns: Variable, Description, and Source.
1. Variable: l n ( E B I T ) sub i c t. Description: The natural logarithm of earnings before interest and taxes in the entity. Source: Orbis Database.
2. Variable: Leverage sub i c t. Description: Measures liabilities compared to total assets, calculated as the fraction: non-equity liabilities sub i c t minus non-interest carrying debt sub i c t, all over total assets sub i c t. Source: Orbis Database.
3. Variable: Tangibility sub i c t. Description: Measures tangible assets as a proxy for collateral, calculated as the fraction: tangible fixed assets sub i c t all over total assets sub i c t. Source: Orbis Database.
4. Variable: Depreciation sub i c t. Description: Normalized by sales to proxy non-debt tax shields, calculated as the fraction: depreciation sub i c t all over sales sub i c t. Source: Bureau van Dijk’s Orbis Database.
5. Variable: Size sub i c t. Description: The natural logarithm of total assets. Source: Orbis Database.
6. Variable: Profitability sub i c t. Description: Return on assets, calculated as the fraction: E B I T sub i c t all over total assets sub i c t. Source: Orbis Database.
7. Variable: Fixed assets sub i c t. Description: The natural logarithm of fixed assets. Source: Orbis Database.
8. Variable: Labor costs sub i c t. Description: The natural logarithm of labor costs. Source: Orbis Database.
9. Variable: Interest rates sub c t. Description: Country-level risk-free interest rate. Source: Thomson Reuters Datastream.
10. Variable: l n ( G D P capita ) sub c t. Description: Natural logarithm of the annual G D P per capita. Source: World Bank Data.
11. Variable: Domestic tax rate sub c t. Description: Marginal corporate tax rate. Source: E & Y Worldwide Corporate Tax Guide.
12. Variable: Incentive-to-shift sub i c t. Description: Used for profit shifting equations. Calculated as the fraction 1 over ( 1 minus Tax sub c t ) multiplied by a weighted average of tax differentials across all other entities k in the group. Source: E & Y Worldwide Corporate Tax Guide.
C. Summary Statistics
The variables used in this article are defined in Table 1. Table 2 shows the summary statistics for the two different samples. Panel A shows the statistics for the sample using the incentive-to-shift (Huizinga and Laeven (Reference Huizinga and Laeven2008) methodology for estimating profit shifting).

TABLE 2 Long description
The table contains six columns: Variable, No. of Obs., Mean, Std. Dev., Min, and Max.
Panel A. Incentive-to-Shift Sample (49,732 observations):
* Leverage: Mean 0.502, Std. Dev. 0.239, Min 0.013, Max 0.963.
* Domestic tax rate: Mean 0.304, Std. Dev. 0.068, Min 0.1, Max 0.406.
* C: Mean minus 0.022, Std. Dev. 0.083, Min minus 0.320, Max 0.483.
* Size: Mean 9.821, Std. Dev. 2.827, Min 4.403, Max 17.194.
* Tangibility: Mean 0.175, Std. Dev. 0.197, Min 0, Max 0.863.
* Depreciation: Mean 0.012, Std. Dev. 0.042, Min 0, Max 0.474.
* Profitability: Mean 0.109, Std. Dev. 0.108, Min 0.000, Max 0.549.
* l n (E B I T): Mean 7.087, Std. Dev. 2.830, Min 1.135, Max 15.048.
* l n (Fixed assets): Mean 7.786, Std. Dev. 3.663, Min 0, Max 16.596.
* l n (Labor costs): Mean 8.069, Std. Dev. 2.465, Min 2.890, Max 14.645.
Panel B. Shock Sample (10,246 observations, except for log variables which have 8,682):
* Leverage: Mean 0.333, Std. Dev. 0.253, Min 0.008, Max 0.985.
* Domestic tax rate: Mean 0.183, Std. Dev. 0.024, Min 0.125, Max 0.34.
* Size: Mean 8.290, Std. Dev. 1.568, Min 2.303, Max 10.405.
* Tangibility: Mean 0.284, Std. Dev. 0.244, Min 0, Max 0.929.
* Depreciation: Mean 0.040, Std. Dev. 0.063, Min 0, Max 0.479.
* Profitability: Mean 0.108, Std. Dev. 0.157, Min minus 0.378, Max 0.795.
* l n (E B I T): Mean 6.071, Std. Dev. 1.953, Min 0, Max 10.825.
* l n (Fixed assets): Mean 6.729, Std. Dev. 2.313, Min 0, Max 11.709.
* l n (Labor costs): Mean 6.711, Std. Dev. 1.625, Min 0.693, Max 11.311.
The incentive to shift is, on average, close to 0. This is by design, as the firms that make up a multinational have an incentive to shift profit to other firms in the same multinational.
The sample covering the shock created by the European Court of Justice (2006) ruling consists of companies that are smaller. This makes sense since this sample is not aggregated at the multinational-country-year level. Moreover, the tax rate faced by the companies in this sample is, on average, 12 percentage points lower. This can be explained by the fact that the shock exclusively affected subsidiaries in low-tax countries. Despite being located in low-tax countries, these companies are not just letterbox firms; they have 11 percentage points higher levels of tangibility compared to the incentive-to-shift sample.
IV. Results
To estimate the effect of profit shifting on leverage, I first need to estimate profit shifting. I capture profit shifting using the natural logarithm of EBIT. A multinational has an incentive to move profit from firms that are highly taxed, toward firms that have a lower tax rate. Therefore, a higher incentive to shift (“C”) should result in the multinational shifting profit out of that country and moving it to a country where the multinational has a negative incentive to shift.
Table 3 shows the results from equation (1). I find the expected negative coefficient on the incentive-to-shift variable. A 1-standard-deviation higher incentive-to-shift (0.083) is associated with 12.14% lower EBIT.

TABLE 3 Long description
The table presents results for a single regression model where the dependent variable is the natural log of E B I T.
Independent variables and their coefficients (with standard errors in parentheses) are as follows:
* Constant (C): minus 1.463 with three asterisks (0.124).
* Natural log of Fixed assets: 0.233 with three asterisks (0.007).
* Natural log of Labor costs: 0.649 with three asterisks (0.011).
* Natural log of G D P per capita: minus 0.101 with three asterisks (0.020).
* Interest rate: 0.013 (0.009).
Model summary statistics at the bottom include:
* Number of observations: 49,732.
* R-squared: 0.862.
* Year Fixed Effects (F E): Yes.
* Multinational Fixed Effects (F E): Yes.
Hypothesis 1 suggests that higher non-debt tax avoidance is associated with lower leverage. In Table 4, I investigate this hypothesis. Column 1 shows the effect of the tax rate on leverage without taking into account the crowding out of the debt tax shield. The literature finds a wide range of estimates for the marginal tax rate, usually weaker than theory would predict (Graham (Reference Graham2006), Hanlon and Heitzman (Reference Hanlon and Heitzman2010)). I find that there is no significant effect of the domestic tax rate on leverage.

TABLE 4 Long description
A table with three numbered columns (1, 2, 3) and several rows of variables.
* Profit shifted: Column 1 is blank; Columns 2 and 3 both show 0.124 with three asterisks and a standard error of 0.035.
* Domestic tax rate: Column 1 is 0.043 (0.035); Columns 2 and 3 are 0.292 with three asterisks (0.078 and 0.080 respectively).
* Size: All columns show 0.004 with three asterisks (0.001).
* Tangibility: All columns show minus 0.038 with three asterisks (0.009).
* Depreciation: Column 1 is minus 0.064 (0.041); Columns 2 and 3 are minus 0.063 (0.041 and 0.042 respectively).
* Profitability: All columns show minus 0.296 or minus 0.295 with three asterisks (0.014).
* l n (G D P per capita): Column 1 is 0.055 with three asterisks (0.003); Columns 2 and 3 are 0.053 with three asterisks (0.003 and 0.004 respectively).
* Interest: All columns show 0.016 or 0.017 with three asterisks (0.002).
* Number of observations: 49,732 for all columns.
* R-squared: 0.468 for all columns.
* Year F E and Multinational F E: Yes for all columns.
In columns 2 and 3 of Table 4, I turn to investigating Hypothesis 1. I use the point estimates from the regressions in Table 3 to estimate the profit shift for each company. Positive levels of profit shifted indicate profit being shifted into the country, whereas negative values indicate profit being shifted out of the country. Hypothesis 1 suggests that inbound profit shifted increases the capacity for debt tax shields. Firms shifting profits out face decreasing capacity for debt tax shields. This implies profit shift should have a positive coefficient. This is exactly what I find. In Table 3, I found that 1-standard-deviation lower incentive-to-shift was associated with 12.14% higher profit shifted. A 12.14% inbound (outbound) profit shift is associated with 1.5 percentage points higher (lower) leverage.
Moreover, the coefficient on the domestic tax rate suggests that ignoring the profit being shifted leads to biased estimates of the marginal tax rate. It can be seen that the domestic tax rate now is significant and increases in size by a factor of 6. The effect of a 1-standard-deviation higher tax rate (0.068) is 2 percentage points higher leverage when taking into account profit shifting. Whereas it was 0.3 percentage points when ignoring profit shift. This can help explain the weak effects of tax rates on leverage commonly found in the literature (Graham (Reference Graham2006), Hanlon and Heitzman (Reference Hanlon and Heitzman2010)).
In column 3, I use clustered bootstrapped standard errors from 2,500 samples.
A. Exogenous Shock
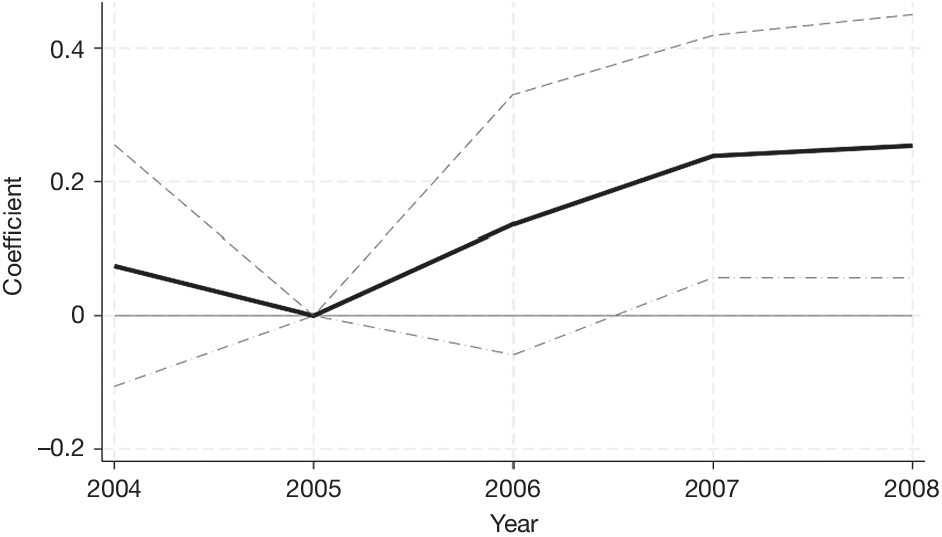
To rule out alternative explanations and establish a causal link, I turn to the European Court of Justice (2006) ruling. I expect that when the ruling made it easier to shift profits to low-tax subsidiaries, the EBIT in these low-tax subsidiaries goes up. First, I establish common trends before the shock, using the methodology suggested by Angrist and Pischke (Reference Angrist and Pischke2009). Figure 1 shows how being in the treated and control groups affects EBIT for each year before and after the shock. The treated firms are the low-tax subsidiaries of parent firms that were affected by the European Court of Justice (2006) ruling. The control group is the low-tax subsidiaries of parent firms from countries outside the EU, which had CFC rules but were unaffected by the ruling. We can see that the trends for the two groups are not significantly different before the shock happened in 2006.
Figure 1 shows the effect of being in the treated group over time. The y-axis shows the estimated coefficient of being in the treated group in a year on ln(EBIT). 2006 is the year of the shock; 2005 is used as the baseline. The dashed line indicates the 5% confidence interval.

FIGURE 1 Long description
The horizontal X-axis is labeled Year and ranges from 2004 to 2008. The vertical Y-axis is labeled Coefficient and ranges from negative 0.2 to 0.4. A solid black line represents the estimated coefficient. It starts at approximately 0.08 in 2004, drops to exactly 0 at the 2005 baseline, and then shows a positive linear increase to approximately 0.14 in 2006, 0.24 in 2007, and 0.26 in 2008. Two dashed grey lines represent the 5% confidence interval. These lines converge at the 2005 baseline point. After 2005, the upper dashed line rises sharply to 0.32 in 2006 and reaches approximately 0.45 by 2008. The lower dashed line remains below zero until 2007, where it crosses into positive territory, ending at approximately 0.06 in 2008.
Column 1 of Table 5 shows the treatment effect. As can be seen, the treated companies did see an increase in profit shifted into the low-tax subsidiaries. The shock resulted in a 17% increase in profit shifted to low-taxed subsidiaries. This is comparable to the effect of a 1.5-standard-deviation lower “C” found in Table 3. Since the average tax rate of the low-taxed subsidiaries is 12 percentage points (1.77 standard deviations) lower than the average tax rate in the incentive-to-shift sample, this is both qualitatively and quantitatively comparable to the results in Table 3.

TABLE 5 Long description
The table consists of three columns. Column 1 represents Profit Shifting and Column 2 represents Leverage.
Row-by-row data:
- Treatment: Column 1 is 0.171 with a standard error of 0.080; Column 2 is 0.031 with a standard error of 0.013.
- ln Fixed assets: Column 1 is 0.065 with a standard error of 0.027; Column 2 is empty.
- ln Labor cost: Column 1 is 0.453 with a standard error of 0.056; Column 2 is empty.
- Size: Column 1 is empty; Column 2 is 0.060 with a standard error of 0.008.
- Tangibility: Column 1 is empty; Column 2 is 0.065 with a standard error of 0.029.
- Depreciation: Column 1 is empty; Column 2 is minus 0.021 with a standard error of 0.089.
- Profitability: Column 1 is empty; Column 2 is minus 0.172 with a standard error of 0.019.
- ln G D P per capita: Column 1 is 0.626 with a standard error of 0.185; Column 2 is minus 0.074 with a standard error of 0.030.
- Interest rate: Column 1 is 0.095 with a standard error of 0.031; Column 2 is minus 0.006 with a standard error of 0.004.
- Number of observations: Column 1 is 8,682; Column 2 is 10,246.
- R-squared: Column 1 is 0.882; Column 2 is 0.825.
- Year F E: Yes for both columns.
- Parent-subsidiary F E: Yes for both columns.
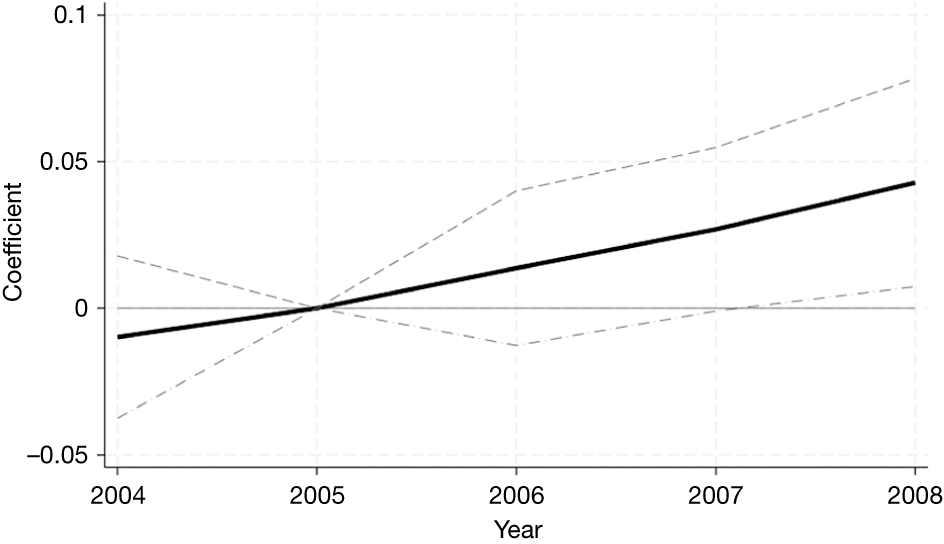
Next, I show that the same substitution between non-debt and debt-based tax avoidance as observed in Tables 3 and 4 is observed when the European Court of Justice (2006) ruling was issued. Figure 2 shows that there were no differences in trends between the control and treated groups before the shock. Column 2 of Table 5 shows that the shock results in a 3.1 percentage point increase in leverage for those subsidiaries. This shows that, in line with the findings in Table 3, an increase in inbound profit shifting results in an increase in leverage.
Figure 2 shows the effect of being in the treated group over time. The y-axis shows the estimated coefficient of being in the treated group in a year on Leverage. 2006 is the year of the shock; 2005 is used as the baseline. The dashed line indicates the 5% confidence interval.

FIGURE 2 Long description
The x-axis is labeled Year and ranges from 2004 to 2008 in yearly increments. The y-axis is labeled Coefficient and ranges from negative 0.05 to 0.1. A horizontal gray line marks the zero threshold.
Data points and trends:
* In 2004, the coefficient starts slightly below zero at approximately negative 0.01.
* In 2005, the baseline year, the coefficient is exactly 0 and the confidence interval converges to a single point.
* From 2006 to 2008, the coefficient shows a linear increase, rising to approximately 0.015 in 2006, 0.025 in 2007, and ending near 0.04 in 2008.
* The 5% confidence interval is represented by two dashed gray lines. The upper bound increases more sharply than the lower bound after 2005. By 2008, the upper bound reaches approximately 0.08 while the lower bound remains just above 0.
B. Implications for Trade-Off Theory
The literature has found an underreaction of leverage to marginal tax rates (Hanlon and Heitzman (Reference Hanlon and Heitzman2010), Graham (Reference Graham2006)). Table 4 column 1 confirms this result, showing a modest, insignificant coefficient on the effect of the domestic tax rate on leverage. However, including the amount of profit shifted significantly impacts the coefficient on the domestic tax rate. There are three compounding effects that result in this underestimation.
First, ignoring profit shifting results in an overestimation of the value of debt tax shields. Higher tax rates create a positive effect on leverage through the trade-off theory, but also create a higher incentive to shift. Hypothesis 1 suggests the resulting profit shifting is negatively related to leverage. In Table 6, I further investigate how profit shifting affects the relationship between corporate income tax rates and leverage. This is a direct test of Hypothesis 2, which states that the relationship between tax rates and leverage is stronger for inbound profit shifters than for outbound profit shifters. In order to test this hypothesis, I created dummies indicating the quartile of the profit shifting distribution a firm is part of. I then interact the domestic corporate income tax rate with these quartile dummies. The highest inbound profit shifters should show the strongest relationship between tax rates and leverage, whereas the highest outbound profit shifters should show the opposite.

TABLE 6 Long description
The table consists of three columns labeled 1, 2, and 3.
Key variables and their coefficients (standard errors in parentheses) include:
* Highest quartile outbound * domestic tax rate: -0.398*** (0.106) in columns 2 and 3.
* Domestic tax rate: 0.043 (0.035) in column 1; -0.135 (0.093) in column 2; -0.135 (0.092) in column 3.
* Middle quartile inbound * domestic tax rate: 0.477*** (0.092) in column 2; 0.477*** (0.091) in column 3.
* Highest quartile inbound * domestic tax rate: 0.543*** (0.108) in column 2; 0.543*** (0.109) in column 3.
* Highest quartile outbound: 0.121*** (0.037) in columns 2 and 3.
* Middle quartile inbound: -0.173*** (0.030) in columns 2 and 3.
* Highest quartile inbound: -0.182*** (0.034) in columns 2 and 3.
Control variables:
* Size: 0.004*** (0.001) in column 1; 0.003*** (0.001) in columns 2 and 3.
* Tangibility: -0.038*** (0.009) across all columns.
* Depreciation: -0.064 (0.041) in column 1; -0.059 (0.040) in column 2; -0.059 (0.042) in column 3.
* Profitability: -0.296*** (0.014) in column 1; -0.291*** (0.013) in columns 2 and 3.
* l n (G D P per capita): 0.055*** (0.003) in column 1; 0.042*** (0.004) in columns 2 and 3.
* Interest rate: 0.016*** (0.002) in column 1; 0.022*** (0.002) in columns 2 and 3.
Summary statistics:
* Number of observations: 49,732 for all columns.
* R-squared: 0.468 for column 1; 0.472 for columns 2 and 3.
* Year F E and Multinational F E are marked as Yes for all columns.
Table 6 columns 2 and 3 show the result. In line with the prediction, I find that inbound profit shifters have a significantly stronger relationship between tax rates and leverage than the sample average. On the other hand, the strongest outbound profit shifters show a small negative relationship between tax rates and leverage. The results suggest that for every 1 percentage point increase in tax rates, leverage goes up by 0.41 percentage points for the strongest inbound profit shifters. In Table 4, I found that the average effect was 0.004 percentage points when ignoring profit shifting, or 0.29 percentage points when taking into account profit shifting. Relative to the sample average, the relationship between tax rates and leverage is one-and-a-half times stronger for strong inbound shifters, but negative for the outbound shifters.
Second, the crowding out of debt tax shields is not the same for all firms in a multinational. The firms shifting out profit will see more debt being crowded out, but the firms shifting in profit will see less debt being crowded out. Therefore, the leverage of high “C” firms should be less sensitive to tax rates than the leverage of low “C” firms. In a naive regression of leverage on marginal tax rates (as in column 1 of Table 4), the estimated coefficient is an average of those for high and low “C” firms. This is particularly problematic considering that high “C” firms are high-taxed firms, which under trade-off theory should be the firms increasing their leverage the most.
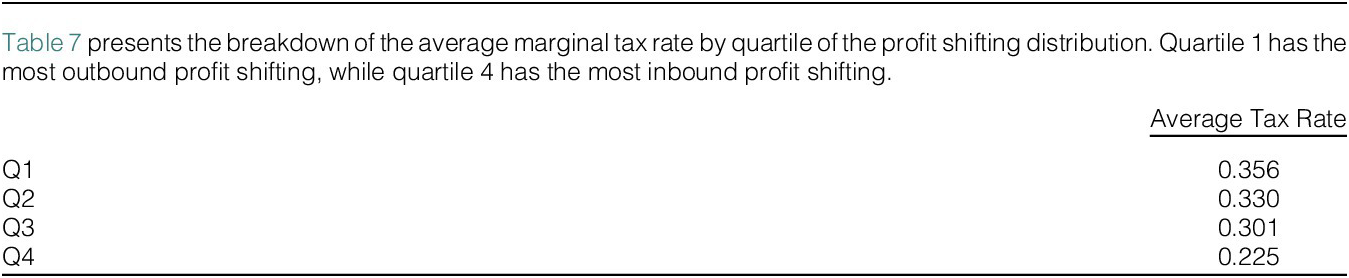
This problem can be illustrated by looking at the average tax rates of the profit-shifting quartiles. The average marginal tax rate in the quartile of highest outbound profit shifters is 35.6%, while the average marginal tax rate in the quartile of highest inbound profit shifters is 22.5% (Table 7). Therefore, the results in Table 6 suggest that the strongest relationship between tax rates and leverage is found for the companies with the lowest average marginal tax rates. This means that when there is non-debt tax avoidance, we expect the leverage of high-tax firms to be less responsive to tax rates than the leverage of low-tax firms, exactly the opposite of the predictions of trade-off theory (Modigliani and Miller (Reference Modigliani and Miller1963), Kraus and Litzenberger (Reference Kraus and Litzenberger1973)).

TABLE 7 Long description
The table consists of two columns. The first column lists the quartiles from Q 1 to Q 4. The second column is titled Average Tax Rate. The data is as follows. Q 1 has an average tax rate of 0.356. Q 2 has an average tax rate of 0.330. Q 3 has an average tax rate of 0.301. Q 4 has an average tax rate of 0.225. The data shows a steady decrease in the average tax rate as the quartile number increases.
Third, the definition of high- and low-tax firms is different for each multinational. A multinational with firms in Germany (41% tax rate) and Sweden (28% tax rate) obtains a benefit from shifting profit into Sweden. A multinational with firms in Sweden and Poland (19% tax rate) benefits from shifting profit out of Sweden. As a consequence, for the first multinational, the marginal tax rate in Sweden should strongly affect Swedish leverage, while for the second multinational, it should not. When averaging out these effects for a variety of multinationals, facing a variety of tax rates and opportunities for tax avoidance, the estimate will become noisy.
The importance of this point can be observed by looking at the prevalence of countries in each of the quartiles. Germany is in the high outbound quartile 76% of the time (Table 8). Hungary and Poland are both in the high inbound quartile more than 80% of the time. However, Belgium can be found in three quartiles with similar frequencies. This shows that firms in the same country can find themselves in different quartiles of the profit-shifting distribution.

TABLE 8 Long description
The table consists of six columns: Country, Q 1, Q 2, Q 3, Q 4, and Total.
* Austria: 28, 33, 96, 371, Total 528.
* Belgium: 1,173, 1,041, 1,451, 116, Total 3,781.
* Bulgaria: 0, 0, 13, 155, Total 168.
* Czech Republic: 55, 54, 184, 1,158, Total 1,451.
* Germany: 2,998, 770, 172, 9, Total 3,949.
* Denmark: 0, 2, 11, 3, Total 16.
* Estonia: 21, 27, 305, 311, Total 664.
* Spain: 1,891, 3,348, 2,174, 296, Total 7,709.
* Finland: 109, 214, 763, 665, Total 1,751.
* France: 2,227, 1,851, 1,362, 160, Total 5,600.
* Hungary: 23, 136, 183, 1,626, Total 1,968.
* Great Britain: 357, 673, 2,465, 1,531, Total 5,026.
* Ireland: 0, 2, 4, 46, Total 52.
* Italy: 2,822, 1,352, 434, 0, Total 4,608.
* Luxembourg: 12, 53, 161, 83, Total 309.
* Latvia: 0, 0, 2, 22, Total 24.
* Netherlands: 28, 88, 295, 180, Total 591.
* Norway: 140, 723, 721, 726, Total 2,310.
* Poland: 12, 106, 217, 2,004, Total 2,339.
* Portugal: 435, 1,314, 824, 146, Total 2,719.
* Romania: 6, 58, 202, 2,187, Total 2,453.
* Slovakia: 2, 20, 12, 180, Total 214.
* Sweden: 70, 571, 374, 471, Total 1,486.
* Slovenia: 3, 8, 1, 4, Total 16.
* Total: 12,412, 12,444, 12,426, 12,450, Grand Total 49,732.
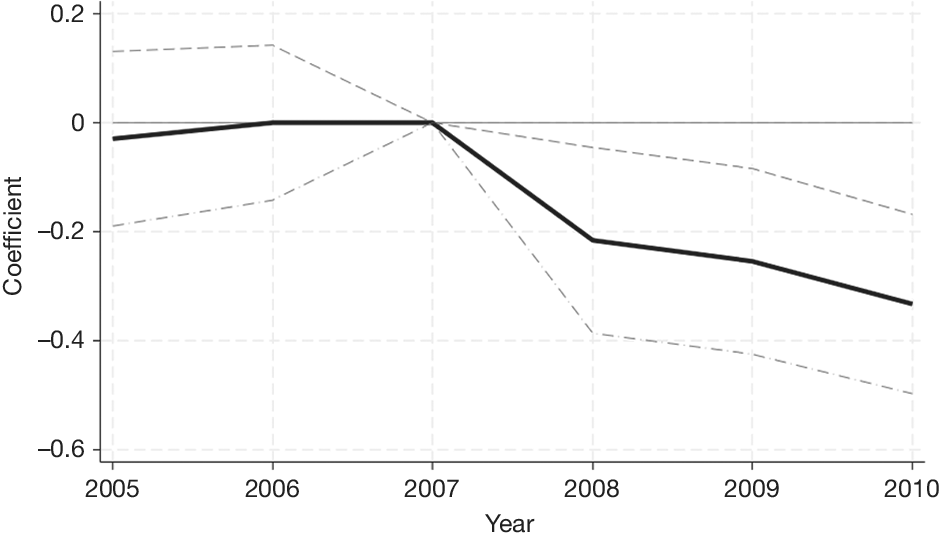
The importance of this point can be shown by looking at the effect of a tax rate change on leverage. To show that inbound and outbound profit shifters react differently to tax rate changes, I investigate the effect of changes in tax rates on leverage. To ensure a clean shock, any firms from countries with multiple tax rate changes are excluded. Moreover, I exclude firms from countries with tax rate changes early in the sample (2005–2006), as I cannot establish the trend before the shock. Similarly, tax rate changes late in the sample (2011) are excluded, as I cannot observe the post-shock period. This leaves tax changes in Germany, Denmark, the United Kingdom, Italy, and Portugal. All of these changes occurred at the start of 2008 and all of them were tax decreases. I further restrict the sample by excluding any firms that do not provide accounting information both before and after 2008.
Table 9 shows the results. Column 1 shows the effect of the shock on treated firms relative to control firms, when ignoring profit shifting. In line with column 1 of Table 4, I do not find a significant effect of the tax rate change on leverage, suggesting a violation of the trade-off theory. However, in column 2, I interact the shock with an indicator variable for being an inbound profit shifter. When this variable takes a value of 0, the firm is an outbound profit shifter and avoids its taxes using profit shifting. If the variable takes a value of 1, the firm is an inbound profit shifter and does not avoid taxes using profit shifting, instead relying on debt tax shields. The decrease in tax rates will lower the benefits of having these debt tax shields. However, the tax rate drop can create incentives to switch from outbound to inbound profit shifting.Footnote 8 Therefore, I enforce that the firm must be an inbound profit shifter in the year of observation as well as in the prior year, to be included in the analysis.

TABLE 9 Long description
The table contains three columns: Variable, Leverage 1, and Leverage 2.
* Treatment times inbound: Leverage 2 shows minus 0.150 with three asterisks and a standard error of 0.055.
* Treatment: Leverage 1 is 0.035 0.023; Leverage 2 is 0.046 0.030.
* Inbound: Leverage 1 is 0.001 0.016; Leverage 2 is 0.037 0.029.
* Profit shifted: Leverage 1 is 0.093 0.071; Leverage 2 is 0.082 0.072.
* Domestic tax rate: Leverage 1 is 0.119 0.297; Leverage 2 is 0.176 0.302.
* Size: Both models show 0.017 with three asterisks and a standard error of 0.002.
* Tangibility: Leverage 1 is 0.013 0.029; Leverage 2 is 0.010 0.028.
* Depreciation: Leverage 1 is 0.079 0.053; Leverage 2 is 0.098 with one asterisk and 0.052.
* Profitability: Leverage 1 is minus 0.089 with three asterisks and 0.029; Leverage 2 is minus 0.086 with three asterisks and 0.029.
* Natural log of G D P per capita: Leverage 1 is 0.113 with three asterisks and 0.022; Leverage 2 is 0.110 with three asterisks and 0.022.
* Interest rate: Leverage 1 is 0.053 with three asterisks and 0.007; Leverage 2 is 0.052 with three asterisks and 0.007.
* Number of observations: 4,806 for both.
* R-squared: Leverage 1 is 0.491; Leverage 2 is 0.494.
* Year F E and Multinational F E: Yes for both models.
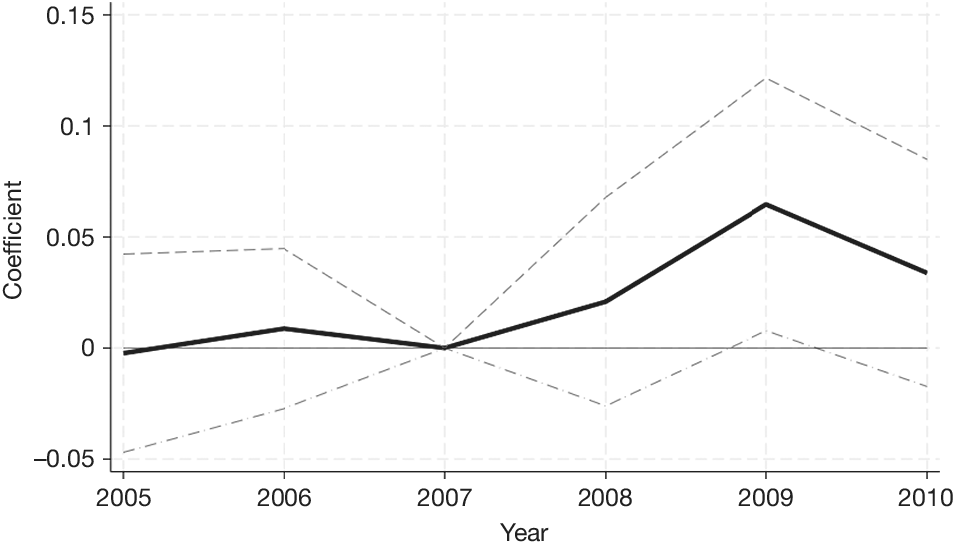
I find that for inbound profit shifters, the reduction in tax rates is associated with lower leverage, whereas for the outbound profit shifters, I find no significant effect. This is in line with the results found in Table 6. Figures 3 and 4 show the effect over time, clearly showing no difference between treated and control groups before the shock, while for the inbound group, a significant effect is seen after the shock.
Figure 3 shows the effect of treated relative to control firms for the 2008 tax rate changes. The y-axis shows the estimated coefficient of being in the treated group in a year on Leverage. 2007 is used as the baseline. The dashed line indicates the 5% confidence interval.

FIGURE 3 Long description
The x-axis is labeled Year and ranges from 2005 to 2010. The y-axis is labeled Coefficient and ranges from negative 0.05 to 0.15. A horizontal zero line serves as a baseline. A solid black line represents the estimated coefficient. It begins near zero in 2005, rises slightly in 2006, and returns to exactly zero at the 2007 baseline. Following the 2008 tax change, the line shows a positive trend, rising to approximately 0.02 in 2008 and peaking at roughly 0.065 in 2009, before declining to about 0.035 in 2010. Two dashed grey lines represent the 5 percent confidence interval. These intervals are relatively narrow and centered around zero before 2007, converge at the 2007 baseline, and then widen significantly from 2008 to 2010, with the upper bound reaching approximately 0.12 in 2009.
Figure 4 shows the effect of inbound profit shifting treated relative to control firms for the 2008 tax rate changes. The y-axis shows the estimated coefficient of being in the treated group in a year on Leverage. 2007 is used as the baseline. The dashed line indicates the 5% confidence interval.

FIGURE 4 Long description
The x-axis is labeled Year and ranges from 2005 to 2010. The y-axis is labeled Coefficient and ranges from negative 0.6 to 0.2. A horizontal reference line is set at 0.
Data flow from left to right:
* From 2005 to 2007, the solid black line representing the estimated coefficient is nearly flat, hovering just below 0.
* At the 2007 baseline, the coefficient is exactly 0 and the confidence interval converges to a single point.
* Starting in 2008, the solid line shows a sharp downward trend, dropping to approximately negative 0.22 in 2008, negative 0.25 in 2009, and continuing to roughly negative 0.33 by 2010.
* Two dashed grey lines represent the 5 percent confidence interval. Before 2007, the interval is wide, spanning roughly 0.15 to negative 0.18. After 2007, the interval widens as the coefficient decreases, with the upper bound remaining below 0 after 2008, indicating a statistically significant negative effect.
These three effects combined suggest that ignoring non-debt tax planning will result in a noisy and underestimated relationship between leverage and tax rates.
V. Robustness
A. Endogenous Entry
A potential concern is that multinationals can enter into specific countries for purposes related to tax avoidance. To ensure such endogenous entry is not driving my results, I drop any observation that entered the sample after the start. Moreover, for the purposes of calculating the incentive-to-shift variable, I use the sales the multinational made in each country at the start of the sample, instead of updating it annually. These two adjustments ensure that there is no endogenous entry or expansion that drives the results. Table 10 shows the results. The results are qualitatively unaffected.

TABLE 10 Long description
A table with four numbered columns representing different regression models. Column 1 has the dependent variable l n E B I T. Columns 2, 3, and 4 have the dependent variable Leverage.
Key coefficients and standard errors in parentheses:
* Constant C: -1.474 in Model 1.
* Profit shifted: 0.455 in Model 3.
* Highest quartile outbound asterisk domestic tax rate: -0.542 in Model 4.
* Domestic tax rate: -0.093 in Model 2, 0.940 in Model 3, and -0.231 in Model 4.
* Middle quartile inbound asterisk domestic tax rate: 0.415 in Model 4.
* Highest quartile inbound asterisk domestic tax rate: 0.571 in Model 4.
* Highest quartile outbound: 0.176 in Model 4.
* Middle quartile inbound: -0.150 in Model 4.
* Highest quartile inbound: -0.193 in Model 4.
* Size: 0.002 in Model 2, 0.001 in Models 3 and 4.
* Tangibility: -0.052 in Models 2 and 3, -0.049 in Model 4.
* Depreciation: -1.043 in Models 2 and 3, -1.039 in Model 4.
* Profitability: -0.401 in Model 2, -0.399 in Model 3, -0.391 in Model 4.
* l n G D P per capita: -0.106 in Model 1, 0.053 in Model 2, 0.048 in Model 3, 0.040 in Model 4.
* Interest rate: 0.020 in Model 1, 0.006 in Model 2, 0.009 in Model 3, 0.015 in Model 4.
* l n Fixed assets: 0.225 in Model 1.
* l n Labor costs: 0.623 in Model 1.
Summary statistics for all models:
* Number of observations: 39,249.
* R-squared: 0.846 for Model 1, 0.465 for Models 2 and 3, 0.469 for Model 4.
* Year F E and Multinational F E are included in all models.
For the shock, I have imposed that companies need to be present for the 2 years prior to the shock, which rules out that entry drives the results in the difference-in-difference estimation.
B. Lobbying
A potential concern is that companies can lobby for a tax rate change. Companies might not be reacting to the tax rate changes as much as the tax rate changes are reacting to these companies. This reverse causality concern is mitigated by the fact that I measure leverage at the end of the year and tax rates at the start of the year.
However, to formally test for this concern, I use insight from the literature on the determinants of lobbying. Hill et al. (Reference Hill, Kelly, Lockhart and Van Ness2013) show that the main determinant for lobbying is the size of the company. Neretina (Reference Neretina2020) shows that only a small subset of companies can effectively lobby for policy changes, and trade associations are not effective at representing smaller companies in the lobbying process.
Detailed data on which companies lobbied on specific laws are not available in most European countries. To ensure my results are not driven by lobbying, I omit the largest third of firms from my sample and rerun the regressions. Table 11 shows that the results are qualitatively unaffected.

TABLE 11 Long description
The table consists of six numbered columns grouped into three categories: Lobby (1 and 2), Thin-Capitalization (3 and 4), and C F C (5 and 6).
Row-by-row data:
- Profit shifted: Column 2 is 0.227**, Column 4 is 0.163***, Column 6 is 0.154***. Standard errors are in parentheses below each value.
- Domestic tax rate: Values range from 0.008 in Column 1 to 0.488*** in Column 4.
- Size: Consistently positive and significant across all columns, ranging from 0.005*** to 0.008***.
- Tangibility: Consistently negative and significant, ranging from -0.036*** to -0.113***.
- Depreciation: Negative and significant in Columns 1 and 2 (-0.030***), but positive and non-significant in others.
- Profitability: Consistently negative and significant, ranging from -0.063*** to -0.241***.
- ln(G D P per capita): Positive and significant across all columns, ranging from 0.041*** to 0.055***.
- Interest rate: Positive and significant across all columns, ranging from 0.007** to 0.019***.
- Number of observations: 22,196 for Lobby; 36,611 for Thin-Capitalization; 41,484 for C F C.
- R-squared: 0.572 for Lobby; 0.483 for Thin-Capitalization; 0.472 for C F C.
- Year F E and Multinational F E: Marked as Yes for all columns.
C. Tax Base
Kawano and Slemrod (Reference Kawano and Slemrod2012) argue that not only tax rates, but also differences in the tax base can be important to take into account. In the context of leverage, several anti-tax avoidance tools are important to discuss. A popular anti-tax avoidance tool used by governments is Thin-capitalization and Earning-stripping rules. These rules target debt-based tax avoidance by putting a hard cap on the deductibility of interest when a company has a leverage ratio beyond a given cap, or when interest payments exceed a percentage of earnings.
Germany switched from a leverage ratio to interest/ebit restriction in 2007. I exclude Germany from this year onward. In 2006, France made a similar change, and Belgium introduced a tax deduction on equity, putting it on a comparable footing with debt. Both are excluded.
Moreover, the 2006 court case by the European Court of Justice (2006), which I use in the difference-in-difference, could drive the other results. Therefore, I exclude affected firms using the method and group structure data from Brok (Reference Brok2024). Table 11 shows that the results are qualitatively unaffected.
None of the subsidiaries in the shock sample were affected by these tax base changes.
D. Additional Tests
1. Regulation and Effectiveness of the Judicial System
Rodano, Serrano-Velarde, and Tarantino (Reference Rodano, Serrano-Velarde and Tarantino2016) show that court functioning can affect leverage. I include several measures obtained from the Fraser Institute to control for this. I include proxies for the impartiality of courts, legal enforcement of contracts, legal system, and property rights, regulatory burden, business regulation, and the integrity of the legal system.
2. Employment Protection
Serfling (Reference Serfling2016) Simintzi, Vig, and Volpin (Reference Simintzi, Vig and Volpin2014) show that employment protection can have an impact on leverage as a result of a trade-off between operating leverage and financial leverage. To control for labor market regulations, I include proxies for hiring and firing regulation, centralized bargaining, and general labor market regulations from the Fraser Institute.
3. Tax Compliance
To rule out that I am picking up cultural aversions to tax compliance, I add a proxy for tax compliance from the Fraser Institute.
4. Bankruptcy Law
Countries can differ in the strength of creditor rights. Prior literature has shown that this can affect leverage (La Porta, de Silanes, Shleifer, and Vishny (Reference La Porta, de Silanes, Shleifer and Vishny1997)). To control for this, I use a measure based on La Porta et al. (Reference La Porta, de Silanes, Shleifer and Vishny1997) and Djankov, McLiesh, and Shleifer (Reference Djankov, McLiesh and Shleifer2007), which measures the strength of creditor rights in a country. I use the adjusted version published by the World Bank and used in Safavian and Sharma ((Reference Safavian and Sharma2007), Doing Business Report, (no longer) available at http://www.doingbusiness.org). This version is more granular and therefore has time series variation. The main results are qualitatively unchanged.
Table 12 shows the results. The main results are qualitatively unchanged.

TABLE 12 Long description
A table with three columns. The first column lists independent variables, the second column is l n (E B I T) labeled 1, and the third column is Leverage labeled 2. Standard errors are in parentheses below coefficients.
Key results for Leverage (Column 2):
- Profit shifting: 0.100*** (0.034)
- Domestic tax rate: 0.343*** (0.085)
- Size: 0.004*** (0.001)
- Tangibility: minus 0.037*** (0.009)
- Depreciation: minus 0.063 (0.041)
- Profitability: minus 0.292*** (0.013)
Key results for l n (E B I T) (Column 1):
- C: minus 1.534*** (0.181)
- l n (Fixed assets): 0.224*** (0.007)
- l n (Labor costs): 0.657*** (0.011)
Shared variables (Column 1, Column 2):
- l n (G D P per capita): 0.316*** (0.042), 0.003 (0.009)
- Interest rate: 0.028** (0.012), 0.007*** (0.002)
- Impartial courts: minus 0.149*** (0.020), minus 0.025*** (0.003)
- Integrity of the legal system: 0.051*** (0.018), 0.005* (0.003)
- Legal enforcement of contracts: minus 0.093*** (0.014), 0.017*** (0.003)
- Creditor rights: 0.103*** (0.008), 0.001 (0.001)
- Legal system and property rights: minus 0.042 (0.029), 0.046*** (0.005)
- Hiring regulations and minimum wage: 0.028*** (0.006), minus 0.016*** (0.001)
- Centralized collective bargaining: 0.071*** (0.010), minus 0.021*** (0.002)
- Labor market regulations: minus 0.193*** (0.022), 0.048*** (0.004)
- Regulatory burden: minus 0.016* (0.010), 0.001 (0.002)
- Tax compliance: 0.008 (0.010), 0.016*** (0.002)
- Business regulations: 0.060 (0.045), minus 0.041*** (0.008)
Summary Statistics:
- Number of observations: 49,667 for both.
- R-squared: 0.864 for Column 1, 0.480 for Column 2.
- Year F E and Multinational F E: Yes for both.
E. Standard Errors
The main specifications cluster the standard errors at the multinational level. In an alternative specification, I cluster at the multinational-year level. Tables 13 and 14 show that the results are qualitatively unaffected.

TABLE 13 Long description
The table consists of three columns labeled Leverage 1, 2, and 3.
Profit shifted: Model 1 is blank; Models 2 and 3 show 0.124 with standard errors of 0.035 and 0.034 respectively.
Domestic tax rate: Model 1 shows 0.043 (0.033); Models 2 and 3 show 0.292 (0.078).
Size: All models show 0.004 (0.001).
Tangibility: All models show minus 0.038 (0.009).
Depreciation: Model 1 shows minus 0.064 (0.046); Models 2 and 3 show minus 0.063 (0.046).
Profitability: Model 1 shows minus 0.296 (0.013); Models 2 and 3 show minus 0.295 with standard errors of 0.013 and 0.014.
l n (G D P per capita): Model 1 shows 0.055 (0.003); Models 2 and 3 show 0.053 with standard errors of 0.003 and 0.004.
Interest: Model 1 shows 0.016 (0.002); Models 2 and 3 show 0.017 (0.002).
Summary statistics for all models: Number of observations is 49,732; R-squared is 0.468; Year F E and Multinational F E are both Yes.

TABLE 14 Long description
The table consists of three columns labeled Leverage 1, 2, and 3.
Key variables and their coefficients (standard errors in parentheses):
* Highest quartile outbound asterisk domestic tax rate: Model 2 and 3 show minus 0.398*** (0.096 and 0.110).
* Domestic tax rate: Model 1 is 0.043 (0.033); Models 2 and 3 are minus 0.135 (0.085 and 0.096).
* Middle quartile inbound asterisk domestic tax rate: Models 2 and 3 show 0.477*** (0.083 and 0.098).
* Highest quartile inbound asterisk domestic tax rate: Models 2 and 3 show 0.543*** (0.097 and 0.115).
* Highest quartile outbound: Models 2 and 3 show 0.121*** (0.033 and 0.038).
* Middle quartile inbound: Models 2 and 3 show minus 0.173*** (0.027 and 0.032).
* Highest quartile inbound: Models 2 and 3 show minus 0.182*** (0.031 and 0.036).
* Size: All models show 0.004*** or 0.003*** (0.001).
* Tangibility: All models show minus 0.038*** (0.009).
* Depreciation: All models show approximately minus 0.06 (0.045).
* Profitability: All models show approximately minus 0.29*** (0.013).
* l n (G D P per capita): Model 1 is 0.055*** (0.003); Models 2 and 3 are 0.042*** (0.004).
* Interest: Model 1 is 0.016*** (0.002); Models 2 and 3 are 0.022*** (0.002).
Summary statistics for all models:
* Number of observations: 49,732.
* R-squared: 0.468 for Model 1; 0.472 for Models 2 and 3.
* Year F E and Multinational F E: Yes for all models.
VI. Conclusion
This article shows that non-debt tax avoidance crowds out debt tax shields. Using two different methods for estimating non-debt tax avoidance, I establish that companies do indeed use other methods to avoid taxes. I then use the predicted tax avoided to show that higher non-debt tax avoiders use less debt for the purpose of tax shields.
Since high-taxed firms have the most incentive to use both debt and non-debt tax shields, this casts a new light on the fact that empirically we see limited responses of leverage to tax rates (Graham (Reference Graham2006), Hanlon and Heitzman (Reference Hanlon and Heitzman2010)). The firms we would expect to have the highest leverage based on tax rates are also the ones we expect to have the highest non-debt tax avoidance. Since the two can act as substitutes, we overestimate the effect of tax rates on leverage for those firms.
On the other hand, we underestimate the effects of tax rates on leverage for low-taxed firms, as they have the most incentive to be on the receiving end of tax avoidance strategies that involve shifting profits from one country to another. I show that once we take into account these incentives for non-debt tax avoidance, the relationship between tax rates and leverage is far stronger.