INTRODUCTION
The introduction of non-native species is a major driver of biodiversity loss (Williamson Reference WILLIAMSON1999). Invasive species can influence native taxa in several ways, via mechanisms such as predation, hybridization, the introduction of diseases and competition for limited resources (Mack et al. Reference MACK, SIMBERLOFF, MARK LONSDALE, EVANS, CLOUT and BAZZAZ2000). One behavioural response that is poorly understood, but which may well be widespread, is a change in habitat use of native species due to the presence of the invader. That change might result from the native taxon avoiding the invader, or being attracted to it (Bleach et al. Reference BLEACH, BECKMANN, BROWN and SHINE2013). In Belarus, for example, introduced American mink (Mustela vison) shifted habitat use of native European mink (M. lutreola) away from rivers and into small streams, and reduced the abundance of the native species (Sidorovich & MacDonald Reference SIDOROVICH and MACDONALD2001). The same kinds of interaction presumably occur in undisturbed communities, but are difficult to document unless one component of the system is experimentally manipulated. For example, the native elk (Cervus elaphus) in Yellowstone National Park altered its habitat use to avoid the re-introduced wolf (Canis lupus) (Creel et al. Reference CREEL, WINNIE, MAXWELL, HAMLIN and CREEL2005). The presence of invasive species also may influence the foraging success of natives: for example, invading Argentine ant (Linepithema humile) in California reduced the foraging success of native ants (Human & Gordon Reference HUMAN and GORDON1996). The ongoing expansion of the introduced cane toad (Rhinella marina, formerly Bufo marinus) through Australia provides an ideal opportunity to investigate the effects of an invasive taxon on the habitat use and activity of native species.
The cane toad is a large (> 500 g) amphibian, originating from Central and South America. The species has been introduced to many countries and islands in Oceania and the Pacific including Australia (Lever Reference LEVER2001, Urban et al. Reference URBAN, PHILLIPS, SKELLY and SHINE2007). Since the introduction, the cane toad has caused dramatic population declines in some native species by fatally poisoning predators (Murray & Hose Reference MURRAY and HOSE2005, Shine Reference SHINE2010) or via competition (Boland Reference BOLAND2004). Invasive cane toads and native frogs can interact via exploitative competition (e.g. as competitors for resources such as food, shelter and breeding sites), or via interference competition (e.g. via acoustic interference, Bleach et al. Reference BLEACH, BECKMANN, BOTH, BROWN and SHINE2015), as predator and prey, and/or as potential hosts for shared parasites (Shine Reference SHINE2013). Studies on interactions between Australian anurans and cane toads generally have focused on early life-history stages (eggs, larvae and metamorphs). Native frog tadpoles die from eating the toxic eggs of cane toads (Crossland et al. Reference CROSSLAND, BROWN, ANSTIS, SHILTON and SHINE2008), but the consequent decrease in tadpole density may benefit the survivors, leading to a larger body size at metamorphosis (Crossland et al. Reference CROSSLAND, ALFORD and SHINE2009). Toxic cane toad tadpoles also may reduce fish predation on native frog tadpoles, because fish learn to avoid preying on tadpoles (Nelson et al. Reference NELSON, CROSSLAND and SHINE2011).
Native frogs also interact with post-metamorphic cane toads. Mortality from consuming toxic toad metamorphs may impose selection on life-history traits in the marbled frog Limnodynastes convexiusculus (Greenlees et al. Reference GREENLEES, PHILLIPS and SHINE2010a). Adult marbled frogs, however, soon learn to avoid preying on toads (Greenlees et al. Reference GREENLEES, PHILLIPS and SHINE2010b). In experimental settings, the presence of toads affected microhabitat selection by metamorph frogs, and activity levels of adult frogs (Greenlees et al. Reference GREENLEES, BROWN, WEBB, PHILLIPS and SHINE2007, Pizzatto & Shine Reference PIZZATTO and SHINE2009). However, selection of diurnal shelter-site by native frogs (both in the wild and in experimental enclosures) was not markedly affected by the presence of the cane toad (Bleach et al. Reference BLEACH, BECKMANN, BROWN and SHINE2013).
In the present study, we hypothesized that the cane toad and native frog species differ in habitat use, and we predicted that cane toads (as potential competitors and predators) would influence the habitat use and activity of native frogs in the wild. We combined observational data with short-term experimental manipulations of toad density to document spatial relationships between native frogs and invasive toads. Our survey evaluated similarities between toads and native frogs in habitat selection criteria (based on their use of available habitat in the wild). To directly test the effects of toad presence on frogs, we manipulated toad densities in experimental areas and monitored shifts in frog abundance and activity.
METHODS
Study site and habitat scoring
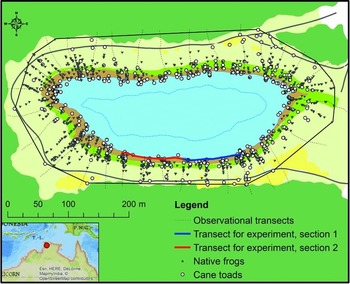
The study was conducted between June and September 2013 at Leaning Tree Lagoon (12°71′33′′131°41′96′′), a 6-ha billabong located 80 km south-east of Darwin in Australia's Northern Territory (Figure 1). The area experiences a wet-dry tropical climate, with monsoonal rains between November and April (Shine & Brown Reference SHINE and BROWN2008). Little or no rain falls during the May–October dry season, when our study took place. Average maximum air temperatures exceed 28°C each month, but mean monthly minima are lower during the dry season (17.5°C) than the wet season (23.5°C) (Australian Bureau of Meteorology). We identified eight different habitat types within the study area, and mapped them by walking along their borders with a GPS (Garmin eTrex 10, Garmin Ltd). Mapping and habitat-related analysis were performed with ArcMap 10.1 (Esri Redlands, CA). We assigned habitats into categories, based on substrate moisture and presence or predominant type of vegetation. These categories occurred in concentric rings around the lagoon, with increasing distance from the water, in the following order: (1) open water; (2) exposed mud; (3) bank covered with the sedge Fimbristylis simplex S. T.Blake (Cyperaceae) and sporadic cover of Persicaria attenuata (R.Br.) Sojak (Polygonaceae); (4) reed bed, consisting of Oldenlandia galioides F.Muell. (Rubiaceae), and Pseudoraphis spinescens (R.Br.) Vickery (Poaceae); (5) sedges (Cyperaceae, not identified to species); (6) dirt road; (7) long grass Chrysopogon oliganthus Veldkamp; and (8) forest (Figure 1). The last three categories were not used in later analyses, because few (< 1% of total) anurans were observed there. The ‘mud’ category was only present during the last sampling period, as the falling water level exposed mud flats. We also measured vegetation height in each habitat and recorded the location of holes (15–50 cm wide, 5–15 cm deep) in the substrate (usually close to the water) created by the hoofprints or foraging activities of large mammals (wallabies, pigs, water buffalo). Those holes provide microhabitat heterogeneity and thus both foraging opportunities and shelter (González-Bernal et al. Reference GONZÁLEZ-BERNAL, BROWN, CABRERA-GUZMÁN and SHINE2011) for native anurans and cane toads.
Study site at Leaning Tree Lagoon, Northern Australia, showing the study area (solid black line) and the concentric distribution of habitat categories (water in blue, bank in brown, reed in light green, sedges in beige, long grass in yellow and forest in dark green), the transects used for observational data collection (radiating out from the lagoon, dashed black lines), the transects along which we experimentally manipulated the abundance of cane toads (solid blue and red line: transect section one and two, respectively), and the GPS positions of anurans during the first period (27 June to 3 August 2013). The dashed blue line shows the shoreline after the water level had receded on 13 September.

We generated a raster over the whole study site with fixed points every 20 m, and then visited each point to measure the vegetation height at four random locations within a 1-m2 plot, and estimated the density of holes. These point data were then interpolated to a raster file for vegetation height and hole density, respectively, using inverse distance weighting (Lu & Wong Reference LU and WONG2008). We measured the shoreline fortnightly to account for receding water levels and then calculated the distance from water for each observation point (‘join data’ tool ArcMap 10.1) during those 2-wk intervals before performing the statistical analysis.
Study species and data collection
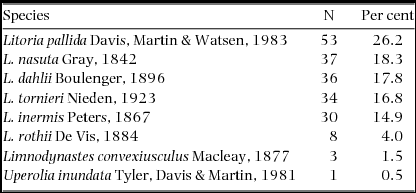
Counts of anurans. In addition to invasive cane toads (Rhinella marina), we observed 10 species of native frog: Crinia bilingua, Limnodynastes convexiusculus, Litoria bicolor, L. dahlii, L. inermis, L. microbelos, L. nasuta, L. rothii, L. tornieri and L. pallida. Data on the composition of the native frog community around Leaning Tree Lagoon were collected during surveys on 10 nights in June–October 2007. The surveys were conducted on foot and covered the area within 20 m of the water's edge. All native frogs encountered on land were identified to species. The assemblage of active frogs at Leaning Tree Lagoon during the dry season is dominated by five species, which occur in similar proportions (15–26%, Table 1) and make up 94% of all species. Apart from the aquatic L. dahlii, these closely related species (L. pallida, L. nasuta, L. tornieri and L. inermis) are very similar in morphology and ecology; all are terrestrial with similar habitat use, diets and rates of water loss (Freeland & Kerin Reference FREELAND and KERIN1988, Young et al. Reference YOUNG, CHRISTIAN, DONNELLAN, TRACY and PARRY2005). Due to these similarities, and difficulties of reliably identifying different species when walking the transects, we categorized anurans as ‘cane toad’ vs ‘native frog’. Hence, our results and inferences mainly refer to those five most common native anurans.
Species identification of 202 native frogs surveyed during 10 dry-season nights at Leaning Tree Lagoon, Northern Territory, Australia.

Habitat use of anurans. We measured anuran activity at the lagoon during two periods: (1) 27 June–3 August 2013 (35 observation nights), while water levels were high; and (2) 1–15 September 2013 (12 observation nights), after falling water levels had exposed 15–45 m of muddy shore (depending on the slope of the bank). The second survey was designed to investigate if anurans followed the retreating water, or remained within a specific habitat type. Between dusk (19h00) and 21h00 each night, between five and eight transects (each c. 100 m long) were walked to count anurans. Transects were perpendicular to the water edge, but not in fixed positions. Each transect ran between the shoreline and the surrounding forest, passing through all intervening habitat categories (Figure 1). By locating transects randomly, we decreased the probability of observing the same individual anurans each night, and sampled a larger overall area. The transects were walked by the same observer each night to avoid a bias, alternately between the water and forest, and commenced from opposite sides of the lagoon each night to minimize any effects of time of day and observer fatigue. Anurans that were detected using a head lamp (Led Lenser H7, Solingen, Germany) within 2 m of the transect were counted, identified as a toad or a native frog, and had their GPS location recorded. The accuracy of the GPS was about 15 m in open areas (http://www.ruraltech.org/gis/gps/gps_receiver_tests/recreational/nav_3-2001.pdf). We also noted whether the anuran was sitting on vegetation or in an unvegetated hole. Further, we conducted a nearest neighbour analysis to investigate if frogs and toads were spatially separated. We used 1470 native frog positions and 483 cane toad positions, obtained during 35 observation nights (27 June–3 August), to calculate the distance of each anuran to their nearest neighbour separately for each night. Distances of > 10 m between adjacent anurans were excluded from the analysis, as these were unlikely to influence other anurans (the calling activity at this time of the year was very limited, being outside of the mating season). We then performed separate t-tests on data for native frogs and cane toads, to determine if the mean distance to the nearest neighbour differed for frogs versus toads.
Experimental study
To determine if the activity or detectability of native frogs was affected by the presence of cane toads, we conducted an experiment in which we temporarily removed toads. Between 5 August and 13 September 2013, toads were relocated from one area of the lagoon to a nearby area. We set out a 200-m-long transect on the eastern side of the lagoon, parallel to the shore and between the habitat categories ‘bank’ and ‘mud’ (where most of the cane toads occur). The transect was divided into two 100-m sections (Figure 1). Soon after dark, all cane toads were collected from one 100-m section and released at the other section, in order to temporarily increase the toad density there. While collecting and releasing toads we spent similar amounts of time within the two transect areas to avoid an observer-based influence on the activity of native frogs. On average 80 cane toads were removed from the transect each night (range: 11–170, depending on the temperature). We waited 30 min after relocating the toads to mitigate possibly negative effects of the disturbance and allow the anurans to resume their normal activity (which can take < 5 min after a one-time disturbance: Rodríguez-Prieto & Fernández-Juricic Reference RODRÍGUEZ-PRIETO and FERNÁNDEZ-JURICIC2005). We then walked the transect to count frogs, using the same method as above. The experiment was conducted in three stages. For the first 20 consecutive days, toads were removed from section 1 and released at section 2. Over the next 20 d we reversed this manipulation, removing toads from section 2 and releasing them in section 1. For the third (control) phase, lasting nine nights, toad locations were not manipulated, while frog numbers were counted in the same way as before.
Statistical analysis
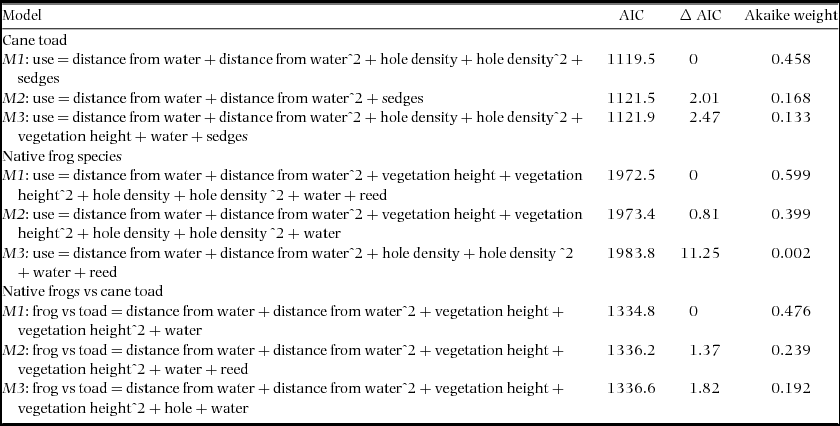
We defined a study area by creating a minimum convex polygon around all locations where we recorded anurans (excluding four outliers due to a possible observer bias). To investigate habitat choice, we used resource selection functions and created generalized linear models (GLM) for native frogs and toads separately, and selected the best model based on Akaike information criteria (AIC) and Akaike weights (Wagenmakers & Farrell Reference WAGENMAKERS and FARRELL2004) (Table 2). We used 500 random points (data management tool, ArcMap 10.1) in the study area to estimate available habitat. The response was binomial (1 = location used by anuran, versus 0 = location not used by anuran). GPS positions recorded for frogs (n = 1529) and toads (n = 540) between 27 June and 3 August were used for this analysis. For native frogs, we also included 699 positions from the second time period (1–15 September) to determine if the location of frogs was affected by retreating water level, or linked to a specific vegetation type. Distance from water, vegetation height, density of holes and the habitat categories were predictors in all models. Initially, we checked for correlations (threshold: correlation coefficient r > 0.6). We then removed correlated parameters from the model if they had variance inflation factors (vif) > 2 (Zuur et al. Reference ZUUR, IENO and ELPHICK2010). We created single-effect models for the variables distance from water, vegetation height and hole density to test if their relationship with the response was linear or quadratic, based on AIC values. Next, we combined data for frogs and toads in a binary response variable (1 = frog versus 0 = toad) (following Peters et al. Reference PETERS, HEBBLEWHITE, DECESARE, CAGNACCI and MUSIANI2013) to directly compare the habitat use of alien versus native amphibians (Table 2). To compare toads versus frogs, we used all 540 toad positions and randomly chose 540 frog positions. Because this analysis used anuran locations and no random points, we used observations of hole occupancy (1 = in hole versus 0 = in vegetation) rather than hole density as a predictor variable.
Result of the model selection process showing the three best models (based on AIC-values) for the habitat use of cane toads and native frogs separately and for native frogs relative to cane toads. M1 was the chosen model for the results in all cases. The quadratic function of the predictors is given as ‘^2’.

For our experiment we used a GLM to evaluate the relationship between observed frog abundance (the response variable) and the interaction between toad removal (section one vs section two) and time period (first 20-d period vs second 20-d period). To investigate if frog counts differed during the control period, we performed a t-test. All statistical analyses were performed in R version 2.15.1.
RESULTS
Habitat choice by cane toads and native frogs
Overall, native frogs (n = 1529) were about three times more common than the cane toad (n = 540) at our study site. On average, each night we observed 9.2 native frogs (range = 0.7–24.3 frogs) and 3.3 toads (0–5.9) per 100-m transect.
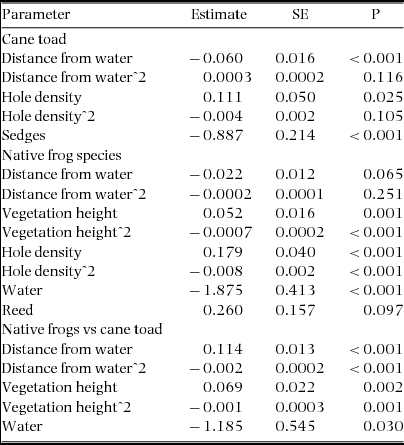
Cane toad. In the models for cane toads, the habitat category ‘bank’ was correlated with the parameter ‘distance from water’ and therefore excluded (based on a vif value > 2). Toads stayed close to the water (on average 12.6 m), with 56% of all the toads observed within 10 m of the water's edge (Figure 2). They preferred a greater density of holes (quadratic term fitted best) and avoided the vegetation category sedges (Tables 3, 4). In September (after the water level in the lagoon had dropped between 15 and 45 m in 4 wk), cane toads left vegetated areas and instead followed the edge of the retreating water (as shown by capture locations of the toads used for our experimental relocation).
The percentage of cane toads (relative to all observed anurans) in relation to the distance from the shoreline during the first period (a) and the frequency distribution of distances from the water's edge of native frogs (both before and after water level decreased); and of cane toads, shown for the initial period only (b). Period 1 was 27 June to 3 August 2013 (high water) and period 2 was 1–15 September 2013 (low water).

Result of the best model (based on AIC-values and Akaike weights) for cane toad, frog, and toad vs frog locations (parameters with estimates, SE and P values) for data obtained between 27 June and 3 August 2013 at Leaning Tree Lagoon, Northern Territory, Australia. The quadratic function of the predictors is given as ‘^2’.

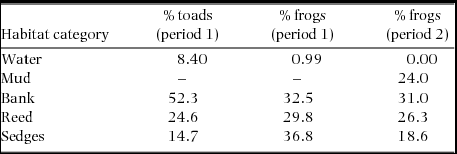
Percentage of anurans observed in different habitat categories at Leaning Tree Lagoon, Northern Territory, Australia. The table shows the observed proportions of cane toads and native frogs between 27 June and 3 August 2013 (period 1) in each habitat category. Data from 1–15 September 2013 (period 2) are also shown for frogs (and includes the habitat category ‘mud’, which was not present during the earlier survey period).

Native frog species. The habitat categories ‘bank’ and ‘sedges’ were correlated with ‘distance from water’ in the model for the frogs and were therefore excluded. Frogs were most abundant close to the water (on average, 19.4 m) but were not as concentrated as toads in this respect (quadratic term fitted best); only 28% were located within 10 m of the water edge (Figure 2). Frogs preferred areas with greater vegetation height and a greater density of holes. Quadratic terms for both these parameters appeared in the best models (Table 3). Further, frogs avoided open water and preferred the habitat category ‘reed’ (Table 3). After the water's edge retreated (1–15 September), frogs did not follow it, but instead remained in or close to vegetated areas (Table 4), further from water than in the earlier surveys (means of 39.5 vs 19.4 m, t = −30.7, P < 0.001, df = 2110, Figure 2).
Habitat choice of native frogs relative to cane toads
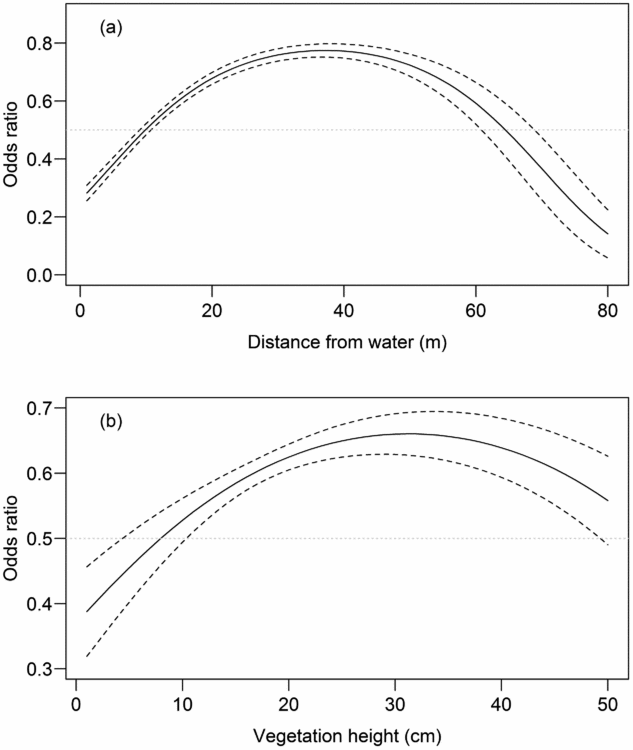
The habitat categories ‘bank’ and ‘sedges’ were correlated with distance from water and therefore excluded from the model. The analysis combining native frog and cane toad locations showed that frog abundance was highest at intermediate distances (10–65 m) from the water's edge, whereas most toads were found either close to (< 10 m) or far from (> 65 m) water (Figures 2, 3, Table 3). Frogs tended to be more abundant in vegetation between 8 and 50 cm high, while toads were more abundant relative to frogs in areas where the vegetation was lower (Figure 3). We only observed 27 anurans in vegetation > 50 cm. Relative to toads, frogs avoided water, and they tended to be more common in the habitat category ‘reed’ (Table 3).
Odds ratio showing the difference in habitat use by native frogs relative to cane toads, for the parameters distance to water (a) and vegetation height (b). Values > 0.5 indicate that a frog is more likely to be found at that site than is a toad; values < 0.5 indicate the reverse situation. Dashed lines show the 95% confidence interval.

Nearest-neighbour analysis of the observational (pre-manipulation) data showed that toads were generally found closer to conspecifics than to frogs (means of 1.02 vs 2.22 m, t = 5.3, P < 0.001, df = 430), but frogs were not found significantly closer to other frogs than to cane toads (means of 1.27 vs 1.66 m, t = −1.9, P = 0.057, df = 191). However, for both types of anuran, the next neighbour was more often of the same type (89% in frogs, 52% in toads) than expected by chance (observed ratio: 75% (1470) frogs vs 25% (483) toads).
Effects of experimental alteration of toad density on frog location
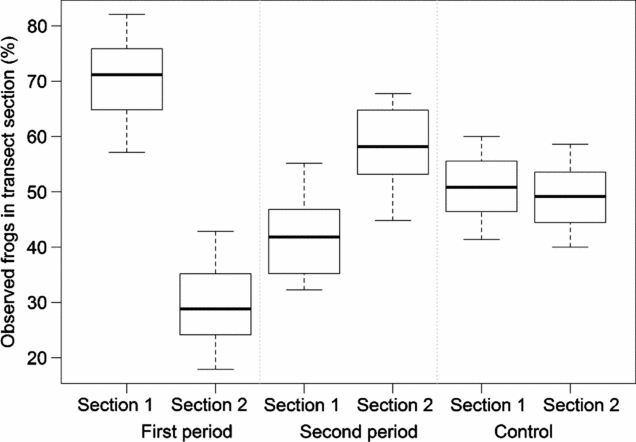
During the control period (when no cane toads were removed), frog abundance was similar on the first versus second 100-m sections of the transect (means 30.7 vs 29.3, t = 0.39, P = 0.71, df = 15.2, Figure 4). By contrast, during the experimental removal of cane toads, the interaction between section (toads removed vs increased) and time period had a significant effect on frog numbers (χ2 1, 76 = 15346, P = 0.002) (mean frog counts 72.1 vs 44.4, t = 2.74, P = 0.008, df = 77.6, Figure 4). During both 20-d periods the observed frog numbers were significantly higher in the section without toads compared to the section with toads, by an average of 14.5%. The abundance of cane toads before removal was almost equal to the number of native anurans (51.8% cane toads, 48.2% native frogs, as counted in the transect where toads were removed).
Effects of experimentally manipulating cane toad abundance on the observed number of native frogs. Cane toads were removed from section 1 during the first period, and from section 2 during the second period. The box plots show median values, and 25th and 75th percentile and 95% confidence intervals.

DISCUSSION
Our surveys show that the invasive cane toad overlaps substantially (but not completely) in habitat use with native frogs. The consequent proximity of aliens and natives is reduced by finer-scale habitat selection (toads are found close to other toads), and our experimental manipulation of toad numbers shows that direct or indirect avoidance of toads by frogs contributes to that pattern.
In general, continuous variables (distance from water, vegetation height, unvegetated holes) described the habitat use more precisely than did habitat categories. Frogs and cane toads broadly use the same types of habitats, preferring close proximity to water. When the water level was high, both groups of anurans were often found in unvegetated holes among otherwise vegetated areas, possibly because their foraging success was greater there (González-Bernal et al. Reference GONZÁLEZ-BERNAL, BROWN, CABRERA-GUZMÁN and SHINE2011). However, detailed investigation revealed significant differences with cane toads using areas with low vegetation very close or further from the shoreline, where their foraging success is greater (Zug & Zug Reference ZUG and ZUG1979), whereas frogs were more often in intermediate-height vegetation and intermediate distances from the shoreline (10–65 m). This observation of fine-scale spatial separation was strengthened by our nearest neighbour analysis finding that toads were found closer to conspecifics than to frogs. Although not significant, frogs also tended to be found closer to other frogs than to cane toads. Those divergences became more pronounced as the water level receded, exposing large open muddy banks. As well as needing a moist surface for regular rehydration (Lever Reference LEVER2001, Seebacher & Alford Reference SEEBACHER and ALFORD2002), cane toads prefer open habitats for foraging (Zug & Zug Reference ZUG and ZUG1979) and breeding (Hagman & Shine Reference HAGMAN and SHINE2006, Semeniuk et al. Reference SEMENIUK, LEMCKERT and SHINE2007) and so followed the receding waterline, whereas native frogs remained in the vegetation that was increasingly distant from the water's edge (Figure 2). This result might underestimate the divergence, with some smaller frogs undetected in higher vegetation. In general, we may have underestimated the abundance of frogs as they are smaller and more mobile than cane toads, reducing detection probability. Frogs may depend on vegetation to avoid predation by snakes (such as keelback Tropidonophis mairii, and slaty-grey snake Stegonotus cucullatus, common at our study site: pers. obs.). In contrast, the larger and more toxic cane toads are relatively invulnerable to most native predators (but see Cabrera-Guzmán et al. Reference CABRERA-GUZMÁN, CROSSLAND and SHINE2012, Shine Reference SHINE2010). Even for the minority of snake predators physiologically capable of tolerating toad toxins, toads tend to be less preferred as prey than are native frogs (Llewelyn et al. Reference LLEWELYN, SCHWARZKOPF, ALFORD and SHINE2010, Reference LLEWELYN, PHILLIPS, BROWN, SCHWARZKOPF, ALFORD and SHINE2011).
Thus, part of the habitat divergence between frogs and toads was due to differing innate preferences of the two types of amphibians: cane toads prefer open areas close to water, whereas frogs prefer intermediate-density vegetation. Nonetheless, we found a shift in activity (and thus observed abundance) of native frogs during our experimental manipulation of toad densities. The altered frog activity is not necessarily a specific response to cane toads, but might be a result of altered anuran densities in general (Greenlees et al. Reference GREENLEES, BROWN, WEBB, PHILLIPS and SHINE2007). However, the ecological consequences of this observation are clear, as cane toads are present at high densities in Australia and spreading rapidly (Shine Reference SHINE2010). Why did frogs avoid cane toads/increased anuran densities? Competition and predation are the two most likely reasons. Toads are voracious predators, often consuming many more prey items than do sympatric frogs (Greenlees et al. Reference GREENLEES, BROWN, WEBB, PHILLIPS and SHINE2007); thus, a toad's presence may repel frogs by depressing prey abundance, either as a direct effect (i.e. frogs avoid sites where prey are rare) or indirectly (i.e. frogs have evolved to avoid other large anurans, because such avoidance reduces competition for food). By increasing the density of anurans, cane toads amplify these effects. The risk of predation also may be significant. Although cane toads primarily feed on small insects, they sometimes consume other anurans (Pizzatto & Shine Reference PIZZATTO and SHINE2008); Jaeger (Reference JAEGER1976) described cane toads searching for calling male frogs and eating them. We found native frogs in the alimentary tracts in three of 10 adult toads that we dissected (MM, unpubl. data), confirming that a frog may ignore a toad's proximity at its peril.
Previous studies have explored avoidance of cane toads by native frogs in experimental situations, but have produced equivocal results. In captivity, metamorph frogs avoided the scent of cane toads – but also avoided other strong scents, suggesting this is not a specifically toad-focused response (Pizzatto & Shine Reference PIZZATTO and SHINE2009). In outdoor arenas, giant frogs (Cyclorana australis) reduced activity levels in the presence of cane toads (Greenlees et al. Reference GREENLEES, BROWN, WEBB, PHILLIPS and SHINE2007). However, activity levels also decreased when more giant frogs were added to the enclosure, suggesting an inhibiting effect of anuran density (independent of species). Most native frog species did not avoid cane toads when selecting shelter burrows either in arenas or in the field (Bleach et al. Reference BLEACH, BECKMANN, BROWN and SHINE2013). That diversity of results may reflect interspecific differences, as well as aspects of experimental design. For example, a frog's need for a moist diurnal shelter-site may render it unwilling to leave even if it encounters a cane toad within the burrow (Bleach et al. Reference BLEACH, BECKMANN, BROWN and SHINE2013). The present study provides the first evidence that cane toads induce a shift in activity and habitat use of foraging native anurans in their natural habitat – either by direct avoidance or indirectly through an increase in anuran density. That effect is unlikely to be reciprocal, given the body-size disparity; we doubt that adult toads actively avoid frogs. However, our experimental design did not address this possibility, and future work could usefully explore toad responses to frogs, in the same way that we have investigated frog responses to toads. Further, we did not separate native frog species in our analysis. Interspecific variation in ecology may render some taxa more easily affected by cane toads. Body size may play an important role, with larger species (such as Litoria dahlii) being less susceptible to predation than smaller species (such as L. pallida, L. tornieri and L. inermis). Habitat selection might also be important, with the aquatic Litoria dahlii more exposed to toads due to its dependence on close proximity to water (compared with the other four common species, L. nasuta, L. pallida, L. tornieri and L. inermis). More detailed studies are needed to investigate the cane toads’ effects on single anuran species.
Similar interactions between invasive cane toads and native frogs may occur in other parts of the toad's translocated range. In an area c. 1000 km south-east of our own study site (and conducted 25 y earlier), Freeland & Kerin (Reference FREELAND and KERIN1988) did not find any change in habitat use by frogs when cane toads were present. However, these authors used a range of localities, with substantial variation in factors such as vegetation and soil types, intensity of cattle grazing and frog communities that may have masked subtle effects of toads on frogs. In Fiji, the ground frog (Platymantis vitiana) avoided cane toads in an experimental trial, and displayed elevated corticosterone levels when confined with a toad (Narayan et al. Reference NARAYAN, COCKREM and HERO2013). The fitness consequences of this avoidance behaviour are difficult to assess. Plausibly, a reduction in activity levels, or a change in the location of foraging, might reduce food intake and affect survival, growth and reproductive output (Werner & Anholt Reference WERNER and ANHOLT1993). Alternatively, the subordinate species may be able to modify its activity patterns in ways that keep it out of reach of the dominant competitor, without incurring fitness costs (Langkilde et al. Reference LANGKILDE, LANCE and SHINE2005). The high densities and wide distribution of cane toads in their invaded range (Freeland Reference FREELAND1986, Urban et al. Reference URBAN, PHILLIPS, SKELLY and SHINE2007) suggest that any suppression effects could be widespread. Broad comparisons suggest that frog numbers are largely unchanged after toads invade (Shine Reference SHINE2013), but the most detailed dataset from a single locality (close to our own study area) revealed a general decline in frog abundance (Brown et al. Reference BROWN, UJVARI, MADSEN, SHINE and HARWOOD2013). Any interpretation of such patterns is confounded not only by geographic variation, but also by the myriad indirect effects of toad invasion on frogs: for example, toxin-induced mortality of snakes and large varanid lizards may benefit frogs by removing many anurophagous predators (Shine Reference SHINE2010, Reference SHINE2013).
Other invasive species similarly can influence the behaviour of natives. On Grand Cayman island, an introduced anole (Anolis sagrei) induced a shift in habitat use of native anoles (Anolis conspersus) (Losos et al. Reference LOSOS, MARKS and SCHOENER1993). Such changes in behaviour and spatial distribution also can be induced by invasive plants. In North America, introduced plants altered native plant composition and fire regimes, with negative impacts on tortoises (Gopherus agassizii, G. polyphemus: Gibbons et al. Reference GIBBONS, SCOTT, RYAN, BUHLMANN, TUBERVILLE, METTS, GREENE, MILLS, LEIDEN and POPPY2000). Further, non-native Japanese knotweed (Fallopia japonica) reduced the foraging success of the green frog (Rana calamitans) by changing vegetation structure and decreasing arthropod abundance (Maerz et al. Reference MAERZ, BLOSSEY and NUZZO2005). Cane toads might have the same effect on native frogs, because they can reduce invertebrate abundance and species richness (Greenlees et al. Reference GREENLEES, BROWN, WEBB, PHILLIPS and SHINE2006). In the longer term, such processes may lead to adaptive change, as in the rapid evolution of beak length in soapberry bugs (Jadera haematoloma) in response to invasive host plant species (Carroll et al. Reference CARROLL, DINGLE and KLASSEN1997). The behavioural impacts of invading species may well be among their most pervasive effects worldwide, and we need field experiments to clarify their importance, and ideally to evaluate the long-term consequences of invader impact on the behaviour as well as the viability of native taxa.
ACKNOWLEDGEMENTS
We thank Ian Cowie from the Northern Territory Herbarium, who identified plants for us, and Greg Clarke, Cameron Hudson and Daniel Natusch for the assistance with fieldwork and the discussions. Iris Bleach provided valuable knowledge on the habits of frogs at Leaning Tree Lagoon. Cyril Milleret provided helpful advice concerning statistics and graphs, and Melanie Elphick proofread the final manuscript. The work was funded by the Australian Research Council, and conducted under permits from the University of Sydney Animal Care and Ethics Committee, and the Northern Territory Parks and Wildlife Service.