Social scientists have long sought to understand the relationship between bureaucratic capacity and the prospects for development. Since about the year 2000, this research agenda has experienced exponential growth, a state of affairs largely attributable to the decision of the World Bank (in 1996) to begin explicitly considering the role of corruption in the success or failure of its lending programmes and the concomitant development of cross-national, perception-based indicators of corruption and bureaucratic professionalism (henceforth referred to as perception-based governance indicators, or PB-GIs). The dissemination of the PB-GIs immediately resulted in a wave of studies examining the ramifications of national-level bureaucratic capacity for aggregate economic growth, a wave which has since given way to a second generation of studies examining the impact of national-level bureaucratic capacity on a host of much more variegated development outcomes.Footnote 1
This article argues that the use of the national-level PB-GIs is not well suited to the aims of this second generation of scholarship. To the degree that bureaucratic capacity matters for the development outcomes in question, it is capacity within a relatively small subset of the constituent units of the bureaucratic apparatus that tends to drive the outcomes of interest. Moreover, capacity as measured by a national-level summary statistic for the entire public sector is an unreliable proxy for capacity within the set of these relevant agencies. The reason that the national-level indicators of capacity, which ostensibly measure the central tendency within the bureaucratic apparatus, do not proxy well for capacity in particular state agencies is twofold: (1) within-country bureaucratic diversity often overwhelms variation encountered across public sectors considered in their entireties; (2) national-level reputations for bureaucratic capacity are not particularly informative about differences in capacity in functionally equivalent agencies in different countries.
The study evaluates the validity of these claims by drawing upon data collected by the author as part of a large-scale survey of public employees conducted in Bolivia, Brazil and Chile from June 2003 to November 2005. The choice of countries included in the study presents a particularly hard test for these hypotheses. This is because the three countries have highly distinctive and well-established national reputations on phenomena such as patronage and corruption, with Bolivia being characterized in the literature as an ideal-typical patrimonial state, Chile characterized as nearly an ideal-typical Weberian state, and Brazil characterized as occupying a middling position between these two extremes. If national-level differences in capacity ever dominate intra-state differences in capacity or are generally informative about the relative performance of specific types of agencies, one would expect this to hold true for this set of cases.
This article's empirical analysis unfolds in four steps. First, the article draws upon the public employees survey data to examine three key components of bureaucratic capacity – the level of politicization of personnel management and routine decision making, the stability of bureaucratic career paths, and formal and informal mechanisms of corruption control – showing that the evidence generally points to greater agency-level differences than country-level differences. Secondly, the article shows that the relative position of any two countries’ national-level reputations on bureaucratic capacity does not, in general, correspond to relative differences in employee perceptions about bureaucratic capacity in comparable agencies found in the two countries. More specifically, the data show that if one compares ‘sister’ agencies (i.e. agencies with similar administrative functions) across two countries, the agency belonging to the country with the superior national-level reputation for bureaucratic capacity is quite often not the agency whose employees are most inclined to perceive their work environment as having Weberian features. Thirdly, as a check on the quality of employee perceptions, the article shows that employees’ perceptions of bureaucratic capacity correspond to patterns of actual behaviour within bureaucratic agencies that are consistent with the perceptions. In particular, the article uses the survey data from Brazil to show that the relationship between having obtained one's post via a public examination (concurso público) and having authority in one's job over the allocation of public contracts, licences and loans varies systematically across agencies in a manner aligned with employee perceptions of bureaucratic capacity. Finally, the article utilizes cross-national data on the onset of banking crises during the 1990s to illustrate the pitfalls associated with using measured associations between a given development outcome and national-level indicators of bureaucratic capacity as a basis for inferring the impact of bureaucratic capacity within the substantively most relevant state agencies on that outcome.
Governance Indicators and the Level of Analysis Problem
In providing an empirically informed methodological critique of the manner in which PB-GIs are used in an important strand of development research, this article contributes to a growing literature which calls into question the inordinate reliance on those indicators in contemporary investigations of the economic and social consequences of state capacity. Existing critiques of the indicators have focused primarily on either their accuracy or conceptual merit.
With respect to the former, a number of studies have argued that perceptions of capacity and actual levels of capacity may differ substantially, especially to the degree that capacity is (inversely) manifested in corruption. In this respect, various works have noted that perceptions of corruption have only a tenuous relationship with the personal experience of corruption, that citizens do not do a very good job of detecting corruption even in projects taking place in their immediate vicinity, that expert opinions about the frequency of citizens’ experiences with corruption do not match up with the actual frequencies, and that the determinants of citizens’ perceptions of corruption are generally different from the determinants of experienced corruption.Footnote 2 Other authors have called into question the accuracy and usefulness of the PB-GIs by suggesting that they exhibit ‘halo effects’, i.e. that they are driven in part by knowledge of past successful development outcomes such as growth.Footnote 3 With respect to conceptual issues, several authors have suggested that some PB-GIs tend to conflate evaluations of particular policies with evaluations of capacity, leading to a distinct (pro-free market) ideological bias in the indicators.Footnote 4 On this same point, others have claimed that certain existing PB-GIs suffer fundamental definitional confusion and fail to tap into distinct aspects of state capacity.Footnote 5
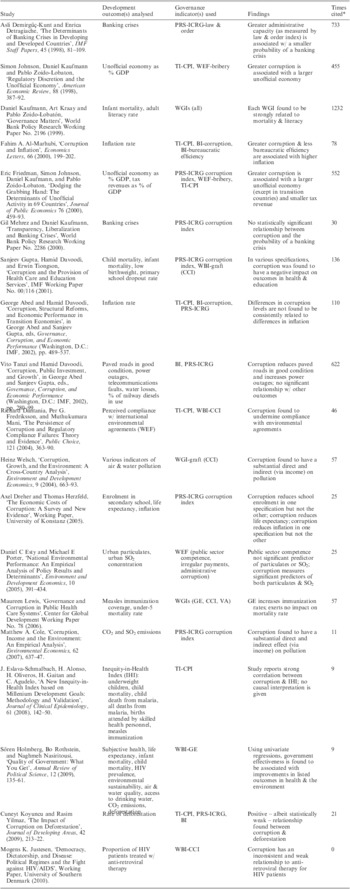
The nature of my critique is quite distinct from those listed above. I do not wish to make the case that there is a fundamental flaw intrinsic to the indicators themselves. Rather, I seek to draw attention to an important level of analysis problem evident in the manner in which they have been employed in the literature. With increasing frequency, students of development utilize the PB-GIs to study the impact of state capacity on outcomes which are primarily shaped by specific subsets of institutions within the public sector and only secondarily, if at all, by others. To give a sense of the frequency of this practice and its scholarly influence, Table 1 lists nineteen studies that draw upon the PB-GIs in this way along with the citation count for each study.Footnote 6 These studies combine for a total of 4,208 citations, a clear testament to the important role they have played in shaping scholarly debate on the relationship between state capacity and development.
Partial List of Studies Using Perception-based Governance Indicators to Examine the Relationship between Bureaucratic Capacity and Narrowly Defined Development Outcomes*

* According to Google Scholar as of 14 May 2010.
The outcomes examined in these works include the presence of banking crises, the inflation rate, indicators of pollution and environmental protection, indicators of citizen health, indicators of citizen education, measures of infrastructure quality, and the size of the unofficial economy. For all these outcomes, it is easy to identify the specific institutions for which capacity should be most important: bank regulators for banking crises, environmental protection agencies for pollution, ministries of health and public hospitals for health outcomes, tax services for the size of the unofficial economy, etc. Yet rather than measuring capacity in the most relevant institutions, these works tap into bureaucratic capacity using only the national-level PB-GIs. Supposing these measures adequately capture the overall central tendency of bureaucratic capacity in a polity, this data collection strategy is equivalent to using the mean level of bureaucratic capacity across agencies in the public sector to proxy for capacity within the relevant agencies.
Is this a legitimate way to draw inferences about whether or not bureaucratic capacity is responsible for variation in the outcomes in question? A brief foray into linear regression theory helps shed light on this question. Suppose that the true relationship between a particular development outcome and bureaucratic capacity is captured by the linear function Yi = α + βXj,i + εi, where i indexes countries, Xj,i denotes capacity within the relevant institution(s) j in country i, and  $ {\Bbb E}[{{{\epsilon}}_i}]\, = \,0 $. Now imagine that the analyst eschews measuring Xj,i and instead uses a measure of average state capacity (across institutions) equal to:
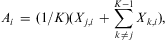 $${{A}_i}\, = \,(1/K)({{X}_{j,i}}\, + \,\mathop{\sum}\limits_{k\, \ne \,j}^{K{\rm{ - }}1} {{{X}_{k,i}}} ),$$
where Xk,i is capacity in institution k ≠ j contained within country i, and K is the total number of institutions. The analyst then performs a linear regression of Yi onto Ai, with the resulting coefficient on Ai equal to  $\tilde{\beta }$. Treating Xj,i and Ai as fixed, the expression for the bias of
 $ \tilde{\beta } $ in this setting is Bias
 $ \left( {\tilde{\beta }} \right)\: = \:{\Bbb E}[\tilde{\beta }]{\rm{ - }}\beta \: = \:\beta (\psi {\rm{ - }}1) $, where ψ is the coefficient on Xj,i in a regression of Ai onto Xj,i.
This simple linear theory derivation tells us that bias will be small in absolute value (implying that the use of Ai in place of Xi is more or less legitimate) under one of two scenarios. The first, rather obvious, scenario would be that each of the Xk,i are close in value to Xj,i for all i, meaning that the central tendency of bureaucratic capacity is a good guide to capacity within the constituent units of the state. In essence, this scenario requires that interstate variation in capacity swamp intrastate variation in capacity. The second scenario is that the Xk,i differ from Xj,i, perhaps substantially, but that there is a near perfect one-to-one correlation between Ai and Xj,i across countries. Substantively, this scenario permits capacity to differ across agencies contained within a given country but requires that the relative placement of agencies be uniform across countries.
In the pages that follow, I use the public employees survey data from Bolivia, Brazil and Chile to underline the implausibility of the two requirements elaborated above: greater diversity in capacity across states than within them and uniformity in the relative placement of (functionally similar) agencies. To anticipate the study's findings, even in a set of cases which are highly likely to encounter evidence in favour of the existence of these conditions, the data point unambiguously in the opposite direction. Thus, it seems highly unlikely that these conditions would hold more generally, implying, in turn, that inferences built around an examination of the link between sector-specific development outcomes and national-level PB-GIs are on fairly shaky ground. Moreover, this article's examination of the onset of banking crises provides concrete evidence of the potentially nefarious consequences of using the aforementioned strategy. In this regard, I have found that the association between crisis and a national-level bureaucratic capacity indicator is actually signed opposite to the association between crisis and an indicator of capacity within bank regulators.
Reputations for Bureaucratic Capacity in Bolivia, Brazil and Chile
Why are Bolivia, Brazil and Chile appropriate cases to study in order to gauge the importance of cross-agency variation in bureaucratic capacity? The stylized facts which emerge from the standard references on bureaucratic performance in these countries point to one important reason: the cases are depicted in the literature as inhabiting sharply distinct positions on a continuum of bureaucratic capacity, with the Bolivian public administration purportedly approaching the neo-patrimonial ideal type, the Chilean public administration purportedly approaching the Weberian ideal type, and the Brazilian public administration typically depicted as occupying a middling position between the two poles. To the extent that we find that intra-state, agency-level variation overwhelms interstate variation in this set of cases, then we will have a strong basis for making the case that analysis of variation in capacity at the agency level deserves a greater place at the academic table than it has heretofore received. Let us consider the standard descriptions of the bureaucracy in the cases.
In order to describe the basic contours of the Bolivian state, observers from the World Bank have made extensive use of the term ‘informality’.Footnote 7 In this regard, the Bolivian public sector is purportedly characterized by the primacy of informal norms and practices over formal rules and standard operating procedures. Entry into the public administration and advancement is supposedly based largely on partisan affiliation, not merit, and the assiduous cultivation of political contacts is characterized as the principal means of rising up the ranks. In this context, the public sector has come to be characterized by high rates of turnover, low morale and low institutional memory.Footnote 8 Most accounts of the Bolivian public administration emphasize that clientelistic relations within the state are hegemonic. As one high-level Bolivian functionary put it to the author in 2003: ‘take 100, subtract the percentage of employees who say their institution belongs to the cuoteo político [the spoils system then orchestrated by Bolivia's traditional parties] and there you have the percentage that are lying.’Footnote 9 In short, the stylized depiction of the Bolivian bureaucracy is one of a homogeneous, inert and inefficient apparatus, long treated as a teat from which patronage-minded parties have suckled.
Academic accounts of the nature and evolution of the Brazilian public administration share certain commonalities with the Bolivian case as well as important differences. The logic of patrimonialism is acknowledged to have installed itself in wide swathes of the Brazilian state and to have had a historically important role in establishing bureaucratic careers.Footnote 10 Not surprisingly, this feature of the Brazilian state has contributed to recurrent bouts of corruption.Footnote 11 However, the Brazilian bureaucracy also exhibits a number of features that would tend to set it apart from the highly patrimonial reputation of the Bolivian bureaucracy. The country exhibits a competitive public examination system for entry into many low-level and mid-level posts and it boasts the existence of a national school of public administration (ENAP). Moreover, in contrast to the Bolivian case, where a high level of informality in the execution of bureaucratic procedures is often pointed to as a symptom of low bureaucratic capacity, students of Brazilian public administration have long argued that, if anything, the country suffers from the opposite type of ailment: excessive and unwieldy legal formalism in personnel management.Footnote 12 Given this apparent coexistence of rigid legalism and clientelistic practices within the same state apparatus, the Brazilian public administration is typically described as one which falls roughly in the midpoint between the extremes of the patrimonial and Weberian ideal types.Footnote 13
Of the three cases in the present study, the Chilean public sector is perceived as most closely approximating the conditions of a highly professional, Weberian bureaucracy. According to observers at the World Bank, the Chilean state ‘is effective in delivering public services, its public servants are professionalized – competent and honest – and its operations are predictable’.Footnote 14 Although journalistic works have occasionally described instances of misproprieties within the Chilean bureaucracy, most discussions of Chilean public administration emphasize that such misbehaviour is more the exception than the rule, and that as a whole the Chilean public administration is well described by the constituent features of the ideal-typical Weberian bureaucracy.Footnote 15 One of the origins of the relatively high level of probity encountered in the Chilean public sector supposedly rests with the considerable power and independence of its supreme auditing institution (SAI), the Comptroller General of the Republic, or CGR.Footnote 16 Historically, a formal examination system has not been utilized as it is in Brazil, although candidates have long been required to satisfy a rather stringent set of educational standards for entry to middle-level and technical posts.Footnote 17
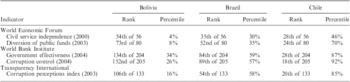
These accounts of bureaucratic quality in the three cases find resonance in various cross-national measures of bureaucratic effectiveness and corruption control. Table 2 presents rankings and percentile values of indicators for the three countries produced by three different organizations: the World Economic Forum, the World Bank Institute and Transparency International. On all of the indicators, Chile scores highest among the three cases, followed by Brazil, which is in turn followed by Bolivia. On the World Economic Forum's indicator of civil service independence (a measure of the independence of the civil service from political pressure), the difference between the Chilean and Brazilian cases is slight. However, for all other indicators – one designed to capture the frequency with which public funds are diverted from their official purposes (WEF), one designed to measure overall government effectiveness (WBI) and two designed to capture overall levels of corruption (WBI and TI) – the Chilean bureaucracy is ranked well ahead of the Brazilian bureaucracy, which in turn, is ranked well ahead of the Bolivian bureaucracy. In fact, Chile typically ranks among the top 30 per cent of all countries on such metrics, whereas Bolivia typically ranks among the bottom 30 per cent and Brazil typically resides close to the median.
Ranking and Percentile of the Three Cases on Cross-national Measures of Bureaucratic Effectiveness and Corruption

Given the very different characterizations of the overall level of bureaucratic quality in the three cases, they provide the study with a unique opportunity to evaluate the claim that differences encountered across institutions in the same polity may be equally or more important than those encountered across entire public sectors. In essence, the use of the three cases here follows in broad strokes the ‘crucial case’ strategy elaborated by Harry Eckstein.Footnote 18 If one finds evidence that the level of institutional diversity within these cases exceeds the diversity encountered between the public sectors considered in their entireties – a surprising finding given the well-established national level reputations of the cases – then it is likely that this state of affairs obtains more generally.Footnote 19
The Public Employees Survey
The public employees survey conducted in Bolivia, Brazil and Chile included 2,859 respondents from thirty different public agencies in the three countries. A concerted attempt was made to select agencies with comparable functions across the three countries. To this end, the survey included agencies responsible for generating government revenue (tax services, customs agencies), agencies responsible for monetary policy and/or supervision of the banking sector (central banks, banking superintendencies), agencies responsible for overseeing infrastructure projects (road services), agencies responsible for managing development projects and agrarian reform (development ministries, social investment funds, land reform agencies), agencies responsible for managing and allocating social security contributions, as well as agencies responsible for regulating the non-bank financial sector (securities and insurance regulators).Footnote 20 All of the institutions selected for inclusion were national-level institutions (municipal or other sub-national level institutions were excluded). Moreover, only employees that worked in the central office of a given institution were included in the survey (regional offices were excluded). Fifty per cent of eligible employees in each institution were chosen at random to participate in the survey (up to a maximum of 250).
The surveys were self-administered and anonymous. They were delivered to and collected from individuals selected for participation in the study by trained undergraduate assistants as well as the author. Response rate by country varied from 69 per cent (Brazil) to 88 per cent (Chile). Response rate by institution varied from 42 per cent to 100 per cent, with the median equal to 81 per cent.
Analysis
The central claims of this article emerge from the application of a distinct statistical procedure (or set of procedures) to the survey data. In what follows, I outline the survey questions utilized in the data analysis and describe the statistical procedures employed.
CLAIM 1: Variation in bureaucratic capacity across agencies is generally greater than variation in bureaucratic capacity across nations.
In order to assess the validity of this first claim, I examine the relative importance of agency-level differences versus national-level differences on individual survey responses to questions concerning the degree of politicization, the stability of career paths, and the strength of corruption control mechanisms in the environments in which public employees work. A variety of questions for each dimension of bureaucratic capacity were included in the analysis: six questions on politicization were examined, along with five different questions on the stability of bureaucratic career paths and three on the strength of formal and informal corruption control measures. The hope was that by analysing responses to diverse questions on each topic, the study would have a basis for conclusions about the relative weight of agency-level versus country-level variation in capacity that would not be overly dependent upon the specific details of question wording.
A statistical procedure developed for drawing conclusions about the relative importance of two or more categorical variables on an outcome of interest is the Bayesian hierarchical ANOVA (BHA) model.Footnote 21 For each question corresponding to each dimension of bureaucratic capacity explored in this article, this is the procedure that I use to assess whether or not the variation in responses attributable to agency-level differences is greater than that attributable to national-level differences. The model is roughly analagous to multivariate regression performed using only batches of binary predictor variables, where each batch corresponds to a particular source of variation in the outcome. However, unlike classical (unconstrained) regression, the BHA model presumes that the coefficients on the indicator variables corresponding to a particular source of variation (a given ‘batch’) are drawn from a common distribution, a normalization which permits one to calculate a separate coefficient for each value of each categorical variable included in the model. As a consequence, the standard deviation of the coefficients on the indicator variables corresponding to a particular source of variation can be used as a measure of the importance of that source of variation for the outcome. With two sources of variation – agencies and countries as studied here – the standard deviations of the coefficients for each source of variation can be compared in order to assess the relative importance of each. Gelman and Hill show that this approach can be fruitfully applied in situations in which one's response data is both normally and non-normally distributed.Footnote 22
In what follows, my statistical inferences concern the relative magnitude of sγ, the finite population standard deviation of the coefficients on the agency indicators, relative to that of sδ, the finite population standard deviation of the coefficients on the country indicators. One benefit of adopting a Bayesian approach in the setting considered here is that it allows the analyst to inspect the simulated posterior density of these two quantities. If the mean value of the marginal posterior density of sγ is greater than the mean value of that of sδ for a given survey question, this implies that the variation in individual survey responses attributable to agency-level differences is greater than that attributable to country-level differences for the question. If the inequality is reversed, this would imply that the opposite is the case. For each question analysed, I use the BHA model to calculate the mean values of sγ and sδ. Moreover, by explicitly comparing values of these two quantities across draws from the simulated posterior, I am able to straightforwardly calculate the probability of the null hypothesis that sδ > sγ (a task which would be substantially more complicated in a non-Bayesian framework). In this way, the Bayesian approach facilitates the crucial task of hypothesis testing.
In the specification of each Bayesian hierarchical ANOVA model, agencies were nested within countries. Moreover, as all of the survey responses analysed were binary or ordinal in form, the ANOVA models were specified using logit or ordered logit link functions to model the relationship between the sources of variation and the responses. The Appendix presents a formal description of the BHA models used in this article, including all of the requisite specification and estimation details.
Before appraising the results, let us consider the question format. The set of questions chosen for analysis has the virtue that it contains a mix of formats which, alternatively, solicit judgements about importance (e.g., ‘To what extent do you agree or disagree with the following statement: Political connections are important in determining who obtains a post in my agency?’), solicit descriptions of behaviour (e.g., ‘Do you have an active role in a political party?’), or solicit explicit comparisons (e.g., ‘Please rank the following four factors in terms of the relative importance of each for dismissals in your agency.’) Relative to a scenario where question format solely prompts generic judgements about importance, the mix of formats utilized here reduces the risk of the results being coloured by national anchoring, i.e. survey responses being determined in part by what respondents believe to be the norm in the country as a whole. Such anchoring is potentially a concern because, were it to have a strong presence in the responses to the questions analysed here, it could lead agency-level variation in responses to swamp national-level variation even if the true amount of variation at the two levels were similar. Fortunately, we know that responses to the behavioural questions are not susceptible to such anchoring, since what is being solicited in these circumstances is a specific aspect of personal experience, not a judgement of any kind which could be clouded by an implicit national baseline. Moreover, the explicit comparison questions are also not likely to be susceptible to such anchoring dynamics, since by prompting only relative evaluations of importance of specific factors for a given bureaucratic task, a common baseline is already built in to the question format. In any case, as the reader will see, the general pattern of greater attributable variation encountered at the agency-level than at the national-level is found across all three question formats, which should mollify concerns that national anchoring or any other pathology tied to question format is driving the results.
Bureaucratic Politicization
I begin by decomposing the sources of variation in responses to questions on bureaucratic politicization. Politicization is understood to be low when the following conditions obtain. First, hiring decisions depend primarily on the education, training and work experience of candidates – and only secondarily or not at all on partisan affiliation or political contacts. Secondly, the criteria for promotions are clearly explained to public employees, and consist primarily of indicators of job performance and/or experience, not on political or personal affinities with superiors. Thirdly, dismissals occur as a result of poor performance or unethical behaviour, and perhaps occasionally as a result of budgetary shortfalls or the shifting priorities of the government. As a rule, dismissals of significant numbers of employees are generally not tied to cabinet reorganizations or the electoral cycle. Finally, the role played by elected officials in relation to the bureaucracy is primarily one of establishing the direction of broad policy initiatives. Political intrusion into the day-to-day implementation of policy is kept to a minimum.
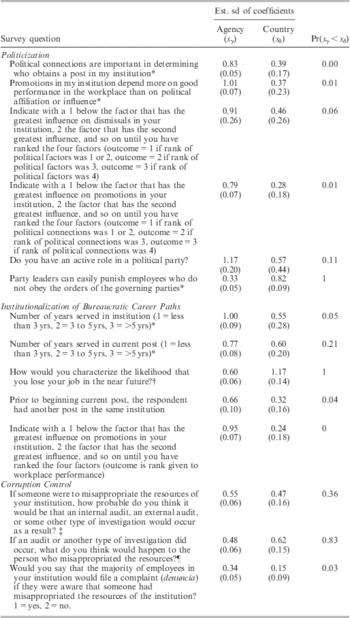
Table 3 presents the results of the BHA analysis. Of the six questions about politicization, four queried respondents about the importance of political criteria in hiring, promotions or dismissals in the agency in which they work. For each of these questions, the variation in responses attributable to agency-level differences was quite large (sγ parameters estimated to be in the 0.8–1.0 range). Moreover, for all such questions the standard deviation of the coefficients on the agency indicators was greater than that of the country indicators (sδ parameters estimated to be in the 0.3–0.5 range), thus indicating that agency-level differences were a more important source of variation in responses than country-level differences. By and large, the differences in the quantities of interest were statistically significant by conventional standards: the probability of the null hypothesis of greater variation in responses attributable to country-level differences than agency-level differences was estimated as being less than 0.01 for three of these questions and 0.06 for the fourth.
Two-way Analysis of Variance for Questions on Politicization, the Institutionalization of Bureaucratic Career Paths, and Corruption Control

Notes: Standard deviations in parentheses. Due to the absence of responses in certain categories, the Brazilian agency ANTT was removed from the analysis. *1 = strongly agree, 2 = agree, 3 = disagree, 4 = strongly disagree. †1 = ‘highly probable’ or ‘probable’, 0 = ‘improbable’ or ‘highly improbable’. ‡ 1 = highly probable, 2 = probable, 3 = improbable, 4 = highly improbable. ¶ 1 = the person would probably be judged in a court of law and sanctioned, 2 = the person would probably be judged in a court of law but not sanctioned, 3 = the person would probably neither be judged in a court of law nor sanctioned.
One question in this series asked respondents if they would classify themselves as playing an active role in a political party. The variation in responses to this question attributable to both agency-level and country-level differences was quite large (with Bolivian public employees more likely to be partisan activists than their Brazilian or Chilean counterparts). Yet the agency-level component of variation was nevertheless twice as large as the country-level component: the estimated (mean) value of sγ for this question was equal to 1.2, whereas the estimated value of sδ was 0.6. It would thus seem that, while differences in the intensity of patronage politics across countries are important, the differences across agencies may be even more so.
The only question on politicization for which country-level differences clearly swamped agency-level differences as a source of variation was one that prompted respondents to denote the extent to which they agreed or disagreed with the proposition that ‘party leaders can easily punish functionaries who do not obey the orders of the governing parties’. The Bolivian respondents clearly stood out in this regard, with 88 per cent of respondents responding that they ‘strongly agreed’ or ‘agreed’ with the proposition, as opposed to 62 per cent and 66 per cent of the Brazilian and Chilean public employees, respectively, who responded in this way.Footnote 23 All told, perceptions about the sanctioning capacity of party leaders aside, most aspects of politicization appear to vary more across the agencies included in this study's sample than across the countries.
Stability of Bureaucratic Career Paths
An important component of Weberian bureaucracy is the existence of stable career paths which permit employees to cultivate knowledge and skills conducive to the efficient functioning of their institutions as well as promotion criteria tied to performance in the workplace. The questions included in this series queried respondents about the number of years they had served in their agency, the number of years they had served in their current post, the likelihood they would assign to losing their job in the near future, whether they had been recruited for their current job internally, and the importance they believe workplace performance holds for promotions in their agency. Agency-level differences were highly relevant as a source of variation in responses to these questions (sγ parameters in the 0.6–1.0 range).
In four of the five questions contained in this set, the variation attributable to agency-level differences was found to be greater than that attributable to country-level differences. For three out of these four questions, in turn, the null hypothesis of greater variation in responses attributable to country-level differences than agency-level differences could be rejected using standard thresholds of statistical significance. For only a single question in the series (the one which prompted employees to assess the likelihood of job loss in the near future) was the variation attributable to country-level differences found to be greater than that attributable to agency-level differences. In this instance, one again finds a large ‘Bolivia effect’: 68 per cent of respondents in Bolivia indicated that it was ‘highly probable’ or ‘probable’ that they would lose their jobs in the near future, compared to 18 per cent and 40 per cent of Brazilian and Chilean respondents, respectively.
Strength of Corruption Control Measures
A final series of questions explored respondents’ perceptions about the strength of formal and informal corruption control mechanisms. These questions asked respondents to assess the likelihood of an internal or external investigation being opened in response to a hypothetical misappropriation of resources, the likelihood of a legal sanction being imposed upon the guilty party if an investigation did occur, and whether the respondents’ colleagues would be likely to serve as whistleblowers if they were privy to an act of malfeasance.
In general, agency-level differences were less relevant as a source of variation in responses in this category of questions than those on politicization and the stability of bureaucratic career paths (sγ parameters in the 0.3–0.6 range). For two of the three questions, the variation in responses attributable to agency-level differences outweighed that attributable to country-level differences (although only in one case – the question on colleagues’ willingness to be whistleblowers – were the differences in attributable variation statistically significant by conventional standards). For the question on the likelihood of legal sanction given an investigation into malfeasance, the importance of country-level differences marginally trumped that of agency-level differences. Given that the question taps largely into perceptions of the competence of the public prosecutor's office and/or judiciary, both national-level features of the legal environment, this finding is not particularly surprising. Rather, what would seem to be most noteworthy about the responses to this question is the similarity in the levels of variation attributable to country-level and agency-level differences.
All told, public sector bureaucrats’ responses to questions about politicization, the stability of bureaucratic career paths, and corruption control mechanisms in their work environment in Bolivia, Brazil and Chile appear to be driven at least as much by the particular characteristics of the agency to which they belong as by the contours of the national-level bureaucratic apparatus in which the agency is located. This is not to suggest that there are not exceptions to this pattern – both in terms of their perceptions of (a lack of) autonomy vis-à-vis party leaders and in terms of their subjective assessments of the likelihood of job loss in the near term, Bolivian public employees plainly stand out from their counterparts in Brazil and Chile. Nevertheless, the weight of evidence provided in Table 3 clearly points to a pattern of greater attributable variation in responses due to agency-level differences than national-level differences.
Potential Objections
At least two potential objections could be raised to my strategy of using data from a survey of public employees to gauge the relative magnitude of cross-national versus cross-agency differences in bureaucratic capacity. First, it could be argued that there may exist a generalized tendency among public employees to describe their agencies in a manner which conforms to the stereotype of a high performance institution, irrespective of their agencies’ true performance levels. This could potentially be due to concerns about making one's agency look bad (perhaps leading to a reduced budget in the future if negative survey results are publicized) or it could be due to a psychological drive to feel that one is among the best in the public sector. Secondly, and relatedly, it could be argued that public employees working in agencies that are clearly suffering from various manifestations of low bureaucratic capacity may choose not to participate in a survey which would lead them to divulge information about such a sorry state of affairs, presumably for the same reasons articulated above.
While I believe issues of misrepresentation and non-response are legitimate and important concerns in public employee surveys as a general matter, it is fairly straightforward to show that they do not constitute a serious threat to the results presented above. Consider the first objection. If the stated tendency was operative, cross-agency variation in responses would be fairly muted (creating a bias against a finding in favour of Claim 1) and even the worst-performing agencies on a given survey question would not perform particularly poorly in an absolute sense. In fact, the statistical analyses above have already shown that cross-agency variation is generally quite large. Moreover, the survey results can be inspected directly to assess whether there is any reason to believe that respondents are reticent to cast their agencies in an unfavourable light.
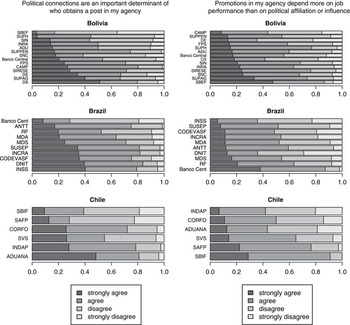
Figure 1 is instructive in this regard. Presenting the responses to two questions on politicization of personnel matters, the figure provides a clear sense of both the large agency-level diversity that exists within countries and the general willingness of respondents to describe their agencies in often starkly negative terms. In fact, many employees were more than willing to provide responses that cast their agency in the worst possible light. For instance, 51 per cent of respondents in Bolivia's Ministry of Sustainable Development, 48 per cent of respondents in Chile's Customs Service, and 40 per cent of respondents in both Brazil's National Department of Infrastructure and Transport and its Social Security Institute indicated that they strongly agreed that political connections were important for hiring decisions within their institutions. With respect to factors that influence promotions, 59 per cent, 57 per cent, 64 per cent and 64 per cent, respectively, of the respondents in these same institutions stated that they disagreed or strongly disagreed that workforce performance was more important than political affiliation or influence. Responses to other questions (not shown in the figure) illustrate the same point. Asked to rank the importance of political factors in dismissals (relative to poor job performance, unethical behaviour and insubordination), more than 70 per cent of respondents in Bolivia's Ministry of Sustainable Development, Ministry of Economic Development and Ministry of Peasant Affairs all ranked this factor as most important, as did 56 per cent of respondents in Brazil's National Department of Infrastructure and Transport. These types of results are clearly inconsistent with the notion the bureaucrats are inherently predisposed to protect the reputation of their agencies through their survey responses.
Agency-level diversity in each polity in perceptions of politicization of personnel matters

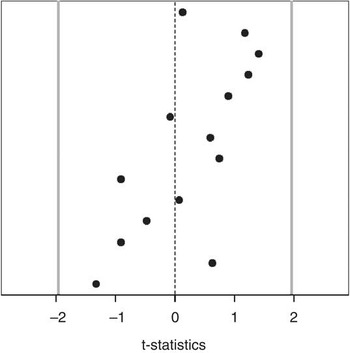
Now consider the second objection. As before, if the behavioural tendency identified by this objection was indeed operative, then one consequence would again be muted cross-agency variation in responses, because those individuals with negative opinions and experiences would not be inclined to participate in the survey; clearly, this is not what the study finds. Another consequence would be that agency-level response rates should be strongly associated with bureaucratic capacity measures across the three dimensions discussed above, since employees in poorly performing agencies would be less inclined to participate. This second implication can be evaluated directly. To conduct such an evaluation, I performed a series of pairwise regressions which regressed the agency-level response rate on the agency-level average value of the responses to each question listed in Table 3. I then examined the t-statistics corresponding to the coefficient on the average responses at the agency-level, which are presented in Figure 2. If the employees’ inclination to participate in the survey was an underlying function of the level of bureaucratic capacity within their agencies, one would expect a number of these t-statistics to be greater than 1.96 in absolute value (the standard threshold for statistical significance). As the figure illustrates, there was not a single question in Table 3 for which this was the case. Thus, concerns about non-participation being driven by bureaucratic capacity appear to be unfounded in the dataset studied here.
T-statistics from pairwise regressions of agency-level response rates on agency-level average responses to questions about bureaucratic capacity Note: Black circles denote t-statistics corresponding to the coefficient on (the average value of) responses for a given question about bureaucratic capacity. Vertical gray lines denote the 95% threshold for statistical significance.

CLAIM 2: The relative position of countries’ national-level reputations for bureaucratic capacity by and large does not correspond to differences in perceptions about capacity for employees who belong to different countries but serve in agencies that perform the same function.
Simply because I find evidence of greater agency-level variation in responses to questions about bureaucratic capacity than country-level variation, it does not necessarily follow that studies which use national-level indicators of capacity to explain development outcomes shaped largely by a small subset of bureaucratic agencies are misguided in their approach. One potentially reasonable response to my findings would be to admit that although agency-level variation in capacity is large – perhaps generally greater than country-level variation – yet claim that the variation in capacity that one finds across agencies within a given country tends to follow the same pattern across countries. More specifically, one could argue that the position of particular types of agencies in the overall distribution of capacity is relatively consistent across countries, where ‘type’ refers to administrative function (e.g. road services are always politically penetrated and thus have low capacity relative to other agencies in a country; central banks are usually autonomous and thus have high capacity relative to other agencies in a country). If this is indeed the case, and if the distribution of capacity has the same basic shape across countries, then it would follow that the ranking of countries on mean values of bureaucratic capacity would be equivalent to the ranking of countries on the capacity of agencies of a particular type. In other words, one could claim that a road service in a high capacity state always has greater capacity than a road service in a low capacity state, a central bank in a high capacity state always has greater capacity than a central bank in a low capacity state, and so forth. Were this true, then using national-level measures of capacity as proxies for capacity in specific parts of the public sector would not be as problematic as this article would have it seem.
The analysis conducted in this section is designed to assess the reasonableness of this response to the findings presented above. My evaluation proceeds in two steps. First, in the interest of economy of presentation, I estimate Weberianness Perception Scores (WPSs) for each respondent in the survey using a Bayesian factor analytic technique appropriate for observed variables that are ordinal in form. The WPSs provide a one-dimensional summary measure of the degree to which each respondent perceives his work environment as conforming to the characteristics of an ideal-typical Weberian bureaucracy. Secondly, I examine differences in the distributions of the WPSs across pairs of ‘sister agencies’: agencies in different countries that execute similar tasks. In so doing, this article is able to gauge whether differences in the distributions of perceptions of bureaucratic capacity held by employees in different countries but in agencies with the same administrative function correspond to the countries’ national-level reputations for capacity embodied in the PB-GIs.
Generating the Weberianness Perception Scores
The WPSs are constructed using responses for each of the subjective (perception-oriented) questions presented in Table 3. The responses to all of these questions have a very important feature in common. They can all be thought of as observable manifestations of a single latent (unobservable) factor: the survey respondent's belief about the degree to which the environment in which he works approximates the Weberian ideal-type of stable, meritocratic bureaucracy. Given the conceptualization of the survey responses as emanating from this factor (and given the fact that the observed responses are ordinal in form), I use the tools of item response theory to estimate the perception scores. In particular, I use the two-parameter ordinal item response model with a probit link function to model the relationship between the ‘manifest’ variables (the survey responses) and the latent variable (perceptions of ‘Weberianness’).Footnote 24 My approach to estimation of the model was Bayesian, and, in particular, followed a strategy developed by Kevin Quinn.Footnote 25 The Appendix presents the posterior density summary and estimation details for the model.
Comparing ‘Sister’ Agencies
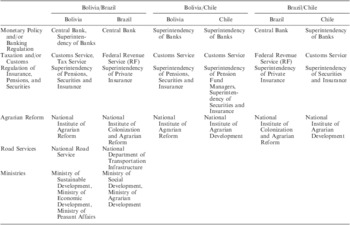
Table 4 specifies the institutional pairings for each comparison of sister agencies across countries. The scores for more than a single agency were pooled in cases in which multiple agencies perform the task(s) denoted under the category heading. In Brazil, for instance, both monetary policy and banking regulation fall under the purview of the central bank, whereas in Bolivia these two activities are the separate domains of the central bank and superintendency of banks, respectively. Thus, in comparing employee perceptions of bureaucratic capacity in agencies dealing with monetary policy and banking regulation, the scores for the two Bolivian institutions are pooled. Instances in which such pooling was necessary should be clear from the table.
Sister Agencies (as Determined by Administrative Function)

Figure 3 compares the distributions of employee perceptions in the paired ‘sister agencies’ using quantile–quantile (Q–Q) plots. For any two countries, the QQ plots present the quantiles of the distribution of the WPSs for individuals who belong to the agency (or agencies) of the indicated type in one country plotted against the quantiles of the distribution of the WPSs for individuals who belong to the agency (or agencies) of the indicated type in the other country. To the degree that the observations in the plot are arrayed on or close to the 45° line, this constitutes evidence that the distributions of perception scores for individuals in agencies of the indicated type in the two countries are similar to one another. If the observations arrayed in the plot lie above (below) the 45° line for certain ranges of the WPS, this indicates that there is a greater concentration of scores in those ranges for the country indicated on the y axis (x axis) than the country on the x axis (y axis). In each plot contained in the figure, the country with the reputation for higher bureaucratic capacity is located on the x axis. Therefore, any plot in which observations are concentrated below the 45° line constitutes support for the hypothesis of greater perceptions of capacity in the agency or agencies belonging to the country with the better national-level reputation for capacity, whereas any plot in which observations are concentrated above the 45° line constitutes support for the hypothesis of greater perceptions of capacity in the agency or agencies belonging to the country with the worse national-level reputation for capacity.
Q–Q plots of perceptions of Weberianism in sister institutions (as determined by administrative functions). Note: See Table 4 for the list of agencies being compared in each plot: p-val K–S test refers to the probability of the null hypothesis that the distributions of the factor scores being compared are equal (according to the two-sample Kolmogorov–Smirnov test).

Out of the fourteen paired comparisons of sister agencies presented in the figure, only for eight could one definitely conclude that the distribution of perceptions differed across the two groups (based on the two-sample Kolmogorov–Smirnov test for the equality of distributions). Of these eight cases, perceptions of bureaucratic professionalism were evenly split: in four instances they were found to be higher in the agencies belonging to the country with the better national-level reputation for capacity and in four instances they were found to be lower in the agencies belonging to the country with the better national-level reputation for capacity. For the four categories of agency type which permitted comparisons of sister agencies across multiple pairs of countries, in no instance do the national-level reputations for bureaucratic capacity correctly predict the differences in perceptions of Weberianness for all country pairs. All told, this analysis should lead one to doubt the claim that relative differences in national-level measures of bureaucratic capacity adequately capture differences across nations in capacity within particular types of state agencies.
CLAIM 3: Employee perceptions of bureaucratic capacity correspond to patterns of actual behaviour within bureaucratic agencies that are consistent with the perceptions.
A potentially reasonable objection to the findings of the previous section could be that employee perceptions of professionalism and actual professionalism may be two different things. In particular, one could argue that perceptions of capacity swing widely across agencies within a given country but actual levels of professionalism do not. In order to address such concerns, in this section I examine the extent to which the one-dimensional Weberian Perception Scores are informative about actual patterns of behaviour within state agencies.
One crucial aspect of bureaucratic behaviour consists of staffing decisions for posts whose duties entail the selection of firms that will receive public contracts, government licences or government-backed loans. Because the choices made by individuals in such posts may greatly affect the profitability of private firms, opportunities for corruption commonly arise for their holders. Whether or not these opportunities for corruption translate into actual corruption depends in part on how the slots for such posts are filled. In this regard, a wealth of evidence drawing upon myriad forms of data (cross-national, agency-level narrative case studies) has shown that meritocratic recruitment procedures are associated with a lower incidence of corruption among bureaucrats in the developing world.Footnote 26 Given this state of affairs, one would expect that public agencies which have high levels of professionalism would have very different types of recruitment processes for the aforementioned posts than public agencies with low levels of professionalism. Specifically, one would expect that highly Weberian agencies would be characterized by recruitment procedures for these posts that emphasize the technical merit of candidates and eliminate any sense of indebtedness to political patrons, whereas more patrimonial agencies would be characterized by recruitment procedures that give technical merit short shrift and intensify candidates’ sense of indebtedness to patrons.
The logic undergirding this expectation is easy to articulate. In the more professional agencies, administrators will seek to organize hiring practices so as to minimize the incidence of corruption, especially in those posts where the financial consequences of corrupt behaviour are the greatest, since – as administrators in a Weberian environment – their prestige and advancement depends upon the efficient use of resources within their agency. In the more patrimonial agencies, often effectively cash cows for political parties, the incentives of administrators will be exactly the opposite: they will seek to organize hiring processes in order to encourage acts of corruption, since they and/or their party will anticipate sharing in the proceeds of this activity. In operational terms, what this discussion implies is that if the perceptions of bureaucratic capacity represented by the WPSs are informative about the true Weberian–patrimonal nature of public agencies, then agencies should differ in their recruitment procedures for these posts in a manner in keeping with the perception scores: agencies with high scores (Weberian) filling these posts through meritocratic procedures and agencies with low scores (patrimonial) filling these posts through non-meritocratic procedures.
Fortunately, the Brazilian component of the public-employee survey allows the study to test this proposition in a direct way. Each respondent was asked if his job ‘involved decisions regarding the content of contracts between private firms and public institutions’ and, subsequently, whether his job ‘involved decisions regarding licences or loans conceded to private firms or citizens’. One third of employees responded in the affirmative to the first question and 12 per cent did so for the second. The survey also asked respondents whether they had obtained their posts through a public examination. This was clearly the modal form of entry in Brazil: approximately three quarters (72 per cent) of Brazilian respondents declared that they had obtained their post in this way.
Using the responses to the former set of questions as dependent variables, the study specified two logistic regression models, one specifying the relationship between having taken a public examination and the likelihood of having a post which involves control over contracts, and the other specifying the relationship between having taken a public examination and the likelihood of having a post which involves control over licences and loans. The models have two important features. First, they include a full set of agency dummy variables, thus accommodating the fact that employee duties in some agencies are much more likely than in others to include the allocation of contracts, licences and loans. Secondly, they permit the impact of having taken a public examination to vary according to the type of agency in which a respondent works.
By agency type, I refer to the level of bureaucratic professionalism as represented by the Weberianness perception scores. Because the number of observations per agency was limited, agencies were divided into two types: agencies for which the WPS for the median employee in the agency is low (‘low WPS’ agencies; these correspond to a low level of bureaucratic professionalism), agencies for which the WPS for the median employee in the agency is at a moderate or high level (‘high WPS’ agencies; these correspond to a relatively high level of bureaucratic professionalism). Based on the median WPS in each agency, three agencies were placed in the first category (DNIT, INSS, SUSEP; median WPS equal to −0.70, −0.42 and −0.36, respectively) and seven in the second (MDS, INCRA, MDA, CODEVASF, ANTT, RF, BCdoB; range of median WPSs −0.20 to 0.86).
Let i subscript respondents and j∈{1, …, J} subscript agencies. Each model was specified as Pr(yi = 1) = logit−1(vi), where
 $${{v}_i}\: = \:\mu \: + \:\mathop{\sum}\limits_j^{J{\rm{ - }}1} {{{\gamma }_j}{{a}_i}(j)\: + \:\phi {\rm{exa}}{{{\rm{m}}}_i}\: + \:\lambda ({\rm{exa}}{{{\rm{m}}}_i}\:\times \:{\rm{low}}{\rm{.WP}}{{{\rm{S}}}_i}} )\: + \:{{{\bf {{X}}}}_i}\beta, $$
yi is the response of respondent i, μ is an intercept term, ai(j) is an indicator variable equal to 1 if individual i belongs to agency j, 0 otherwise, γj captures the effect on the response of membership in agency j relative to the omitted agency (ANTT), exami is an indicator variable equal to 1 if individual i had taken a public examination, 0 otherwise, low.WPSi is an indicator variable equal to 1 if individual i belonged to one of the three more weakly professionalized agencies, 0 otherwise, φ captures the effect on the response of having taken an examination for members of the more professionalized agencies, φ + λ captures the effect on the response of having taken an examination for members of the relatively weakly professionalized agencies, and Xi represents confounding variables.
If the WPSs truly tap into an actual Weberian–patrimonial dimension, one would expect to find that φ > 0 and that φ + λ < 0. That is to say, the effect of having taken a public examination on the likelihood of having a post with substantial control over the allocation of valuable benefits to firms should be positive in the more Weberian agencies and negative in the more patrimonial agencies.
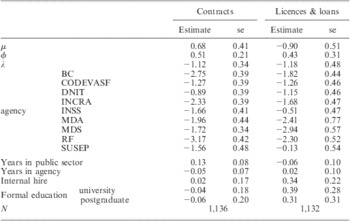
Table 5 presents the results of the analysis. As expected, in the low WPS agencies having taken a public examination is negatively and statistically significantly related to authority over contracts and authority over licences and loans. Also as expected, in the high WPS agencies one finds that having taken a public examination is positively related to authority over contracts and authority over licences and loans (although the impact is statistically significant only in the case of contracts). The analysis revealed quite a bit of variation across agencies in terms of the likelihood of functionaries controlling access to state benefits; not surprisingly, Brazil's National Agency of Land Transport (ANTT) and the National Department of Infrastructure and Transport (DNIT) stood out as agencies particularly likely to have employees with some control over public contracts. The only confounder with a statistically significant impact on the outcomes of interest was the number of years served in the public sector, which was positively related to having authority over contracts.
Logit Models of Relationship between Public Examinations and Authority over Public Contracts, Licences and Loans

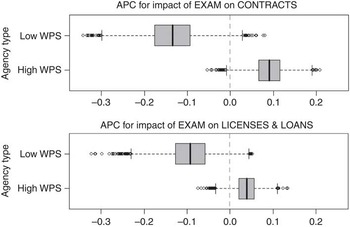
In order to provide the reader with a sense of the magnitude of the effect of having taken a public examination on authority over the allocation of state benefits, Figure 4 presents boxplots of the average predictive comparisons (APCs) associated with having taken an examination for low WPS agencies and high WPS agencies.Footnote 27 The APC is a measure of the average effect of having taken a public examination for individuals within the indicated type of agency. In the case of authority over public contracts, the differences in the APCs for the low WPS agencies and the high WPS agencies were quite large. Within the former, the APC was estimated as −0.13 whereas in the latter, the APC was estimated as 0.09. In layman's terms, this means that, on average, having taken a public examination was associated with a 0.13 reduction in the probability of having authority over contracts in the agencies perceived of as faring relatively poorly on professionalism by their employees, whereas having taken a public examination was associated with a 0.09 increase in the probability of having authority over contracts in the agencies perceived of as being at a moderate or high level of professionalism by their employees. For the case of authority over licences and loans, the APC associated with having taken an examination in the low WPS agencies was −0.10, whereas in the high WPS agencies the value of this statistic was estimated as 0.04.
Estimated average predictive comparisons for the probability of having authority over public contracts (upper panel) and the allocation of licences and loans (lower panel) as a function of having one's job through a public examination (Brazilian agencies only). Note: Impact of having obtained one's post via a public examination on authority over contracts, licences and loans is allowed to vary in the logistic regression models across two agency types: agencies with low Weberian perception scores (DNIT, INSS) and agencies with high perception scores (BCdoB, RF, ANTT, CODEVASF, INCRA, MDA, MDS). Displayed in the figure are the estimated average predictive comparisons associated with having taken a public examination, broken down according to agency type.

In sum, bureaucrats’ perceptions about the level of professionalism in the agencies in which they work correspond to important behavioural manifestations of bureaucratic capacity. Agencies which were perceived to lack many of the key components of Weberian bureaucracy were relatively unlikely to place authority over potentially exploitable state benefits in the hands of employees who had gone through a competitive examination process, whereas agencies with a greater correspondence to the Weberian ideal type were relatively likely to place this authority in the hands of employees who had gone through such a process.
Comparing Agency-level and Omnibus Measures of Bureaucratic Quality in the Study of Banking Crises
Utilizing the public employees survey data from Bolivia, Brazil and Chile, I have thus far shown that the assumptions which would justify the use of national-level measures of bureaucratic quality to study sector-specific development outcomes are likely to be generally invalid. In this final empirical section of the article, I take the next logical step and empirically demonstrate the pitfalls which may be associated with substituting an omnibus measure of bureaucratic quality in place of the appropriate agency-level one. I do so by examining an issue of considerable importance for the developed and developing world alike: the onset of systemic banking crises.
An examination of banking crises is well suited to my aims in this article for two reasons. First, to the degree that bureaucratic quality plays a role in the incidence of such crises, it is fairly clear which component of the bureaucratic apparatus should be most important, namely, the bank supervision authority. This is so practically by definition – one of the explicit mandates of such institutions is to perform the oversight activities necessary to ensure that banking crises do not occur. Secondly, high quality datasets have been assembled on the incidence of major banking crises as well as the legal and behavioural characteristics of bank supervision authorities around the world. This makes it possible to compare explicitly the associations between bank crises and measures of bureaucratic quality in supervision authorities versus associations between crises and measures of the quality of the bureaucracy as a whole. Recall that my central admonition in this article is that the impact of bureaucratic quality at the national level may be unreflective of the impact of bureaucratic quality within the particular institutions that matter the most for a particular fine-grained development outcome. An examination of banking crises allows the paper to assess – in a focused way – if this is an admonition whose violation has substantively important consequences.
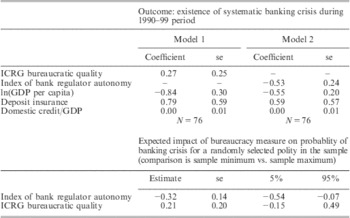
In operational terms, the outcome examined here consists of an indicator variable denoting the presence of a systematic banking crisis during the 1990–99 period. The variable is drawn from the World Bank's Database of Banking Crises, which defines a systemic banking crisis as a scenario in which any of the following occur: (1) emergency measures are taken to assist the banking system; (2) large-scale nationalizations of banks take place; (3) non-performing bank assets reach at least 10 per cent of total assets; (4) banking sector rescue operations take place at a cost of at least 2 per cent of gross domestic product (GDP).Footnote 28
I seek to compare the association between this outcome and an omnibus (national-level) measure of bureaucratic quality to the association encountered between this outcome and a suitably chosen measure of bureaucratic quality within bank supervision authorities, in both cases conditioning on a small set of covariates likely to exert an independent impact on the emergence of banking crises. The omnibus measure of bureaucratic quality I utilize is drawn from the Political Risk Service's International Country Risk Guide (ICRG). It is equal to the average value of the variable ‘bureaucratic quality’ measured in December 1990 and December 1991.Footnote 29 ICRG's measure is the only omnibus indicator of bureaucratic quality available prior to the onset of banking crises in the 1990s (and thus has the virtue of being uncontaminated by negative halo effects). In order to measure bureaucratic quality within the bank supervision authority, I created an indicator of bank regulator autonomy designed to reflect institutional and behavioural conditions within such agencies that make them less susceptible to capture by politicians and private sector actors. The indicator is based upon entries contained in Barth, Caprio and Levine's Bank Regulation and Supervision Database.Footnote 30 It is an additive index, ranging in value from 0 to 3, which is made up of three component factors. The first is a binary variable equal to 1 if the head of the supervision agency is appointed by another member of the bureaucracy (such as the head of the Central Bank), and not by political authorities such as the president, the parliament or a king (0 otherwise). The second is a binary variable equal to 1 if the head of the supervision agency cannot be directly dismissed by the aforementioned political authorities (0 if she can). The final component is a binary variable equal to 1 if, based on survey responses of national bank supervisory authorities, the supervision agency is characterized as one in which bank supervisors do not frequently work in the banking industry after leaving their jobs as regulators (0 if they frequently do work in the banking industry after leaving their jobs). Given these coding rules, higher levels of the index indicate greater levels of functional autonomy from the demands of political elites and banks than do lower levels. The covariates I utilize consist of the logarithm of GDP per capita in 1990, the amount of domestic credit provided by the banking sector as a percentage of GDP in 1990, and an indicator variable denoting the existence of a deposit insurance law in force during the 1990s.Footnote 31
With this data in hand, I proceeded to conduct two logistic regression analyses, one which regressed the banking crisis indicator onto the ICRG measure of bureaucratic quality and covariates and another which regressed the banking crisis indicator onto the bank regulator autonomy measure and covariates. Table 6 presents the results of these regressions. The most important aspect of the table concerns the value of the coefficients on the two bureaucratic quality variables. In the model in which ICRG measure was utilized as an explanatory variable, the coefficient on this variable was statistically insignificant and of the ‘wrong’ sign (i.e. it was positive, indicating that higher bureaucratic quality increases the probability of a banking crisis). In the model in which the indicator of bank regulator autonomy was instead utilized as an explanatory variable, the coefficient on this variable was negative and statistically significant at conventional levels, indicating that low bureaucratic quality within bank supervision authorities was an important predictor of the outbreak of a systematic banking crisis in the 1990s.
Logit Models of Bureaucratic Quality and Systematic Banking Crises in the 1990s (Bank Regulator-specific Measure Compared to Omnibus Measure)

Thus, in this example, the use of a focused, agency-specific measure of bureaucratic quality versus an omnibus measure of the same makes all the difference in the world in terms of drawing conclusions about the relevance of state capacity for the health and stability of the financial sector. Use of the former would erroneously lead an analyst to conclude that bureaucratic quality was irrelevant for the onset of banking crises in the 1990s, or worse, that it actually somehow had a stimulative effect on such crises. In contrast, when a reasonable agency-level measure is utilized, it becomes immediately clear that bureaucratic quality – operationalized here as institutionalized autonomy from political and private sector capture – did in fact appear to dampen the likelihood of crisis during this period.
The difference in conclusions that one would reach based upon the use of one measure or the other is not just a matter of sign and statistical significance but also one of deep substantive importance. Drawing upon the estimated regression models, the bottom section of Table 6 presents the expected impact of each bureaucracy measure on probablity of banking crisis for a randomly selected polity in the sample. In order to calculate these estimates, the bureaucracy measures were varied from their sample minimum values to their sample maximum values. The table reports that such a change in the index of bank regulator autonomy would be expected to produce a reduction in the probability of a banking crisis of 0.32 for a randomly selected polity in the sample. A similar change in the ICRG bureaucratic quality index would be expected to produce an increase in the probability of a banking crisis of 0.21 for a randomly selected polity in the sample, although in this case the large confidence intervals around the estimate do not permit one to exclude the possibility of zero impact.
The take-home point of this exercise is this: if an analyst or policy maker were to rely naïvely upon the national-level measure of bureaucratic quality, she would be wrongly led to believe that improving the professionalism and capacity of bank regulators is not likely to reduce the incidence of banking crises. Were she to use the more appropriate agency-level measure, she would discover that the professionalism and capacity of bank regulators is likely to have significant impact in reducing the incidence of such crises. Empirical analyses based upon the presumption that the behaviour of the mean bureaucratic agency reflects that of those agencies most relevant to the problem at hand can lead analysts profoundly astray.
Conclusion
The existence of significant within-country variation in bureaucratic performance has long been reflected in important work produced by political scientists and the larger development community.Footnote 32 Nevertheless, students of development have become increasingly inclined to rely upon national-level PB-GIs in producing assessments of the impact of bureaucratic capacity on a whole host of fine-grained development outcomes. In cases where the outcomes in question are likely to be driven substantially more by certain state agencies than others, I have argued that reliance upon the national-level PB-GIs may ultimately lead to faulty inferences about the impact of bureaucratic capacity. Drawing primarily upon data on bureaucratic performance in Bolivia, Brazil and Chile, I have attempted to evaluate the reasonableness of approaches that rely upon national-level measures of bureaucratic capacity by carefully examining the empirical veracity of the implicit assumptions that national-level differences in capacity outweigh those found at the agency level and that such differences correspond to differences in the performance of specific types of agencies.
The verdict of the article is straightforward on these points. Agency-level differences in capacity generally appear to outweigh national-level differences. For the vast majority of survey questions tapping into aspects of bureaucratic capacity such as politicization, the stability of bureaucratic career paths, and corruption control, an employee's response depended more on the particular agency in which he worked than on the country in which he resided. Moreover, I have shown that the capacity of agencies performing similar functions in different countries often did not reflect the national-level reputation for capacity of the countries to which they belonged. In other words, agency-level differences in capacity across countries were not predictable based on the national-level reputations for capacity. Although there can be no guarantee that these findings will hold for a larger sample of countries than those considered here, the fact that Bolivia, Brazil and Chile have such radically different reputations for bureaucratic effectiveness at the national level suggests that this is likely to be the case.
The substantive importance of these findings was emphasized by an examination of data on banking crises in the 1990s. Explicitly assessing the validity of utilizing a national-level omnibus measure of bureaucratic capacity in place of a measure designed to tap into bureaucratic capacity within the most substantively relevant agency, I have found that the association between bureaucratic capacity and crisis using the omnibus measure was completely unrepresentative of the association between crisis and the more appropriate agency-level measure. Thus, the findings of the article suggest that not only are the assumptions which would justify the use of mean-level measures of capacity in place of agency-level ones not likely to be met in practice, but that the inferences gleaned from doing so may be highly misleading.
Although the tenor of this article is certainly critical of the often indiscriminant use of national-level PB-GIs in the literature on the political economy of development, it is important to emphasize that their use is not necessarily inappropriate for studying all the types of development outcomes that may be of interest to social scientists. Rather, the appropriateness of their use ultimately rests on the scope of the dependent variable being examined. On one hand, finely grained development outcomes which are logically tied much more strongly to bureaucratic capacity within a specific subset of the agencies contained within the bureaucratic apparatus than to others are clearly not good candidates for the use of these omnibus indicators. In these cases, political scientists would do well to identify the state agencies most relevant for the outcome of interest and attempt to measure capacity within these directly, rather than assuming that national-level measures of capacity adequately represent the conditions in these agencies. Researchers interested in how bureaucratic capacity affects banking crises should examine capacity within bank supervision agencies, researchers interested in how capacity affects measures of pollution should examine capacity within environmental protection agencies, researchers interested in how capacity affects academic performance should examine capacity within education minisitries (and their dependencies), and so forth. On the other hand, outcomes whose logical relationship to the state apparatus is highly multi-dimensional in nature, such as economic growth, may be more appropriate candidates for the use of national-level PB-GIs. This is because many, if not all, the agencies of the state make a contribution to the genesis of such outcomes. An empirical strategy which concentrated on studying the role of capacity only within a narrow sliver of the state apparatus would seem difficult to justify in such circumstances.
What are the implications of this study for future research? The fact that national-level reputations for overall bureaucratic capacity may correspond only weakly, if it all, with the efficacy of particular state agencies points to a potentially fruitful research agenda for enterprising comparativists: cross-national comparative analysis of bureaucratic performance at the sectoral level. Such an agenda recommends a number of important and intriguing puzzles. To give one example: why, in spite of massive corruption directed towards party politics and electoral campaigns in Brazil, Mexico and Venezuela, does one find in Brazil a state-owned oil company (Petrobras) that is relatively insulated from partisan politics and is among the most competitive and efficient in the world (to the degree that it was recently able to help make Brazil self-sufficient in oil), whereas in Mexico and Venezuela one finds state-owned oil companies (Pemex and PDVSA) that have been routinely used as cash cows for the ruling parties and are characterized by enormous waste and inefficiency? With three quarters of the world's oil reserves in the hands of state-owned entreprises, an answer to the above question – carefully formulated using general principles – could have an appreciable effect on social welfare around the globe.
Another implication is that policy makers interested in bureaucratic reform may find it useful to learn from successful and unsuccessful forms of bureaucratic organization within their own states. Towards this end, some social scientists have used in-depth case studies to identify the sources of success in bureaucratic performance using agency-level or programme-level variation within particular countries.Footnote 33 Although of potentially great utility, such work remains a rarity in comparative politics. Of course, surveys of public employees such as the one presented here are also exceptionally well suited for this purpose. Employee surveys have the advantage of providing a means to map out in a fairly systematic way patterns of cross-agency variation in capacity within a given country, thus making the appropriate targets of reform and the path to it easier to discern. In sum, a healthy appreciation for the variation in capacity that exists within the state recommends a number of exciting paths for comparative research and this article indicates why these are paths worth taking.