Introduction
Surface-enhanced Raman scattering (SERS)Reference Le Ru and Etchegoin1–Reference Moskovits3 has been around for almost 40 years.Reference Fleischmann, Hendra and McQuillan4–Reference Albrecht and Creighton6 Yet, compared to other fields of research in an equivalent period of time, where progress is steady and the community discards wrong interpretations over time and moves on, a considerable amount of time has been spent arguing about the very basic aspects of SERS. This ranges from historical questions such as: “When was the effect originally discovered?”Reference McQuillan7–Reference Moskovits9 to more technical (but still basic) questions on the magnitude of the SERS enhancement factor,Reference Le Ru, Blackie, Meyer and Etchegoin10 the role of the so-called chemical enhancement,Reference Otto11 the reality and interpretation of SERS vibrational pumping,Reference Kneipp, Wang, Kneipp, Itzkan, Dasari and Feld12,Reference Maher, Galloway, Le Ru, Cohen and Etchegoin13 or the conditions needed to ensure single-molecule (SM) detection.Reference Le Ru and Etchegoin14–Reference Etchegoin and Le Ru16 These controversies are perhaps a natural consequence of the multidisciplinary nature of the technique and the resulting diverse background of researchers studying it (chemistry, physics, biology, engineering).
By far, the most important aspect of the SERS effect is the enhancement factor (EF) (i.e., by how much the Raman signal can be amplified). The SERS EF can be large enough to allow, in many cases, the observation of single moleculesReference Le Ru and Etchegoin14,Reference Pieczonka and Aroca15 —an interesting subfield of SERS in its own right. Yet, the magnitude of the SERS EF was, for a long time, part of the self-perpetuating controversies in the field, with quoted values that could differ by several orders of magnitude for similar experimental conditions. The myth of SERS EFs as large as 1014, which originates in the pioneering SM-SERS studiesReference Nie and Emory17,Reference Kneipp, Wang, Kneipp, Perelman, Itzkan, Dasari and Feld18 from an incorrect normalization of the SERS intensity with respect to a non-resonant Raman signal,Reference Le Ru, Blackie, Meyer and Etchegoin10,Reference Etchegoin and Le Ru16 has long been (and to some extent still is) an impediment to progress in the field. It has created innumerable problems for theorists who tried for a long time to justify it from electromagnetic (EM) calculations, and frustration for experimentalists whose estimates of the SERS EF fell short by factors on the order of ∼104–106 (estimates which are, in fact, correct). There is clearly no hope of being able to build a useful analytical tool with a technique that cannot agree on some of its fundamental physical characteristics by several orders of magnitude (up to ∼106). But these discrepancies, which resulted from a combination of different experimental practices and improper definitions of the EF, are well understood now. The state of the art of the technique at the moment is such that when all is taken into account, there should be no controversies on the magnitude and origin of the enhancement factor.
The origin of the SERS enhancement
In its most basic and phenomenological form, the Raman effect can be understood as the emission from a Raman dipole p0 oscillating at the Raman-shifted frequency ωR and induced by the electric field E0 of the exciting laser at frequency ωL. Within a linear response approximation and using complex notations to account for the harmonic time dependence, we have a simple proportionality relation,Reference Le Ru and Etchegoin1 which defines the Raman polarizability  $\alpha _0^{\rm{R}}$ (in general a tensor since p0 and E0 are vectors), namely:
 $${p_0}\left( {{\omega _{\rm{R}}}} \right) = \alpha _0^{\rm{R}}\left( {{\omega _{\rm{L}}},{\omega _{\rm{R}}}} \right){E_0}\left( {{\omega _{\rm{L}}}} \right).$$
The differential Raman cross-section, which characterizes the intensity of Raman scattering, is simply related to the power emitted by this Raman dipole in a given direction for a randomly oriented Raman scatterer (a molecule in our case). From standard EM theory,Reference Jackson19 this radiated power is proportional to |p0|2. Note that although it is convenient from a theoretical point of view to separate the excitation and emission of the Raman dipole into two steps, the Raman scattering process is instantaneous, and both occur simultaneously.
The Raman polarizability can be formally linked to the normal modes of vibrations of a molecule through an expansion of the linear optical polarizability of the molecule.Reference Le Ru and Etchegoin1 But from the point of view of SERS, the Raman polarizability can be taken as a parameter describing a given vibrational mode, and Equation 1 is all that is needed to understand the basic aspects of the SERS enhancement. In SERS conditions (i.e., for a molecule adsorbed on or in close vicinity to a metal nanostructure), several factors will affect the Raman dipole and its emission, thereby contributing to the SERS enhancement. We may then write:
 $$p\left( {{\omega _{\rm{R}}}} \right) = {\alpha ^{\rm{R}}}\left( {{\omega _{\rm{L}}},{\omega _{\rm{R}}}} \right){E_{{\rm{Loc}}}}\left( {{\omega _{\rm{L}}}} \right),$$
where αR is the modified Raman polarizability, and ELoc is the modified electric field at the molecule position (sometimes called the local field). Ignoring tensorial effects for the moment, we can therefore identify two separate origins for the modification of the Raman signal: Either a change in Raman polarizability αR, which we will refer to as a chemical enhancement, or a change in local field ELoc, which corresponds to the EM enhancement. Unfortunately, as we will now discuss in more detail, these simple definitions of chemical versus EM enhancements are not always used consistently. Moreover, for some subtler effects, the delimitation between the two is also not so clear-cut.
Electromagnetic enhancement
The electric field at the molecule position ELoc is strongly affected by the plasmonic response of the structure and can be much larger in magnitude than the incident field E0, in particular when exciting at a wavelength close to the optical resonance of such structures (called localized surface plasmon resonances).Reference Schatz, Young and Van Duyne20,Reference Etchegoin and Le Ru21 The excitation of the Raman dipole therefore results in an enhancement proportional to |p|2/|p0|2 ∝|E(ωL)|2/|E0(ωL)|2. EM calculations predict that this local field intensity EF, defined as
 $${M_{{\rm{Loc}}}}\left( {{\omega _{\rm{L}}}} \right) = {\left| {E\left( {{\omega _{\rm{L}}}} \right)} \right|^2}/{\left| {{E_0}\left( {{\omega _{\rm{L}}}} \right)} \right|^2},$$
can be as large as ∼105 at the plasmon resonance. This typically happens for molecules located at hot spots (i.e., highly localized region of large field enhancement), for example, in the gap of closely spaced nanoparticles,Reference Xu, Bjerneld, Käll and Börjesson22–Reference Le Ru, Etchegoin and Meyer24 at the tip of elongated nanoparticles,Reference Boyack and Le Ru25 or in general at sharp tips, corners, or edges.
But in estimating this enhancement, we have not considered any modification of the emission of the Raman dipole by the nearby metallic nanostructure. Such a strong modification occurs, although it is perhaps more difficult to comprehend. The optical reciprocity theoremReference Landau, Lifshitz and Pitaevski26 provides a rigorous means to understand and model this emission enhancementReference Le Ru and Etchegoin27 and predicts, under a number of assumptions, an additional enhancement by a factor M Loc(ωR) (i.e., the local field intensity EF at the Raman frequency). Note that this radiation enhancement is not simply a re-direction of the emission (although this also occurs); the total emitted power is also enhanced.Reference Le Ru and Etchegoin1
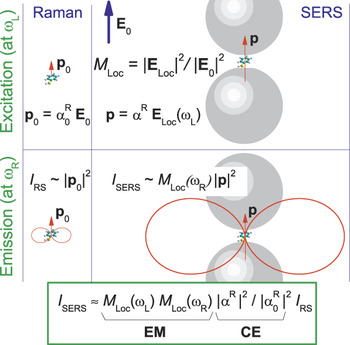
These considerations are schematically summarized in Figure 1. The overall EM SERS EF can then be expressed as:
 $${F_{{\rm{EM}}}} \approx {M_{{\rm{Loc}}}}\left( {{\omega _{\rm{L}}}} \right){M_{{\rm{Loc}}}}\left( {{\omega _{\rm{R}}}} \right).$$
Schematic summarizing a simplified model of the origin of the surface-enhanced Raman spectroscopy (SERS) enhancement. The left column shows the normal Raman scattering process, where a Raman dipole p0 is induced by the incoming electric field (E0) (top) and produces a dipolar-like Raman emission of intensity proportional to |p0|2 (bottom). The right column shows the enhancement in excitation experienced by a dipole in a strong local field ELoc (quantified by M Loc), together with a modified polarizability αR that includes any possible chemical effect. The dipolar emission (red) at the Raman frequency ωR also profits from an enhancement effect, which by optical reciprocity can be approximated by M Loc(ωR) (bottom right). The total SERS enhancement factor given at the bottom of the figure can be viewed as the product of the electromagnetic (EM) and chemical enhancement (CE) contributions, where ωL is the laser frequency. Note that the Raman process (excitation + emission) is instantaneous.

Note that M Loc depends on the molecule position on the surface, and this expression only applies to the SERS EF at a given position. Since M Loc ∼|E|2, this approximation is called the |E|4-approximation. In the best cases discussed earlier, where M Loc ∼105, we therefore obtain a predicted maximum EM SERS EF on the order of ∼1010.
Furthermore, for simplicity, we can ignore the Raman shift and consider (within the approximations already made) that ωL ∼ωR (i.e., (ωL–ωR)/ωL≪1), leading to
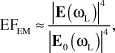 $${F_{{\rm{EM}}}} \approx {{{{\left| {E\left( {{\omega _{\rm{L}}}} \right)} \right|}^4}} \over {{{\left| {{E_0}\left( {{\omega _{\rm{L}}}} \right)} \right|}^4}}},$$
which is the |E|4-approximation for zero Raman shift.
Note that many of these approximations are quite drastic. The tensorial nature of the polarizability is entirely ignored. Also, the idea of separating the excitation and emission process into two steps is not strictly correct, and there are no field polarization effects in these considerations. Nonetheless, a rule of thumb (based mainly on experience) is that, except in special cases (vide supra), the |E|4-approximation provides the right ballpark estimation for the SERS EM enhancement despite its intrinsic simplifications. Moreover, its limitations are well understood. Reference 27, for example, provides a rigorous and general treatment of the problem using the optical reciprocity theorem.Reference Landau, Lifshitz and Pitaevski26 The rigorous expressions become identical to the common |E|4-approximation under a number of simplifying assumptions (e.g., an isotropic Raman tensor, the same polarization for the incoming and outgoing photons, and backscattering configuration).Reference Le Ru and Etchegoin1,Reference Le Ru and Etchegoin27
Chemical enhancement
We choose to classify as “chemical enhancement” any effect that might result from a change of the Raman polarizability αR in SERS conditions with respect to that of the bare molecule  $\alpha _0^{\rm{R}}$. We note that such effects may lead to quenching as much as enhancement. There are many different ways in which
 $\alpha _0^{\rm{R}}$ can be modified by the presence of the metallic substrate. For example, a weak electronic interaction might result in a perturbation of the electronic density of the molecule and a subsequent change in the optical polarizability (from where the Raman polarizability is derived); or a much stronger (covalent) interaction of the molecule with the substrate might result in a more radical modification of the electronic structure of the molecule. This includes the possible appearance of charge transfer (CT) resonances,Reference Otto11,Reference Lombardi, Birke, Lu and Xu28,Reference Lombardi and Birke29 which can result in much larger Raman scattering through the resonance Raman effect. In fact, many authors prefer to reserve the term chemical enhancement for this specific case. It is also interesting to note that the chemical enhancement (defined here as a modification of the Raman polarizability) may also have an EM origin, for example through image dipole effects.Reference Le Ru and Etchegoin1,Reference King, Duyne and Schatz30,Reference Efrima and Metiu31
Other possible mechanisms for these chemical effects could be listed, but they all have in common that they are strongly dependent on the molecule under consideration, as they reflect the physicochemical interaction of the molecule with the substrate. In contrast to the EM enhancement, which applies to all molecules, the chemical enhancement effect is analyte specific and cannot, in general, be invoked to explain general properties of SERS. Chemical enhancements can be demonstrated by a systematic study of the SERS EFs of several analytes with expected different interactions with the metal surface or through the addition of another external parameter such as electrochemical potentials.Reference dos Santos, Andrade, Temperini and Brolo32
Most evidence to date indicates that chemical enhancement effects, although important to understand specific experiments (such as some electrochemical effects), do not contribute significantly in general to the SERS enhancement. Apart from exceptional cases where CT resonances are involved, the CE should therefore be considered as an analyte-specific small perturbation (by, at most, a factor of ∼10) on the EM SERS EF. Indeed, an amplification of the Raman signal of a molecule by 10 orders of magnitude on a flat metallic surface has never been reported. In this scenario, the chemical enhancement will always be present, but the EM enhancement is very weak.Reference Le Ru, Meyer, Artur, Etchegoin, Grand, Lang and Maurel33 The EM enhancement resulting from the excitation of localized surface plasmon resonances in metallic nanostructures and the associated large surface fields is primarily what makes the SERS effect both remarkable and useful.
Tensorial effects
For simplicity, the discussion so far has ignored a number of more subtle effects linked to the vectorial nature of the field and the induced Raman dipole, and therefore, the tensorial nature of the Raman polarizability. To strictly discuss and predict the SERS EF from Equation 2, we would need to specify the direction of the local field with respect to the surface (which depends on the incident polarization and to some extent incident wave vector), and the orientation of the molecule with respect to the local field or the surface. Raman emission is also typically collected along a certain direction; something that automatically implies the specification of the geometry of the scattering configuration. These effects are in many cases secondary to the main contributions discussed previously and may be referred to as polarization or surface-selection rules effects.Reference Moskovits3,Reference Moskovits34–Reference Le Ru, Grand, Félidj, Aubard, Lévi, Hohenau, Krenn, Blackie and Etchegoin36 They may, however, be important in specific cases and fall outside the range of validity of the |E|4-approximation. A few examples will be briefly discussed later.
Practical definitions and measurements of average SERS EFs
The SERS enhancement factor should a priori be straightforward to define: It is the ratio of SERS signal to the Raman signal that would be obtained for the same molecule in the absence of the SERS substrate, with all other conditions being identical.
The first prerequisite to any SERS EF estimate is therefore to characterize the Raman signal in non-SERS conditions, ideally in the same solvent (or possibly in air) as used for the SERS experiment. Errors in this normalization step can have a dramatic effect on the SERS EF since differential Raman cross-sections can vary significantly from one molecule to another and with excitation wavelength; they span a range between dσ/dΩ ∼10–30–10–24 cm2/sr (depending on resonance conditions). Improper normalization was the origin of the erroneous claims of SERS EF of ∼1014.Reference Nie and Emory17,Reference Kneipp, Wang, Kneipp, Perelman, Itzkan, Dasari and Feld18
Standard methods can be used to measure the intrinsic differential Raman cross-section,Reference Schröetter and Klöckner37 which is an orientation-averaged property and is typically measured in solution at a high concentration c RS. The Raman intensity I RS of such a solution can be compared to the SERS intensity I SERS taken under identical conditions (i.e., same laser wavelength and power, same microscope objective). Most SERS experiments will start with the analyte in solution at a known concentration c SERS (usually much smaller than c RS), so the SERS EF can be naturally defined by normalizing with respect to concentrations as:
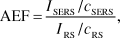 $${\rm{AEF}} = {{{I_{{\rm{SERS}}}}/{c_{{\rm{SERS}}}}} \over {{I_{{\rm{RS}}}}/{c_{{\rm{RS}}}}}},$$
which is called the analytical EF (AEF).Reference Le Ru, Blackie, Meyer and Etchegoin10 The AEF is relatively straightforward to define and measure and can therefore be used for benchmarking (provided identical conditions and preparation procedures are used). It is also perfectly suited to characterize SERS performance for analytical applications, in particular for SERS in colloidal solutions. However, the main disadvantage is that the AEF definition, since it uses the volume concentration of the SERS analyte c SERS, does not recognize the fact that SERS is a type of surface spectroscopy. As a result, it may strongly depend on sample preparation procedures and, in particular, on the crucial 3D-to-2D transfer step (from solution to SERS substrate surface). For example, if an analyte does not adsorb to the metal surface, then the measured AEF is of the order of unity, while it could be 105 on the same SERS substrate for another analyte with a strong affinity to the metal. The problem is not only related to different analytes. If we start from a single solution of given concentration c SERS and measure the AEF on the same SERS substrate (of a planar 2D type) following preparation by either drop casting or spin-coating, differences of several orders of magnitude may be obtained, as the surface density of an analyte could be much larger in the former case compared to the latter.
To remedy these problems and find a SERS EF definition that better reflects the intrinsic enhancement of the SERS substrate itself, rather than the efficiency of the 3D-to-2D transfer step, it is necessary to normalize the SERS intensity by the number of adsorbed molecules N Surf, rather than by the volume concentration in the starting solution c SERS. We then obtain the commonly used definition for the average SERS EF, called SERS substrate EF (SSEF):Reference Le Ru, Blackie, Meyer and Etchegoin10,Reference Hildebrandt and Stockburger38–Reference McFarland, Young, Dieringer and Van Duyne41
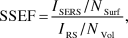 $${\rm{SSEF}} = {{{I_{{\rm{SERS}}}}/{N_{{\rm{Surf}}}}} \over {{I_{{\rm{RS}}}}/{N_{{\rm{Vol}}}}}},$$
where N Vol = c RSV Sca is the average number of molecules in the scattering volume (V Sca) for the Raman (non-SERS) measurement. This alternative definition is better suited to characterizing substrate performance but presents more challenges from an experimental point of view. To start with, the scattering volume needs to be carefully characterized, for example, using the methods described in detail in Reference 10. But the real challenge here is to determine rigorously and accurately the number of molecules on the surface, or equivalently the surface coverage. Although estimates can be obtained, for example, for self-assembled monolayersReference McFarland, Young, Dieringer and Van Duyne41,Reference Laurence, Braun, Reich and Moskovits42 or using electrochemical measurements,Reference Kuramitz, Sugawara, Kawasaki, Hasebe, Nakamura and Tanaka43 this remains the largest source of uncertainty in the measurement of average SERS EFs. To this, we may add the fact that measurements on a single analyte may be affected by secondary chemical enhancement effects, as discussed in the previous section. Overall, rigorous comparisons of the relative SERS substrate performance typically require measuring the SSEF using the same analyte under the same preparation conditions. In terms of absolute EF, the best approach to obtain an estimate of the SSEF is to measure it using a variety of analytes to even out uncertainties associated with surface coverage and chemical enhancement effects.
Finally, it should be noted that the difficulties with SERS EF measurements are not only restricted to the SERS part of the problem, but sometimes to the measurement of the normal Raman cross-sections. This can be the case for analytes that are poorly soluble in water, for which the solvent peaks may interfere with the Raman spectrum of the analyte. Another important class of analytes causing problems is fluorophores in resonance or pre-resonance Raman conditions because of the strong fluorescence background that overwhelms the resonance Raman spectrum. Up until recently, one then had to resort to time-resolved measurements such as those presented in Reference 44 for the commonly used SERS analyte, Rhodamine 6G. As an alternative, we recently developed experimental methods to measure resonance Raman cross-sections with continuous-wave excitation in standard Raman spectrometers.Reference Le Ru, Schroeter and Etchegoin45–Reference Reigue, Auguie, Etchegoin and Le Ru47
Single-molecule enhancement factors
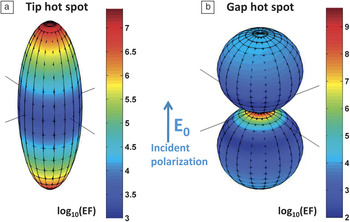
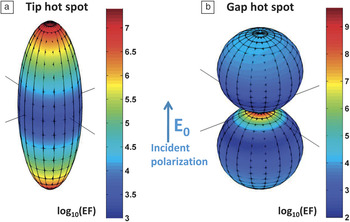
We have so far focused on average enhancements for a collection of molecules adsorbed randomly on the surface. This is what counts for many analytical applications, but from a fundamental point of view and for comparison with theoretical calculations, it is important to understand how this average comes about from the EFs experienced by each molecule on the surface. This is a crucial aspect in SERS because of the extreme spatial variations of the EF on most (interesting) substrates. This can be viewed as a defining characteristic of EM hot spots,Reference Le Ru, Etchegoin and Meyer24 as briefly summarized in Figure 2. Essentially, SERS EFs in the presence of hot spots can vary by an order of magnitude over distances that are comparable to the size of typical molecules (∼1 nm).Reference Le Ru and Etchegoin14,Reference Etchegoin and Le Ru16 As a result, the probability of having a given SERS EF follows a long-tail distribution, similar to a truncated Pareto distribution.Reference Le Ru, Etchegoin and Meyer24,Reference Lombardi, Birke, Lu and Xu28 The Pareto distribution has its origin in economics, and it reflects the fact that a very small fraction of the population controls the largest part of the wealth. In SERS, this translates to a very small number of molecules that contribute to the largest part of the signal. In other words, a single molecule at the maximum of enhancement (i.e., at the hot spot) produces, on average, the same SERS intensity as hundreds or thousands of randomly adsorbed molecules (i.e., the average EF is 100−1000 smaller than the maximum EF).
Typical electromagnetic hot spots in nanostructures, as evidenced through the computed surface-enhanced Raman spectroscopy enhancement factor (SERS EF) distribution on the surface (note the log10 scale in the color maps) when excited at the plasmon resonance. (a) An elongated Ag nanoparticle (spheroid) exhibits two tip hot spots where the EF reaches values close to ∼107 (and more for higher aspect ratios).Reference Boyack and Le Ru25 More spatially localized hot spots can be obtained in gap hot spots, as shown in the gap between two nanospheres in (b). Although less studied, single nanoparticles with tip hot spots are also capable of single-molecule SERS detection of resonant dyes, as recently demonstrated in Reference 49. Adapted with permission from Reference 14. © 2012 Annual Reviews.
Because of these extreme statistical distributions, there is no way to infer the number of molecules contributing to the SERS signal from its absolute intensity. The development of the field of SM-SERS therefore dramatically contributed, inter alia, to our understanding of the magnitude of the SERS EF. In particular, it provided an experimental handle on the crucial distinction between average and SM EF. SM-SERS spectra can now be routinely measured with reliable statistics, thanks to the techniques developed in the last few years for SM-SERS detection, notably the bi-analyte SERS method,Reference Pieczonka and Aroca15,Reference Etchegoin and Le Ru16,Reference Le Ru, Meyer and Etchegoin50,Reference Etchegoin, Meyer, Blackie and Le Ru51 and its use with isotopologuesReference Dieringer, Lettan, Scheidt and Van Duyne52–Reference Kleinman, Ringe, Valley, Wustholz, Phillips, Scheidt, Schatz and Van Duyne54 along with similar advances in tip-enhanced Raman spectroscopy.Reference Steidtner and Pettinger55–Reference Sonntag, Klingsporn, Garibay, Roberts, Dieringer, Scheidt, Jensen, Schatz, Seideman and Van Duyne57 From the SERS spectrum of a SM, we can quantify the SERS cross-section for that molecule, dσSERS/dΩ, and define a single-molecule enhancement factor (SMEF) as1,10
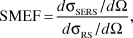 $${\rm{SMEF}} = {{d{\sigma _{{\rm{SERS}}}}/d\Omega } \over {d{\sigma _{{\rm{RS}}}}/d\Omega }},$$
where dσRS/dΩ is the normal Raman cross-section.
It is important to note that this SMEF is not unique. It only relates to that particular molecule and depends on many parameters, including the exact position of this molecule, its orientation, and the orientation of the substrate. In practice, by measuring reliable statistics of SM-SERS spectra, one can extract a representative maximum achievable SMEF, which provides a good figure of merit for SM-SERS detection on a given substrate. Such studies have shown that maximum SMEFs were commonly on the order of ∼108–109 and at most ∼1010–1011,Reference Le Ru, Blackie, Meyer and Etchegoin10,Reference Blackie, Le Ru and Etchegoin58 perfectly in agreement with EM calculations, even if a minor chemical contribution to the enhancement cannot be disentangled from the result.
Looking ahead, in order to fully characterize the EM enhancement of a substrate, one would ideally like to measure the entire distribution of SMEF. This remains a considerable challenge. Direct SERS measurements of this distributionReference Etchegoin, Meyer, Blackie and Le Ru51 are limited to the regions of high enhancement because of the detector sensitivity. However, indirect measurements of the SERS EF distribution exploiting the EF-dependent photostability of the adsorbates (as originally suggested in Reference 24) are a promising alternative and have provided a clear experimental demonstration of the predicted long-tail distribution of SERS EF.Reference Fang, Seong and Dlott59 These experiments have moreover highlighted another potential problem for EF quantification: the influence of the photostability of the probe, in particular for dyes, which are naturally prone to photobleaching. Such issues are complicated by the extreme distribution of SERS EFs, which implies that the molecules at the hot spots may photobleach much faster than those farther away, which remain stable over the time scale of the experiment. Even if photobleaching is not immediately apparent in such cases, it results in an artificial underestimation of the maximum SMEF, possibly by several orders of magnitude.Reference Etchegoin, Lacharmoise and Le Ru60 The intrinsic SMEF of the substrate (independent of photobleaching) is only recovered at much lower excitation power densities.
EF quantification: An important tool for SERS research and applications
We now consider a few examples of recent developments, chosen mostly from our own research, where the understanding of the concepts summarized so far and the careful experimental quantification of the SERS EFs are particularly crucial.
SERS substrate performance and single-molecule detection capabilities
There is a tendency in the recent literature to use single-molecule detection as a demonstration of the “exceptional” performance of a SERS substrate. In the absence of careful estimations of the actual SERS EFs (SM or average), this is a misguided approach for several reasons: (1) SM SERS detection is much easier and more common than once thought. (2) It is often scientifically challenging to convincingly demonstrate the SM detection capabilities of a substrate (e.g., using the bi-analyte method), and efforts would be best focused on measuring a more relevant property like the SSEF. (3) There is a huge difference between SM-SERS in easy cases (e.g., strongly resonant molecules with good photostability and chemical affinity to metals) and SM-SERS in difficult cases (e.g., small non-resonant molecules).Reference Blackie, Le Ru and Etchegoin58 It is fair to say that most (if not all) SERS substrates should be capable of SM detection in the easiest cases, such as for Rhodamine 6G excited at 514 nm or 532 nm. The resonance Raman cross-section in such cases is on the order of 10–24 cm2/sr,Reference Shim, Stuart and Mathies44–Reference Auguie, Reigue, Le Ru and Etchegoin46 and modern Raman micro-spectrometers can easily detect a signal equivalent to a cross-section of 10–20–10–21 cm2/sr under standard conditions. A SMEF of only 103 is therefore sufficient for SM detection at resonance. Alternatively, with a SERS EF on the order of 109–1010, single resonant molecules should be detectable with excitation powers one million times lower than in standard conditions (i.e., in the nano-Watt range).
As another example, we have recently demonstrated for the first time SM-SERS detection in colloidal solutions of single-nanoparticles (gold bi-pyramids),Reference Le Ru, Grand, Sow, Somerville, Etchegoin, Treguer-Delapierre, Charron, Félidj, Lévi and Aubard49 as opposed to interacting particles with gap hot spots. The SM SERS EFs in these experiments were only in the range of 105–106,Reference Le Ru, Grand, Sow, Somerville, Etchegoin, Treguer-Delapierre, Charron, Félidj, Lévi and Aubard49 but this was enough to observe SM-SERS in pre-resonant conditions (in this case, for the dye crystal violet excited at 633 nm).
The conclusion of all these studies is quite clear: SM detection is common and easily achieved and is not in itself an indication of good SERS substrate performance, as often erroneously assumed. Only carefully measured SERS EFs, which may use SM-SERS as a tool, are convincing arguments of the SERS substrate capabilities.
Beyond the |E|4-approximation: Polarization effects and directional SERS
While the |E|4-approximation (and its trivial extension to non-zero Raman shift) provides a handy order-of-magnitude estimate of the SERS EF, there are a few important instances where it fails dramatically, notably for the study of surface selection rules (SSRs) and molecular orientation effects, in polarization-dependent SERS experiments, and for substrates with a strongly directional SERS enhancement.
The concept of SSRs was introduced more than 30 years ago by Moskovits.Reference Moskovits34 On flat metal films, where a complete theoretical description can be carried out as shown in Reference 34, it provides a textbook example of the EM mechanism of SERS beyond the |E|Reference Fleischmann, Hendra and McQuillan4-approximation. Its validity in this ideal case was recently experimentally demonstrated.Reference Le Ru, Meyer, Artur, Etchegoin, Grand, Lang and Maurel33
Beyond metal films, the concept of SSRs recognizes the simple fact that the local field on a metallic surface has a specific polarization that is in general different from the incident field polarization. In fact, in a first approximation, it is primarily perpendicular to the metallic surface. As a result, only the perpendicular component of the Raman tensor of a given mode experiences a large SERS enhancement. This can, in principle, be used to infer the predominant orientation of the molecules on the surface by studying the relative SERS intensity of modes with different Raman tensors.Reference Moskovits and Suh62,Reference Moskovits and Suh63 This may moreover explain why some small non-resonant molecules are notoriously difficult to measure with SERS. Quantitative predictions beyond these simple qualitative arguments remain challenging because of the many uncertain parameters of the problem (e.g., exact substrate geometry, molecule orientations, Raman tensors of the adsorbed analytes). Although progress has been made,Reference Le Ru, Meyer, Blackie and Etchegoin35,Reference Fazio, DAndrea, Bonaccorso, Irrera, Calogero, Vasi, Gucciardi, Allegrini, Toma, Chiappe, Martella and Buatier de Mongeot64 a detailed understanding of surface-selection rules (in particular at the SM level) is still very much a work in progress.
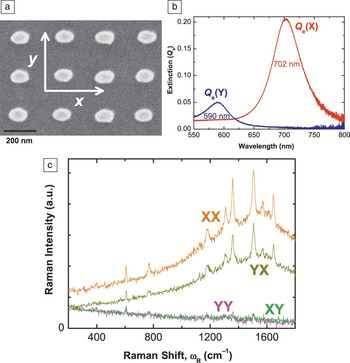
On a different note, substrates with well-defined tailored geometries have also recently highlighted the potential dramatic failure of the |E|4-approximation in some cases. Two examples taken from our own research illustrate this point. The first one consists of a polarization dependence study of the SERS signal in asymmetric structuresReference Le Ru, Grand, Félidj, Aubard, Lévi, Hohenau, Krenn, Blackie and Etchegoin36 and is highlighted in Figure 3. Failure of the |E|Reference Fleischmann, Hendra and McQuillan4-approximation is entirely expected in such cases since field polarization plays an important role.Reference Fazio, DAndrea, Bonaccorso, Irrera, Calogero, Vasi, Gucciardi, Allegrini, Toma, Chiappe, Martella and Buatier de Mongeot64–Reference Shegai, Li, Dadosh, Zhang, Xu and Haran66 It is interesting to see that the polarization of the SERS signal can, in such cases, be completely rotated by 90° with respect to the incident polarization, a situation that rarely occurs in Raman spectroscopy and in standard SERS substrates. Nevertheless, it should be noted that the EM model of SERS still accounts fully for the observations.
Polarization effects and the failure of the |E|Reference Fleischmann, Hendra and McQuillan4-approximation. SEM images of nanolithographically prepared substrates of elongated particles are shown in (a). These have two distinct plasmon resonances associated with each incoming polarization. This is explicitly shown in (b) for the polarized extinction spectra along x or y. These two resonances produce peculiar polarization effects in the Raman emission. For example, the polarization of the emission can almost be rotated by 90° with respect to the excitation, as evidenced in (c) by a much larger cross-polarized surface-enhanced Raman spectroscopy (SERS) signal (YX) compared to the corresponding parallel polarization signal (YY). Such experiments provide strong evidence for the validity of the electromagnetic model of SERS, even if they cannot be accounted for by the |E|Reference Fleischmann, Hendra and McQuillan4-approximation. Adapted with permission from Reference 36. © 2008 American Chemical Society.

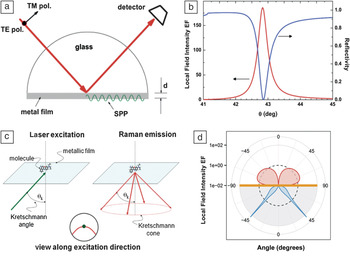
The second example (Figure 4) illustrates the concept of directional emission in SERS. There has been much effort recently in fabricating plasmonic structures with strong directionality,Reference Chu, Zhu, Wang and Crozier67–Reference Ahmed and Gordon70 inspired in part by radio wave antenna designs that radiate more power in a specific far-field direction, such as the Yagi-Uda antenna.Reference Coenen, Vesseur, Polman and Koenderink71–Reference Zhu, Wang and Crozier73 But one of the simplest plasmonic substrates, a thin metallic film excited in the Kretschmann configuration, already provides one of the most spectacular (and easily studied) examples of such directionality,Reference Meyer, Le Ru and Etchegoin74,Reference Meyer, Auguie, Le Ru and Etchegoin75 as shown in Figure 4. From the calculation shown in Figure 4d, we can predict that 90% of the emitted power on the glass side is concentrated in a thin cone covering only 4% of the total solid angle on this side. This strong directionality of the emission presents a challenge for the definition of the SERS EF. For example, if the collecting optics misses the Kretschmann cone altogether, the measured SERS EF is small. Similarly a “naive” SERS EF of 104 (102 for excitation and 102 for emission) would only be measured in backscattering for extremely small numerical apertures (i.e., those within the angular resonance). For EF figures to make sense and comparisons with theory to be meaningful, SERS substrates with directional emission require specific definitions of the SERS EF, which must include the details of scattering configuration and the collecting optics. In fact, in such cases, most standard definitions of the SERS EF10 breakdown, and this situation, is prone to severe misinterpretations of the SERS EFs. It is tempting to think of the “re-direction” of the emission as an additional enhancement—something that can be proven wrong by the proper application of the optical reciprocity theorem.Reference Le Ru and Etchegoin27 Unfortunately, such reasoning has started to appear in reports of “directional SERS” and can only contribute further to misconceptions regarding the magnitude of SERS EFs.
Directional surface-enhanced Raman spectroscopy (SERS) using the Kretschmann configuration. (a) Schematic representation of the Kretschmann configuration, in which light incident from a glass region at an angle θk excites surface plasmon polaritons (SPPs) at the metal/air interface of a thin metal film (a 50 nm silver film in this example). (b) The resonance associated with coupling to SPPs (which occur only for TM polarization) is evidenced in both the theoretical angle-dependent reflectivity and the local field intensity enhancement factor (EF) on the surface of the film, which can reach typical maximum values on the order of ∼102. The resonance is extremely sharp in angle. By reciprocity, the Raman emission is strongly enhanced (also by ∼102), but only within a narrow angular range, defining the Kretschmann cone as illustrated schematically in (c) and more quantitatively in the calculations of dipole radiation profile for a dipole 1 nm from a Ag/air interface radiating at 632.8 nm shown in (d). A similar plot was given in Reference 75 for gold. (a–c) Reprinted with permission from Reference 74. © 2011 American Chemical Society.

Raman versus fluorescence enhancement
The ability to quantify SM SERS enhancements has also opened up the possibility of rigorously comparing SERS to surface-enhanced fluorescence (SEF), which is expected to occur concomitantly to SERS whenever fluorophores are studied. It has long been assumed that SEF from molecules directly adsorbed on metallic surfaces was not possible because of the fast non-radiative decay into the metal, resulting in strong quenching. This is indeed what happens when no or little EM enhancement is present (e.g., for molecules on flat metallic surfaces). However, if there is a large EM enhancement, such as for a fluorophore at a hot spot, the enhanced absorption can, to some extent, compensate for the large quenching by non-radiative decay into the metal.Reference Le Ru, Etchegoin, Grand, Félidj, Aubard and Lévi76–Reference Gill, Tian, Somerville, Le Ru, van Amerongen and Subramaniam78 A more elaborate model of these processes shows that the ratio of SERS and SEF EFs contains information about the total excited-state decay rate, including non-radiative decay. This has been used to infer ultrafast non-radiative decay rates on the order of 15 fs only for a molecule (crystal violet) adsorbed on Ag colloids.Reference Galloway, Etchegoin and Le Ru79 Such studies show that the SERS EF is typically 105–106 times larger than the SEF EF. However, because fluorescence is a much stronger effect in the first place (before enhancement), SERS and SEF signals are expected to be comparable in many cases for fluorophores, and this could contribute in some cases to the SERS continuum or backgroundReference Le Ru, Etchegoin, Grand, Félidj, Aubard and Lévi76,Reference Mahajan, Cole, Speed, Pelfrey, Russell, Bartlett, Barnett and Baumberg80,Reference Hugall, Baumberg and Mahajan81 commonly observed in SERS spectra and whose origin is still debated. From a more practical point of view, these studies show that fluorescence is not always quenched for molecules in direct contact with the metal. For example, at a hot spot with a SERS EF of 109, the SEF EFs could be as large as 103–104, and there is certainly scope to exploit such enhancements for applications of SEF.Reference Gill and Le Ru77,Reference Gill, Tian, Somerville, Le Ru, van Amerongen and Subramaniam78
Sample preparation: The future of SERS
The careful quantification of SERS enhancements has highlighted, perhaps more clearly than ever before, the crucial importance of the analyte adsorption step for real-life applications of SERS. By this, we mean the necessary 3D-to-2D step in all SERS experiments of transferring the target analyte from a volume (solution or powder) to a surface (the metallic substrate). If the analyte does not stick to the substrate (or at least to within a few tens of nanometers from it), then no SERS signal is produced. The adsorption efficiency directly affects the analytical SERS EF one can expect (i.e., 10% adsorption efficiency means 10 times less signal at a given concentration). The problem is magnified to another level in the case of SM SERS. One molecule positioned exactly at the hot spot can typically provide 10 times more signal than one only a few nanometers away and 100 times more SERS signal than randomly adsorbed molecules.
All of these figures point to the fact that dramatic improvements in analytical SERS EFs and in the statistics of SM detection can be achieved by developing new methods of targeted adsorption of the analytes on the SERS substrates. This is in addition to the benefits obtained from improving EM enhancements and is a paradigm shift with respect to the current race for large EM enhancements. This may involve, for example, developments in sample preparation procedures using tools from micro- and nanofluidics or advances in surface-functionalization chemistry. The aim is twofold: (1) to transfer more molecules onto the surface from a given 3D volume and (2) to attempt to position them preferentially at the hot spots and, ideally, at the hot spots only.
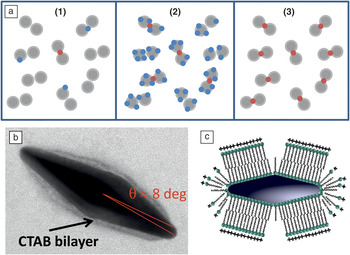
As illustrated in Figure 5, we recently provided a proof-of-principle demonstration of this second pointReference Le Ru, Grand, Sow, Somerville, Etchegoin, Treguer-Delapierre, Charron, Félidj, Lévi and Aubard49 based on site-specific adsorption of the analyte at the tip of single elongated nanoparticles, where the EM enhancements are the largest. Such a scheme provides a means for the detection of every molecule in solution at the single-molecule level via SERS. In contrast, all other SM-SERS experiments rely on the detection of, at most, ∼1% of the molecules; in practice, this figure is closer to 0.01−0.1%. The rest of the molecules do not experience sufficiently large EF to be observable. Beyond the obvious benefits for SM-SERS studies, this scheme provides a way to boost the average SERS EF, since all molecules experience enhancements that are close to the maximum achievable SMEF on the substrate. In fact, careful quantification of SERS EFs is again very important here to assess experimentally the efficiency of the hot spot-specific adsorption schemes, which can be quantified from a simple figure of merit introduced in Reference 49 and defined as:
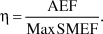 $$\eta = {{{\rm{AEF}}} \over {{\rm{Max}}\,{\rm{SMEF}}}}.$$
Single-molecule detection of every molecule in solution by site-selective adsorption at the hot spots. (a) Three stages in the single-molecule surface-enhanced Raman spectroscopy (SM-SERS) problematic illustrated on the model case of hot spots formed in the gap of nanoparticle dimers. At ultralow concentrations (1), the efficiency of placing the molecules at the highly localized hot spots (shown in red) where they can be observed is very low. By substantially increasing the concentration of analyte, one reaches a regime where SM-SERS events are routinely observed and can be studied (2). In the ideal case of (3), every target analyte is at a hot spot and can be measured at the SM-SERS level. Selective adsorption can be achieved in single elongated nanoparticles with tip hot spots, as illustrated in (b) and (c). A cetyl trimethylammonium bromide (CTAB) bilayer covers most of the surface but leaves gaps at points of high curvature, resulting in adsorption of a target molecule at the tips, and at the tips only. All molecules then experience an enhancement factor (EF) close to the maximum EF of the individual nanoparticles, allowing for the possibility of SM-SERS detection of every target molecule in the solution.Reference Le Ru, Grand, Sow, Somerville, Etchegoin, Treguer-Delapierre, Charron, Félidj, Lévi and Aubard49 Note that this site-selective adsorption approach was also used in a different context in Reference 82 for self-assembly of nanorods. Reprinted with permission from Reference 49. © 2011 American Chemical Society.

A perfect scheme would have η = 1 and would correspond to 100% adsorption efficiency with a uniform SERS EF, as is obtained with flat metal films, albeit with relatively low enhancements. Typical SERS substrates have larger enhancements but may only achieve η = 10–3 in the best of cases. As demonstrated experimentally in Reference 49, our site-specific adsorption method raised this to η = 0.13.
Conclusions and outlook
Overall, SERS EFs are very well understood at present. The electromagnetic model of SERS has been extensively verified experimentally, including in its more subtle aspects regarding surface selection rules and polarization effects. It successfully accounts for most SERS experiments together with a secondary analyte-dependent contribution arising from a broad class of effects classified as chemical enhancements or surface selection rules. Much work still remains to be done to elucidate all these effects. And even from the point of view of only the electromagnetic enhancement, there remain a few potential problems, in particular regarding the interpretations of re-radiation effects and directional SERS. A key milestone in the development of our understanding of SERS EFs was the development of the field of single-molecule SERS, which allowed access to information about the EF distribution beyond average signals and contributed to a better understanding of the important concept of a hot spot. The hype of enormous SERS EFs has slowly died down, and most overestimations of the EFs can be tracked to improper definitions or other, sometimes more subtle, sources of errors. Researchers should no longer be “ashamed” to report a SM SERS EF of 108 or even 106, which are perfectly respectable figures as long as the experimental approach to estimate them is well detailed and justified. SERS EFs, rather than being the center of controversies, can now be to be used as a tool to infer other important physical properties of the SERS effect; a trend that is likely to continue in the near future.
Acknowledgments
The authors would like to thank Baptiste Auguié for his help in adapting Figure 4. The authors are indebted to the Royal Society of New Zealand for support through a Marsden Grant (ECLR and PGE) and Rutherford Discovery Fellowship (ECLR).