

Introduction
For decades, China has been the developing world's largest recipient of foreign direct investment (FDI). Recently, China has turned the tables and become a net exporter of capital, with its outbound FDI exceeding inbound FDI in 2016 for the first time (OECD, 2016). The growing wave of Chinese investments going into every corner of the globe has raised concerns and even fear, however, in the host countries. Politicians, business elites and local communities are increasingly voicing their opposition to FDI from China, questioning their motivations, business models and socio-economic consequences for the host country; recent examples include US regulators scuttling deals made by Chinese investors in American tech firms (The New York Times, 2017) and the United Kingdom's delaying of a proposed Chinese-funded nuclear plant (The Guardian, Reference Guardian2016).
The influx of Chinese investment has also sparked controversies in Canada. A national opinion poll conducted by the Asia Pacific Foundation of Canada (APFC) in 2015 found that Canadians have a much more “mixed” attitude toward FDI from China than from other Asian countries or from the United States. Respondents cited “loss of control over resources”, “poor labour standards”, “environmental damage” and “security risks” as their major worries with regard to Chinese investments (APFC, 2015).
What contributes to the public disapproval of Chinese investments in Canada? One potential explanation points to misperceptions among Canadians regarding FDI from China, which is a new and unfamiliar investor. Indeed, the same APFC poll shows that Canadians substantially overestimate the relative size of Chinese FDI coming into Canada and misunderstand how such investments are managed domestically (APFC, 2015). These misperceptions, in turn, may result in the public fearing that the Chinese are “buying up” Canadian assets and lowering Canada's environmental and labour standards.
Such political misperceptions and their impact have long been documented in the public opinion literature. Studies have shown that citizens in democratic societies often lack factual knowledge about political matters and are unfamiliar with politically relevant numbers (see, for example, Carpini and Keeter, Reference Carpini and Keeter1996; Lawrence and Sides, Reference Lawrence and Sides2014). This, in turn, may lead them to rely on heuristics and information shortcuts to form their preferences and express their issue opinions (Lupia, Reference Lupia1994). Even worse, citizens can unknowingly base their policy preferences on false, misleading or unsubstantiated information (Kuklinski et al., Reference Kuklinski, Quirk, Jerit, Schweider and Rich2000), resulting in public policies that run counter to a society's best interest (Lewandowsky et al., Reference Lewandowsky, Ecker, Seifert, Schwarz and Cook2012).
In this study, we investigate the extent of misperceptions among Canadians toward Chinese investments and, more importantly, whether correcting such misperceptions will lead to changes in policy preferences. We do so by fielding an online public opinion survey embedded with a randomized experiment. The experiment begins by asking respondents two questions that tap into their knowledge of the amount of Chinese FDI in Canada, relative to that of other countries, as well as about Canadian rules and regulations governing FDI. After this, half of the respondents are randomly chosen to receive the correct answer for each question. This experimental design thus randomly places the respondents into four groups, depending on whether they receive either or both parts of the corrective information. We then evaluate changes in respondents’ support for Chinese FDI using a choice-based conjoint design.
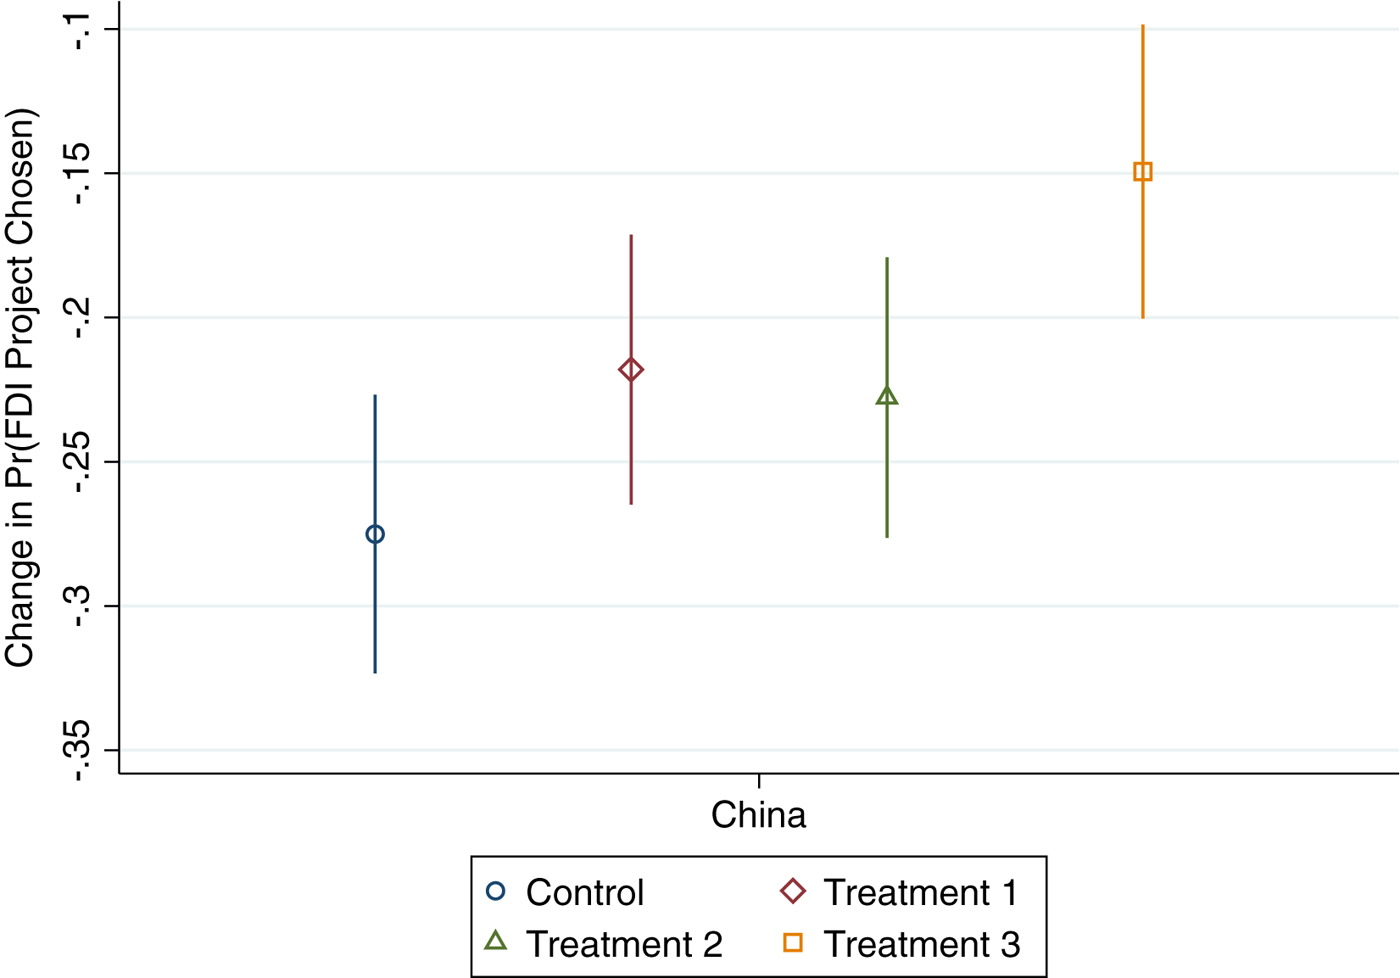
The results confirm that Canadians have considerable misperceptions about both the relative size of Chinese FDI and the regulations governing such investments in Canada. These misperceptions, in turn, make respondents 23.5 per cent and 27.5 per cent less likely to support FDI projects from China over comparable ones from Japan, the Netherlands, or the United States, in both the control group and in the treatment groups where only one misperception is corrected. However, when both misperceptions are corrected, respondents are only 15 per cent less likely to favour FDI projects from China, a statistically significant improvement in the odds ratio by 70 per cent. These findings lend support to the hypothesis that correcting factual misperceptions can lead to positive change in people's attitudes (see, for example, Eagly and Chaiken, Reference Eagly and Chaiken1993; Festinger, Reference Festinger1957; Gilens, Reference Gilens2001; Howell and West, Reference Howell and West2009) but only when misperceptions stemming from innumeracy and misinformation are corrected at the same time. This also suggests that failure to account for multiple sources of misperceptions could be one of the reasons why some studies (for example, Nyhan and Reifler, Reference Nyhan and Reifler2010) reported null or even negative effects of corrective information.
The rest of the article is organized as follows: First, we provide the context of the study by describing both the changing pattern of FDI inflow in Canada and the public debate on Chinese investment within the country. Next, we review the existing literature on misperceptions and political innumeracy, with a particular focus on how they affect policy preferences. We then introduce the design of our survey experiments and present the main findings. In conclusion, we discuss the theoretical and empirical contributions of our study and potential policy implications.
Public (Mis)perceptions of FDI in Canada
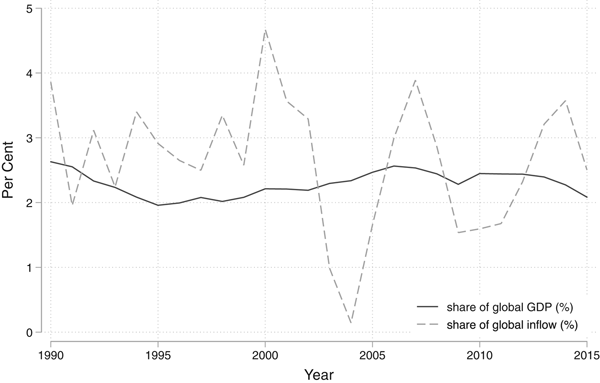
The perceived economic benefits from FDI have led to competition for global capital among countries in the past few decades. With its reputation for political stability, a market-oriented economy, and a robust legal framework, Canada has outperformed many countries in attracting foreign investments. Although the annual inflow of FDI has undergone some fluctuations closely related to the cyclical circumstances of the international financial market over the years,Footnote 1 Canada has managed to attract a larger share of FDI flows relative to its share of global gross domestic product (GDP), indicating that the country, in general, has been a successful and popular FDI destination (see Figure 1).
Canada's Share of Global FDI Inflow vis-à-vis Its Share of Global GDP.

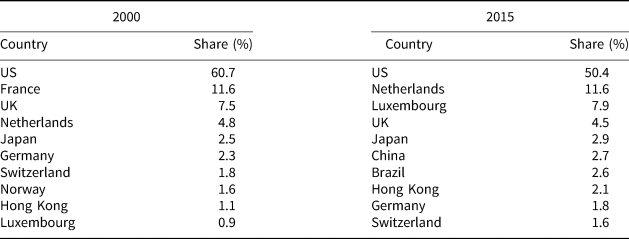
On the other hand, there have been some notable changes in the list of major home countries of FDI stock in Canada. In 2000, most FDI in Canada came from other developed countries, particularly the United States, which accounted for over half of Canada's total FDI stock. In addition, all of the top 10 countries investing in Canada were advanced industrialized economies. In 2015, whereas the United States and European countries still accounted for the lion's share of FDI in Canada, some countries with large emerging economies, especially China and Brazil, started to surpass some traditional investors, ranking sixth and seventh, respectively, in the top 10 list (Table 1).
Top 10 Home Countries of FDI Stock in Canada, 2000 and 2015

Source: Table 376-0051, Statistics Canada, http://www5.statcan.gc.ca/cansim/a26?lang=eng&id=3760051
Within Canada, foreign investment has been an issue of public debate since the 1950s, at times stoking economic nationalism in Canada with “an aroused public demanding that politicians rush to the barricades to defend Canada's sovereignty—or at least the interests of its leading business—against the perils of foreign control” (Hale, Reference Hale2008: 719). As Hale noted, the ups and downs of economic nationalism form the backdrop for Canada's receptiveness to foreign investment: the 1950s and 1960s featured internationalism, and foreign capital was encouraged by both provincial and federal governments. This was reversed under the Trudeau government in the 1970s, which leaned toward economic nationalism, with initiatives aimed at tighter control. Starting in the 1980s, however, controls on FDI were once again relaxed, reflecting a global diffusion of neoliberalism.
The old controversy fuelled by economic nationalism has re-emerged recently, particularly with regard to the influx of FDI from China, a new and unfamiliar investor in the eyes of the Canadian public. Compared with FDI from traditional investor countries, Chinese investments have some unique characteristics that have challenged Canadians’ conventional perceptions of FDI. First, the majority of Chinese investments so far have been made by its state-owned enterprises (SOEs) rather than private investors. Second, Chinese investments in Canada are highly concentrated, with nearly half of them going into the extractive and energy sectors (Grant, Reference Grant2012). Finally, compared to investors from other democratic countries, Chinese companies have a poor reputation for their labour and environmental standards back home.
It should not come as a surprise that the rise of Chinese investment has sparked another flare-up of debate in Canada, reaching the boiling point in 2012 when the China National Offshore Oil Corporation (CNOOC), an oil-industry giant owned by the Chinese government, announced its bid to acquire Nexen, a Calgary-based Canadian oil and gas company. The proposed deal of USD 15.1 billion was, at the time, the largest overseas acquisition by any Chinese company. The public discourse in Canada, although for decades generally supportive of open economic policies, was deeply divided over the case, with “private investor, financial sector and media advocates of property rights on one side, and a broad cross-section of corporate executives and market-oriented economists on the other” (Hale, Reference Hale2014: 364). In fact, the deal attracted so much public attention that it took over six months for the federal government to review and finally approve the transaction. More importantly, the deal led to institutional changes with far-reaching implications, as it pushed the federal government to tighten its FDI regulatory framework in a way that stressed that future takeovers of Canadian firms by foreign state-owned enterprises would be approved only on an “exceptional basis”.
The general anxiety within the Canadian public over Chinese FDI has not subsided, however, as indicated by the APFC poll cited earlier. The poll also identified several commonly held misperceptions. First, Canadians substantially overestimated the relative size of Chinese FDI in Canada, assuming that companies from China owned one-quarter (25%) of all FDI in Canada, while the official figure is closer to 3 per cent. Second, a quarter of the respondents wrongly believed that foreign companies are not subject to Canadian laws and regulations. Finally, nearly a third of the respondents were under the false impression that large foreign investments could go through without federal government approval (APFC, 2015).
What is more interesting is that the APFC poll also found that Canadians who significantly overestimated the extent of Chinese ownership in the Canadian economy were also more likely to say Canada has allowed “too much” investment from China to enter the country (APFC, 2015). Similarly, Canadians who were misinformed about foreign investment rules and practices tended to be the least supportive of investments from China, possibly for fear of exposing Canada to lower environmental and labour standards and potential damages to the Canadian value of fairness and equality. These findings seem to suggest a potential link between misperceptions held by Canadians and their attitudes toward Chinese FDI projects.
Misinformation, Innumeracy and Bias in Public Attitudes
It is widely accepted among political scientists that the participation of an educated and well-informed populace lays the foundation for a functioning democracy (Lewandowsky et al., Reference Lewandowsky, Ecker, Seifert, Schwarz and Cook2012). In theory, this requires that citizens in a democracy have ready access to factual information that facilitates the evaluation of public policy and that they absorb and apply the facts to overcome areas of ignorance when forming their preferences (Kuklinski et al., Reference Kuklinski, Quirk, Jerit, Schweider and Rich2000). In reality, studies have shown that many citizens in democratic societies appear to lack factual knowledge about political matters and are unfamiliar with politically relevant numbers (see, for example, Carpini and Keeter, Reference Carpini and Keeter1996; Lawrence and Sides, Reference Lawrence and Sides2014). This political ignorance, in turn, leads citizens to rely on heuristics and information shortcuts to express their issue opinions, rather than counting on factual information that is specific to the policy deliberations (Lupia, Reference Lupia1994). Even worse, as identified by Kuklinski et al. (Reference Kuklinski, Quirk, Jerit, Schweider and Rich2000), many citizens may unknowingly base their policy preferences on false, misleading or unsubstantiated information. Such misinformation can lead to the making of political and societal decisions that run counter to a society's best interest (Lewandowsky et al., Reference Lewandowsky, Ecker, Seifert, Schwarz and Cook2012).
In recent years, a growing body of literature has attempted to identify the sources and consequences of misperceptions, defined as people's false and unsubstantiated beliefs about factual matters (Nyhan and Reifler, Reference Nyhan and Reifler2010). The general consensus is that misperceptions abound among citizens in democracies, regarding a wide range of policy issues (see, for example, Alba et al., Reference Alba, Rumbaut and Marotz2005; Herda, Reference Herda2013; Citrin and Sides, Reference Citrin and Sides2008; Theiss-Morse, Reference Theiss-Morse2003). For instance, in a telephone survey of Illinois residents about federal welfare programs, Kuklinski et al. (Reference Kuklinski, Quirk, Jerit, Schweider and Rich2000) asked respondents about facts relevant to American welfare programs. Their results showed that respondents had highly inaccurate beliefs about welfare policies generally and that the least-informed people expressed the highest confidence in their answers. Kull et al.’s study on the Iraq War (Reference Kull, Ramsay and Lewis2003) similarly disclosed certain false beliefs held by the American public. According to their polls, many Americans wrongly believed that the United States had found weapons of mass destruction in Iraq and that Iraq was providing support to al-Qaeda.
While many misperceptions arise from misinformation, they can be further compounded by innumeracy, or “collective statistical illiteracy” (Gaissmaier and Gigerenzer, Reference Gaissmaier and Gigerenzer2008: 412), which refers to the inability of ordinary citizens to process quantitative information (Peters, Reference Peters2006). Similarly, scholars have identified citizens’ inability to understand risk and probabilities, or to overestimate or underestimate the size of subgroups (Alba et al., Reference Alba, Rumbaut and Marotz2005). The APFC poll cited earlier on Canadians’ overestimation of Chinese FDI is an example of this type of innumeracy. Another example is discussed by Herda (Reference Herda2010), who found that citizens in 21 European countries overestimated the number of immigrants in the population by 11.7 per cent, on average. In addition, Kahan et al. (Reference Kahan, Peters, Dawson and Slovic2013) showed that innumeracy can itself be a function of directionally motivated reasoning, exacerbating the prevalence of misperceptions.
In addition to recognizing the sources and extent of misperceptions among democratic citizens, scholars have investigated whether misperceptions can be corrected and whether providing correct information can lead to preference changes. The results have been mixed. In the study conducted by Kuklinski et al. (Reference Kuklinski, Quirk, Jerit, Schweider and Rich2000), corrective information had a positive effect. Respondents provided with the correct amount for national welfare expenditure in the United States changed their opinions about welfare policy. Similarly, Gilens (Reference Gilens2001) and Howell and West (Reference Howell and West2009) found that providing relevant facts to interviewees before asking them their opinions led to significant changes in their preferences regarding issues of crime, foreign aid, and education policy. Most recently, Scotto et al. (Reference Scotto, Reifler, Hudson and van Heerde-Hudson2017) have shown that providing respondents with information about foreign aid spending as a percentage of the national budget significantly reduces support for cuts to that spending.
According to some other studies, however, misperceptions can be stubborn and enduring. For example, Lawrence and Sides (Reference Lawrence and Sides2014) conducted three original surveys in which respondents were first asked to estimate the average income and educational attainment, the unemployment and poverty rates, and the racial composition of the population in the United States. Then those respondents were randomly assigned to the experimental group or the control group and asked to state their preferences about relevant policies. The results indicated that although estimates about these political facts were frequently far from true, providing correct information had little effect on attitudes. Similarly, Citrin and Sides (Reference Citrin and Sides2008) showed that correcting overestimations of the size of minority group populations or priming the annual level of immigration in the United States had little effect on attitudes toward immigration.
A study by Nyhan and Reifler (Reference Nyhan and Reifler2010, Reference Nyhan and Reifler2015) found that corrective information may even increase misperceptions. They argued that citizens are rarely provided with definitive corrective information; instead, they typically receive corrective information in media reports that are less authoritative, less direct, and easier to interpret either positively or negatively. By rationalizing the information, people tend to shape their perceptions of facts to fit the opinions they already hold. Consequently, correcting misperceptions can even “backfire” by worsening misperceptions among those least predisposed to believe the correct information. Their empirical results resonate with those of Gaines et al. (Reference Gaines, Kuklinski, Quirk, Peyton and Verkuilen2007), who discovered that Democrats and Republicans in the United States interpreted casualties in the Iraq War differently after receiving the facts, with Republicans more likely to perceive the number of casualties as moderate or small.Footnote 2
In sum, existing studies have demonstrated the consequences of public misperceptions and the difficulties in correcting them. We extend this line of work in the present study by exploring Canadian public attitudes toward Chinese FDI, where widespread misperceptions are compounded by political innumeracy.
Research Design
We investigate the extent of misperceptions among Canadians toward Chinese investments and the effect of correcting such misperceptions in the context of a randomized experiment embedded in a large online public opinion survey.Footnote 3 In the beginning of the experiment, after introducing the general idea of FDI, we ask each respondent two questions to tap into the extent and degree of misperceptions of Chinese FDI in Canada that arise from innumeracy and misinformation. The first question asks respondents to estimate, using sliders from 0 to 100, the percentage of FDI stocks in Canada owned by companies that come from the following five countries: the United States, China, Japan, India, and the Netherlands. Immediately after respondents answer this question, half are randomly chosen to be presented with the correct percentages of FDI from these five countries, based on numbers released by Statistics Canada; these numbers are placed side by side with their own estimates in a table.
The second question asks respondents whether the following three statements regarding FDI regulations in Canada are true or false: (1) foreign companies that invest in Canada are not subject to Canadian laws and regulations, which may lead to lower labour or environmental standards; (2) large foreign investments must receive approval from the federal government; and (3) investments made by foreign state-owned enterprises go through the same screening and approval procedure as investments made by private companies. Once again, after respondents answer the questions, we randomly choose half of the respondents, and we tell them whether their existing perceptions are correct, along with providing a brief explanation taken from sources such as Statistics Canada and relevant Canadian laws and regulations.
This setup randomly places the respondents into four groups: In the first treatment group, we correct the innumeracy of the respondents regarding the size of Chinese FDI in Canada relative to FDI from other major countries. In the second treatment group, we correct the misperception of the respondents regarding the rules and regulations governing FDI in Canada. Respondents in the third treatment group receive both corrections, and the control group receives neither.
In the main part of the survey, we use a series of conjoint experiments to assess whether correcting misperceptions will lead to changes in a respondent's attitude toward FDI from China. Developed in marketing and psychology to analyze multidimensional choices, conjoint analysis involves having respondents evaluate two or more hypothetical options (for example, several political candidates) with multiple attributes (for instance, race, party and ideology), and then estimating how each attribute affects respondents’ preferences for different options. Conjoint design has increasingly been used in studies of politics and international political economy (see, for example, Bechtel and Scheve, Reference Bechtel and Scheve2013; Hainmueller and Hopkins, Reference Hainmueller and Hopkins2014; Hansen et al., Reference Hansen, Olsen and Bech2014; Umaña et al., Reference Umaña, Bernauer and Spilker2014).
Similar to these earlier studies, our conjoint module begins with a short introductory text and instructions on how to complete the choice-tasks. After this, respondents are asked to choose one of two hypothetical FDI proposals that will result in at least a 10 per cent change in shares of the ownership. Each proposal is associated with multiple attributes, which are presented to the respondents side by side in a table. To minimize primacy and recency effects, the ordering and contents of the attributes are fully randomized. We repeat this binary comparison twice for every respondent, and each time they are asked to pick the proposal they prefer.
We include a total of three features for each FDI proposal in the conjoint analysis. Table 2 lists the attributes and values used in the conjoint analysis.Footnote 4 The most important one is country of origin, which includes the United States, Japan, China, and the Netherlands. Existing works have shown that perceptions of foreign investment depend on the favourability of the investment source country (Jensen and Lindstädt, Reference Jensen and Lindstädt2013). Li and Zeng (Reference Li and Zeng2017), for example, found that Chinese respondents are less likely to favour FDI from Japan and the Philippines than from other regions, due to the long history of animosity and recent territorial disputes between China and these Asian neighbours. We expect that respondents in our study will be less likely to support FDI projects from China than projects from other countries. As discussed earlier, we hypothesize that the bias against Chinese FDI is attributable to misperceptions about the actual size of FDI and how they are regulated in Canada. After these misperceptions are corrected, we expect that respondents will be less likely to disapprove of FDI projects from China.
Attributes and Values in the Conjoint Analysis

It could be that Canadians’ disapproval of Chinese FDI stems from other features of a given project, such as the sector of the investment. If these confounding factors are correlated with China—for example, if respondents believe that Chinese FDI is concentrated in the resource sector, which would pose security risks for Canada—then we need to control for them in the design. Otherwise, even if we correct the misperceptions about size and regulation, respondents may still dislike Chinese FDI.
We include two such features in the design: sector of investment and ownership type of the foreign investor. First, the earlier discussion about Canada's economic nationalism suggests that Canadians are most concerned about foreign investments in the energy and natural resources sectors, as they worry about loss of sovereign control over valuable resources.Footnote 5 Therefore, we expect respondents to be less inclined to FDI proposals in the resources sectors. Second, given the rise in controversy over the strategic and political risks evoked by investments that are driven by investors backed by foreign governments, we expect Canadian respondents to be warier about FDI from SOEs than those from private investors.
Main Results
We implemented the survey via Qualtrics to a random sample of 1,519 Canadian adults (age 18+) from August 30 to September 12, 2017. The average age in our sample is 46, compared to 41 for the national average.Footnote 6 The gender ratio (number of males per 100 females) in our sample is 98, compared to 97 in the national statistics. About 61 per cent of our respondents have postsecondary education qualifications, compared to the national average of 64 per cent. The largest group of respondents are from Ontario (38%), followed by Quebec (24%), British Columbia (18%) and Alberta (9%)—a population breakdown similar to the one found in the 2016 census. Overall, our sample is representative of the entire adult population of Canada with respect to key demographic variables.
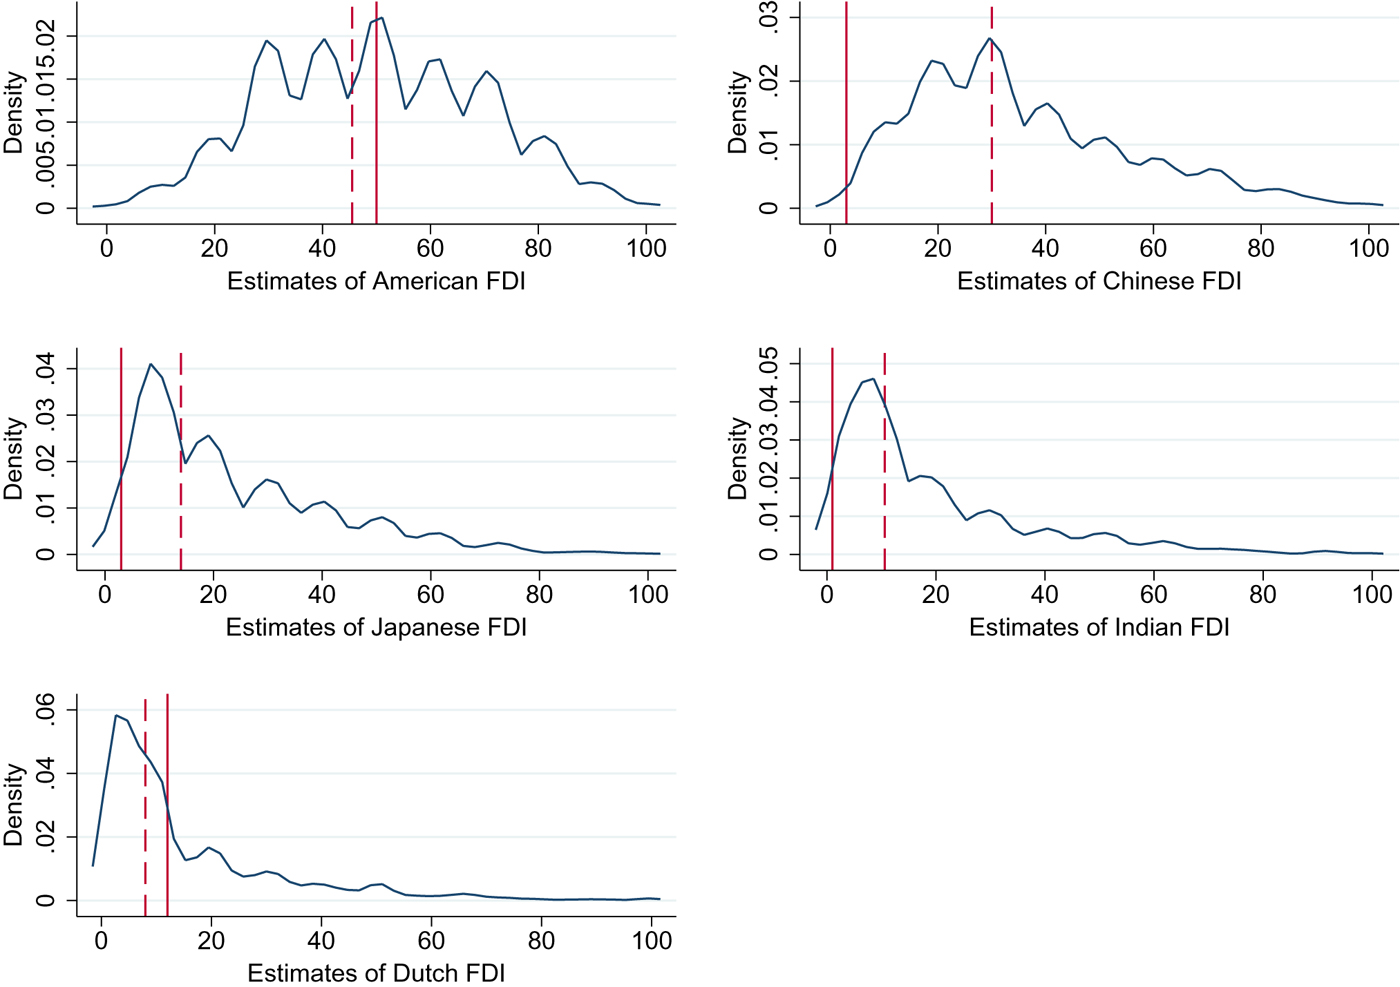
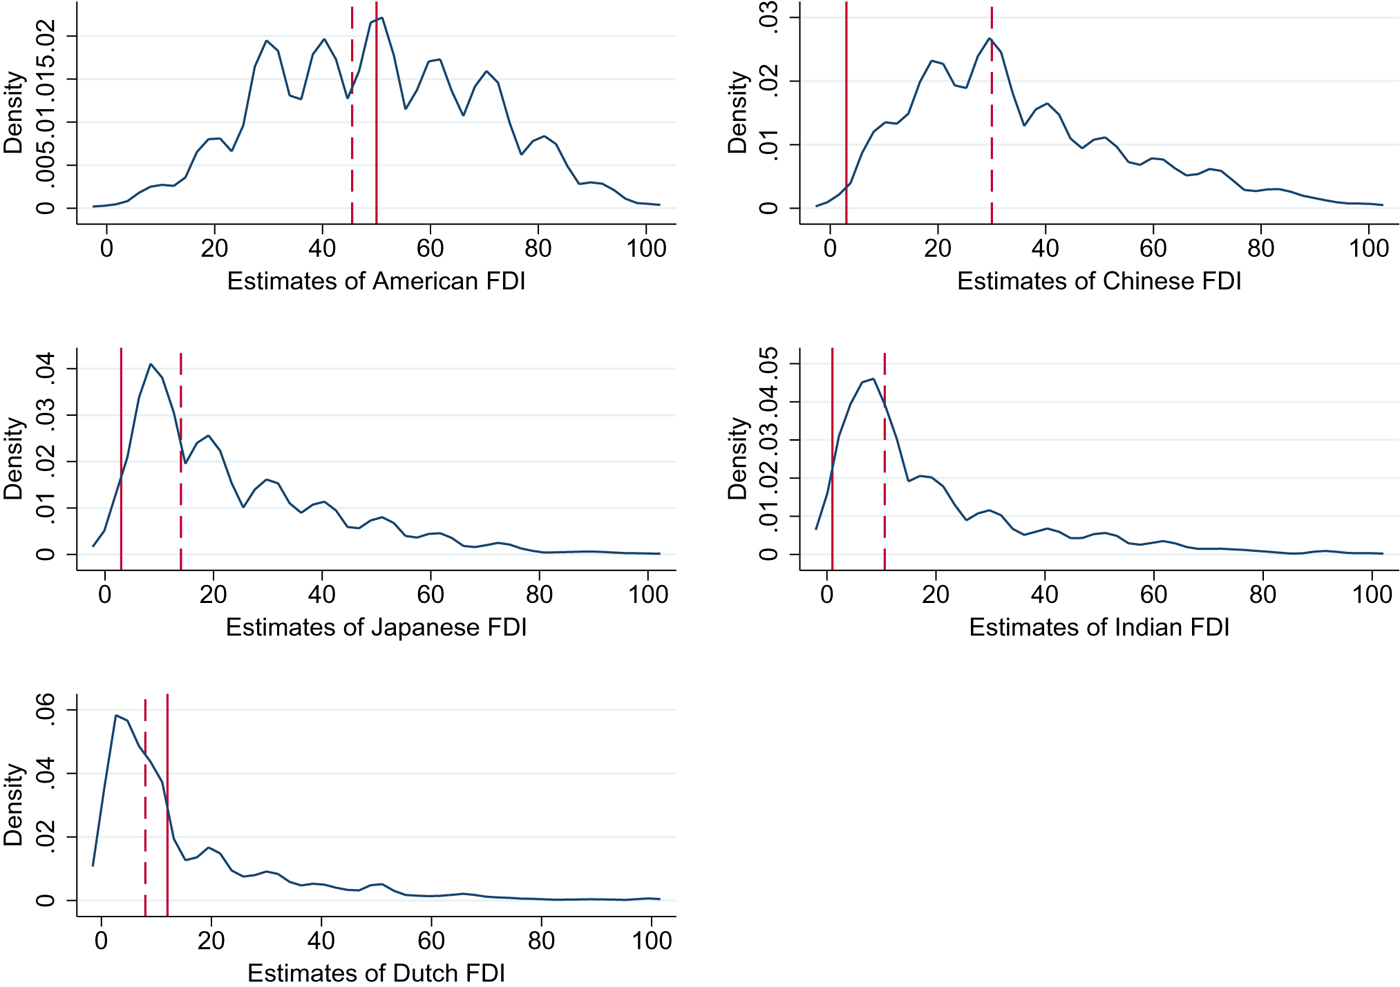
We first examine the number of misperceptions and degree of innumeracy among our sample. Figure 2 illustrates the distribution of respondents’ estimates about the percentage of FDI coming from each of the five countries: the United States, China, Japan, India, and the Netherlands. The solid line is the official number from Statistics Canada, and the dashed line is the mean of the estimates from the respondents. Our study confirms and measures these misperceptions. More specifically, respondents in our sample on average estimated that the percentage of FDI in Canada coming from China is 30 per cent, which is similar to the estimates given by respondents in the APFC national poll and 10 times greater than the Canadian official statistics. Only 3 out of the 1,519 respondents provided the correct answer of 3 per cent. For the United States, Japan, India, and the Netherlands, respondents’ estimates were much closer to the actual amounts calculated, using official figures from Statistics Canada.Footnote 7
Estimates of the Share of FDI in Canada by Country.
In terms of knowledge about the FDI regulatory framework in Canada, respondents did quite well with respect to the first two statements. On average, 73.7 per cent and 69.7 per cent of respondents correctly identified that foreign companies must obey Canadian domestic laws and that large FDI projects need scrutiny and approval from the federal government before being allowed to go forward. These numbers are nearly identical to the numbers reported in the APFC survey. In contrast, respondents in our sample scored much worse in the question regarding FDI from foreign SOEs: only 17 per cent gave the correct answer that these investments are subject to tighter rules and approval procedures set by the government. Altogether, only 102 out of the 1,519 respondents answered all three questions correctly.
To obtain the average marginal component effect (AMCE) of each attribute value on the support for each of the 6,076 (2 × 2 × 1,519) FDI projects, we use a linear probability model that predicts whether the respondent chose a particular project on a set of dummy variables corresponding to the values of each feature, with one value excluded as the baseline.Footnote 8 Standard errors are clustered on the respondent to account for within-respondent correlations in their responses. The regression coefficient for each dummy variable thus represents the AMCE of that value of the feature relative to the omitted baseline value.
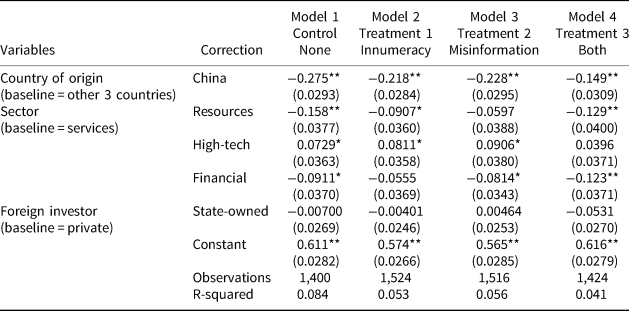
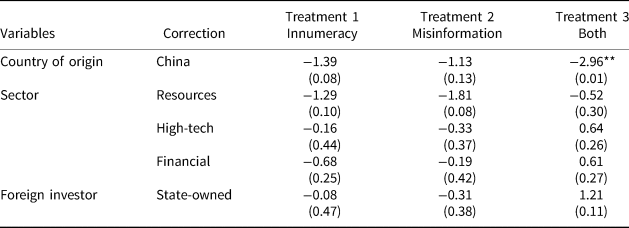
Table 3 presents the coefficient estimates of four models corresponding to the control and treatment groups in our sample.Footnote 9 The first feature we notice is that the coefficient estimates for country of origin, our main variable of interest, are all negative and statistically significant, suggesting that respondents, on average, are less likely to pick FDI projects from China over comparable projects from the other three countries.Footnote 10 These results are consistent with the findings in the APFC national poll that Canadians on average are less supportive of FDI coming from China.
Effect of FDI Features on Individual Preferences

Note: Robust standard errors clustered by respondent in parentheses.
* p < .05
** p < .01
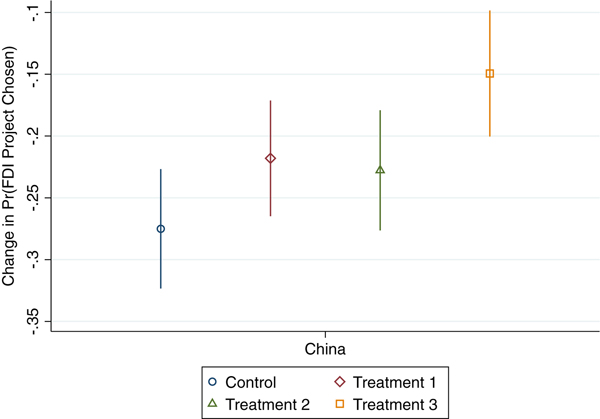
Figure 3 illustrates the marginal effect of country of origin on the four models. In the control group, where the respondents received no correction, respondents are 27.5 per cent less likely to favour FDI projects from China. Informing the respondents of either the correct amount of Chinese FDI in Canada (treatment 1) or Canada's regulations governing foreign aid (treatment 2) narrows the gap by about 4 per cent, though the differences are not statistically significant. For respondents who received both corrections, however, the difference drops further, to 15 per cent, which is equivalent to a statistically significant improvement in the odds ratio by 70 per cent.Footnote 11 Put differently, even though respondents still view Chinese FDI projects less favourably than comparable ones from Japan, the Netherlands, or the United States, receiving both corrections leads to a substantial reduction of this “China penalty”. These findings lend support to the hypothesis that correcting factual misperceptions can lead to positive change in people's attitudes, though correction seems to work only when both sources of misperception—innumeracy and misinformation—are corrected.Footnote 12
Marginal Effects of Country of Origin on Individual Preferences.
The fact that public attitudes toward foreign investments can be swayed by one-shot, temporary information correction also suggests that such attitudes are much more malleable than those that are developed and formed in a long process of socialization, such as feelings about national identity.Footnote 13 Whether these attitudinal changes can be sustained over time is an important topic for future research. But the practical implication is that it is possible for governments to use short-term informational campaigns strategically launched at critical time points to rally support from a public that may be misinformed about the content or consequences of certain public and foreign policies.
We now turn to the control variables in Table 3. Regarding industrial distribution of FDI inflows, respondents, not surprisingly, feel less favourably toward FDI projects in the energy and natural resources sectors but welcome projects in the high-tech sector. Interestingly, there is no evidence to suggest that respondents differentiate between FDI from private and state-led investors. This is somewhat surprising given widespread reporting of public resentment toward SOEs. It seems that the media and some politicians are exaggerating public fear about SOEs; the Canadian public is much more concerned about the economic rather than the strategic aspects of foreign investments.
One potential concern about our results is that the treatments could be potentially causing individuals to place greater weight on other dimensions of the FDI proposal, such as the sector, and thus reducing the coefficients on China. While the coefficients on the control variables seem to be quite similar across the four models, we can formally compare them using the Wald test of coefficient equality. The results, presented in Table 4, show that the coefficients for the sector and ownership variables in the treatment groups do not differ significantly from those in the control group, lending support to our interpretation that it is the factual correction treatment that is reducing the negative attitudes toward Chinese FDI projects relative to projects from other countries.
Equality of Coefficient Tests

Note: This table calculates the differences of the coefficients between the control and treatment groups from Table 3. Z-scores from Wald test of coefficient equality in parentheses.
* p < .05
** p < .01
Generalizability and External Validity
Do the above findings vary according to some socio-demographic features of the respondents, reflect alternate determinants of preference formation, or carry over to a different sample at a different time period? We investigate these questions regarding generalizability and external validity in several ways. First, we look at heterogeneous treatment effects by examining whether some subgroups of our sample respondents view Chinese investment differently; to do this, we reanalyze our results by distinguishing between self-identified party affiliation of the respondents (Liberal versus Conservative) and their exposure to news about China. Second, we examine whether the treatment effects might reflect some alternate determinants of attitude formation; to do this, we partition respondents based on their answers to two attitudinal questions in the survey that gauge their overall opinion on China (favourable versus unfavourable) and their concern about Chinese influence on the “Canadian way of life”.Footnote 14
The results, presented in Appendix D, broadly conform to conventional wisdom. In the control group and the treatment groups with only one factual correction, respondents who are identified with the Conservative Party, who hold a strong or moderately unfavourable view of China, and who are somewhat or very much concerned about China's growing presence in Canada are also more disapproving of FDI projects from China. Nevertheless, the subgroups in each of the four partitions have treatment effects in the same direction and are statistically indistinguishable from one another. This suggests that our results can be generalized to different types of individuals and are robust against alternate drivers of preferences for Chinese investments.
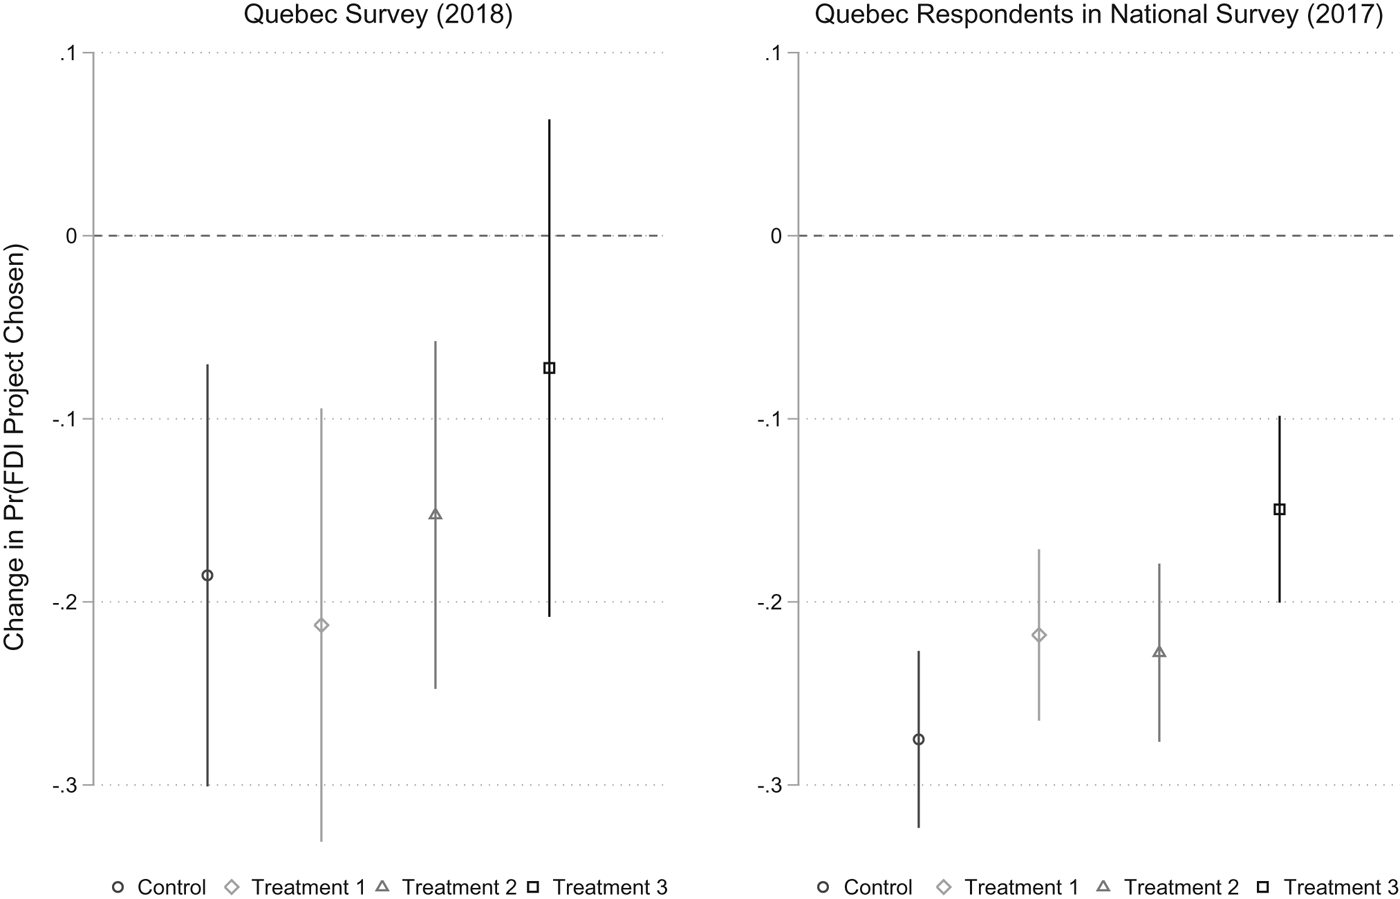
Finally, we explore whether the trends identified in our experiments are present for a different set of respondents at a different time period. We do so by replicating the conjoint experiment in a public opinion survey administered to 521 Francophone Quebecers from December 18, 2017, to March 5, 2018. Respondents were screened into the survey only if they lived in Quebec and spoke French as their mother tongue. Unlike the national survey, this one was provided in both English and French, though 296 of the respondents chose to complete the questionnaire in English.
The results of the conjoint experiment are presented in Figure 4.Footnote 15 As a comparison, we also include the results for the Quebec subsample from the original survey. Two things are worth noting. First, all of the point estimators in the 2018 Quebec survey are closer to zero than their counterparts are in the full survey. This is consistent with the general finding from that survey that Quebecers have more positive views of China and the prospect of deeper relations than the rest of Canada does (Massot et al., Reference Massot, Evans and Li2018). Second, similar patterns emerge with respect to the factual correction treatments. In the Quebec survey, in particular, correcting both sources of misperceptions seems to have even removed the “China penalty”. Of course, due to the small sample size, the much wider confidence intervals make it harder for us to draw conclusive inferences in comparing the treatment effects. Nevertheless, they provide suggestive evidence that our findings are not unique to the particular sample we drew.
Marginal Effects of Country of Origin on Individual Preferences.

Conclusion
In this study, we investigated the scope and consequences of misperceptions held by the Canadian public about Chinese investments in Canada. We found that the majority of the respondents in our survey substantially overestimated the amount of Chinese FDI in Canada and held incorrect beliefs about the regulation and approval procedures for foreign investments in the country. Results from the conjoint analysis further confirmed that these misperceptions constitute an important source of the public's disapproval of Chinese FDI projects. Correcting both types of misperceptions (innumeracy and misinformation), however, leads to a substantial reduction of disapproval of such projects among respondents. These findings help shed light on the empirical indeterminacy in the literature regarding the effectiveness of corrective information. In particular, scholars that discover null or even negative effects of correction may need to further examine whether the misperceptions they study arise from multiple sources.
In addition, we find that the standard economic features of an FDI project are important predictors of the public's preferences. In particular, respondents find FDI projects in the energy and natural resources sectors less desirable compared to investments in the financial, service and high-technology sectors. But the more intriguing finding is that state ownership does not seem to matter. This finding runs counter to media reports and the APFC 2015 national poll suggesting that Canadians are averse to investors controlled by foreign governments. Overall, Canadian citizens seem to care more about the economic benefit that a foreign investment project may bring to the table than about the strategic and political implications of the intrusion of foreign state-controlled firms.
This study contributes to the literature on misperceptions, which has thus far focused primarily on their effects on domestic policies. The study also enriches the recent scholarship in international political economy that explores the sources of individual preferences for FDI. In addition, given the rapid expansion of Chinese FDI and the controversial political repercussions throughout the world, this study has important implications for policy makers. For Canada, in particular—which has recently ramped up its business ties with China, following a bilateral investment treaty signed in 2014, and in light of a potential free trade agreement currently in talks—Ottawa may want to find ways to dispel the misperceptions held by the public regarding Chinese investments, in order to prevent potential backlashes in the future.
Supplementary material
To view supplementary material for this article, please visit https://doi.org/10.1017/S000842391800080X
Acknowledgments
The authors wish to thank Richard Johnston, Andrew Owen and Paul Quirk for helpful comments on earlier drafts of the article. The project is supported by an SSHRC Explore Grant (F17-01669) from the University of British Columbia's Faculty of Arts.