I. INTRODUCTION
In recent past, carbon allotropes like carbon nanotubes and graphene have fascinated researchers for their interesting thermal, electrical, mechanical, and optical properties. Variation of carbon–carbon covalent bonds and orientation of carbon atoms in crystals lead to the formation of different carbon allotropes, having distinct physical properties, like graphite, diamond, carbon nanotubes, and graphene. Graphene is a monolayer of sp 2 carbon atoms, bound in a honeycomb-like hexagonal lattice.Reference Geim and Novoselov1 Graphene can be made by mechanical exfoliation of graphite, commonly known as Scotch tape method (top-down approach),Reference Novoselov, Geim, Morozov, Jiang, Zhang, Dubonos, Grigorieva and Firsov2 or via epitaxial growth of carbon atoms on silicon carbide substrate by the chemical vapor deposition technique (CVD, bottom–up approach).Reference Berger, Wu, Brown, Naud, Li, Song, Mayou, Li, Hass, Marchenkov, Conrad, First and De Heer3,Reference Patel, Yu, Chou and Iqbal4 Both of the above-mentioned techniques are not suitable for bulk production of graphene because of low yield or high cost of production.
A suitable alternative for efficient bulk production of graphene can be the chemical exfoliation method (top–down approach) of graphite where several carbon planes are found to be attached together by strong van der Waals attraction force. In the chemical exfoliation method, intercalation of carbon layers in graphite is performed by introducing strong oxidizers. The oxidizers separate the carbon layers and, at the same time, the lattice of graphene is disrupted by the introduction of oxygen-containing functional groups like carbonyl, epoxy, carboxylic acid, and hydroxyl groups.Reference Lerf, He, Forster and Klinowski5–Reference Szabó, Berkesi, Forgó, Josepovits, Sanakis, Petridis and Dékány7 Introduction of functional groups in the sp 2 carbon layer alters the physical properties of graphene oxide (GO) from graphene. Unlike graphene, GO has poor thermal and electrical conductivity because of the functionalities. Introduction of hydroxyl groups also makes GO hydrophilic and hence GO is soluble in water, whereas graphene is strongly hydrophobic and insoluble in water.
GO, formerly known as graphitic oxide, was first synthesized by BroadieReference Brodie8 in 1859 by adding KClO3 to a fuming mixture of graphite and nitric acid. Later, the method was modified by introducing sulfuric acid with nitric acid.Reference Staudenmaier9 In 1958, Hummers and OffemanReference Hummers and Offeman10 prepared GO by adding sulfuric acid to a mixture of graphite, potassium permanganate, and sodium nitrate. The Hummers method turned out to be the most popular method to produce GO by chemical synthesis and attracted many researchers. The process has serious drawbacks like poor yield, emission of toxic gas like NO2 and N2O4, and precise control of temperature is necessary as hazards of explosion are associated with it. In recent past, Marcano et al.Reference Marcano, Kosynkin, Berlin, Sinitskii, Sun, Slesarev, Alemany, Lu and Tour11 prepared GO by the improved Hummers method, eliminating NaNO3. This method is also known as Tour’s method. The advantage of this method is that the elimination of NaNO3 reduces the possibility of explosion and introduction of phosphoric acid arrests the fume generated by the reaction of sulfuric acid and potassium permanganate. Researchers carried out experiments with different oxidizers. High yield of GO was achieved by replacing KMnO4 with K2FeO4 in the improved Hummers method.Reference Yu, Zhang, Bulin, Li and Xing12
The advantage of synthesis of graphene from the reduction of GO is that different properties like thermal and electrical conductivity, specific surface area, and solubility can be tuned by controlling the extent of reduction. GO can be reduced by various techniques, e.g., chemical and thermal treatments. GO can be chemically reduced by a three-step method to produce water-soluble graphene, which also possesses high electrical conductivity.Reference Si and Samulski13 Graphene can also be obtained by ionic-liquid assisted electrochemical exfoliation of the graphite electrode.Reference Lu, Yang, Wang, Lim, Wang and Loh14 Microwave-assisted heating can also be used to prepare graphene-like materials from graphite or GO.Reference Chen, Yan and Bangal15 Microwave heating of GO processed by the Hummers method causes volume expansion.Reference Zhu, Murali, Stoller, Velamakanni, Piner and Ruoff16 Microwave heating of GO causes a significant increase in specific surface area and can be used as adsorbents.Reference Shulga, Baskakov, Knerelman, Davidova, Badamshina, Shulga, Skryleva, Agapov, Voylov, Sokolov and Martynenko17 GO sheets can be reduced by applying electric current in high vacuum.Reference Jung, Dikin, Piner and Ruoff18 Among all the reduction techniques, chemical and thermal treatments are popular among researchers for ease of operation and quality of end product. Since the chemical reduction route incorporates the use of hazardous chemicals and is very much time-consuming, the thermal reduction technique is mostly preferred. Thermal reduction of GO has been studied by several researchers.Reference Pei and Cheng19,Reference Larciprete, Fabris, Sun, Lacovig, Baraldi and Lizzit20
The properties of GO are dependent on the amount of oxygen, which are present as functional groups in its lattice. Hence, properties like electrical and thermal conductivity, solubility, etc. can be modified by removing the functionalities, i.e., by the method of reduction. Reduction of GO is mainly concerned with the elimination of hydroxyl and epoxy groups, as the other groups like carbonyl, carboxylic, and ester groups have no significant role in conductivity.Reference Pei and Cheng19
The two prime objectives that are to be achieved during the reduction of GO are the removal of functional groups and the curing of structural defects. The two effects that should be considered during the removal of functional groups are: whether the complete elimination of functionalities is possible and whether defects caused by the removal of functional groups can be repaired to a conjugated structure to have a definite pathway for carrier transport within reduced graphene oxide (rGO) sheets. Removal of functional groups by applying heat creates defects in the carbon lattice plane.Reference Bagri, Mattevi, Acik, Chabal, Chhowalla and Shenoy6 Thermal annealing of GO at 200 °C and 550 mtorr pressure in argon atmosphere for 6 h can entirely eliminate the hydroxyl group and also partially eliminate both carboxyl and epoxy groups.Reference Jeong, Lee, Jin, Kim, Bae and Lee21 The same study also observed that with increasing the time of annealing, the C/O ratio is improved. Another research reduced GO by thermal treatment at 1050 °C, followed by curing of defects at 800 °C in H2/Ar mixed atmosphere.Reference Xu, Zhang, Liu, Wang and Hu22 Experiments carried out at different annealing temperatures up to 1000 °C reported higher C/O ratio in less time.Reference Yang, Velamakanni, Bozoklu, Park, Stoller, Piner, Stankovich, Jung, Field, Ventrice and Ruoff23,Reference Mattevi, Eda, Agnoli, Miller, Mkhoyan, Celik, Mastrogiovanni, Granozzi, Carfunkel and Chhowalla24 From density functional theory (DFT), the binding energy of epoxy and hydroxyl groups are determined to be 62 kcal/mol and 15.4 kcal/mol, respectively, for a 32-carbon atom graphene unit.Reference Kim, Hwang and Ruoff25 Gao et al.Reference Gao, Jang and Nagase26 carried out a detail analysis of thermal reduction of GO theoretically. They reported that the binding energy of the hydroxyl group attached at the inner part is less stable as compared to a similar group attached at the edge. They also stated that critical dissociation temperature for hydroxyl groups at the edges is 650 °C and for epoxy groups, no particular critical temperature was found. It was also mentioned that the reduction of carboxyl groups starts at 100–150 °C and carbonyl groups possess high stability. Total elimination of these groups by thermal reduction is possible at a very high temperature (>1000 °C) and low pressure. Structural evolution of rGO with reduction temperature has been studied thoroughly for reduction at vacuum promoted heating.Reference Chen, Zhang, Yang, Huang, Yang and Wang27 Therefore, it can be concluded that complete exclusion of functional groups via thermal reduction technique is unlikely as binding energy of the functional groups are high. Thermal annealing triggers the functional groups to come out as water vapor, CO2, and CO from the carbon plane. The obtained exfoliated and reduced GO can be considered as graphene and this technique is suitable for the bulk production of graphene, which is an easier and comparatively inexpensive method.Reference Pei and Cheng19
Based on the literature focusing on the thermal reduction of GO, no in-depth analysis has been carried out to determine the onset temperature of thermal reduction at ambient conditions. Most of the detailed studies on the thermal reduction mechanism of GO are theoretical studies, based on DFT. Temperature plays the most crucial role in thermal reduction of GO, as it directly controls the quality of the end product. In the literature, experimental investigation of thermal reduction of GO has been studied under vacuum promoted conditions in different environmentsReference Jung, Dikin, Piner and Ruoff18,Reference Chen, Zhang, Yang, Huang, Yang and Wang27,Reference Mao, Pu and Chen28 and the role of temperature in thermal reduction at ambient conditions of GO has not been reported.
The present study states a modification over improved Hummers method or Tour’s method,Reference Marcano, Kosynkin, Berlin, Sinitskii, Sun, Slesarev, Alemany, Lu and Tour11 where GO has been prepared by using a lesser amount of reactant and almost equal yield of the product has been reported. GO has been exposed at various reduction temperatures for 30 min at standard atmospheric pressure and in ambient conditions to prepare rGO. Current work focuses on the determination of onset temperature for volume expansion during thermal reduction of GO and the effect of temperature for optimization of carbon content in weight percentage, as it indicates the quality of rGO. Reduction phenomena have been explained by using thermogravimetric analysis (TGA), Fourier transform infrared (FTIR) spectra, and carbon content in terms of weight percentage in GO and rGO specimens.
II. EXPERIMENTAL PROCEDURE
A. Chemicals
Graphite powder (98% pure) was obtained from Loba Chemie (Mumbai, India), and sulfuric acid (98%), fuming nitric acid (69%), ortho-phosphoric acid (88%), potassium permanganate (>99% pure), hydrogen peroxide (30%), hydrochloric acid (35%) were all obtained from Merck (Mumbai, India). Ethanol was obtained from Honyon International Ltd. (Suzhou, China) All reagents are of analytical grade.
B. Synthesis of GO & rGO
In the present work, synthesis of GO has been reported by introducing some modifications over Tour’s method. Graphite powder (procured from Loba Chemie, 98% pure) was pretreated by soaking in a mixture of concentrated sulfuric acid and nitric acid (1:1 volume ratio) for 7 days. A chilled mixture of 210 mL concentrated sulfuric acid and 30 mL phosphoric acid (7:1 volume ratio) was added slowly and gradually to a solid mixture of 3 g acid-treated graphite and 12 g KMnO4 (1:4 weight ratio), kept in an ice bath. The solution was then put in a stirrer under continuous stirring until it comes to room temperature. The solution becomes reddish brown in color. Now, the mixture was heated to 50 °C for 15 h. After that, the solution has been poured on 400 mL ice followed by the addition of 3 mL H2O2. A light brown or yellow color solution was formed. The solution was left for stirring for 2 h, followed by the addition of water and left for a few hours. Next, the heavy liquid phase, containing acid and KMnO4, was separated and the process was repeated for 2–3 times. Next, filtration was performed to separate the GO, followed by washing the cake with water, HCl, and ethanol respectively. The brown color cake is GO and is heated in a hot air oven at 55 °C for overnight to obtain a yield of 5.36 g of GO as the final product. In reported work, the requirement of acid is about 40% less and consumption of KMnO4 is also 33% less, compared to Tour’s method, whereas the yield is only 7.5% higher in Tour’s method.
GO has been reduced by keeping it at various reduction temperatures. A sudden change in temperature causes elimination of functional groups from carbon planes and exfoliation of GO takes place to produce rGO.
C. Instrumentation
Raman spectroscopy of graphite, GO, and all rGO specimens have been performed with a T64000 Jobin Yvon Horiba Raman spectrometer (Villeneuve d'Ascq, France) with an argon–krypton mixed ion gas laser and the range of Raman shift is 1000–3000 cm−1. X-ray diffraction (XRD) of GO and rGO specimens have been carried out by using a PANalytical X’PertReference Berger, Wu, Brown, Naud, Li, Song, Mayou, Li, Hass, Marchenkov, Conrad, First and De Heer3 powder diffractometer (Almelo, the Netherlands) under Cu Kα radiation of wavelength 1.54059 Å in the range of 10–90° with a step size of 0.05° and a time per step of 0.4 s. Transmission electron microscopy (TEM) and selected area electron diffraction (SAED) analyses have been performed by using a TECNAI FEI instrument (Osaka, Japan). FTIR spectra have been recorded using a Perkin Elmer FT-100 instrument (Waltham, Massachusetts) at a wavenumber range of 4000–450 cm−1. Field emission scanning electron microscopy (FESEM) analysis has been performed by using JEOL JSM 6410F (Tokyo, Japan). Elemental analysis has been carried out by using a vario MACRO cube instrument (Elementar Analysensysteme, Langenselbold, Germany) using the CHNS mode. The specific surface area has been measured by Brunauer–Emmett–Teller (BET) analysis by using a Quantachrome Autosorb system (Boynton Beach, Florida). TGA has been carried out by using a TGA Q50 V20.13 instrument made by TA Instruments (New Castle, Delaware) with applying a heating rate of 10 °C/min.
III. RESULTS AND DISCUSSION
A sudden change in temperature generates a thermal shock and functionalities are taken out from the GO lattice as water vapor, CO, and CO2. Evolution of gases generates pressure between two GO stacked layers which is the key factor for exfoliation. According to the state equation reported by McAllister et al., 40 MPa pressure is generated at 300 °C, and at 1000 °C, the pressure rises to 130 MPa, while 2.5 MPa pressure is required for exfoliation.Reference Pei and Cheng19,Reference Mattevi, Eda, Agnoli, Miller, Mkhoyan, Celik, Mastrogiovanni, Granozzi, Carfunkel and Chhowalla24 After thermal reduction of GO, weight loss with volume expansion is reported in the literature.Reference Pei and Cheng19,Reference Schniepp, Li, McAllister, Sai, Herrera-Alonson, Adamson, Prud’homme, Car, Seville and Aksay29 A higher degree of thermal shock induces better reduction, but functional groups like carbonyl and epoxy are taken out as CO2 and CO, causing defects in the lattice. In the current study, thermal reduction of GO has been observed at various reduction temperatures, i.e., 300 °C, 325 °C, 350 °C, 400 °C, 450 °C, and at standard atmospheric conditions, to find the onset temperature where exfoliation of GO begins. The carbon–oxygen ratio of rGO has been evaluated after heating at different temperatures for the determination of optimum temperature where the reduction is maximized and also the defect in the graphene lattice due to thermal shock is minimized.
GO has been exposed to a range of temperatures between 300 and 325 °C with 5 °C interval and at standard atmospheric pressure and ambient conditions for 30 min. At 325 °C, volume expansion of GO takes place to produce a very light, black, powdered mass. The reduction temperature has been varied in the range of 350–450 °C to observe the effect of temperature on thermal reduction of GO.
GO and rGO specimens have been characterized by different techniques, such as XRD, Raman spectroscopy, TEM, FESEM, EDX, and FTIR, for obtaining structural and morphological information; TGA has been performed for observing thermal stability and also understanding the mechanism of thermal reduction of GO; BET has been carried out for finding the specific surface area and change in specific surface area for different reduction temperatures.
A. Structural analysis
Raman spectra of pure graphite, GO, and rGO specimens were recorded. Typical features of Raman spectroscopy of carbon are D and G peaks. Both the peaks arise from vibrations of sp 2 carbon. The G peak appears because of bond stretching of sp 2 carbon pairs both in chain and ring, whereas the D peak arises due to the breathing mode of aromatic rings and defect in the sample.Reference Yu, Zhang, Bulin, Li and Xing12,Reference Wang, Yang, Park, Gou, Wang, Liu and Yao30,Reference Simões and Neto31 From D peak intensity, the degree of disorder can also be measured.Reference Yu, Zhang, Bulin, Li and Xing12,Reference Wang, Yang, Park, Gou, Wang, Liu and Yao30,Reference Jorio, Ferreira, Moutinho, Stavale, Achete and Capaz32
From Raman spectra (Fig. 1), D and G peaks are found at 1352 cm−1 and 1580 cm−1, respectively, for the pure graphite sample. D and G peaks are at the same position for GO and all rGO specimens. For GO and rGO specimens, D peaks are located at 1370 cm−1 with dampened D peak intensity. The G peak intensity is dampened and shifted to 1608 cm−1 for all GO and rGO specimens, indicating a structural change in the graphite crystal lattice. This observation indicates an appreciable decrease in the size of sp 2 planes due to oxidation and exfoliation of graphite.Reference Yu, Zhang, Bulin, Li and Xing12 Both D and G peaks’ intensities increase and peaks are sharpened after reduction of GO, which indicates the structural change.
Raman spectra of graphite, GO, and rGO (reduction temperature 300, 325, 350, 400, and 450 °C).

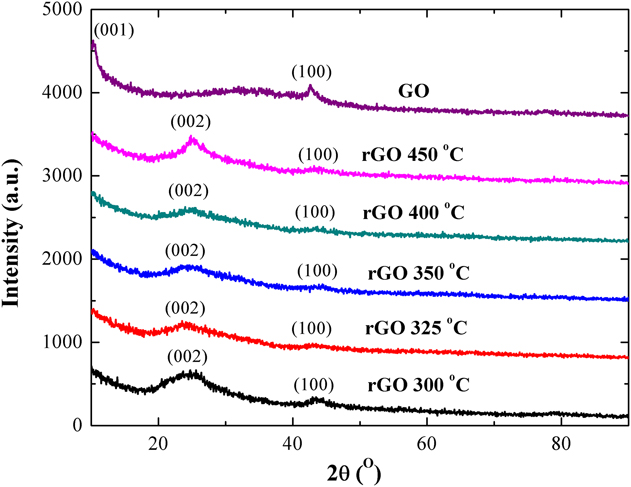
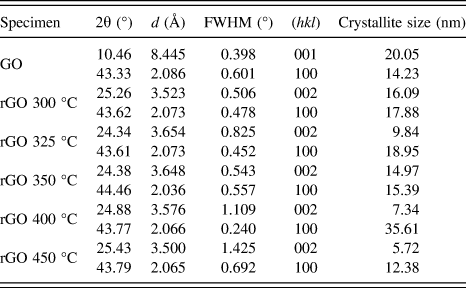
The XRD analysis of GO and rGO specimens reduced at 300 °C, 325 °C, 350 °C, 400 °C, and 450 °C have been carried out. Lattice planes have been matched against JCPDS file no. 65-1528 and 75-1621.Reference Hu33 Peaks found from XRD are shown in Fig. 2. Corresponding d-spacing values calculated by Bragg’s law with lattice planes and crystallite size have been reported in Table I. The crystallite size has been determined by Scherrer’s equation.
XRD analysis of GO and rGO specimens.

Crystallite size, lattice planes, and d-spacing values obtained by XRD analysis.

From the XRD analysis, it has been found that during reduction from GO to rGO, change in the lattice structure takes place. After conversion from GO to rGO, shift of the first major peak is detected with an appreciable change in d-spacing. Change in d-spacing occurs due to the removal of functional groups from the lattice. For the rGO 300 °C specimen, partial reduction takes place. In other samples, the second major peak gets flattened with an increase of reduction temperature. In all rGO specimens, the presence of (002) and (100) planes have been found.
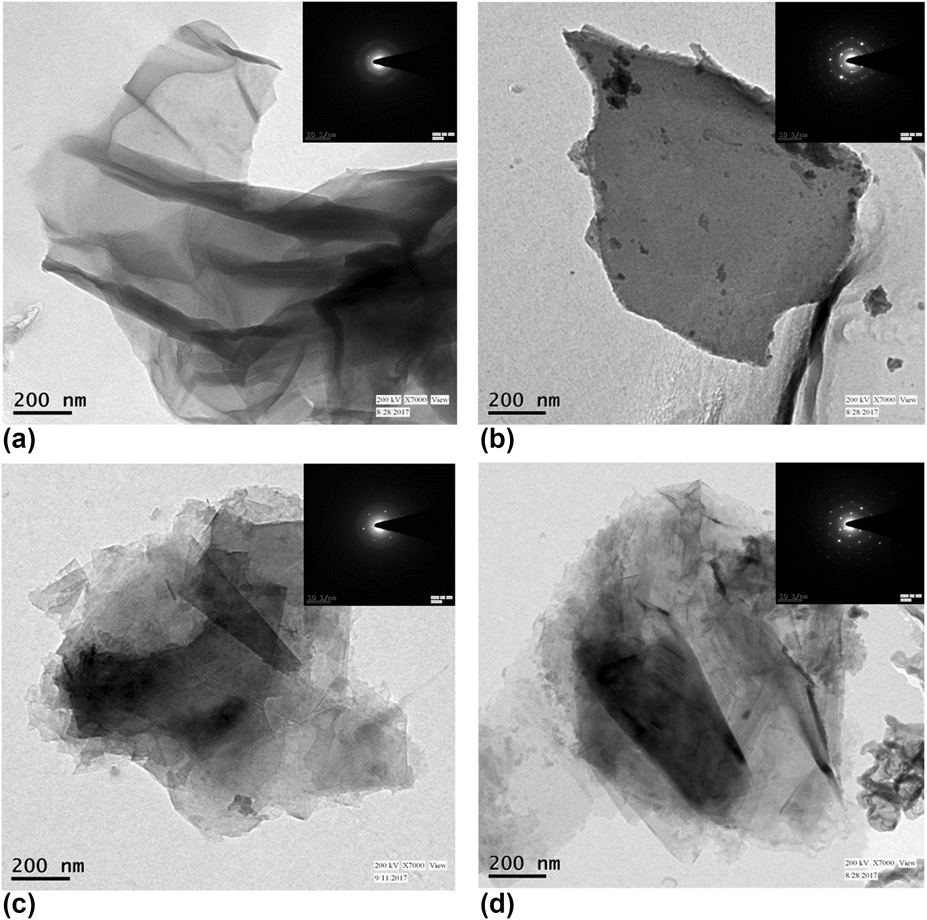
The TEM analysis of GO and rGO specimens heated at reduction temperatures 325 °C, 350 °C, and 450 °C (Fig. 3) reveals a thin crumpled sheet-like structure.
TEM images of (a) GO, (b) rGO (325 °C), (c) rGO (350 °C), and (d) rGO (450 °C).

SAED or selected area electron diffraction for all specimens present that GO is semicrystalline with hexagonal lattice structure; when heated at 325 °C, the structure becomes polycrystalline, with some defects in the lattice. At 350 °C, the carbon lattice is found to be crystalline although small defects in the carbon lattice have been observed. At the temperature of 450 °C, the specimens are crystalline with some defects in the hexagonal structure of the lattice.
B. Functional group analysis
FTIR analysis in Fig. 4 provides information on the elimination of oxygen-containing functional groups at different reduction temperatures. Presence of a broad peak at 3364 cm−1 for GO indicates the –OH group. For all rGO samples, the peak is flattened but not totally eliminated, signifying partial elimination of hydroxyl groups. As discussed before, the elimination of hydroxyl groups at edges takes place at a higher temperature, compared to the similar group on a basal plane. The peak at 1734 cm−1 is responsible for C=O stretching vibrations. For rGO specimens, the peak is flattened because of the removal of the carbonyl group. C–O and O–H bond stretching in the carboxylic group is indicated by the peak at 1400 cm−1; elimination of carboxylic group by thermal reduction is the reason for decreased intensity in all rGO specimens. The epoxy group is indicated by the peak at 1122 cm−1. As this group possesses very high binding energy, it can be eliminated only at very high temperature. The intensity of the peak is almost unchanged up to 350 °C and after 400 °C, dampened intensity signifies partial removal of epoxy groups. Both the peaks at 656 cm−1 and 602 cm−1 are responsible for C=C skeletal vibration and hence after reduction, the peak intensity in FTIR spectra is increasing.
FTIR spectra of GO and rGO specimens, reduced at different temperatures.

From the X-ray photoelectron spectra (XPS) of GO and optimally reduced rGO (reduced at 350 °C, discussed in details at Sec. III.D), specimens’ surface compositions and carbon hybridization are evaluated. For resolving bond structures, the peaks of both C1s and O1s spectra are deconvoluted using Gaussian function.Reference Marcano, Kosynkin, Berlin, Sinitskii, Sun, Slesarev, Alemany, Lu and Tour11,Reference Yu, Zhang, Bulin, Li and Xing12 Figure 5 represents C1s and O1s spectra of GO and rGO reduced at 350 °C. The first major peaks of Figs. 5(a) and 5(b) represent C–C and C=C groups of graphitic carbons. After reduction, the peak gets sharper than the one in GO, which indicates a more regular structure. The second major peak represents the C–O bond of hydroxyl and epoxy groups. The peak intensity slightly decreases [Fig. 5(b)] because of the removal of hydroxyl groups from the basal plane in rGO. Epoxy groups can only be eliminated in high temperature as discussed before in FTIR analysis. The third peak represents the C=O bond of the carbonyl group. The last peak in GO represents O–C=O, i.e., carboxylic group, which is almost eliminated by thermal reduction.
XPS spectra of C1s of (a) GO, (b) rGO 350 °C; O1s of (c) GO and (d) rGO 350 °C.

O1s spectra [Figs. 5(c) and 5(d)] represent two types of oxygen content, O1 from functional groups and O2 as adsorbed oxygen content from air.Reference Xu, Zhang, Liu, Wang and Hu22 In rGO, the intensity of O1s spectra decreases significantly, signifying the elimination of most of the oxygen-containing groups. As significant amount of hydroxyl and carboxylic groups are eliminated in rGO, it absorbs less moisture and hence the peak responsible for adsorption of oxygen content from air gets dampened.
C. Qualitative and quantitative study on extent of exfoliation
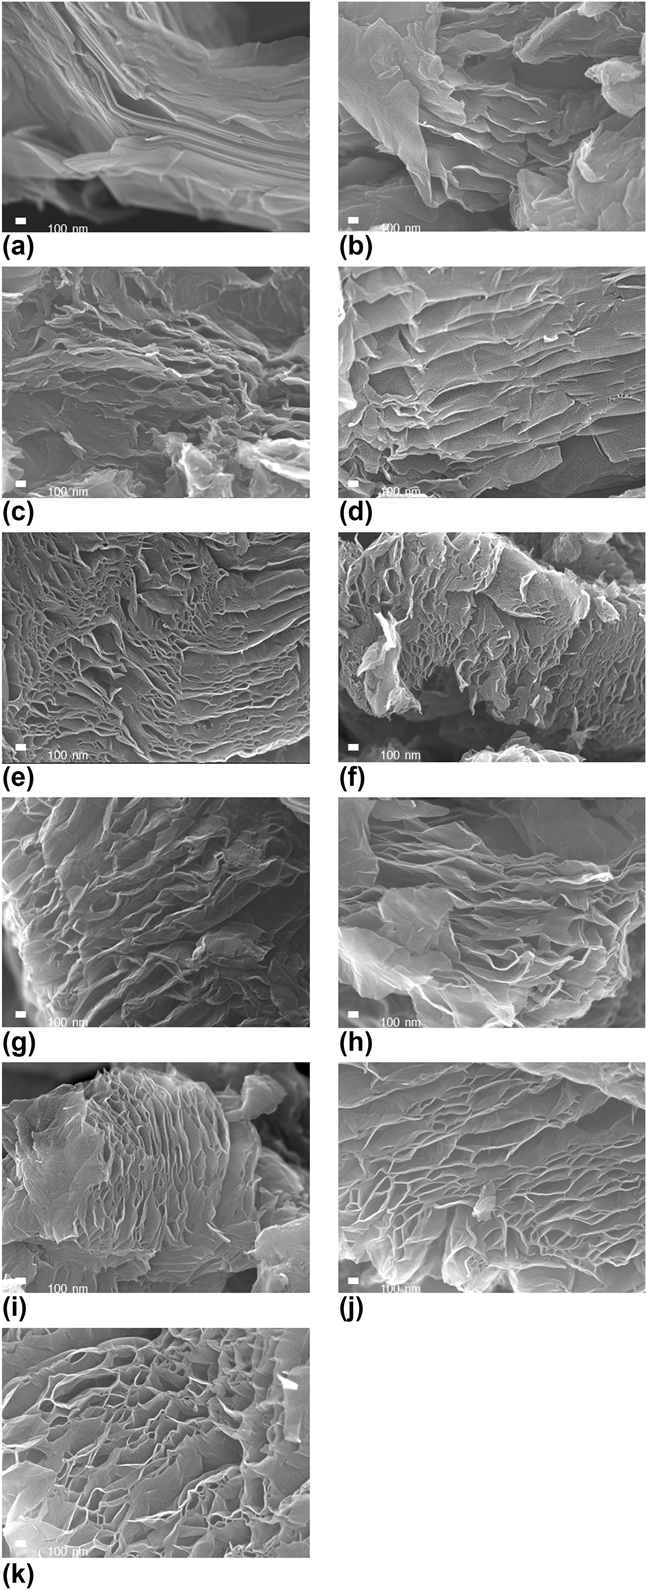
FESEM images in Fig. 6 of pure graphite, GO, and of rGO specimens heated at different reduction temperatures reveal a thin crumpled sheet-like structure having high aspect ratio, for both GO and rGO. In graphite [Fig. 6(a)], carbon layers are closely stacked by strong van der Waals attraction force. In GO [Fig. 6(b)], the separation of carbon layers can be noticed. In all rGO specimens, carbon layers of GO are exfoliated because of application of heat. At the temperature range of 300–320 °C [Figs. 6(c)–6(g)], no significant exfoliation of carbon planes are observed and carbon planes are closely stacked, as compared to exfoliated specimens. After 325 °C, separation of carbon planes is observed and with increasing temperature, the gap between the carbon layers broadens, indicating rapid volumetric expansion as well as an increase in the specific surface area.
FESEM images of (a) pure graphite (b) GO, and rGO heated at (c) 300 °C, (d) 305 °C, (e) 310 °C, (f) 315 °C, (g) 320 °C, (h) 325 °C, (i) 350 °C, (j) 400 °C, and (k) 450 °C.

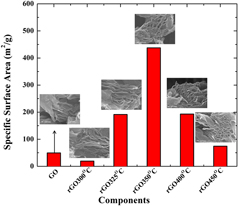
The specific surface area of GO and rGO specimens reduced at different temperatures has been measured using BET adsorption of nitrogen gas (Refer to Fig. 7). The specific surface area of GO is decreased at a reduction temperature of 300 °C. The specific surface area of GO is measured to be 50.73 m2/g. At 325 °C, the specific surface area is measured to be 191.44 m2/g, i.e., about 3.77 times enhancement as compared to GO. Below 325 °C, mainly absorbed moisture is eliminated and little reduction in volume takes place as the temperature cannot generate enough thermal shock to separate the carbon planes by taking most of the functionalities. At 350 °C, the maximum specific surface area of rGO has been obtained to be 437.62 m2/g, i.e., exfoliation is the maximum at the temperature, and almost a 9-time increment in the specific surface area is observed as compared to GO. After 350 °C, a fall in the specific surface area has been noted because of the removal of carbon atoms from the carbon lattice as CO2 and CO. Also, combustion of carbon skeleton at higher temperature contributes to the drop in the specific surface area.
Specific surface area of GO and rGO specimens.

D. Determination of carbon content
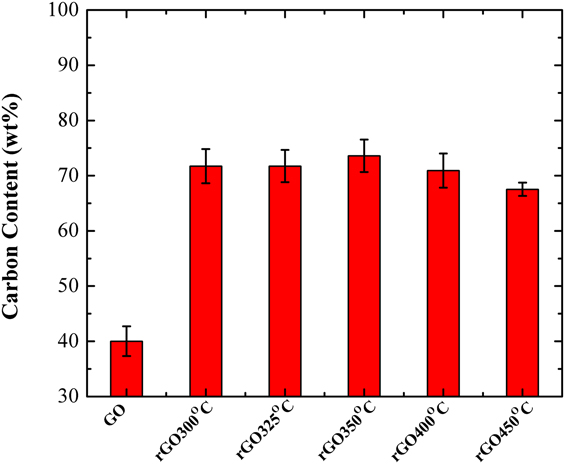
From the elemental analysis of GO and rGO specimens, reduced at various temperatures, carbon content has been determined and represented in Fig. 8. It gives an idea about the relation between the extent of reduction of GO with annealing temperature. A large amount of oxygen is introduced as different functional groups in GO. With heating, absorbed moisture and hydroxyl groups are eliminated initially. Exfoliation of carbon planes and volume expansion owe to the reason for the quick removal of hydroxyl groups as water vapor from the inner part of the carbon lattice. With higher thermal shock generated on GO, i.e., at higher reduction temperature, the elimination of epoxy and carbonyl groups takes place in the form of carbon monoxide and carbon dioxide, taking carbon atoms from the honeycomb planar structure of graphene; hence defects in the carbon lattice occur. The elimination of carbon atoms from the lattice affects the carbon–oxygen ratio. At 350 °C, the carbon content is measured to be the highest, indicating maximum possible retention of the graphene honeycomb lattice structure, as well as maximum removal of functional groups. For heat transfer and electronics applications, thermal and electrical conductivities play a significant role. The gaps created in the graphene honeycomb structure, by the removal of carbon atoms during thermal reduction, affect both thermal and electrical conductivity. Therefore, the determination of the optimum reduction temperature is very important for thermal reduction of GO and improving the quality of rGO.
Carbon content of GO and rGO of different reduction temperatures determined by CHNS elemental analysis.

E. Thermal reduction kinetics
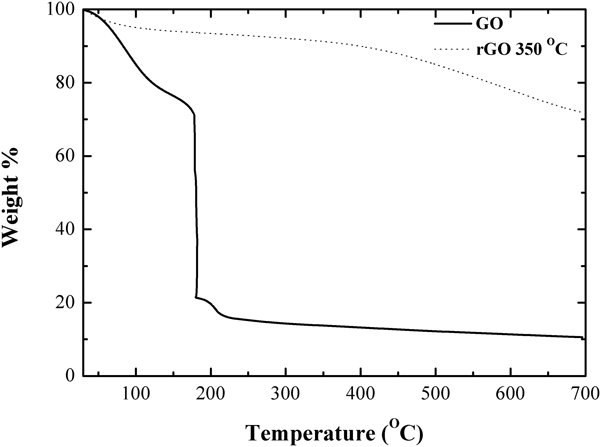
TGA (Fig. 9) of GO and rGO (reduction temperature 350 °C), having the maximum carbon–oxygen ratio, has been performed in nitrogen atmosphere and at 1 atm pressure in the temperature range of 30–700 °C with temperature increasing at a rate of 10 °C/min. In the temperature range of 30–177 °C, there is only about 30% reduction in mass, which is mainly because of the removal of absorbed moisture, a small amount of hydroxyl and carboxylic acid groups. For GO, a sharp decrease in weight% has been observed at a temperature of 177 °C. This sharp fall in weight from 70 to 21% signifies rapid removal of functional groups and reduction of GO. In the range of 200–700 °C, only 9% decrease in weight has been observed. As discussed before, this decrease is mainly concerned with the elimination of some remaining functional groups, possessing high binding energy. From TGA, it is confirmed that the rate of thermal reduction of GO is dependent on a critical temperature where rapid weight loss and volume expansion take place. Only after the critical temperature is reached, most of the functionalities are eliminated almost instantly, generating a shock on the GO lattice. This shock generates huge pressure on the lattice and thus exfoliation of carbon planes and volume expansion take place. The effect of exfoliation is responsible for the rapid increase in the specific surface area, which has been discussed already. Pressure and the environment, where heating is carried out, play an important role in determining the critical temperature. TGA has been performed at standard atmospheric pressure in nitrogen environment and at 177 °C rapid weight loss, indicating that reduction and exfoliation have been observed. From the experiment, the onset temperature of exfoliation and hence reduction has been determined to be 325 °C. The experiment was carried out in ambient conditions and standard atmospheric pressure. Comparing the above two conditions, it can be decided that inert environment promotes the reduction of GO at a lower temperature, compared to standard atmospheric conditions.
TGA of GO and rGO reduced at 350 °C.

From TGA data of rGO (reduced at 350 °C), only 29% weight loss has been detected in the range of 30–700 °C. No rapid fall in weight% has been observed. Mainly some little amount of absorbed moisture and some oxygen-containing functional groups of high binding energy are eliminated. Hence, from TGA of the rGO sample, it can be inferred that once GO is exfoliated, further heating will cause no more exfoliation.
Thermal degradation kinetics of GO and rGO (reduction temperature 350 °C) have been analyzed from thermogravimetric data by using the Coates–Redfern method.Reference Coats and Redfern34,Reference Chakraborty, Kumar, Suresh and Pugazhenthi35 The method and the results have been discussed in detail in Supplementary Material S1. Analyzing the thermal degradation kinetics, it has been found that thermal degradation of GO is zero order reaction, i.e., the rate of reaction is not dependent on the concentration of GO, and it is a sole function of temperature. Activation energy and frequency factor determined for thermal reduction of GO are found to be 18.61 kJ/mol and 10.085, respectively. The thermal degradation rate of rGO is dependent on the concentration of rGO. As most of the functional groups are eliminated from the planes of GO, the thermal degradation of rGO takes place by gradual elimination of remaining groups accompanied by the combustion of carbon skeleton at high temperature and hence, the degradation rate is not a sole function of temperature. For thermal degradation of rGO, activation energy and frequency factor are determined to be 7745.27 kJ/mol and 0.0292, respectively. From TGA, it was found that the rate of removal of oxygen-containing functional groups depends on the temperature, which agrees with the experimental findings and thermal degradation kinetics.
IV. CONCLUSION
In the present work, a modified route for synthesis of GO has been reported by introducing some variations over improved Hummers method or Tour’s method. The mechanism of thermal reduction of GO has been discussed, and it has been found that kinetics of thermal degradation of GO is a function of temperature only. From TGA and thermal degradation kinetics study, it can be concluded that below a particular temperature, thermal reduction of GO cannot be performed and the temperature depends upon the environment where heating takes place. The elimination of hydroxyl, epoxy, carbonyl, and carboxylic group at an instant generates a shock on carbon lattice planes, which are stacked together, to cause exfoliation of GO. The optimum temperature has also determined to be 350 °C, where maximum possible reduction of GO, carbon–oxygen ratio, and also minimum lattice defect are reported. TGA defends the fact that at a particular temperature, the elimination of most of the functionalities takes place, followed by a significant decrease in weight, and, in this study, the temperature is reported to be 325 °C. From the measurement of the specific surface area, it can be concluded that at 325 °C, rapid surface area enhancement is observed because of exfoliation of GO and this value reaches the maxima at 350 °C, where best reduction of GO is observed.
Supplementary Material
To view supplementary material for this article, please visit https://doi.org/10.1557/jmr.2018.338.
NOMENCLATURE

GREEK LETTERS

ABBREVIATIONS

ACKNOWLEDGMENTS
The authors express their gratitude to the DST-FIST funded XPS laboratory at the Department of Physics and Meteorology, IIT Kharagpur, for their help in conducting the XPS analysis. The authors also acknowledge FESEM and XRD laboratory and Departmental Research Facility at the Department of Chemical Engineering, IIT Kharagpur, for their co-operation in carrying out the experiments and analyses.