Introduction
Many important electronic devices rely on electrons moving in a vacuum (e.g., x-ray tubes for health and security examination, microwave tubes for wireless communications and radar detection, and cathode-ray tubes for signal display); therefore, an electron source that generates free electrons in a vacuum is indispensable for devices called “vacuum electronic devices.” To date, most commercial vacuum electronic devices employ traditional thermionic electron sources where electrons are evaporated into a vacuum through heating. Because of the bulky size, slow temporal response, and high-energy dissipation of traditional thermionic electron sources, vacuum electronic devices usually have large volumes, slow switching speeds, and high power consumption.
To overcome these limitations, efforts have been made since the 1960s to scale down electron sources and vacuum electronic devices to the microscale and even nanoscale by using micro-/nanofabrication technologies, Reference Spindt1–Reference Bower, Gilchrist, Piascik, Stoner, Natarajan, Parker, Wolter and Glass6 thus creating a new research field called vacuum micro-/nanoelectronics. Many novel applications (i.e., microscale vacuum transistors, Reference Han, Oh and Meyyappan7,Reference Srisonphan, Jung and Kim8 flat-panel displays, Reference Choi, Chung, Kang, Kim, Jin, Han, Lee, Jung, Lee, Park and Kim9,Reference Liu, Wei, Liu, Liu, Jiang and Fan10 and compact x-ray tubes Reference Parmee, Collins, Milne and Cole11 ) have emerged in the field. In this context, nanoscale electron sources with high electron-emitting performances are highly desired since they work at the heart of nanoscale vacuum electronic devices. Because of their natural nanoscale size and cold-emission character, field-emission electron sources, where electrons are drawn out from a sharp nanoscale tip by an intense electric field through the quantum tunneling effect, have prevailed in vacuum nanoelectronics since the pioneering work of Spindt in 1968. Reference Spindt1 While great success has been achieved for field-emission sources, they have encountered problems of poor controllability and stability, poor uniformity in source arrays, high working voltage, and ultrahigh vacuum requirement. It is therefore important to look for new nanoscale electron sources that can avoid the previously mentioned problems.
Thermionic electron emission from carbon filaments in incandescent lamps was observed for the first time by Edison. Reference Redhead12 This reminds us that carbon nanotubes (CNTs) and graphene, which can be considered as nanoscale carbon filaments, can work as nanoscale thermionic electron sources because of their excellent thermal stability and electrical conductivity. Recently, thermionic emission from carbon nanostructures, including single CNTs, Reference Wei, Golberg, Chen, Bando and Peng13–Reference Cox, Forrest, Smith and Silva16 single graphene nanoribbons, Reference Wei, Bando and Golberg17 CNT yarns, Reference Liu, Wei, Jiang, Sun, Zhang and Fan18–Reference Liu, Sun, Zhu, Liu, Jiang, Liu, Li and Fan20 CNT arrays, Reference Yaghoobi, Moghaddam and Nojeh21–Reference Li, Bai, Li and Dai24 and graphene films, Reference Zhu, Lin, Liu, Jiang, Wei, Wu, Wang and Fan25,Reference Starodub, Bartelt and McCarty26 have been studied by several groups.
In this article, we present an overview of these studies, with special attention paid to the differences in physics between thermionic emission from single carbon nanostructures and from macroscopic metals, and potential applications in vacuum nanoelectronics. First, theoretical considerations on thermionic emission from single carbon nanostructures are described. Then, experimental studies on thermionic emission from single hot carbon nanostructures are introduced. Next, applications in vacuum nanoelectronics are presented, including nanoscale thermionic electron sources and vacuum transistors. Finally, we will provide a summary and outlook on the topic.
Theoretical considerations
It is well known that thermionic emission from macroscopic metals is described by Richardson’s Law (also known as the Richardson–Dushman equation), where thermionic emission current density (J) is given by the formula: Reference Richardson27
 $$J = A{T^2}exp( - {\phi \over {{k_B}T}}) ,$$
,
where T is the emitter temperature, ϕ is the emitter work function, k
B is the Boltzmann constant, and
 $A = 4{\rm{\pi }}mek_{\rm{B}}^2/{h^3}$
= 120.4 A cm–2 K–2 is the Richardson constant, with m being the electron mass, e the electron charge, and h Planck’s constant. However, what is the law for thermionic emission from single carbon nanostructures?
Richardson’s Law was deduced on the basis of the Sommerfeld free-electron model where the three-dimensional (3D) free-electron gas follows Fermi–Dirac statistics. Reference Fowler28 The 3D Sommerfeld free-electron model cannot be applied to one-dimensional (1D) CNTs and two-dimensional (2D) graphene. So thermionic emission from CNTs and graphene may deviate from Richardson’s Law. Liang et al. demonstrated the problem of applying Richardson’s Law to thermionic emission from single-layer graphene where electrons behave as massless quasiparticles (m = 0), as the mass-dependent expression of Richardson constant in Equation 1 becomes questionable. Reference Liang and Ang29 To investigate thermionic emission from single-layer graphene, they proposed a model by taking the 2D massless Dirac fermions (electrons in graphene have zero effective mass near the Fermi level) into account. An analytical formula for thermionic emission from single-layer graphene was obtained and is given as:
 $$J = \beta {T^3}exp( - {{\phi - {E_f}} \over {{k_B}T}}) ,$$
,
where E
f is Fermi energy,
 ${\rm{\beta }} = {{ek_B^3 } \mathord{\left/ {\vphantom {{ek_B^3 } \pi }} \right. \kern-\nulldelimiterspace} \pi }\hbar ^3 v_f^2$
= 115.8 A m–2 K–3, with ℏ being the reduced Planck’s constant and v
f being the velocity of massless Dirac fermions in single-layer graphene.
Reference Liang and Ang29
This formula exhibits stronger dependence on the temperature as compared to Richardson’s Law.
In addition to low-dimensional massless Dirac fermions, electron emission from the surface of single-layer graphene and single-walled CNTs has two additional features that are absent in electron emission from 3D bulky solids; (1) electrons in the carbon nanostructures are confined in a quantum well along the emission direction because the close proximity of the two surface barriers forms this quantum well; and (2) all electrons always locate at the surface. Reference Wei, Chen and Peng30
We proposed a model to describe electron emission from a 2D crystal (
Figure 1a) with these two features taken into account.
Reference Wei, Chen and Peng30
In the model, the quantum confinement results in discrete eigenenergies (
 $E_n^z$
, n = 1, 2 , 3 …) and eigenstates along the thickness direction with the wave function (φ
n
(z)) of each eigenstate, having different extensions along the thickness direction (Figure 1b), while the eigenenergies along the 2D plane are continuous. Thus the energy bands of a 2D crystal are composed of a series of 2D energy bands with different cutoff energies that equal the eigenenergies (
 $E_n^z$
) along the thickness direction (Figure 1c).
(a) Schematic drawing of electron emission from the surface of a 2D crystal, (b) bound state wave functions due to quantum-well confinement along the normal direction of 2D crystal, and (c) its energy bands.
Reference Wei, Chen and Peng30
The quantum-well confinement results in discrete 2D energy bands with wave functions of electrons in each band having different extensions normal to the 2D crystal. x and y axes are in the surface of 2D crystal, and the z axis is normal to the surface. Note: φ1(z)… φ3(z), eigenfunctions of the first, second, and third bound states along the z axis; φE(z), eigenfunction of the bound states with the eigenenergy closest to vacuum level; k
x,y
, x, y components of wave vector; E
VAC, vacuum level;
 $E_1^z$
…
 $E_3^z$
, eigenenergies of the first, second, and third bound states along the z axis;
 $E_{\rm{E}}^z$
, eigenenergy of the bound state closest to vacuum level.

Because all electrons in a 2D crystal are always located at the surface, we cannot define and calculate the number of electrons impinging on the surface per unit of time when applying the traditional electron-emission model. Reference Wei, Chen and Peng30 To overcome this issue, the electron-emission process in the nth band is assumed to be composed of two circular separate processes: (1) electrons with a steady distribution of F n (E) are emitted into vacuum with a probability of P n that depends on wave function (φ n (z)) extending along the thickness direction, and then (2) electron transitions from other 2D bands rebuilds the distribution of F n (E) in the nth band. A time parameter τ n is introduced to describe how long the two processes take, so the electron-emission density from a 2D crystal can be written as:
 $$J = e\mathop \sum \limits_n {{{P_n}} \over { { \tau} _n }}\mathop \smallint \limits_{E_n^z}^\infty {F_n}(E){D_n}(E)dE ,$$
,
where E is electron energy and D n (E) is the density of state in the nth band. Reference Wei, Chen and Peng30 The formula can also be applied to 1D CNTs when 1D energy bands are considered.
Experimental studies
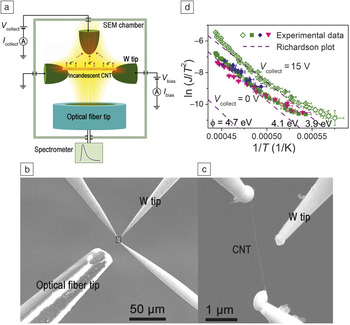
Based on the previously discussed theoretical considerations, Richardson’s Law is expected to break down in thermionic emission from carbon nanostructures. To verify the expectations in experiments, we studied thermionic emission from single hot CNTs heated by self-Joule heating using an in situ multiprobe measurement technique, which enables the simultaneous measurement of emission density (J) and temperature (T) in a single hot CNT. Reference Wei, Wang, Chen and Peng15
As shown in Figure 2a–c, a single CNT is suspended between two W tips, and a bias voltage of ∼3 V is applied to heat it to induce electron emission. A third W tip with an applied voltage of 15 V is used to collect the emitted electrons and measure the current. At the same time, an optical fiber tip is used to collect the thermal light emission spectra, from which the temperature of the CNT can be determined by fitting it to Planck’s Law. It can be seen from Figure 2d that experimental ln (J/T Reference Spindt, Brodie, Humphrey and Westerberg2 )–1/T plots exhibit an upward bending feature and deviate from the straight lines of the Richardson plots. More importantly, the measured emission density is more than one order of magnitude larger than that predicted by Richardson’s Law if a work function of 4.7 eV is considered for CNTs. Reference Liu, Sun, Zhu, Liu, Jiang, Liu, Li and Fan20 The results provide direct experimental evidence that Richardson’s Law breaks down in thermionic emission from single hot CNTs.
(a) Schematic drawing and (b) scanning electron microscope (SEM) image for simultaneous measurement of thermionic emission density and temperature of a single hot carbon nanotube (CNT, framed area). (c) An enlarged SEM image of the framed area in (b). (d) Comparison of experimental ln(J/T Reference Spindt, Brodie, Humphrey and Westerberg2 )–1/T plots with Richardson plots, indicating the breakdown of Richardson’s Law in thermionic emission from single carbon nanotubes.15 Green, blue, and pink solid symbols represent data for V collect = 0 V measured three times. Green open symbols represent data for V collect = 15 V. Note: V collect, voltage for collecting emitted electrons; I collect, emission current; V bias, bias voltage for driving electron emission; I bias, conduction current in CNT; T, temperature; J, emission current density; ϕ, work function.

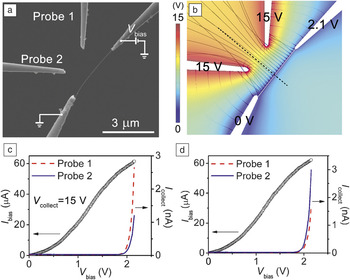
Electron emission from single hot CNTs heated by self-Joule heating was also studied by using two W tips to simultaneously collect the emission current ( Figure 3a), which enables us to resolve the spatial distribution of electron emission along the nanotube axis. Reference Wei, Golberg, Chen, Bando and Peng14 Electron trajectory simulations in the measurement setup indicate that each W tip collects electrons emitted from the half nanotube section closer to it (Figure 3b), so the spatial distribution of electron emission can be resolved by comparing the emission current measured by the two W tips. It was found that emission current measured by one W tip was about two times larger than that measured by the other one, and the relative magnitude of the two emission current was reversed when the bias voltage applied to the CNT was reversed (Figure 3c–d). The spatial distribution of electron emission is thus asymmetric along the nanotube axis and depends on the direction of the internal electric field, with the average emission density of the half tube with a higher electric potential being two times larger than that of the other half. The asymmetric and electric-field-direction-dependent spatial distribution cannot be described by Richardson’s Law, which provides further evidence for the breakdown of the latter.
(a) Scanning electron microscope image for simultaneous collection of emission current from a single hot carbon nanotube (CNT) by using two W probes as the anodes. (b) Simulated electric potential (color scale), electric-field lines (thin dashed lines), and electron trajectories (solid lines) of the (a) measurement setup, indicating that each W probe collects electrons emitted from the half nanotube section closer to it, as divided by the thick dashed line. (c) Emission current measured by the two probes and the corresponding current passing through the CNT in (a) the measurement setup. (d) Emission current and the corresponding current passing through the CNT when the internal electric field of CNT in (a) was reversed. The data in (b–d) indicate that the spatial distribution of electron emission is asymmetric along the nanotube axis and depends on the direction of the internal electric field. Reprinted with permission from Reference Wei, Golberg, Chen, Bando and PengReference 14. © 2011 American Physical Society. Note: V bias, bias voltage for driving electron emission; V collect, voltage applied to Probes 1 and 2 for collecting emitted electrons; I bias, conduction current in the CNT; I collect, emission current.

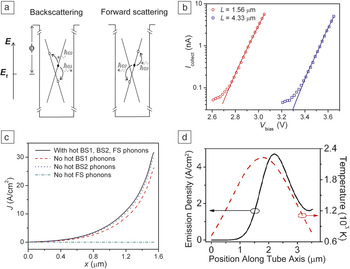
To explain the previously mentioned abnormal phenomena in Figures 2 and 3, the emission current from single hot CNTs by self-Joule heating was theoretically calculated using a kinetic model based on Equation 3. Reference Wei, Golberg, Chen, Bando and Peng13 In the model, the distribution function of electrons was calculated by solving coupled Boltzmann equations of electrons and optical phonons based on a linear energy band, and electrons are assumed to be emitted from the nanotube once their energy is higher than the surface barrier. When solving the coupled Boltzmann equations, three types of electron scattering were considered: (1) elastic backscattering by acoustic phonons, (2) inelastic backscattering by optical phonons with fixed energies of 0.16 eV (BS1 phonons, where BS denotes backscattering) and 0.2 eV (BS2 phonons), and (3) inelastic forward scattering by optical phonons with fixed energy of 0.2 eV (FS phonons) ( Figure 4a). Reference Wei, Golberg, Chen, Bando and Peng13
(a) Schematic diagrams showing the backscattering and forward scattering of electrons by phonons in a carbon nanotube (CNT). Filled and open circles indicate filled and empty electron states, respectively. (b) Good agreement between experimental (symbols) and theoretical (solid lines) electron-emission curves (emission current [I collect] versus bias voltage [V bias]) of a CNT of two different lengths (L). (c) Theoretical emission current density (J) along the nanotube axis (x) with and without the scattering of certain nonequilibrium hot optical phonons, indicating that nonequilibrium hot forward-scattering optical phonons are primarily responsible for electron emission. A constant temperature profile along the nanotube axis was assumed in the calculation. (d) Theoretical emission current density along the nanotube axis with the scattering of nonequilibrium hot optical phonons when a symmetric parabolic temperature profile is assumed. The asymmetric emission density well explains experimental observations in Figure 3. (a–c) Reprinted with permission from Reference Wei, Golberg, Chen, Bando and PengReference 13. © 2011 American Chemical Society. (d) Reprinted with permission from Reference Wei, Golberg, Chen, Bando and PengReference 14. © 2011 American Physical Society. Note: E, energy; E f, Fermi energy; ħ, reduced Planck’s constant; ω, angular frequency; ϕ, work function; BS1, backscattering phonons with energy of 0.16 eV; BS2, backscattering phonons with energy of 0.2 eV; FS, forward scattering phonons with energy of 0.2 eV.

Theoretical emission curves were found to coincide well with those measured in experiments (Figure 4b). In contrast to traditional thermionic emission from bulky metals where electrons are in equilibrium with the lattice and follow Fermi–Dirac statistics, electrons in a self-Joule heated CNT followed a nonequilibrium distribution with an effective electron temperature much higher than that of the lattice. Electron emission from a self-Joule heated CNT can therefore be considered as the emission of nonequilibrium hot electrons. This explains why the emission density was observed to be much higher than that predicted by Richardson’s Law in Figure 2d. Nonequilibrium distribution of electrons, and thus hot electron emission, was mainly attributed to the presence of nonequilibrium forward-scattering optical phonons (Figure 4c), because electrons can be continuously accelerated by an electric field if they can absorb forward-scattering optical phonons and the probability of electrons occupying high-energy states near the vacuum level is dramatically increased. Reference Wei, Golberg, Chen, Bando and Peng13
As the nonequilibrium distribution of electrons is maintained by an internal electric field that is applied for Joule heating, the emission of hot electrons from a CNT is thought to be directly driven by the internal electric field. This is different from traditional thermionic emission from a self-Joule heated macroscopic metal filament where an internal electric field has a negligible contribution to the distribution of electrons near the vacuum level and thus the thermionic emission current. Due to the direct contribution of the internal electric field to the electron emission, the calculated emission current density was found to be asymmetric along the nanotube axis and dependent on the direction of the internal electric field (Figure 4d). This explains the experimental results in Figure 3. The emission of hot electrons has also been observed in single self-Joule heated graphene nanoribbons. Reference Wei, Bando and Golberg17
Thermionic emission from large clusters of carbon nanostructures was also studied by several groups. Fan et al. Reference Liu, Wei, Jiang, Sun, Zhang and Fan18–Reference Liu, Sun, Zhu, Liu, Jiang, Liu, Li and Fan20 studied CNT yarns, CNT arrays were studied by Nojeh et al. and by Dai et al., Reference Yaghoobi, Moghaddam and Nojeh21–Reference Li, Bai, Li and Dai24 and graphene films on CNT supports by Fan et al. Reference Zhu, Lin, Liu, Jiang, Wei, Wu, Wang and Fan25 Contrary to the breakdown of Richardson’s Law in thermionic emission from single carbon nanostructures, thermionic emission from large clusters was found to follow Richardson’s Law. This implies that the features responsible for the breakdown of Richardson’s Law in single carbon nanostructures (i.e., massless Dirac fermions, quantum well confinement, all surface electrons, and nonequilibrium electron distribution) may vanish in larger clusters.
Applications in vacuum nanoelectronics
Graphene-based thermionic electron sources
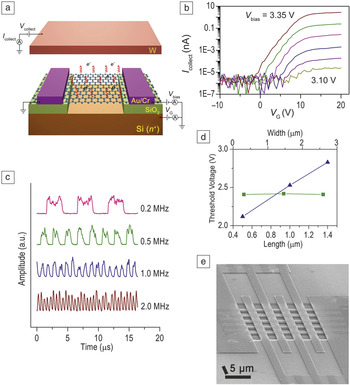
Significant thermionic emission from single carbon nanostructures implies the potential of applying them as nanoscale thermionic electron sources. We have successfully fabricated nanoscale thermionic electron sources and source arrays using microfabrication technologies and graphene as the electron-emitting material. Reference Wu, Wei, Gao, Chen and Peng31 Graphene-based thermionic electron sources (GTESs) were fabricated on SiO2/Si wafers, with each consisting of a microscale graphene film suspended between two metal electrodes and over a heavily doped Si bottom electrode ( Figure 5a). They were found to have a low turn-on voltage of ∼2–4 V, depending on the length of the graphene film.
(a) Schematic drawing showing the structure of a graphene-based thermionic electron source (GTES) and its working principle. (b) Emission current (I collect) measured by a top W electrode versus gate voltage (V G) applied to the bottom Si electrode at different bias voltage (V bias), indicating six orders of magnitude tunability of the emission current by the gate voltage. Five curves with V bias increasing from 3.10 to 3.35 V at 0.05 V intervals and fixed V collect of 100 V are shown. (c) Emission current of a GTES when it was driven by a periodic square wave voltage at different frequencies, indicating a switch-ON/OFF time of less than 1 µs. The low and high levels of the square wave voltage were set to be lower and higher than the turn-on threshold voltage of the GTES. (d) Plots of the turn-on threshold voltage versus the length (blue triangles) and width (green squares) of the graphene films. The turn-on voltage increases approximately linearly with graphene length and is independent of the graphene width. (e) Scanning electron microscope image of a 5 × 5 parallel GTES array. Reference Wu, Wei, Gao, Chen and Peng31

When a GTES is turned on, its emission current, measured by the top electrode, can be tuned by six orders of magnitude through gate voltage applied to the bottom Si electrode (Figure 5b). In contrast to traditional bulky thermionic electron sources that usually have a switch delay of hundreds of milliseconds, a GTES can be switched ON/OFF in less than 1 µs (Figure 5c), five to six orders faster than its bulk counterparts. Importantly, the turn-on voltage of the GTESs was found to depend on the dimensions of the graphene films (Figure 5d), which enabled the fabrication of GTESs with controllable and repeatable emission performances through engineering graphene dimensions using microfabrication technologies.
A 5 × 5 parallel GTES array with uniform emission performances was also fabricated (Figure 5e). The GTESs exhibited stable electron emission at a vacuum level of 10 – Reference She, Xu, Huq, Deng and Chen3 Pa, much lower than that needed for stable field emission (at least 10 – Reference Bower, Gilchrist, Piascik, Stoner, Natarajan, Parker, Wolter and Glass6 Pa). Therefore, GTESs possess advantages of both bulky thermionic electron sources (i.e., low working voltage, low vacuum requirement, controllable emission performances) and field-emission sources (i.e., nanoscale size, fast temporal response, integration by microfabrication technologies, and tunable emission by the local gate).
Graphene-based vacuum transistor
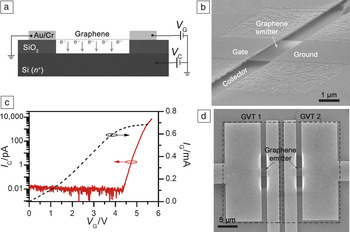
Based on thermionic emission from a single graphene film, a vacuum transistor was proposed and realized on a SiO2/Si wafer by using traditional microfabrication technologies. Reference Wu, Wei, Zhang, Chen and Peng32 Similar to a GTES, a graphene-based vacuum transistor (GVT) consists of a graphene film suspended between two metal electrodes, with one electrode working as the ground electrode and the other as the gate electrode, and over a heavily doped Si bottom electrode serving as the collector electrode ( Figure 6a–b). When the voltage between the gate and ground electrodes is smaller than the threshold value for electron emission from graphene, there is no current measured by the collector electrode, therefore, the GVT is in an OFF state. When the voltage between the gate and ground electrodes is high enough to drive significant electron emission from the graphene film, the GVT is switched on. An ON/OFF current ratio of up to 106, a subthreshold slope of 120 mV/dec, and low working voltage of <10 V were demonstrated for a GVT (Figure 6c), exhibiting switching performance superior to that of previously reported vacuum transistors based on field-emission sources and graphene-based solid-state transistors. Reference Han, Oh and Meyyappan7,Reference Xia, Farmer, Lin and Avouris33 By integrating two GVTs, a symmetric ambipolar transistor was obtained (Figure 6d), implying the potential of realizing vacuum integrated circuits based on GVTs.
(a) Schematic drawing and (b) scanning electron microscope (SEM) image of a graphene-based vacuum transistor (GVT). (c) Transfer characteristics of a GVT (solid line) and the I-V curve (dashed line) of the graphene film with V C = 15 V. An ON/OFF current ratio of up to 106, a subthreshold slope of 120 mV/dec, and low working voltage of <10 V were demonstrated. (d) SEM image of an ambipolar device by integrating two GVTs (GVT1 and GVT2) with shared gate and collector electrodes. Reprinted with permission from Reference Wu, Wei, Zhang, Chen and PengReference 32. © 2015 Wiley. Note: V C, collector voltage; I C, collector current; I G, gate current; V G, gate voltage.

Summary and outlook
Thermionic emission from single carbon nanostructures show quite different physics compared to thermionic emission from macroscopic metals because of the new features associated with their low dimensionality and nanoscale size (i.e., massless Dirac fermions, quantum well confinement, all surface electron and nonequilibrium electron distributions). As a result, Richardson’s Law breaks down in thermionic emission from single carbon nanostructures. Due to significant nonequilibrium electron distributions in a self-Joule heated CNT, its electron emission can be considered as the emission of nonequilibrium hot electrons driven by an internal electric field. An internal electric field applied for Joule heating can thus contribute directly and primarily to thermionic emission from single carbon nanostructures. The emission of nonequilibrium hot electrons implies the possibility of achieving cold thermionic emission, which means that electrons are hot enough to overcome the surface barrier and escape from the emitter while the lattice is still cold, or near room temperature. In addition to field emission, cold thermionic emission provides another path to achieving cold electron emission.
Based on thermionic emission from graphene, nanoscale thermionic electron sources, source arrays, and vacuum transistors were successfully realized on SiO2/Si wafers by using microfabrication technologies. Graphene-based thermionic electron sources (GTESs) were found to possess the advantages of both bulky thermionic electron sources and nanoscale field-emission sources. Graphene-based vacuum transistors (GVTs) demonstrated a switching performance that is comparable to those of graphene-based solid-state transistors and, similar to solid-state devices, can be integrated using microfabrication technologies. These advances imply the great potential of realizing high-performance nanoscale electron sources, source arrays, and vacuum electronic devices based on thermionic emission. However, because of the relatively high work function of graphene and high dissipation rate of Joule-heating power at the microscale, emission current density and emission efficiency of a GTES are still low. In the future, both the emission density and efficiency need to be improved to meet the requirements of practical applications in vacuum nanoelectronics. These methods include lowering the work function of graphene through chemical/electrostatic doping and substituting graphene with other nanomaterials having lower-work-function values.
Acknowledgments
This work was supported by the National Basic Research Program of China (Grant No. 2013CB933604), NSF of China (Grant Nos. 61371001, 61621061).

Xianlong Wei is an assistant professor in the Department of Electronics at Peking University, China. He received his BS degree in physics from Beijing Normal University, China, in 2004, and his PhD degree in electronics from Peking University in 2009. He worked at the National Institute for Materials Science, Japan, for three years, first as a postdoctoral researcher and then as an independent researcher at the International Center for Young Scientists. His current research interests include electron emission from nanomaterials, high-performance microfabricated electron sources, and in situ electron microscopy. Wei can be reached by email at weixl@pku.edu.cn.

Qing Chen has been a full professor in the Department of Electronics at Peking University, China, since 2002. She received her BS degree in physics from Peking University in 1988 and her PhD degree in materials science from the University of Science and Technology Beijing, China, in 1994. She was a Center of Excellence researcher at the National Institute for Materials Science, Japan, and completed her postdoctoral research at Arizona State University. Her current research interests include nanodevices based on nanowires, nanotubes, and nanosheets, and correlating properties and structures of nanomaterials and nanodevices through in situ electron microscopy study and other methods. Chen can be reached by email at qingchen@pku.edu.cn.

Lian-Mao Peng is the head of the Department of Electronics and the director of the Key Laboratory for the Physics and Chemistry of Nanodevices at Peking University, China. He received his BS degree from Peking University in 1982 and his PhD degree in physics from Arizona State University in 1988. His research focuses on carbon-based high-performance electronic and optoelectronic devices. He has published more than 300 papers and one book. He is an associate editor of the Journal of Applied Physics and chairman of the International Union of Crystallography Electron Crystallography Commission. Peng can be reached by email at lmpeng@pku.edu.cn.