1. Introduction
Supermassive black hole binaries (SMBHBs) are the predicted outcome of the
 $\Lambda$
cold dark matter cosmology (White & Rees Reference White and Rees1978; White & Frenk Reference White and Frenk1991). Massive galaxies generally undergo multiple mergers during their evolution. Many observational evidence indicates that the centers of most massive galaxies host a supermassive black hole (SMBH), and that the SMBH is closely linked to its host galaxy (Magorrian et al. Reference Magorrian, Tremaine and Richstone1998; Ferrarese & Merritt Reference Ferrarese and Merritt2000; Gebhardt et al. Reference Gebhardt, Bender and Bower2000; Tremaine et al. Reference Tremaine, Gebhardt and Bender2002; Kormendy & Ho Reference Kormendy and Ho2013). The co-evolution of SMBHs and their host galaxies has long been a hot topic. For the same reason, understanding how SMBHs evolve in merging galaxies is also a key issue. It can not only helps us to figure out the role of SMBHs in galaxy mergers and how the SMBH-galaxy connection is established, but also provides constraints on the parameters of galaxy merger models. Furthermore, close SMBHBs are expected to be bright gravitational wave sources, potentially detectable by Pulsar Timing Arrays (PTAs) and future space-based gravitational wave observatories, such as the Laser Interferometer Space Antenna (LISA)Footnote †, Taiji, and TianQin (Foster & Backer Reference Foster and Backer1990; Verbiest et al. Reference Verbiest, Lentati and Hobbs2016; Luo et al. Reference Luo, Wang and Wu2021; Mei et al. Reference Mei, Bai and Bao2021).
Over the past few decades, a number of SMBHB candidates have been identified (Liu & Wu Reference Liu and Wu2002; Liu Reference Liu2004; Komossa et al. Reference Komossa, Grupe and Parker2020; An et al. Reference An, Zhang and Wang2022; Ren et al. Reference Ren, Sun and Ding2025). Although most candidates cannot yet be firmly confirmed, the existence of SMBHB systems is now widely accepted. However, the vast majority of candidates have been found in gas-rich, active galaxies, while detecting SMBHBs in quiescent galaxies remains extremely challenging. Direct detection requires very high spatial resolution, which is beyond current capabilities. It may become feasible, however, to identify SMBHBs via PTAs or future space-based gravitational wave facilities. Nevertheless, given the limited spatial resolution of these instruments, and in the absence of clear electromagnetic counterparts, even if gravitational wave signals are detected, it will be difficult to associate them with specific host galaxies. Thus, it is essential to identify possible electromagnetic tracers of SMBHBs in quiescent systems.
We believe that tidal disruption events (TDEs) can serve as excellent tracers to address this issue. When a star approaches an SMBH within a sufficiently close distance, the black hole’s tidal force becomes comparable to the star’s self-gravity, leading to the disruption of the star (Hills Reference Hills1975). The critical distance at which this occurs is referred to as the tidal radius
 $r_t$
:
 \begin{equation}r_{\rm t}\simeq \mu\rm r_*(M_{\rm BH}/\rm m_*)^{1/3},\end{equation}
where
 $\mu$
is a dimensionless parameter reflecting stellar structure, typically taken to be unity here.
 $\rm r_*$
,
 $\rm m_*$
, and
 $M_{\rm BH}$
denote the stellar radius, stellar mass, and black hole mass, respectively. In the simplified classical model, the stellar debris acquires a spread of orbital energies and follows Keplerian orbits. Roughly half of the disrupted debris becomes unbound and escapes, while the other half remains bound, eventually circularizing into an accretion disk and producing luminous flare that can “light up” the SMBH for timescales ranging from weeks to years. Theoretical analyses predict that, if the fallback rate of the debris is directly proportional to the radiative luminosity, the TDE light curve should follow a
 $\propto t^{-5/3}$
decay (Rees Reference Rees1988; Evans & Kochanek Reference Evans and Kochanek1989; Guillochon & Ramirez-Ruiz Reference Guillochon and Ramirez-Ruiz2013). This expectation assumes complete disruption at or within the tidal radius. More recent theoretical and numerical studies, however, suggest that stars can also be partially stripped outside the tidal radius, giving rise to partial tidal disruption events (pTDEs) (Guillochon & Ramirez-Ruiz Reference Guillochon and Ramirez-Ruiz2013), whose light curves are typically expected to decay as
 $\propto t^{-9/4}$
(Coughlin & Nixon Reference Coughlin and Nixon2019). It is worth noting that since the Schwarzschild radius scales as
 $r_{\rm sch} \propto M_{\rm BH}$
while
 $r_{\rm t} \propto M_{\rm BH}^{1/3}$
, for solar-type stars the tidal radius falls within the event horizon when
 $M_{\rm BH} \gtrsim 10^8 \rm M_\odot$
. In this regime, stars are likely to be entirely swallowed without producing a flare. Observations nevertheless confirm that the classic model is valid, with several TDEs exhibiting light curves in excellent agreement with the simple classical prediction (Komossa & Bade Reference Komossa and Bade1999; Komossa Reference Komossa2002; Saxton et al. Reference Saxton, Read and Esquej2012).
Since TDEs can temporarily illuminate quiescent SMBHs, they can likewise provide electromagnetic signatures of SMBHB systems in gas-poor environments. Liu et al. (Reference Liu, Li and Chen2009) proposed that, in an SMBHB system where a TDE occurs around the primary black hole (BH), the presence of the secondary perturbs the fallback stream, preventing the debris from accreting continuously. Some fraction of the debris can still return and be accreted by the primary BH, while other portions are deflected and fail to return. As a consequence, the light curve should exhibit abrupt truncations and rebrightenings, often with quasi-periodic behavior. This scenario has been confirmed by subsequent theoretical and numerical studies (Ricarte et al. Reference Ricarte, Natarajan and Dai2016; Coughlin et al. Reference Coughlin, Armitage, Nixon and Begelman2017; Vigneron et al. Reference Vigneron, Lodato and Guidarelli2018), and observationally supported by the discovery of several such systems (Liu et al. Reference Liu, Li and Komossa2014; Shu et al. Reference Shu, Zhang and Li2020; Huang et al. Reference Huang, Hu and Yin2021; Wen et al. Reference Wen, Jonker and Levan2024).
With the development of time-domain surveys such as the All Sky Automated Survey for SuperNovae (ASAS-SN)Footnote †, the Zwicky Transient Facility (ZTF, (Bellm et al. Reference Bellm, Kulkarni and Graham2019))Footnote ‡, and the all-sky X-ray survey by eROSITA (Merloni et al. Reference Merloni, Predehl and Becker2012)Footnote §, the efficiency of TDE detection has greatly improved. To date, over one hundred TDEs have been discovered. Many of their light curves display complex behaviors, indicating that simplified models deviate from reality (Gezari Reference Gezari2021, and references therein). A small subset of sources show light curves strikingly similar to TDEs in SMBHB systems, exhibiting truncations, rebrightenings, and quasi-periodic flares. These events are more likely to be repeating partial TDEs (rpTDEs), in which a partially disrupted star remains bound to the SMBH and loses material at each pericenter passage, thereby producing quasi-periodic flares (Payne et al. Reference Payne, Shappee and Hinkle2021; Liu et al. Reference Liu, Malyali and Krumpe2023; Evans et al. Reference Evans, Nixon and Campana2023; Lin et al. Reference Lin, Jiang and Wang2024; Somalwar et al. Reference Somalwar, Ravi and Yao2025). Nevertheless, although their light curves resemble those expected from SMBHB systems, rpTDEs typically show more gradual truncations, and the peak luminosities of flares are generally comparable, unlike the power-law like decay trend characteristic of SMBHB induced TDEs.
In this review, we provide a concise summary of the distinctive features of TDEs in SMBHB systems. Our discussion will focus primarily on the properties of TDE light curves in SMBHBs, and on the occurrence rate of SMBHB induced TDEs in merging galaxies and its evolution throughout the merger process. The article is organized as follows. Section 2 briefly introduces the formation and evolution of SMBHBs in merging galaxies. Section 3 discusses the differences in TDE light curves between SMBHB systems and single SMBHs, along with representative observational examples. Section 4 addresses the TDE rate (TDER) evolution in merging galaxies. Finally, in Section 5 gives discussion of the limitations of current models and the summary.
2. The formation and evolution of supermassive black hole binaries
In merging galaxies, two questions are crucial for the formation and evolution of SMBHBs. The first is whether two SMBHs can successfully form a stable bound system, and the second is whether such a bound binary can coalesce within Hubble time. The answers to both questions depend on whether the SMBHs have efficient mechanisms that can continuously extract their angular momentum and orbital energy. The evolution of SMBHs in merging galaxies can be broadly divided into three stages (Begelman et al. Reference Begelman, Blandford and Rees1980). In the early stage of galaxy mergers, the SMBHs and their surrounding bound stars sink toward the center of the system primarily through dynamical friction, bringing the two SMBHs close to each other. As the SMBHs approach the center, the surrounding stars are gradually stripped, and the dynamical friction gets more and more inefficient. This stage, characterized by relatively long evolutionary timescales, is defined here as Phase I here. When the two SMBHs approach sufficiently close to enter each other’s gravitational influence radius, they will quickly form a bound binary system and evolve into a hard binary. This marks a fast and violent evolutionary phase, which we refer to as Phase II. At this point, the SMBHB has formed, and dynamical friction no longer plays an important role in its evolution. The final stage, Phase III, usually corresponds to the long-term evolution of the SMBHB. Whether the binary eventually coalesces depends on the efficiency of mechanisms that can further extract its orbital energy and angular momentum. In gas-rich environments, gas dynamics can facilitate this process significantly (Gould & Rix Reference Gould and Rix2000). In contrast, in gas-poor environments, the SMBHB primarily relies on gravitational slingshot interactions to scatter surrounding stars and shrink its orbit. In this case, the timescale of coalescence depends not only on the rate at which stars are scattered but also on how efficiently new stars are replenished in (Mikkola & Valtonen Reference Mikkola and Valtonen1992; Quinlan Reference Quinlan1996). If these processes operate effectively, the two SMBHs can approach sufficiently close for gravitational wave radiation to dominate. Once this regime is reached, the energy dissipation due to gravitational wave emission alone can drive the SMBHB to coalesce within a short timescale. Thus, the key factor determining whether an SMBHB coalesce is the efficiency of the dissipation mechanisms operating during Phase III.
Early studies suggested that if stellar replenishment were governed solely by two-body relaxation under a spherically symmetric distribution, gravitational slingshots are highly inefficient, preventing SMBHBs from coalescing within Hubble time. As a result, their evolution stalls at parsec or sub-parsec separations, giving rise to the so-called “final parsec problem” (Begelman et al. Reference Begelman, Blandford and Rees1980; Milosavljević & Merritt Reference Milosavljević and Merritt2001; Berczik et al. Reference Berczik, Merritt and Spurzem2005). However, subsequent theoretical analyses and numerical simulations revealed that stellar distributions in real merging galaxies are not always spherically symmetric, and replenishment mechanisms are not limited to two-body relaxation. Consequently, the final parsec problem does not pose a fundamental obstacle, and SMBHBs are indeed capable of merging within Hubble time (Yu Reference Yu2002; Merritt & Poon Reference Merritt and Poon2004; Berczik et al. Reference Berczik, Merritt and Spurzem2006; Khan et al. Reference Khan, Just and Merritt2011; Preto et al. Reference Preto, Berentzen and Berczik2011).
3. The light curve of tidal disruption events from SMBHBs
As mentioned earlier, starting from the classical theory based on simplified assumptions, one can regard the light curve of a TDE as corresponding to the fallback rate of the stellar debris. If the disrupted debris is able to return to the vicinity of pericenter after one orbital period, then under the assumption of rapid circularization the debris can form an accretion disk and be accreted by the BH. Consequently, for a star approaching the SMBH on a parabolic orbit, the resulting disruption light curve is expected to decay as
 $t^{-5/3}$
(full TDE) or
 $t^{-9/4}$
(partial TDE). However, if we consider only the variation of the fallback rate, a TDE occurring in an SMBHB system will exhibit distinct differences.
We classify the two members of the SMBHB according to their masses as the primary BH and the secondary BH, and focus below on the evolution of debris resulting from a star being disrupted by the primary BH. If the disrupted star is initially on a parabolic orbit relative to the BH, then the debris acquires a spread of orbital energies, with roughly half of the debris having positive energy and escaping from the gravitational influence of the primary BH, while the other half remains bound with negative energy relative to the primary BH. This discussion, however, applies only to a two-body system. In reality, due to the presence of the secondary BH and the gravitational potential of the galactic nucleus, a fraction of the “unbound” debris may remain gravitationally bound within the SMBHB system or the nuclear region of the host galaxy. Conversely, among the “bound” debris, a rough criterion is that when the orbital semi-major axis lies within the Hill radius of the primary BH, most debris may continue to keep in bound orbits around the primary. When the semi-major axis exceeds the Hill radius, however, the orbital dynamics are strongly perturbed by the secondary BH, becoming unpredictable, with a significant fraction of debris eventually scattered out of the SMBHB system.
It follows that, in an SMBHB system, even the fraction of debris with negative orbital energy cannot be guaranteed to return to the vicinity of the primary BH. Two main effects contribute to this outcome. First, as mentioned earlier, when the semi-major axis of the debris approaches that of the SMBHB orbit, gravitational perturbations from the secondary BH can drive the debris away from its original trajectory, preventing it from reaching pericenter. Second, if the two black holes do not have a large mass ratio, the primary BH itself undergoes orbital motion around the SMBHB’s center of mass. As a result, part of the debris will fail to return to the accretion disk around the primary BH. The combined effect of these mechanisms is that the light curve exhibits abrupt interruptions. Moreover, due to orbital phase variations, a fraction of the debris will always manage to fall back to the vicinity of the primary BH, producing sudden recurrences in the light curve following interruptions. In some cases, these interruptions and recurrences repeat in a quasi-periodic mode (Liu et al. Reference Liu, Li and Chen2009; Ricarte et al. Reference Ricarte, Natarajan and Dai2016; Coughlin et al. Reference Coughlin, Armitage, Nixon and Begelman2017). Theoretical analyses and numerical simulations suggest that interruptions typically occur at
 $0.15-0.5$
times the orbital period
 $T_{\rm orb}$
of the SMBHB, while the first recurrence generally takes place at about
 $1.0-1.5 T_{\rm orb}$
(Liu et al. Reference Liu, Li and Chen2009).
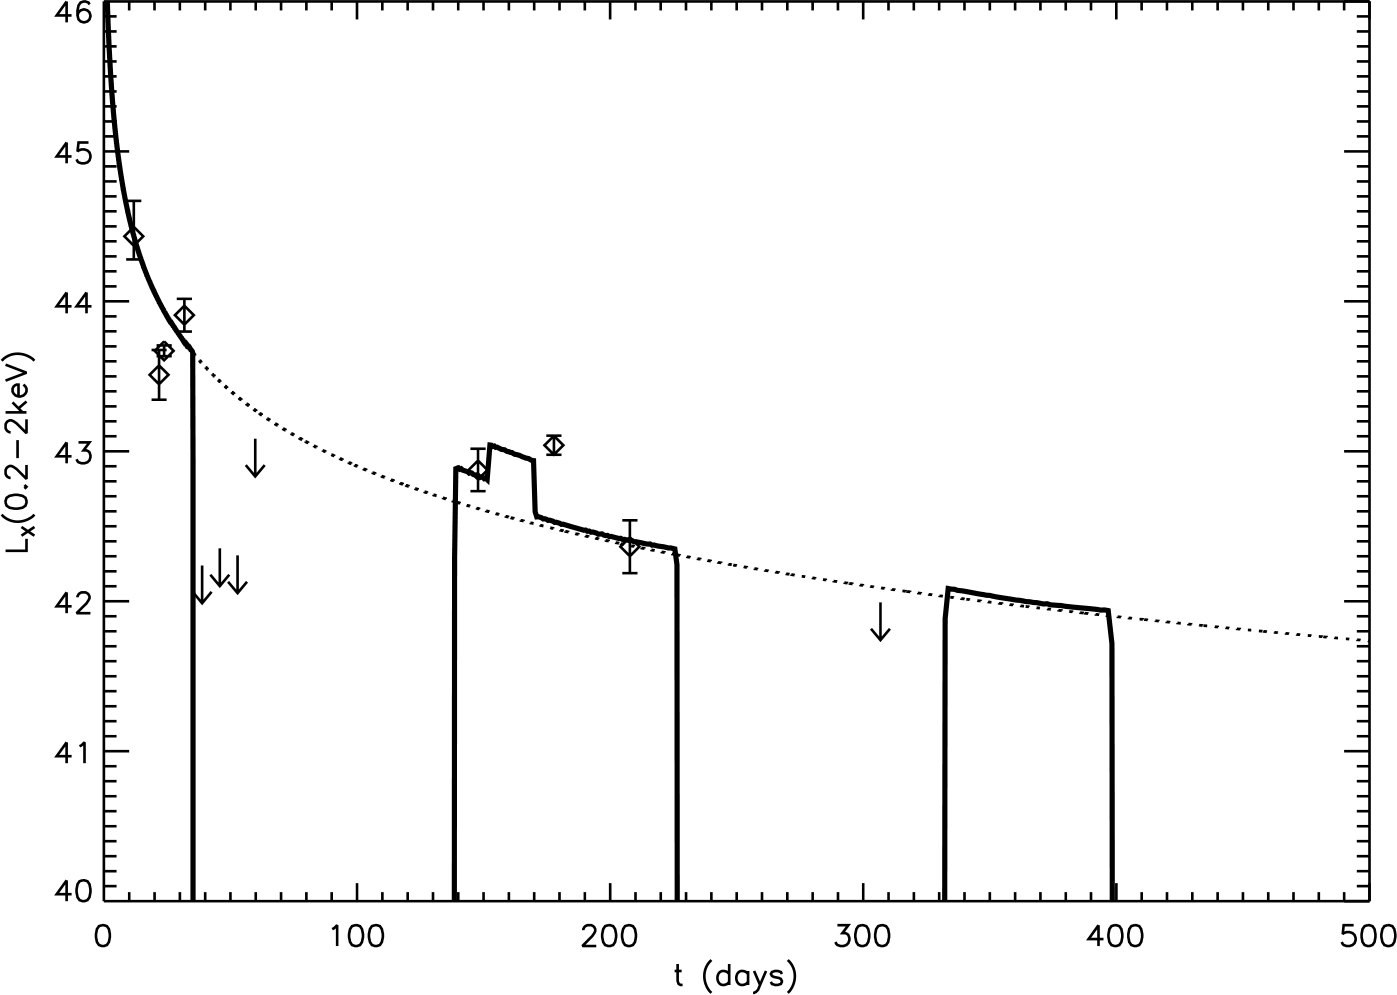
Figure 1 presents an illustrative example of an SMBHB TDE light curve. The x-axis represents time, measured from the moment of tidal disruption. The y-axis shows the X-ray luminosity in the
 $0.2-2\rm{keV}$
band on a logarithmic scale. The dotted line denotes the expected light curve for a single SMBH system, while the solid line corresponds to the SMBHB model from numerical integrations. In this example, the binary orbital period is 150 days. Over a timescale of only 500 days, the light curve exhibits three abrupt interruptions and two recurrences, with the recurrence times displaying a quasi-periodic pattern. It should be noted, however, that while the curve shown here is relatively regular, in practice the shape depends on the orbital phase of the SMBHB and the disrupted star, and the resulting light curves can be chaotic. Further details can be found in Liu et al. (Reference Liu, Li and Chen2009).
Light curve of the SMBHB TDE candidate SDSS J120136.02+300305.5. The observational data are obtained with XMM-Newton and Swift, where the diamonds mark the detected X-ray emission and the arrows indicate the observational upper limits of the luminosity. The solid line represents the light curve derived from scattering experiments with the SMBHB model, while the dotted line shows the expected TDE light curve in the single black hole scenario predicted by classical theory.
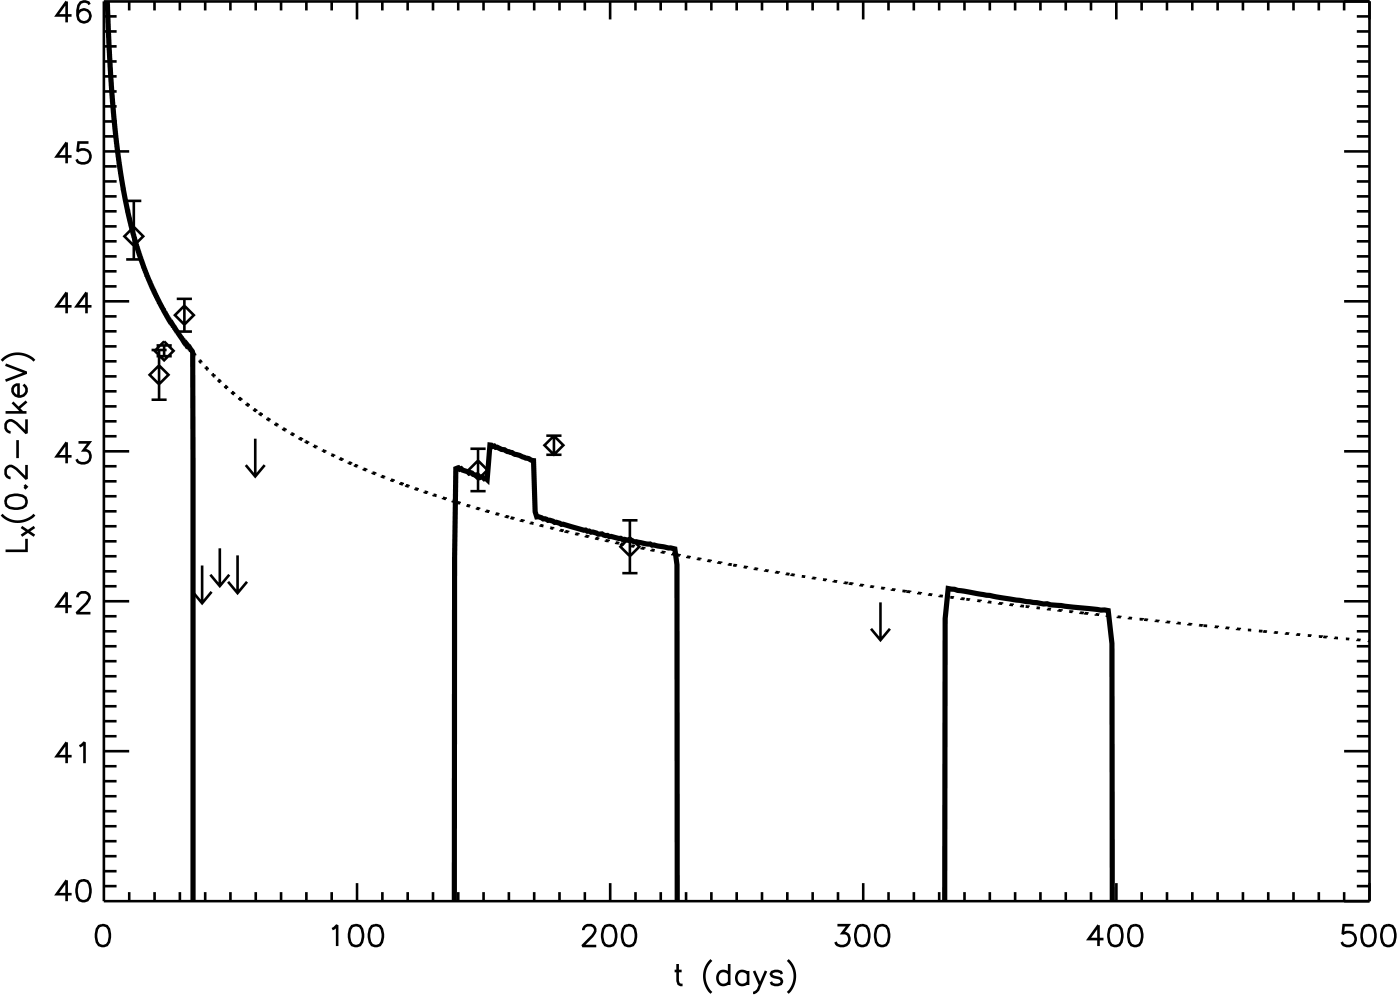
This model has also been supported by observations. At least four candidates have been identified to date (Liu et al. Reference Liu, Li and Komossa2014; Shu et al. Reference Shu, Zhang and Li2020; Huang et al. Reference Huang, Hu and Yin2021; Wen et al. Reference Wen, Jonker and Levan2024). As an example, Figure 1 shows the observational data of one such candidate, SDSS J120136.02+300305.5 (Liu et al. Reference Liu, Li and Komossa2014). The diamond symbols represent the detected X-ray emission, while the arrows indicate the upper limits of the observed luminosity. The X-ray data were obtained with XMM-Newton and Swift. The model parameters adopted in the figure correspond to a primary BH mass of
 $10^6 \rm M_\odot$
, an SMBHB mass ratio of
 $q=0.11$
, an orbital period of
 $T_{\rm orb}=150$
days, and an eccentricity of
 $e=0.2$
. The disrupted star is characterized by a penetration factor
 $\beta = 2.0$
, where
 $\beta \equiv r_t/r_p$
and
 $r_p$
is the pericenter distance of the disrupted star. Evidently, by comparing the model predictions with the observational data, roughly constraints on the orbital parameters of the system can be obtained.
4. Tidal disruption event rates of SMBHBs
In the previous section, we mainly discussed the characteristic features of TDE light curves in SMBHB systems. Another critical issue concerns the event rate of such phenomena under realistic astrophysical conditions. Numerous theoretical analyses and numerical studies based on scattering experiments have been carried out on this topic. These works span the evolutionary stages from the time before the two BHs form a bound binary, through the rapid phase immediately after binary formation, and into the subsequent hard-binary stage (Chen et al. Reference Chen, Liu and Magorrian2008; Chen et al. Reference Chen, Madau and Sesana2009; Liu & Chen Reference Liu and Chen2013).
In brief, the TDER of an SMBHB is comparable to that of a single BH during Phase I, with a gradual increase as the two BHs approach each other. Once the system evolves into Phase II, strong perturbations from the companion SMBH and galaxy, together with the violent dynamical evolution of the system, lead to a short but pronounced enhancement of the TDER, with the amplitude potentially increasing by several orders of magnitude. Subsequently, as a large number of stars are rapidly disrupted and consumed, the TDER declines quickly and the system enters Phase III. In this stage, if the SMBHB evolves slowly, the TDER can even drop below the level expected for a single BH. This is because stars scattered into the vicinity of the SMBHB are more likely to be ejected by the binary than to penetrate close to either BH and undergo disruption.
Most of the above theoretical analyses and numerical studies assume either a symmetric and essentially static stellar distribution, or focus solely on three-body scatterings between the SMBHB and the disrupted star while neglecting interactions among stars themselves. To accurately track the evolution of the TDER throughout the process of galaxy mergers, direct N-body simulations are indispensable.
4.1. Numerical simulation methods
Direct N-body is a numerical simulation method specialized for gravitational systems with many particles. Unlike large-scale cosmological N-body simulations, direct N-body simulations compute the gravitational forces between every particle and all others with very high accuracy. As a result, direct N-body simulations can provide highly precise dynamical evolution. The price to pay, however, is the enormous computational cost and the consequent limitations in particle resolution.
The numerical model introduced here is based on the direct N-body code
 $\varphi$
- Grape/
 $\varphi$
-GPU (Harfst et al. Reference Harfst, Gualandris, Merritt, Spurzem, Portegies Zwart and Berczik2007), employing simulations with over one million particles to represent merging galaxies. In the initial setup, each galaxy is composed of a large number of particles following a prescribed stellar density profile. A massive particle at the galactic center represents the SMBH. The mass ratio between the black hole and its host galaxy is fixed, so that in merger simulations with different BH mass ratios, the host galaxy masses scale proportionally with the BH mass ratio. When a stellar particle approaches the SMBH particle within a specified tidal radius–determined by the stellar type, stellar mass, stellar radius, and SMBH mass–it is considered to be disrupted and accreted by the SMBH, and such an event is recorded as a TDE. To reduce computational time, the two black holes and their host galaxies are typically assumed to approach each other on parabolic orbits with a prescribed pericenter distance. For simplicity, in the following discussion we adopt units
 $G=M=a_D=1$
, where
 $a_D$
is the scaling radius associated with the stellar density model, and M is the total mass of the host galaxy of the primary BH. In the models discussed in this work, one unit of time in N-body units corresponds approximately to
 $5 {\rm\,Myr}$
, and one unit of length corresponds to about
 $0.5 {\rm\,kpc}$
.
We can start from galaxies with equal-mass stars and perform merger simulations with equal-mass black holes (
 $1:1$
) as well as mergers with mass ratios ranging from
 $0.1$
to
 $0.9$
(Li et al. Reference Li, Liu and Berczik2017; Li et al. Reference Li, Berczik and Chen2019). On this basis, we can improve the models by incorporating a stellar mass spectrum and stellar types, thereby rendering the simulations closer to realistic conditions (Li et al. Reference Li, Zhong and Berczik2023). In the equal-mass stellar models, since all stars have identical masses, the event rate is directly proportional to the stellar mass accretion rate. In contrast, in unequal-mass stellar models, because stars have different masses, the stellar mass accretion rate and the event rate are no longer equivalent.
4.2. Results
Simulation results show that, whether in major or minor mergers with equal-mass stellar particles, or in major merger models that incorporate different stellar types and a mass spectrum, the TDER remains relatively stable during Phase I, with a level comparable to that of a single SMBH in an isolated galaxy. However, each time the two BHs approach each other due to orbital motion, the TDER exhibits a significant enhancement, until the onset of Phase II, when the system enters a stage of rapid TDER outburst. In Phase III, the TDER gradually declines back to a relatively steady level, generally comparable to or even lower than in Phase I.
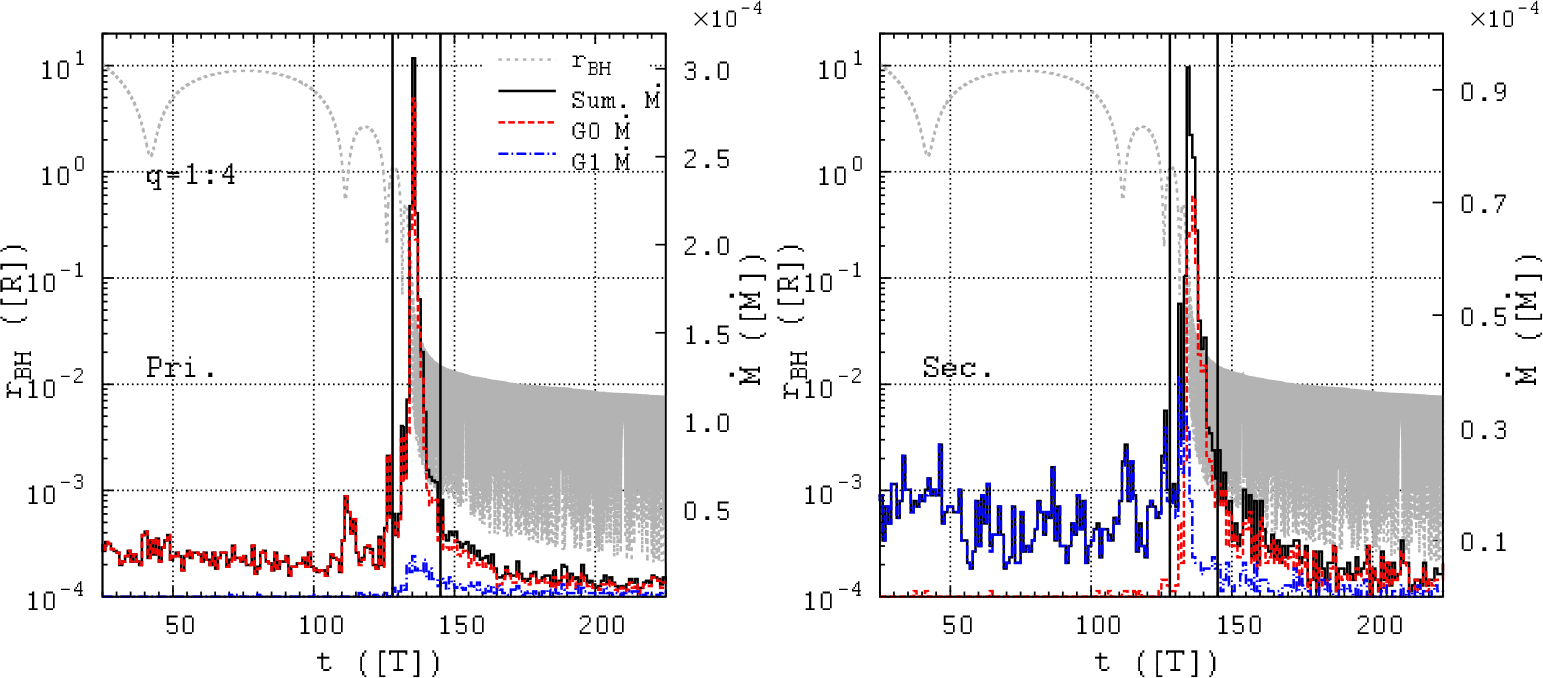
Figure 2 illustrates a representative case, showing the numerical simulation results for a minor merger with equal-mass stars and a BH mass ratio of
 $1:4$
. The left and right panels give the evolution of the TDER for the primary and secondary BHs, respectively. Although the curves represent the stellar mass accretion rate after tidal disruption, this is in one-to-one correspondence with the TDER. The red dashed line and the blue dash-dotted line indicate the contributions from stars originating in the host galaxies of the primary and secondary BHs, respectively. It is evident that during Phase I, most TDEs of both BHs are produced by stars from their own host galaxies. In Phases II and III, however, stars from both galaxies contribute to the TDEs. Since the stellar populations scale with the galaxy mass ratio, the contribution of stars from the host galaxy of the primary BH is significantly larger. Thus, for the primary BH, most disrupted stars still come from its own galaxy, though a significant fraction originates from the companion galaxy. For the secondary BH, in contrast, the vast majority of disrupted stars come from the primary’s host galaxy.
The left and right panels show the temporal evolution of the TDER for the primary and secondary BH, respectively. The x-axis denotes the evolutionary time; the left y-axis indicates the separation between the two SMBHs, while the right y-axis represents the stellar mass accretion rate due to tidal disruption. All physical quantities are expressed in N-body units. The gray dotted line shows the separation between the two SMBHs. The red dashed line and the blue dash-dotted line represent the contributions to the mass accretion rate from stars originating in the host galaxies of the primary and secondary BH, respectively. The black solid line indicates the total contribution from both. The two vertical black solid lines divide the entire merger process into Phases I, II, and III.
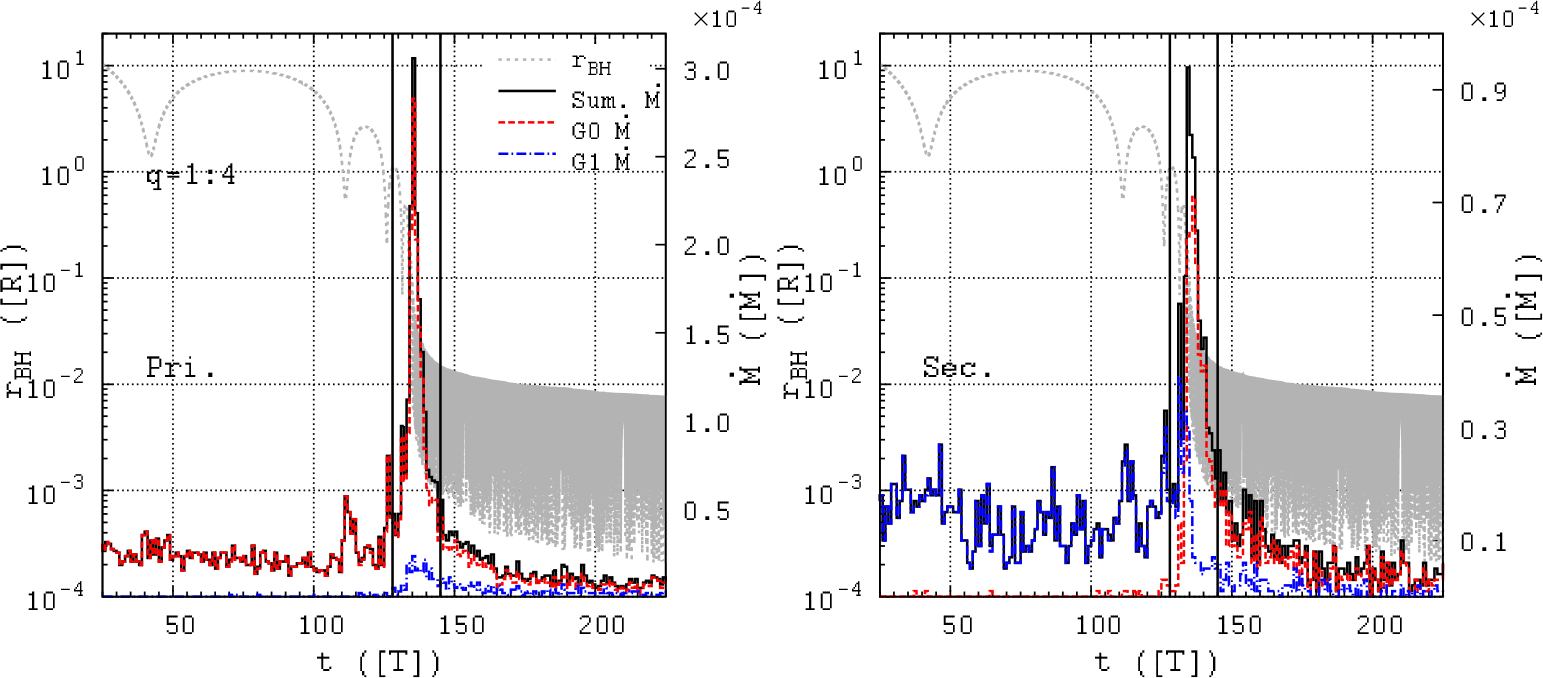
This leads to an important implication: in SMBHB systems, a significant fraction of stars disrupted by both BHs are not on parabolic orbits. By contrast, in the single SMBH model of an isolated galaxy, almost all disrupted stars are on marginally parabolic orbits (Zhong et al. Reference Zhong, Hayasaki and Li2023). Given that any deviation from a parabolic orbit can result in significant changes in the light curve (Hayasaki et al. Reference Hayasaki, Zhong and Li2018; Park & Hayasaki Reference Park and Hayasaki2020), this result carries crucial observational implications.
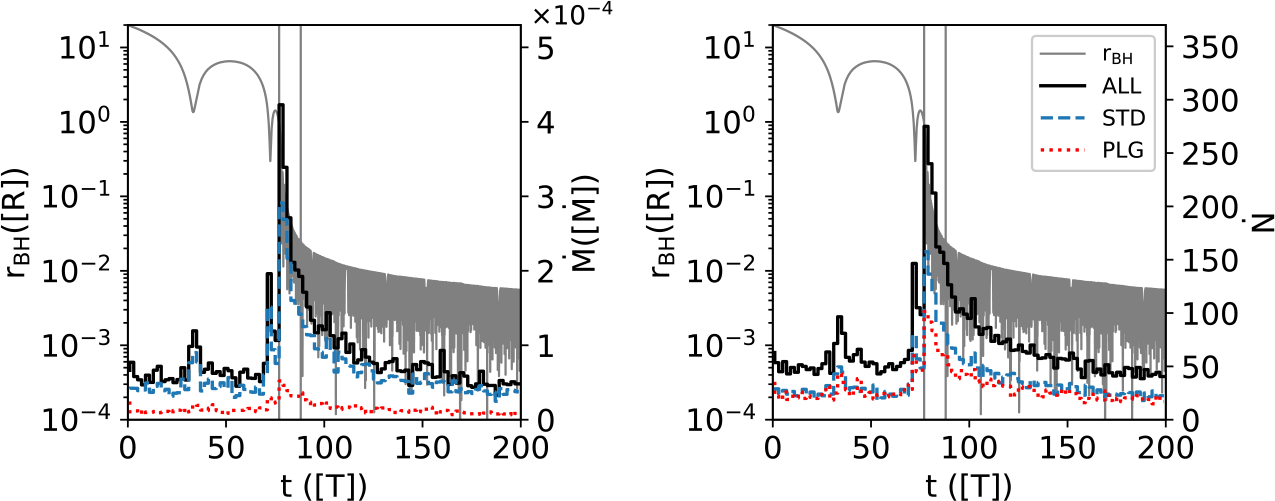
When different stellar types and masses are included in the model, although the overall evolution of the TDER resembles that in the equal-mass models, the stellar mass accretion rate and the event rate are no longer in one-to-one correspondence. Figure 3 presents such a multi-mass stellar model for a
 $1:1$
major merger. The left and right panels show the evolution of the mass accretion rate and the event rate, respectively. In each panel, the black solid, blue dashed, and red dotted lines represent the rate evolution of (i) all disrupted and swallowed stars, (ii) tidally disrupted “normal” stars, and (iii) stars directly swallowed by the BH, respectively.
The left panel shows the evolution of the total stellar mass accretion rate in the multi-mass model. The x-axis denotes the evolutionary time in N-body units; the left y-axis indicates the separation between the two SMBHs, while the right y-axis represents the stellar mass accretion rate due to tidal disruption/direct swallow. The gray solid line gives the separation of the two SMBHs, while the black solid, blue dashed, and red dotted lines record the contributions from (i) all disrupted and swallowed stars, (ii) tidally disrupted “normal” stars, and (iii) directly swallowed stars, respectively. The two vertical gray solid lines divide the evolutionary process into Phases I, II, and III. The right panel shows the evolution of the event rate, with the right y-axis representing the number of TDEs per unit time.
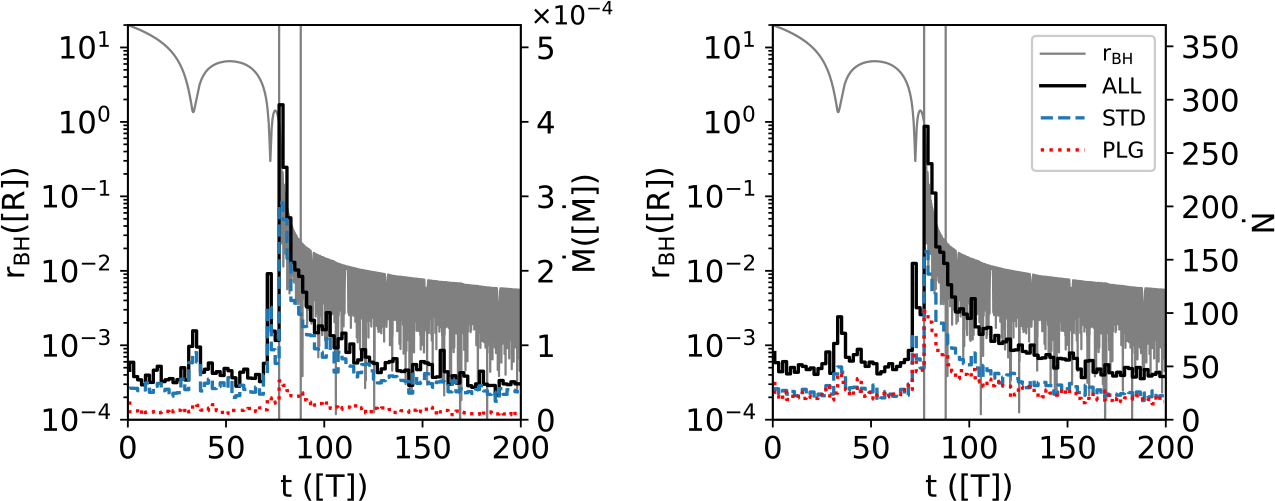
Figure 3 Long description
Panel A: The left graph is a line graph showing the evolution of the total stellar mass accretion rate in the multi-mass model. The x-axis represents evolutionary time in N-body units. The left y-axis indicates the separation between the two supermassive black holes (SMBHs) in units of R, while the right y-axis represents the stellar mass accretion rate due to tidal disruption or direct swallow in units of M. The gray solid line shows the separation of the two SMBHs. The black solid, blue dashed, and red dotted lines record the contributions from all disrupted and swallowed stars, tidally disrupted normal stars, and directly swallowed stars, respectively. The two vertical gray solid lines divide the evolutionary process into Phases I, II, and III. Panel B: The right graph is a line graph showing the evolution of the event rate. The x-axis represents evolutionary time in N-body units. The left y-axis indicates the separation between the two SMBHs in units of R, while the right y-axis represents the number of tidal disruption events (TDEs) per unit time. The gray solid line shows the separation of the two SMBHs, and the black solid, blue dashed, and red dotted lines represent different contributions to the event rate.
Because the multi-mass model contains a large population of low-mass stars, their tidal radii are in fact smaller than the Schwarzschild radius of the SMBH. These stars therefore cannot be tidally disrupted to produce observable flares; instead, they are swallowed directly by the BH. In contrast, somewhat more massive stars have tidal radii larger than the Schwarzschild radius and can undergo “normal” tidal disruption, producing observable flares.
As shown in the figure, if one considers only the contribution to the accreted stellar mass, the majority originates from the tidal disruption of higher-mass stars. However, if one examines the event rate, the right panel of Figure 3 shows that the event rate of swallowed low-mass stars is roughly comparable to that of tidally disrupted high-mass stars during Phases I and III, and only slightly lower in Phase II. Thus, nearly half of the stars in the system do not produce observable flares.
5. Discussion & summary
In Section 3, we discussed the characteristic features of TDE light curves in SMBHB systems. Due to the presence of the secondary BH, the debris may fail to return to the vicinity of the primary BH, leading to sudden interruptions in the light curve. Depending on the orbital phase, a light curve that has already been interrupted may sometimes recover. In certain cases, this process of interruption and recurrence can repeat in a quasi-periodic mode. This theoretical model has so far enabled the identification of several SMBHB candidates. It should be noted, however, that the model is based on simplified three-body scattering experiments, neglecting the self-gravity of the debris as well as hydrodynamic effects such as viscosity and pressure. Consequently, the model cannot accurately trace the detailed evolution of debris returning to pericenter near the BH, and the accuracy of the results deteriorates with increasing integration time. Nevertheless, from a qualitative perspective, the model still provides significant physical insight.
In Section 4, we employed direct N-body simulations to investigate the evolution of the TDER during galaxy mergers. The numerical results show that the TDER first experiences a brief but substantial enhancement during Phase II, followed by a sharp decline in Phase III to levels comparable to, or significantly below, those of Phase I. Interestingly, a detailed analysis of the disrupted stars’ origins reveals that during Phases II and III, the majority of disrupted stars come from the more massive galaxy. For the primary BH, this implies that most of the stars it disrupts originate from its own host galaxy, whereas for the secondary BH, most disrupted stars come from the companion galaxy. This indicates that a large fraction of disrupted stars in such systems originate from the companion galaxy, meaning they are likely on non-parabolic orbits. This stands in stark contrast to the single-BH case, where nearly all disrupted stars are on marginally parabolic orbits. Since TDE light curves differ for stars on different orbital configurations, observationally we may be able to use TDEs to infer the fraction of SMBHB systems. In addition, models incorporating a stellar mass spectrum show that because the tidal radius of low-mass stars can be smaller than the Schwarzschild radius of the BH, a substantial fraction of close encounters may result in stars being swallowed directly without producing any flare.
It should be noted that discussions involving direct N-body simulations are inevitably subject to limitations imposed by particle number. The number of particles employed in the simulations is far smaller than the actual number of stars in galaxies. This gives rise to various artificial effects. For instance, the efficiency of two-body relaxation, which may have significant influence on the TDER, depends directly on particle number. As a result, one must be careful when interpreting direct N-body results with limited particle resolution. Fortunately, this limitation can be mitigated by combining fully resolved numerical modeling with theoretical analyses and extrapolating the results to realistic conditions (Li et al. Reference Li, Liu and Berczik2017).
In general, in gas-poor environments, TDEs can serve as powerful probes for confirming the existence of SMBHB systems. This method has been demonstrated to be feasible not only in the discovery of individual sources but also in revealing distinctive features in the evolution of the TDER.
Acknowledgments
The author thanks his collaborators Peter Berczik, Xian Chen, Kimitake Hayasaki, F. K. Liu, Xinwen Shu, Rainer Spurzem and Shiyan Zhong. He also acknowledges the support by the National Science Foundation of China under grant NSFC No. 12473017.