

1. INTRODUCTION
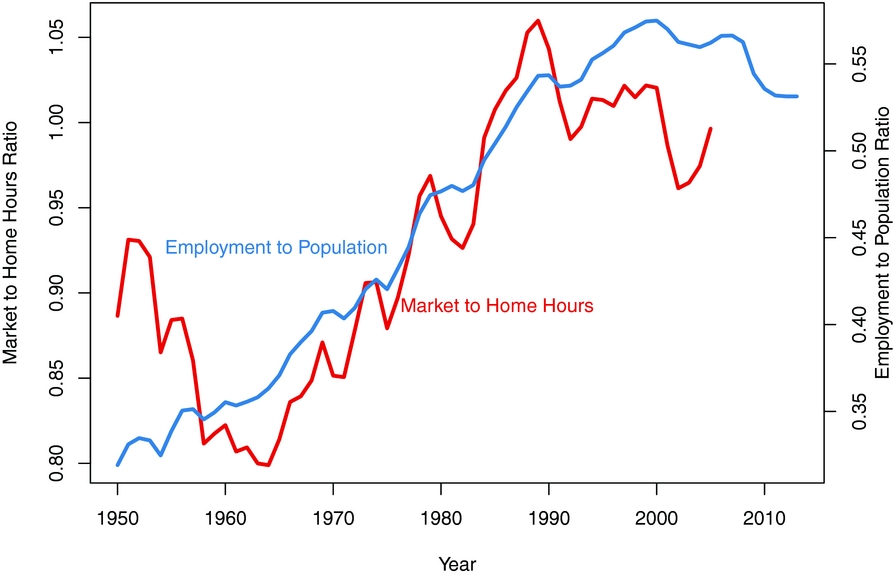
The female employment to population ratio increased from 32% in 1950 to 57% in 2000, before declining to 53% in 2013, as seen in Figure 1. The determinants of the rise in female labor supply are well documented in the literature and are attributed to different sectoral growth rates in the home and market sectors [Akbulut (Reference Akbulut2011)], the invention and price decline of time saving durable goods [Greenwood et al. (Reference Greenwood, Seshadri and Yörükoğlu2005)], and the creation of products that desex breastfeeding [Albanesi and Olivetti (Reference Albanesi and Olivetti2016)], among others. While the sources of the rise in female labor supply have been carefully analyzed, less attention has been given to the implications on time use and expenditures of a woman’s decision to work in the market sector.
Female employment to population ratio and market to home hours ratio.

Most existing empirical studies focus on one particular expenditure or time use category, or alternatively, the theoretical studies focus on overall market expenditures and the total time spent on home production. The purpose of our analysis is to understand the substitution between time and expenditures at the activity level through a comprehensive analysis using multiple data sources. Our hypothesis is that when a married woman is employed, her time spent on household production activities with close market alternatives will be lower than households with nonemployed married women, controlling for income and other observable characteristics that affect time spent on home production. In addition, households with employed women will have higher expenditures on these market alternatives compared to households with nonemployed married women. The extent of the substitution between time and expenditures may differ across activities. In addition, we delve deeper into the relationship between men’s and women’s work hours and how their interactions affect the observed expenditure differences.
In basic home production models, time constrained women must choose to allocate their waking hours between home production, market production, and leisure. When women choose to enter the labor market, their time spent in home production and/or leisure must fall. If the transfer in hours is from the home sector to the market sector, households substitute market goods and services for home produced goods and services. For example, instead of staying at home and caring for her own children, a woman who enters the labor market may reduce her childcare hours at home and replace the lost home production with purchased daycare services. Similar substitutions may occur between other home and market goods. Time spent caring for elderly parents and preparing meals for the family are replaced with nursing home services and meals out at restaurants. This is a plausible story that appears to hold at the aggregate level, as seen from the market to home hours ratio from Ramey and Francis (Reference Ramey and Francis2009) in Figure 1, but there is little empirical evidence to confirm that this is the way in which individual households behave.
Understanding the trade-off between time and expenditures at the household level is imperative for analyzing the effects of government policies as well as interpreting trends in aggregate data. Households have utility over consumption of both home and market goods, so the impact of government policies necessarily depends on the substitution between home services and market services even if government policies only directly affect the market sector.
Any government or firm-level policy that changes the incentives for women to work at the extensive or intensive margin would additionally affect expenditures and women’s time allocation in the home. A few specific policies that might affect labor supply choices are labor income taxes, parental leave policies, and childcare subsidies. For example, Guner et al. (Reference Guner, Kaygusuz and Ventura2014) developed a life-cycle equilibrium model with childcare subsidies based on the Child Care Development Fund (CCDF), the major government childcare subsidy program in the United States The authors estimate that fully subsidized universal childcare would increase the married women’s labor force participation rate by 10% and increase their aggregate labor hours by 1%. Our results suggest that fully subsidized daycare would also result in increases in expenditures in other service categories. When women work more hours in the market, they need to make up for lost time spent on other home production activities. They were also making meals, cleaning the house, and taking care of elderly relatives. Our results show a fall in hours spent in several home production activities and an increase in several expenditure categories when women increase their labor supply, even when controlling for income. Thus, an expansion of the CCDF program may induce women to enter the market, or work more hours, and there may be a boost in their measured consumption. However, some of this increase in measured consumption is a switch away from consumption that was previously produced in the home and thus unmeasured. The impact of this government policy on utility or welfare will depend on both market and home consumption.
Data from the Panel Study of Income Dynamics (PSID), the Consumer Expenditure Survey (CEX), and the American Time Use Survey (ATUS) are used to analyze the effects of married women’s employment on household expenditures and time use. First, we explore the effects of female labor supply on several expenditure measures available in the PSID while controlling for unearned income of the woman (e.g. the man’s earnings or predicted income), as well as the number of annual housework hours. Consistent with our hypothesis, married households where the woman is working spend more money on paid childcare services and food away from the home and spend less money on food used in the home as compared to married households where the woman is not employed. This suggests that even if we control for their available income, more money is spent on goods and services in the market sector when the woman works. However, this does not provide any insight into how women spend their time. For this reason, the analysis continues with the ATUS. We examine the extent to which home production activities differ for women in one and two earner households controlling for many demographic characteristics and different measures for income. The primary focus is on time-use activities that are close substitutes with the market goods explored in the PSID. The findings show that married households in which the woman works spend less time on home production activities such as food preparation, housework, and childcare. When comparing how the labor supply of men and women affects each other’s time use, we find that neither spouse fully makes up for the loss in time spent on these home production activities when his/her spouse is employed. The CEX provides more detailed expenditure categories than the PSID, and in addition information is collected quarterly meaning these households may have better recollection of their spending habits. The results in this study show that expenditures on market services are higher for two earner households compared to one earner households and time spent by women on home production of comparable services is lower for two earner households compared to one earner households. Consistent across all surveys, childcare appears to be substituted with market services to a much greater degree than any of the other home production activities.
2. RELATED LITERATURE
One of the earliest papers to explore the allocation of time and household consumption decisions is Becker (Reference Becker1965). Becker (Reference Becker1965) proposes that households do not have utility over market goods; rather, households have utility over commodities that are produced using market goods and nonworking time. For example, households do not have utility over food, they have utility over meals which are produced using the food purchased in the market and the nonworking time it takes to eat and prepare the meal. Therefore, the value of the food includes not only the purchase price, but also includes the value of the time that could have otherwise been spent working. In line with Becker (Reference Becker1965), Aguiar and Hurst (Reference Aguiar and Hurst2005) point out that this indicates the value of consumption is often different from expenditures. In only thinking of consumption in terms of expenditures, we fail to account for an essential part of consumption, which is the value of home production time. They find that the exclusion of home produced goods can explain the decline in consumption expenditures seen in retirement as retirees increase their time spent in home production.
A number of papers extending back to the 1980s have looked at the differences in time and expenditures across different types of households. Nickols and Fox (Reference Nickols and Fox1983) found that households with an employed wife purchased more “time buying” services such as childcare, disposable diapers, and food away from home. These working women also employ “time saving” techniques in regards to home production to use her time more efficiently and reduce time spent on leisure. So while these women spend less time on household production, their employment does not appear to affect the household production of other members of the household. However, Kinsey (Reference Kinsey1983) does not find that households increase their marginal propensity to consume food away from home when women are working. This study used cross-sectional data from the PSID from the year 1978, and so we expand upon the work by Kinsey to include all years of the survey until 2011 and household fixed effects.
Other studies have shown evidence of “outsourcing” traditionally female tasks. De Ruijter et al. (Reference De Ruijter, Treas and Cohen2005) shows that both single men and single women outsource traditionally female tasks, but single men do not outsource traditionally male tasks. Lippe et al. (Reference Van der Lippe, Tijdens and De Ruijter2004) employs data from the Dutch National Time Budget Survey for 1995 to explore the extent to which households outsource home production and if this outsourcing is actually time saving. They find that households with more income are more likely to outsource and this is an equally important reason for outsourcing as both spouses working. Additionally, households who purchase these market services do in fact save time on home production, though not always in equal ways for men and women. This is similar to the results found on time use in section 6.5. In line with these studies, we focus on traditionally female tasks and the response of one and two earner households when men work.
This paper also reflects the work of Baxter and Rotz (Reference Baxter and Rotz2009), Soberon-Ferrer and Dardis (Reference Soberon-Ferrer and Dardis1991), Yen (Reference Yen1993)Footnote 1, and Ribar (Reference Ribar1995) who look at the link between consumption expenditures and female labor supply. In addition, Jacobs et al. (Reference Jacobs, Shipp and Brown1989) finds that when the wife is employed the household spends more on services (such as childcare and food away from home) and nondurables as demonstrated in their analysis of CEX households. Our work most closely resembles Baxter and Rotz (Reference Baxter and Rotz2009) who study the differences in consumption expenditures between one and two earner households however the authors use only the CEX for their analysis. Additionally, these previous studies must overcome selection issues because with the CEX they cannot control for selection into employment status using individual fixed effects. Baxter and Rotz (Reference Baxter and Rotz2009) use propensity score matching to alleviate the issue of selection into a one or two earner household. In comparison to these studies, we add the ATUS and PSID data as well as use more recent data from the CEX for a more complete examination of the substitution between market goods and services and home production. Using the PSID, we are able to address selection into employment through the inclusion of individual fixed effects as well as a rich set of explanatory variables that affect the labor supply choices of the woman.Footnote 2 Additionally, the current study explores the relationship between men and women’s work hours and their time use and household expenditures.
In the spirit of Aguiar and Hurst (Reference Aguiar and Hurst2005), we look at the notion of consumption versus expenditures, but instead focus on the difference between time spent on home production and market expenditures for households in which the woman is employed compared to those in which the woman is not employed. When the marginal product of labor in the market is greater than the marginal product of labor at home, women enter the labor force and work in the market sector. They spend less time in home production and instead purchase these services in the market sector. Therefore, expenditure increases, but not necessarily consumption. Aguiar and Hurst (Reference Aguiar and Hurst2005) focus solely on food while we document expenditures of several market goods and services as well as their corresponding time-use categories.
The shift from home production to purchased expenditures has implications for government policies through its effect on measurement. Any government policy that affects the transfer of hours from (to) the market sector to (from) the home sector will have both measured and unmeasured consequences. Not all production and consumption takes place in the measured (market) sector. Measured consumption and income will differ from total consumption or income which includes consumption and production in both the home sector and market sector. This distinction would impact measured statistics like consumption inequality, income inequality, and the consumption to output ratio. The importance of measurement and its link to female labor supply has been the focus of recent literature. House et al. (Reference House, Laitner and Stolyarov2008) uses the Health and Retirement Study to estimate parameters of a life-cycle model and finds that the services households purchase to make up for time spent on home production are equal to approximately a quarter of women’s earnings. Forrester (Reference Forrester2017) uses a two sector neoclassical growth model to show that an increase in the market hours to home hours ratio can account for the increase in the consumption to output ratio seen in the data after 1950. Forrester (Reference Forrester2017) does not discuss the microeconomic evidence of the trade-off households make between time spent in home production and purchased goods and services or which categories of goods and services are driving the increase in the consumption to output ratio. It is this deeper understanding of the substitutability between time and expenditures at the activity level that we explore in our paper.
3. THEORY
This section describes the underlying theory for the empirical analysis that is the focus of the paper. The model was originally put forth in Becker (Reference Becker1965), and later used by Soberon-Ferrer and Dardis (Reference Soberon-Ferrer and Dardis1991) and Yen (Reference Yen1993). The model here has been simplified to focus on married households with two members, a man and a woman. Households have utility over commodities Z i, which are produced using nonmarket time from each member of the household, t ik, and market purchased goods and services x i. Therefore, the household utility function is represented by
 $$\begin{equation}
U=U(Z_{i},\ldots Z_{n}),
\end{equation}$$
where Z i = f(x i, t i1, t i2) for i = 1, 2, . . .n. For example, if the activity is “childcare,” the household may use hours spent by each family member to care for the child along with purchased daycare services to produce this activity. Households are subject to time constraints and a budget constraint. Total time available to each household member,  $\overline{t}_{k}$ is divided between producing commodities and working
 $$\begin{equation}
t_{wk}+\sum \limits _{i=1}^{n}t_{ik}=\overline{t}_{k}, k=1,2.
\end{equation}$$
Households purchase market goods and services, x i with the labor income of the household members. The household budget constraint is
 $$\begin{equation}
\sum \limits _{i=1}^{n}p_{i}x_{i} = \sum \limits _{k=1}^{2}t_{wk}w_{k},
\end{equation}$$
where w k is the hourly wage rate for individual k, and t wk is the number of hours each member spends working. For a simple two-member household that consists of a married man and woman, the household problem of maximizing utility subject to constraints implies an expenditure function for any particular good x i depends on, the husband’s wage, husband’s hours worked, wife’s wage, wife’s hours worked, and other demographic characteristics, D. Since wages are only observed for people who work, and the wage will affect the employment decisions of the household members, we will use a measure of predicted income, I, as a stand in for actual labor income for the husband and wife. Therefore, expenditures on a market good or service x i can be written as
 $$\begin{equation}
p_{i}x_{i}=f(t_{w1},t_{w2},I,D).
\end{equation}$$
Section 6 explores the determinants of expenditures used to produce different activities. Time constrained women must decrease the combined amount of time spent on all other activities when they work an additional hour in the market. An increase in hours of market work by women increases the income available for households to spend on goods and services. If a given activity is a normal good, then an increase in income increases expenditures used to produce that activity. If time spent on a particular activity and expenditures on the activity are substitutes, an increase in hours of market work may also increase expenditures, holding income constant. For example, an increase in expenditures on childcare when women increase market work hours indicates that paid daycare services and time spent caring for children are substitutes.
In Section 6, we also explore the trade-off between time spent working and time spent producing various activities. Women do not need to reduce their time spent on all activities when they work an additional hour in the market. For example, it is possible that for every hour a woman works in the market, she decreases her leisure time by an hour, and time spent on all other activities remains unchanged. The substitutability between purchased market goods and time as inputs are tested in the empirical analysis.
4. DATA AND METHODS
We use three sources of data to provide evidence of the different expenditure and time use patterns of households where the woman is employed versus those where she is not. While none of these data alone are sufficient to suggest a true causal effect, each has its own benefits. The datasets used are the PSID, the ATUS, and the CEX.Footnote 3
First we use the PSID,Footnote 4 a household panel survey that currently has data available annually from 1968 to 1997 and biannually from 1999 to 2011. The panel began with a nationally representative sample of 4,802 families, and has followed the initial sample and their children as they split-off and formed new households. The analysis is completed using the original households and their split-offs.
The benefit of these data is the longitudinal nature of the survey. In contrast to the other data used, we observe the same set of households over a large number of years. This will allow for household fixed effects to address the selection of families where the woman chooses to work or not. The survey contains a rich set of observables about both the head of the household and the woman or unmarried partner. In addition, we will exploit questions asked about the household expenditures on food away from home, childcare, and clothing, as well as questions about the number of hours of housework of each of the spouses. However, compared to other expenditure surveys, such as the CEX, the available expenditure categories are very broad. Also, the expenditure questions in the PSID are asked only in a few survey years.
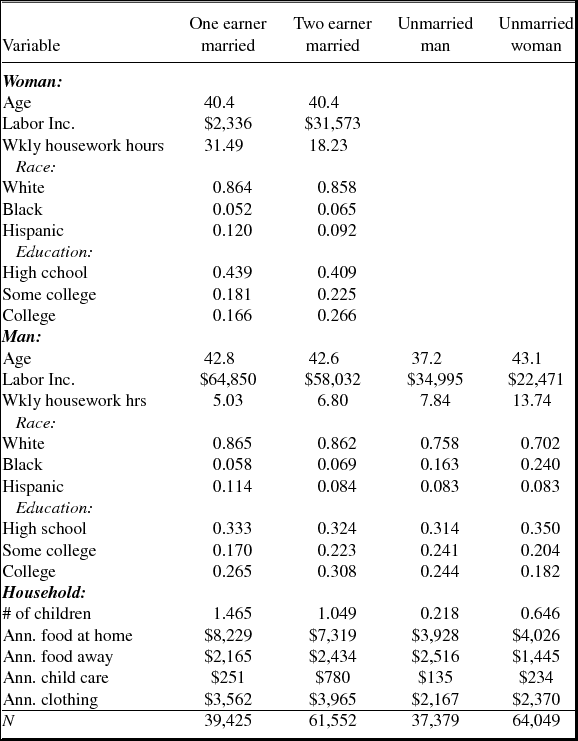
Table 1 shows the means of selected variables for households in the PSID, ages 18 to 70. A number of demographic and labor market variables are presented for the head of household and the female spouse of the head of household, as well as household level variables. We compare one earner married couples where the man only is employed, two earner married couples, unmarried men, and unmarried women. For the purpose of this analysis, we define two earner households to be households in which both the man and woman are employed. One earner households include only those households in which the man is employed. We define a worker to be “employed” if they report working for at least 30 weeks in the previous year. Employment status for the previous year is used rather than employment status for the current year to be consistent with the timing of expenditures.Footnote 5 The main comparison in the paper will be one earner and two earner households so most of the discussion here is dedicated to these groups.
Two earner households have considerably higher education compared to one earner households and the unmarried respondents and this is true for both men and women in the survey. Two earner households are more likely to be black and less likely to be Hispanic compared to one earner couples. However, the unmarried respondents are by far the most likely to be black and least likely white. Unmarried women are much older than their married counterparts due to the fact that many of them are widows. Unmarried individuals have substantially fewer usual weekly labor hours than the married couples which of course leads to lower family income, even when compared to the one earner married couples.
Moving to our variables of interest in Table 1, we observe interesting patterns in regards to the hours of housework of the family members. When both the man and the woman are employed, housework hours are lower for the woman and higher for the man compared to one earner households. However, the total hours of housework are substantially lower, so the more hours worked at home by the man does not compensate for the fewer hours put in by the woman. This suggests that these couples might be supplementing their own housework hours by purchasing market goods. As expected, households where both spouses are working spend more per year for every one of the consumption categories. By far the largest change is in the childcare expenditures category, which is over 200% higher for two earner households. Of course, this simple comparison is confounded by the fact that two earner households have more income to spend on consumption and those one earner households are likely not that way by random chance. Therefore, further analysis controlling for household characteristics is needed.
Summary statistics of PSID households: Means

The PSID provides a broad perspective on how female labor supply alters time spent in home production. To better understand the substitutability between home goods and market produced services, it is useful to look at home production categories in finer detail. This detailed time use information is found in the ATUS Multi-Year files from 2003 to 2012.Footnote 6
The ATUS is a cross-sectional dataset and contains interviews of a nationally representative sample of households randomly chosen from those who have completed their eighth interview in the Current Population Survey (CPS). In early 2003, there are 3,500 households per month and about 2,190 households per month thereafter. The eligible population each year is restricted to those age 15 years or older and does not include people currently working in the military, individuals living in nursing homes, or those in prisons. The respondent of the household is selected randomly from the age of people in the household. The monthly sample each year is randomly divided into four to make sure each week of every month is sampled evenly along with the equivalent number of weekends and weekdays. The focus of this paper is on the impacts of labor force participation, so those interviews that occurred during weekends or holidays have been excluded from the analysis. Similarly, the sample is restricted to only those individuals who are between the ages of 18 to 70.
Compared to most surveys, the ATUS provides more accurate and detailed information as to how much time the respondent spent doing different activities. The person selected for the interview receives a notice and a brochure about what is expected during the interview and the date the interview is expected to take place. During the time-use section of the interview, the respondent describes the previous day’s activities beginning at 4 a.m. the previous day and ending at 4 a.m. the morning of the interview. There are anywhere from 2 to 20 second tier categories within each major category presented in the ATUS. Then there are 2 to 30 plus six digit activity codes within each second tier category. The major categories presented are personal care; household activities; caring for and helping household members; caring for and helping nonhousehold members; work and work-related activities; education; consumer purchases; professional and personal care services; household services; government services and civic obligations; eating and drinking; socializing, relaxing, and leisure; sports, exercise, and recreation; religious and spiritual activities; volunteer activities; telephone calls; and traveling.
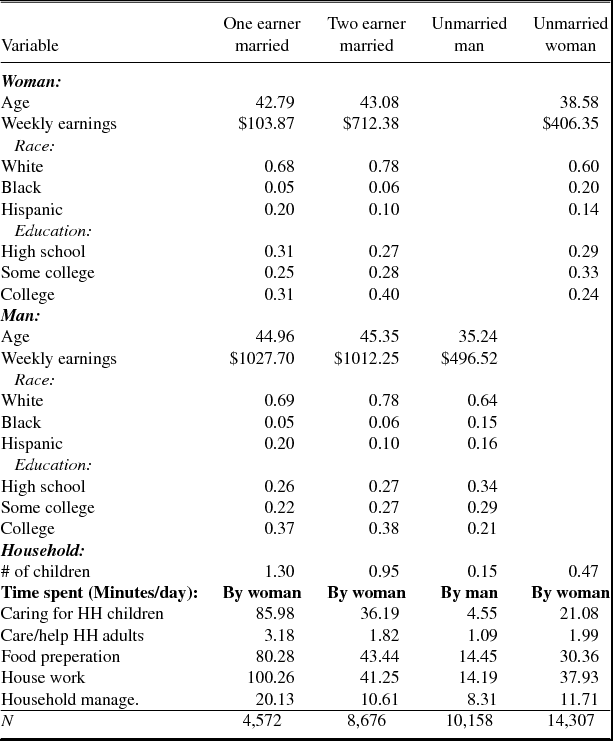
Summary statistics for demographic variables and selected time use variables of interest from the ATUS are displayed in Table 2. Demographic characteristics are reported for both the respondent and spouse of married households and only the respondent of unmarried households. Time use summary statistics are reported for women respondents only, with the exception of unmarried men where men’s time use statistics are reported. Unmarried women are older, spend more time doing household production, and earn less than unmarried men. Two earner married couples are disproportionately white and more educated compared to one earner married couples. The share of men with a high-school degree and college education or more is about the same in both one and two earner households. A greater distinction between women in one and two earner households is seen in the average time they spend on various home production activities. Women in two earner married households allocate less time to the time use categories associated with home production compared to women in one earner households; however, they also have higher weekly earnings.Footnote 7 In the regression analysis that follows, potential household income will be a control variable since it is likely correlated with the time spent on the selected household activities.
Summary statistics of ATUS respondents: Means

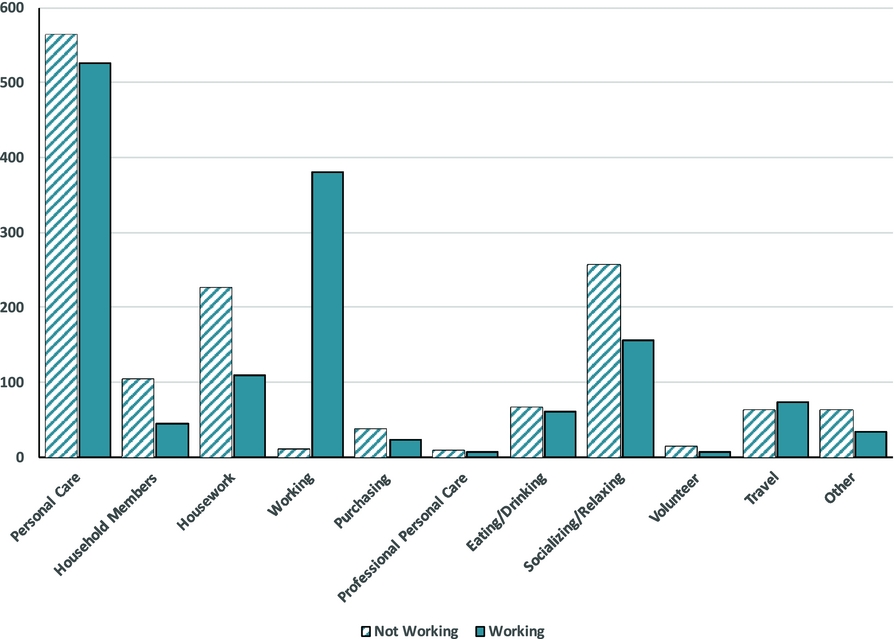
To further explore the differences between household types in their time use patterns, Figure 2 shows a chart of the time use of married households where the woman is working and the woman is not working. The time use category shown is the major category, the highest level in the hierarchy, though some are excluded since time use is small across both groups.Footnote 8 These graphs in Figure 2 show us that when a woman works in the market, that time is transferred from leisure activities and household production activities. We see significantly less time spent among working women on socializing, housework, time spent on household members, and somewhat less time on purchasing. In contrast, we see about the same amount of time spent eating and drinking, personal care, professional and personal care, and travel time.
Minutes spent per day by women on major time use categories.

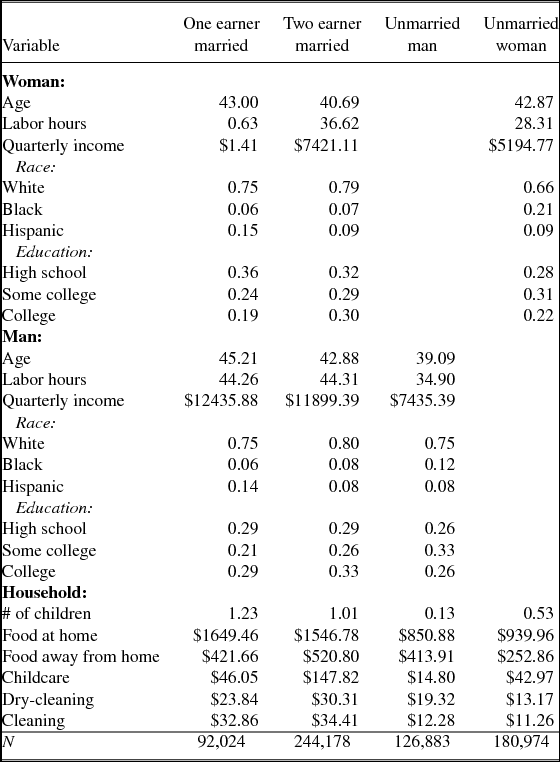
Not all ATUS time-use categories have corresponding expenditure categories in the PSID that a household may purchase to replace lost home production. Therefore, we extend our analysis to include the CEX. The CEX is a household survey that spans the period 1980 to 2013.Footnote 9 Each consumer unit is interviewed for a total of five quarters to gather detailed information about the consumer unit’s expenditures, employment, and income information during the three months prior to the interview month. The first interview collects only background information, with the expenditure data gathered in interviews 2–5.Footnote 10 Summary statistics for different demographic variables in the CEX are presented in Table 3, and several mirror those from the PSID. Women in two earner households are more educated and more likely to be black than Hispanic, compared to women in one earner households. One earner households also have more children than two earner households on average. In both surveys, two earner households have higher expenditures on food away from home and childcare expenditures than one earner households, but have lower expenditures on average on food to be used at home. The average expenditures presented in Table 3 are quarterly expenditures, whereas the expenditures in Table 1 are annual expenditures. Unlike in the PSID, more detailed expenditure categories are included in the CEX, which allow us to create expenditure categories that resemble close alternatives to home produced goods. For example, in the CEX, childcare includes only those expenditures associated with babysitting, daycare services, or nursery school tuition.
Summary statistics of CEX households: Means

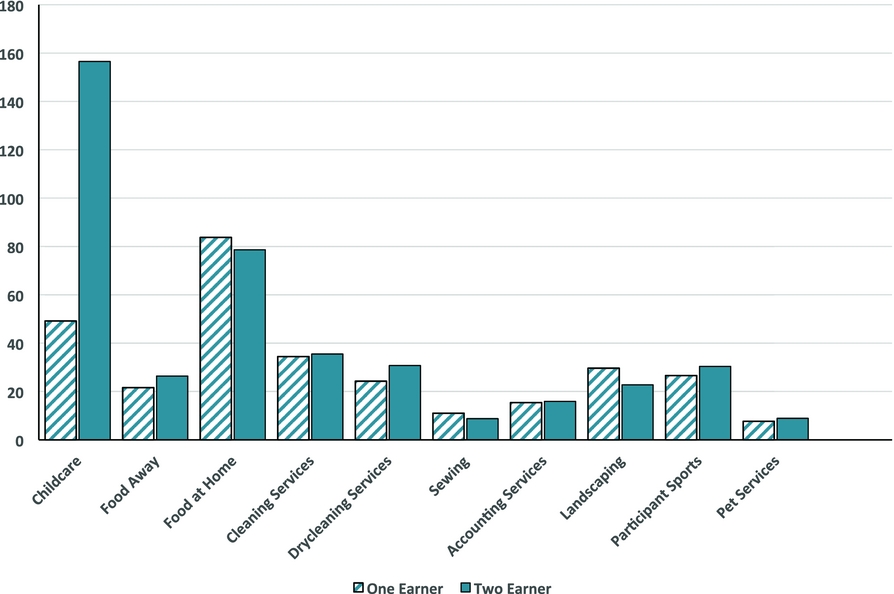
Figure 3 presents some of the detailed expenditure categories for one earner and two earner households. Childcare expenditures display the greatest difference between one earner and two earner households. This result is not surprising since care must be provided to children whether or not their parents are working. If married households do not pay for babysitters or nursery schools to care for their children, then a relative must watch the child free of charge. In this way, childcare is unique compared to the other forms of home production. One earner households also spend more on food away from home, cleaning services, dry-cleaning services, accounting services, pet services, and participant sports.Footnote 11 These results align with those in Figure 2. In the ATUS, women in two earner households spent less time on housework and household management, which include things like vacuuming, dusting, cleaning, and doing taxes. In the CEX, women in two earner households spend more money on services that could replace those home production activities. On the contrary, two earner households spend less on average on lawn services than one earner households. Unlike some of the other home production activities, caring for the lawn or garden is more of a traditionally male task; therefore, we would not necessarily expect this variable to change in a particular direction when the household is a two earner household.
Average quarterly expenditures for one earner and two earner households.

5. SELECTION
This section discusses the potential for selection bias in the regressions that follow. The concern is that there may be an unobservable variable that is correlated with a woman’s labor supply that is also correlated with expenditures or home production activities. If there exists such a variable, the OLS coefficient on women’s employment suffers from omitted variable bias.
If omitted variable bias exists, it is difficult to predict the direction of the bias. For the PSID data, including household, year, and state fixed effects mitigates selection from unobservable variables that are correlated with employment status and are also correlated with expenditures. However, time variant household specific selection could still exist. Health is an example of a variable that is correlated with both employment status and expenditures. Suppose health is an indicator variable, 1 for healthy and 0 for not healthy, healthy people are more likely to work, so the correlation between employment and health is positive. Healthy people may also have lower expenditures on things like daycare services and food away from the home because they are well and able to take care of and entertain their own children and prepare their own meals themselves. In this case, the correlation between daycare services, or food expenditures away from the home and health is negative. The reported coefficient on employment status of the woman in the household would be biased downwards.
Another example, a woman’s taste and preferences toward her children, works in the opposite direction. A woman’s inclination to be with her children is negatively correlated with both labor supply and expenditures on daycare services, which makes the bias positive. This means the coefficient on the woman’s employment status in the OLS regression would be overstated. Similar arguments could be made for the ATUS regressions.
Given the potential for selection bias in the regressions, we interpret the coefficient on employment status with reservations. However, we mitigate potential selection issues through the use of household level fixed effects and the inclusion of several observable control variables that could be correlated with labor supply and the outcome variable.
6. RESULTS
In Section 6, we present the results of regression analysis for the various datasets employed in this paper. In each case, the dependent variables will be one of a number of expenditure or time use variables. The regressions control for observables of the respondents and their spouses of each survey, and the variables of interest are either the number of labor hours or an indicator for the individual being employed. First, in Section 6.1, fixed effect regression models are used for the respondents of the PSID. Next, in Sections 6.3 and 6.4, standard OLS regressions are presented using the ATUS and CEX, respectively. The following equations describe the fixed effects regression models used in the analysis. Results are shown for the sample of married households where the man is employed in each survey. Several different regressions are estimated with different outcome variables that are either: home production activities or logged expenditures on purchased market substitutes for home production. These outcome variables are regressed on the number of labor hours of both spouses to estimate the effect of employment at the intensive margin
 $$\begin{eqnarray}
{\rm Outcome}_{i,t,s}&=& \beta _{0}+\beta _{1}\, {\rm woman^{\prime }s}\, {\rm hours}_{i,t,s}+\beta _{2}\,{\rm man^{\prime }s}\, {\rm hours}_{i,t,s}+\beta _{3}^{\prime }X_{i,t,s}\nonumber \\
&&+\,\delta _{t}+\gamma _{s}+u_{i,t,s},
\end{eqnarray}$$
where Woman’s Hoursi, t, s is the usual weekly labor hours of the woman, Man’s Hoursi, t, s is the usual weekly labor hours of the man, X i, t, s is a set of control variables for household i in year t living in state s, and δt and γs are year and state dummy variables, respectively. The second set of regressions for each outcome variable controls for the employment status of the woman, Woman Employedi, t, s as well as Man’s Hoursi, t, s, the usual weekly labor hours of the man. All other control variables are the same
 $$\begin{eqnarray}
{\rm Outcome}_{i,t,s}&=&\beta _{0}+\beta _{1}\,{\rm Woman}\,{\rm Employed}_{i,t,s}+\beta _{2}\,{\rm Man^{\prime }s} \, {\rm Hours}_{i,t,s}+\beta _{3}^{\prime }X_{i,t,s}\nonumber\\
&&+\delta _{t}+\gamma _{s}+\eta _{i}+u_{i,t,s}
\end{eqnarray}$$
There are two potential issues to address. One is the possible endogeneity of income and labor supply decisions, and second is the correlation between income and expenditure/time use decisions as well as the correlation between labor supply and expenditure/time use decisions. The income the woman in the household could earn if she were employed would affect her decision about whether or not to work, and potentially how much to work. In addition, the total income available in the household will in some part dictate how much the house will purchase in terms of services that are substitutes for home production. For instance, a household where the woman begins working may choose to increase their purchases of childcare services since she no longer has as much time at home. However, by the income effect, they would increase their consumption of all normal goods with an increase in income. So two households with the same number of earners are likely to purchase different amounts of goods and services if for no other reason than their different levels of income.
One method to address the differences in income across households would be to include men’s earnings as an independent variable. Since the woman’s time available for home production, her labor force status, and her income are all determined simultaneously, we do not include her income in the regression analysis. However, using only the man’s income may not fully account for the differences in income so in addition we estimate the household’s earnings potential, if both spouses were working full time. Following Garfinkel et al. (Reference Garfinkel, Haveman and Betson1978), with a Heckman (Reference Heckman1979) correction for selection in a woman’s decision to work, we estimate individual potential income separately by gender and race, and combine the potential income of the man and woman to get an estimate of potential income of the household. To capture their full-time earnings potential, we assume that each spouse works 40 hours per week for 50 weeks of the year.Footnote 12 Using either control for income produces nearly identical results as shown in the beginning of Section 6.1.
6.1. Evidence from the Panel Study of Income Dynamics
This section analyzes how household consumption expenditure and housework hours decisions differ by female labor supply along both the intensive and extensive margins. A number of different outcome variables are used in the analysis: annual household expenditures on childcare, food away from home, food used at home, and clothing as well as measures of annual housework hours. For this analysis, since annual expenditures and annual housework hours are reported, the measure of the woman being “employed” is intended to capture if she was working for most of the year. Thus, a woman is designated as employed if she worked at least 30 weeks.Footnote 13 Since this is a panel survey, the regressions that follow in this section also include household fixed effects.
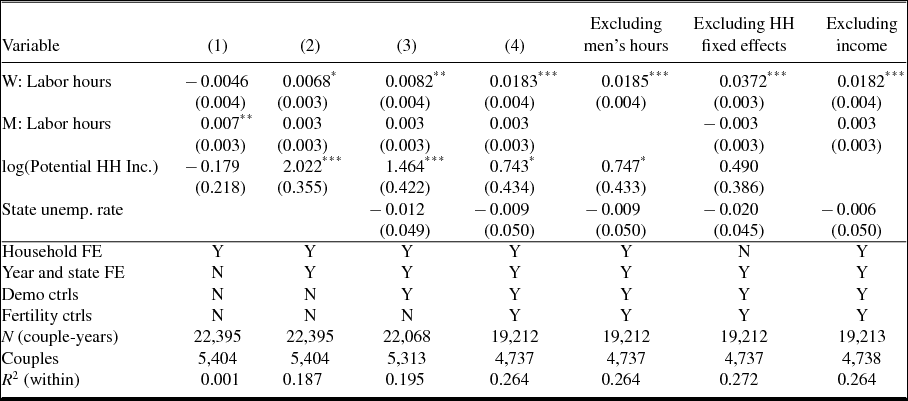
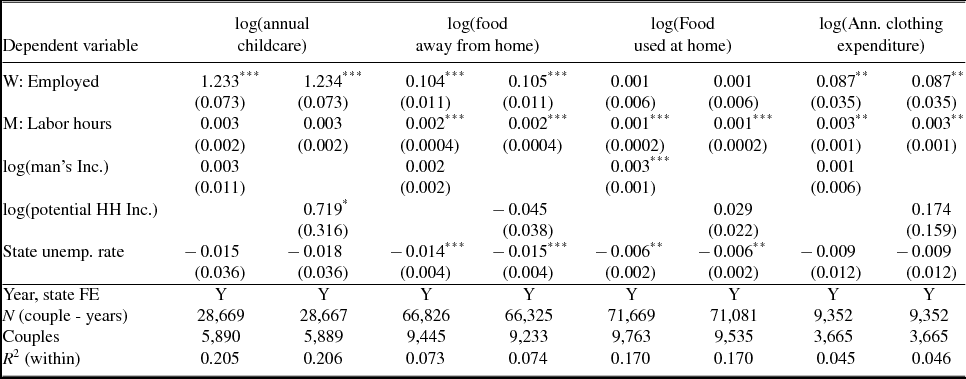
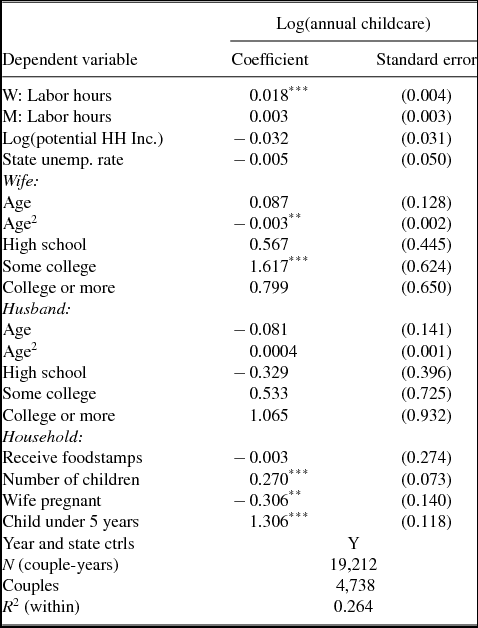
The first outcome variable we explore is the log of annual childcare expenditures for those couples with children. This variable is available for the years 1988–2011. The question asked of respondents is “How much did you (and your family living there) pay for child care in <year>?.” Fixed effect regression results are presented in Table 4 where each column is a different regression model adding in more control variables. The regression includes only women who have positive labor hours to capture the effect of the intensive margin of labor supply on childcare. Columns (1)–(4) include household fixed effects. Column (1) includes only the number of labor hours and the log of potential household income. The results show a negative effect of increases in women’s labor supply on childcare expenditures, but the results are not significant. State and year fixed effects are added in Column (2). The coefficient on women’s labor hours is positive and significant. As married women increase their hours of work, they spend more money on paid childcare in the market. Next, Column (3) includes the state unemployment rate and other demographic controls. The coefficient on women’s labor hours increases from this addition and remains significant. Finally, including controls for the number of children, the presence of children under 5 years, and an indicator for the woman being pregnant in Column (4),Footnote 14 we see an estimated coefficient of 0.018 on the woman’s labor hours. This means a one hour increase in women’s labor hours, is correlated with a 1.8% increase in annual household expenditures on childcare.
Log of annual childcare expenditures: Married households, husband employed

Sample weights are used. Standard errors are clustered by person ID to account for each individual being present multiple times. *,**,*** indicate significance at the 10%, 5%, and 1% level.
Column (5) excludes the control for men’s hours. The coefficient on women’s hours increases, which means men’s hours are responsible for some increase in expenditures on childcare. Column (6) includes all controls except household fixed effects. The estimated coefficient in Column (6) for women’s labor hours is almost twice as large and suggests that household specific characteristics explain a good deal of the variation in childcare expenditures, likely through preferences for spending time with children. The higher coefficient also indicates that estimates without such controls (as in the ATUS and CEX results shown later in the paper) are likely to be biased upward. The final column, excludes the control for potential household income. The coefficient on women’s hours of work is unchanged, which we attribute to potential income being highly correlated with demographic controls and household fixed effects. The coefficient on hours is not much different between Columns (7) (4).Footnote 15 This conclusion is reinforced in the ATUS results that follow. In this baseline regression from Column (4), we have about 19,000 observations of 4,700 couples with working men and women. We observe the couples in the estimation sample for an average of 4 years, but some couples we observe up to 16 times.
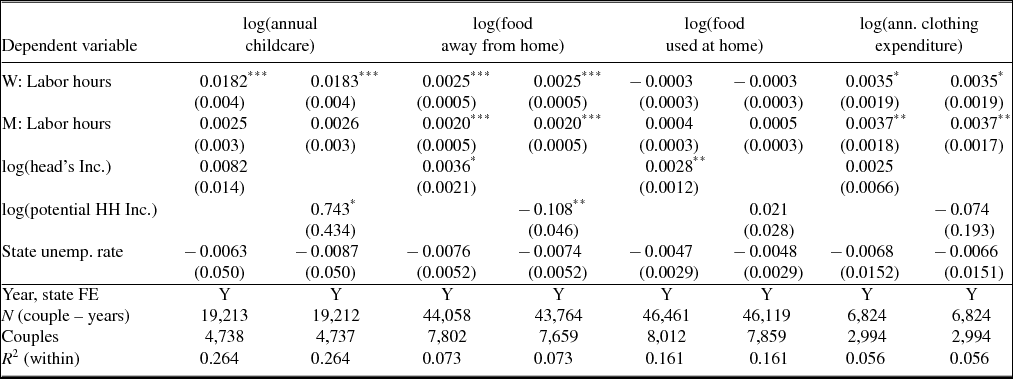
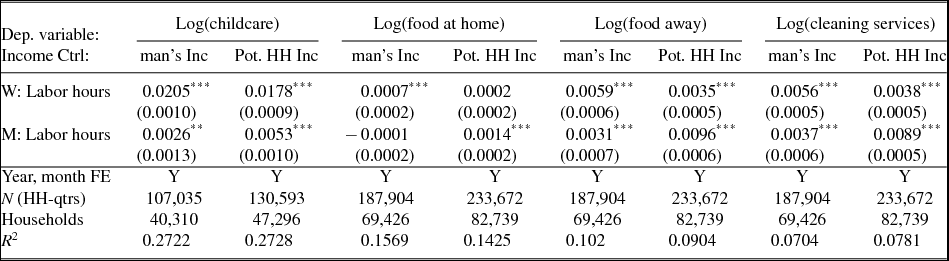
The set of regressions in Table 5 provide results at the intensive margin of labor supply for relevant outcome variables that represent aspects of home production or substitutes for home production that can be purchased in the market. The first four columns represent the effect of labor hours on annual expenditures. A fixed effects regression model is estimated for each outcome variable twice, including the log of the husband’s income and the log of potential household income, respectively, to observe the differences in the variables of interest. A measure of income is included in every regression since changing labor supply also affects the amount of money the household has to spend.
Expenditures for married households, husband employed

Sample weights are used. Standard errors are clustered by person ID to account for each individual being present multiple times. *,**,*** indicate significance at the 10%, 5%, and 1% level.
Table 5 explores two measures of food expenditures: food purchases away from home (restaurant meals, etc.) and food purchased to be used at home. Data on food away from home was collected from 1969–1972, 1974–1987, and 1990–2011 and data on food used at home was collected from 1968–1972, 1974–1987, and 1990–2011. Regardless of the income control, increases in either spouse’s labor hours increases the household’s spending on restaurant meals and other food away from home. For each additional hour, the woman is working, food purchased away from home increases by about 0.3%. Moving to expenditures on food used at home, it is not immediately clear whether this represents home production or a substitute for home production. On one hand, we can imagine that a household where the woman becomes employed and begins purchasing more prepared/quick meals for use at home. However, it is also possible that she could be reducing her amount of food used at home purchases in lieu of more meals out at restaurants with the reduced time available to her. The results show there are lower expenditures with higher labor hours of the woman though this result is not significant.
Survey questions about annual expenditures on clothing were only asked of the respondents in 2005–2011 so there are considerably fewer observations in the final two columns of Table 5. It is ambiguous what the effect on clothing expenditures should be with changes in labor supply. It may be that the woman working more means that she has increased bargaining power in the household and therefore is able to increase expenditures on items of her choosing such as clothing [Lundberg and Pollak (Reference Lundberg and Pollak1993)]. But it could also be the case that if she works more, she has less time with which to shop for clothing. We see a positive effect of the woman’s labor hours on clothing expenditures.
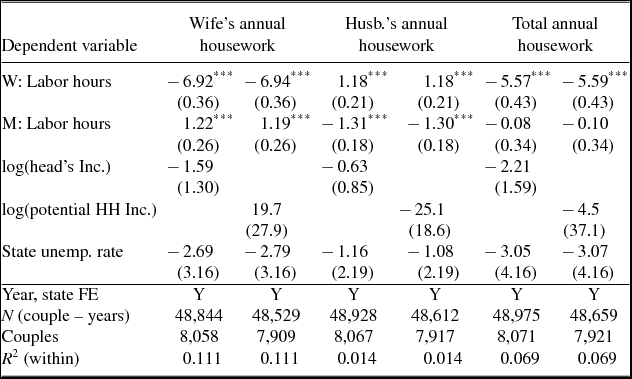
We utilize the limited time use data available in the PSID in which the head of the household and his spouse report their annual hours of housework. Table 6 reports the regression results from three different dependent variables: the woman’s annual housework hours, the man’s annual housework hours, and the total number of housework hours. We can see that higher market hours for a woman are associated with lower housework hours for the woman and higher housework hours for the man. It is interesting to note that when the woman increases her labor market hours, the man does not make up for the full amount of her lost time in the home. A 1 hour increase in the woman’s labor hours is associated with a decrease in housework hours by 6.9 hours per year but her husband’s housework hours only increase by 1.2 hours per year. Conversely, a 1 hour increase in the man’s hours in the labor market is associated with him spending 1.3 fewer hours on housework. The woman almost entirely makes up for this loss of hours and a one unit increase in the man’s labor hours is associated with his wife having 1.2 more annual housework hours. In the final columns, we only see a significant effect on total housework hours when the woman works more. While additional hours of work for the man decrease his own time spent on housework, they also increase the woman’s housework by an almost equal amount. Thus, the effect on total housework hours is effectively zero. The evidence from these regressions suggest that the couples either spend less time cleaning their houses when the woman works more hours, or they are supplementing their loss of housework hours with services purchased in the market.
Time use for married households, husband employed

Sample weights are used. Standard errors are clustered by person ID to account for each individual being present multiple times. *,**,*** indicate significance at the 10%, 5%, and 1% level.
The regression models in Table 7 show the results for the expenditure outcome variables at the extensive margin of female labor supply. This allows us to directly observe differences between one earner and two earner households. As mentioned previously, the definition used for employed is if the individual worked for at least 30 weeks in the previous year.Footnote 16 The sample sizes in these tables are larger since it includes both workers and nonworkers and only about two-thirds of married women work. The first column shows annual household expenditures on childcare services. All else equal, we find that households in which the woman is employed spend about 123.3% more on childcare. If the woman is employed, the expenditures on food away from home are about 10% higher. The coefficient on the woman’s employment status is not significant when moving to the third column for food used at home, even though there was greater average spending on food away from home. Increases in hours of the man increase the expenditures on food used at home which may be evidence of increased specialization in household roles. On the extensive margin of labor supply, we see that if the woman is employed, the household spends almost 9% more on clothing controlling for potential family income.
Expenditures for married households, husband employed

Sample weights are used. Standard errors are clustered by person ID to account for each individual being present multiple times. *,**,*** indicate significance at the 10%, 5%, and 1% level.
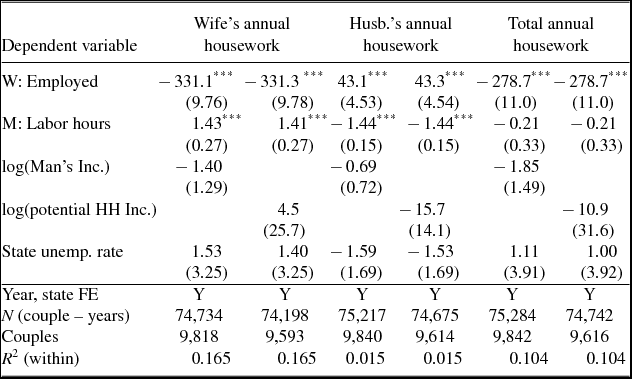
Finally, we show the effect of a women’s employment on housework hours in Table 8. Similar to the results at the intensive margin, we observe that when the woman is employed for at least 30 weeks she spends about 330 fewer hours on housework throughout the year. Conversely, her employment corresponds to an increase in housework hours by the man, but only by 43 hours. In addition, when the woman is employed, total housework hours in the household are 279 hours lower. The effects for select variables are explored in more detail in Section 6.2.
Time use for married households, husband employed

Sample weights are used. Standard errors are clustered by person ID to account for each individual being present multiple times. *,**,*** indicate significance at the 10%, 5%, and 1% level.
Log of annual childcare expenditures: Married households, husband employed

Sample weights are used. Standard errors are clustered by person ID to account for each individual being present multiple times. *,**,*** indicate significance at the 10%, 5%, and 1% level.
6.2. Demographic Analysis of PSID Households
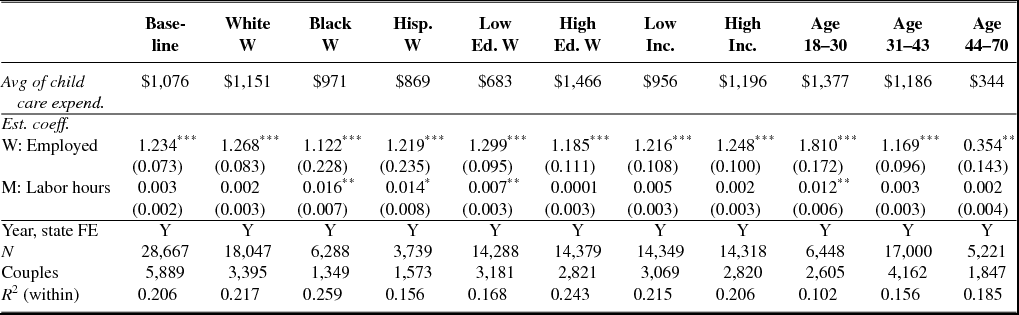
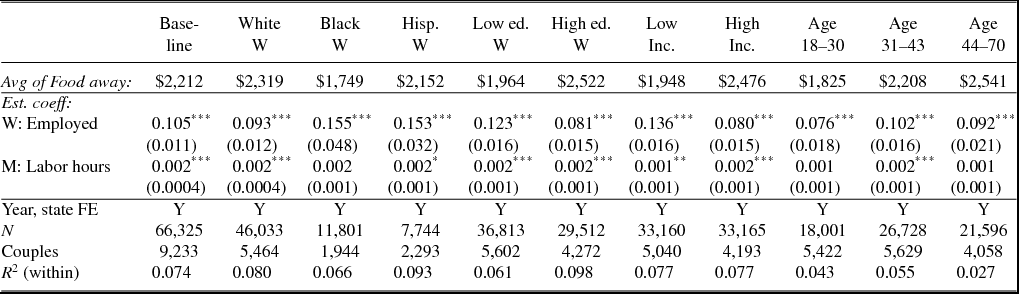
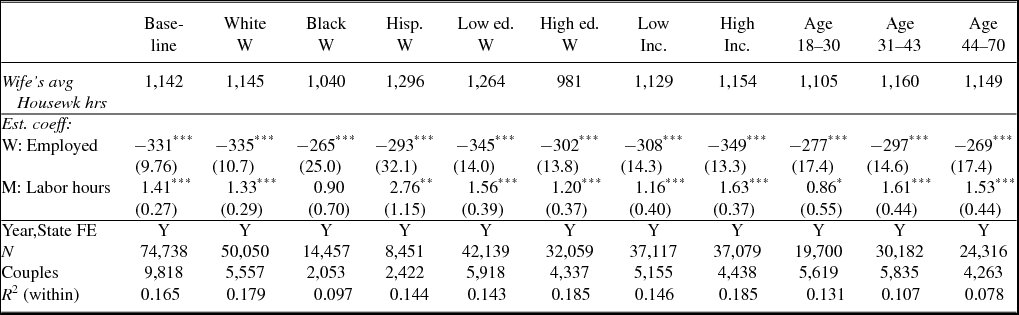
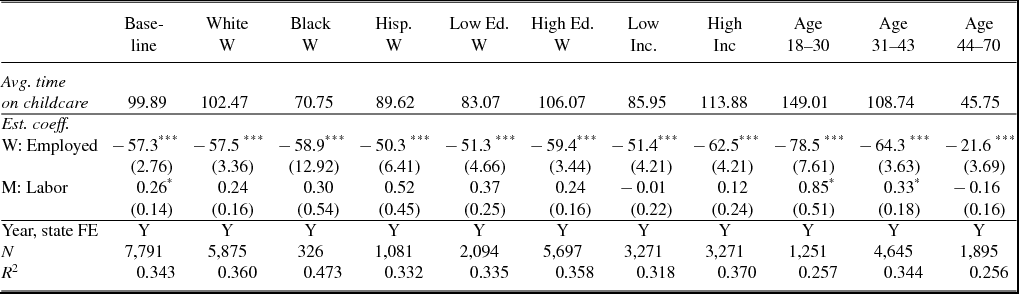
In this section, we explore the differing responses by households in the PSID within various demographic groups. For ease of interpretation, only the extensive margin of women’s labor supply is explored. We control for predicted household income in each of the fixed effects regressions. Each of the following tables shows the baseline regression results for the particular outcome variable in question from Tables 9–11. Then the subsequent columns divide the full sample by various demographic characteristics. We look at households separately by race, education, husband’s income,Footnote 17 and age of the respondent. Low education indicates that the woman has high school or less and high education is some college or more. Low income indicates that the man’s labor income is at or below the sample mean, whereas high income means it is above the sample mean. In addition, the tables show the sample mean for each of the outcome variables. As before, “employed” indicates the woman works for at least 30 weeks in the year. For each demographic group, we additionally report the average expenditure or time spent for each dependent variable.
Table 9 shows the demographic analysis for the log of annual childcare expenditures for those households with children under 18. This shows that on average white and black women spend more money on average for childcare services than Hispanic women. Women with higher education and income spend more on childcare as well and as expected older women spend considerably less. The category where we observe the largest differences in the estimated coefficient for women’s employment is across age groups where the youngest women (ages 18–30) have 181% higher childcare expenditures when employed versus only a 35.4% increase for older women (ages 44–70). This is likely driven by the fact that the younger women have younger children who require additional care. The smallest increase in childcare spending in response to women’s employment comes from black women at 112.2%, while both white and Hispanic women look fairly similar to the baseline results. While less educated women spend quite a bit less per year on paid childcare, those who are working spend about 130% more than those who are not.
Next, we explore annual expenditures on food away from home in Table 10. The expenditures on food away from home are fairly consistent across all demographic groups, with notable exceptions being that households with Black women spend the lowest at $1,749 and households where the woman is older (44–70) spend the most at $2,541. Looking at the estimation results, black and Hispanic women who are employed spend on average 15.5% and 15.3% more, respectively, on food away from home compared to women who are not employed. On the other hand, white women who are employed only spend 9% more. As with childcare, despite the fact that low income/education women spend about $500 less per year on food purchased away from home, both of these groups also respond substantially more when working than their high income/education counterparts. Since the average married woman with a high-school degree or less education spends $1,964 on food away from home, this suggests that the average low education woman that begins working will spend 12.3% more (or $242) on food away from home. Similarly for highly educated women: the average woman when employed will spend 2522*0.081 =$204 more. So while the size of their increases in spending are similar ($240 compared to $200), given the initial differences in their average spending the effect for less educated women is much larger.
Log of food away from home: Married households, husband employed

Sample weights are used. Standard errors are clustered by person ID to account for each individual being present multiple times. *,**,*** indicate significance at the 10%, 5%, and 1% level.
The next table explores the annual housework hours of the woman in the household. Women spend significantly more time on housework than men, with an average of 1,142 hours annually across all groups. Those with the fewest hours of housework are black women, those with higher education, and the youngest women 30 and under. The differences across ages in part may be explained by the fertility among these groups. Since the middle age group has the most children under 18 living in the home, they may have to do more housework. Women 44 years old and older may have children moving out of the house, thus reducing the time needed for housework. Recall that in the full sample, we observed that when the woman was employed her hours spent on housework were lower and her husband’s were slightly higher, though they did not increase enough to fully make up for the lost time. In Table 11, we see that on average women who work spend 331 fewer hours per year on housework. Among black and Hispanic women, this reduction in housework hours is only 265 and 293, respectively. We also see that the youngest women and the oldest women have smaller reductions in housework hours, though they also work fewer hours in the home overall compared to women ages 31–43. The largest response in housework hours when the woman is employed is for women with high levels of income who reduce their annual housework hours by nearly 350 hours on average. Interestingly, for housework, we do not see similar trends for high income and high education women as we did in the previous two tables. Instead, while women whose husbands earn a high level of income have a large decrease in housework hours when becoming employed, highly educated women have a smaller than average decrease in housework hours at 302 when employed. This may be due to the underlying differences in the propensity to work for these different groups. While 63% of women with highly paid husbands work, about 74% of the highly educated married women are employed. This is by far the highest rate of employment for women among any of the demographic subgroups.
Wife’s annual housework hours: Married households, husband employed

Sample weights are used. Standard errors are clustered by person ID to account for each individual being present multiple times. *,**,*** indicate significance at the 10%, 5%, and 1% level.
Overall, many of the differences across demographic groups are for those in different age groups. These differences can likely be explained by each household being at a different point in their life-cycle: having children, caring for young children, and finally the children leaving the home. In addition, we see different responses by race which could be due to cultural differences in expenditures and home production.
6.3. Evidence from the American Time Use Survey
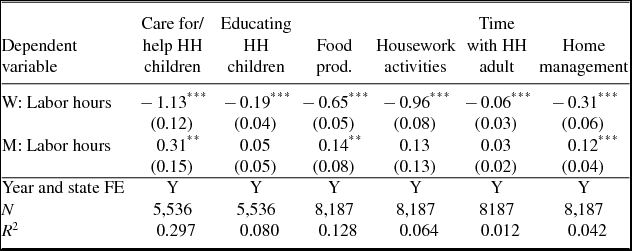
The goal of this section is to understand the relationship between a woman’s labor supply, on both the extensive and intensive margin, and time spent in home production activities. Most home production activities have close market substitutes, so married women are likely to reduce their time spent in these activities (time spent caring for children, time spent caring for adults, and household management, time spent on food preparation) and replace them with purchased market goods (daycare services, nursing home expenditures, financial services, and food at restaurants or prepackaged meals) when they enter the labor market.
One specific concern for the ATUS is that the sample of households where the woman is working may not be a random sample. There may be some unobservable characteristics correlated with both labor supply and time spent on various household activities that we are unable to control for in the regression. Selection is still a concern in the analysis using the PSID data, but the panel nature of the data allows for household fixed effects to mitigate the issue. Given that the ATUS data is a repeated cross section, we cannot do the same here. In this section, the definition of employment for women is if she was employed at the time of the interview since the time use data were for the week of the interview.
The regression results are shown in Tables 12 and 13 for six time use outcome variables that are relevant to home production activities. At the intensive margin, we see a negative and significant coefficient on the woman’s labor hours for all of the estimated coefficients. In particular, there is strong evidence that an additional hour per week in the market on average is correlated with less time on childcare, food preparation and cleanup and housework for married women whose husbands are working. A 1 hour increase in average weekly work hours for a woman is correlated with a decrease of time spent caring for children of 1.13 minutes per day (or about 7.84 minutes per week). Similarly, a 1 hour increase in average weekly work hours for a woman is correlated with a decrease of time spent preparing food by 0.65 minutes per day and time spent on housework by 0.96 minutes per day. On average, women spend more time on home production activities if there is an increase in the average weekly hours of work of their husbands. The intuition for this is simple. If men work fewer hours in the market, they are able to share some of the responsibility for primary home production activities.
Woman’s time use for married households, husband employed

Sample weights are used. Robust standard errors are in parentheses. *,**,*** indicate significance at the 10%, 5%, and 1% level. Coefficients are measured in minutes per day.
Woman’s time use for married households, husband employed

Sample weights are used. Robust standard errors are in parentheses. *,**,*** indicate significance at the 10%, 5%, and 1% level. Coefficients are measured in minutes per day.
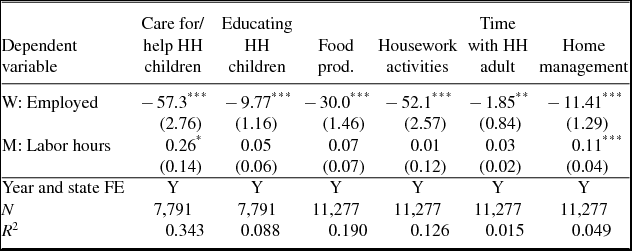
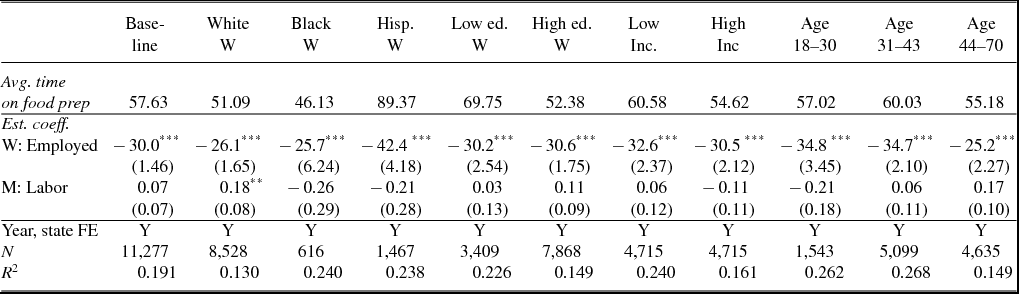
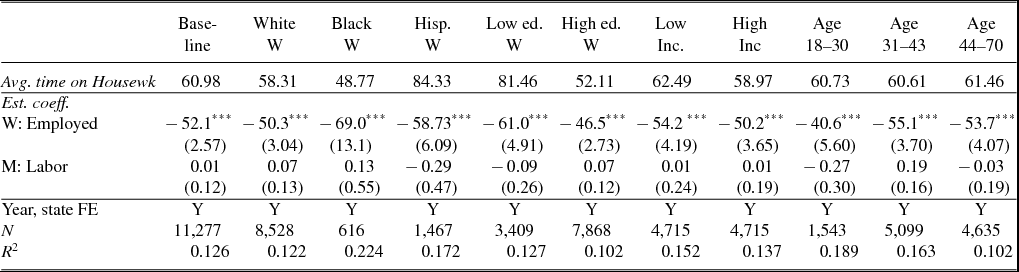
At the extensive margin, Table 13 explores the same six time use variables and finds similar results. Working women spend less time on average on all home production activities compared to nonworking women. Women in two earner households spend on average 57 minutes less per day caring for household children, 30 minutes less per day on food production, and 52 minutes less per day on housework holding all other observables that affect time-use constant. Employed women also spend less time on the education of household children, with household adults, and on home management. On average, employed women spend about 10, 2, and 11 minutes per day less on these activities compared to women who are not working. Unlike helping household children, food preparation, and housework, the other time use categories take up a smaller fraction of a woman’s time. Therefore, it is not expected that the coefficient on the woman’s employment would be as large in magnitude.
6.4. Evidence from the Consumer Expenditure Survey
Given the somewhat vague nature of the expenditure categories surveyed in the PSID, we additionally analyze married households from the CEX. The CEX has several advantages in its expenditure variables over the PSID. First, the detailed expenditure categories allow us to focus on very specific consumption purchases that are likely substitutes for home production activities. In addition, the survey is administered quarterly which requires respondents to recall their purchases over the past three months. This means that respondents are likely to have a more accurate measure of their expenditures, compared to the PSID which asks people to recall over the past year. However, we do lose the ability to use household fixed effects to address the problem of selection in labor force participation. A woman is employed if she is employed on the day of the interview. Included in these OLS regressions are many of the same demographic controls as the other surveys: age, race, education of both spouses, the number/age of children, etc.Footnote 18
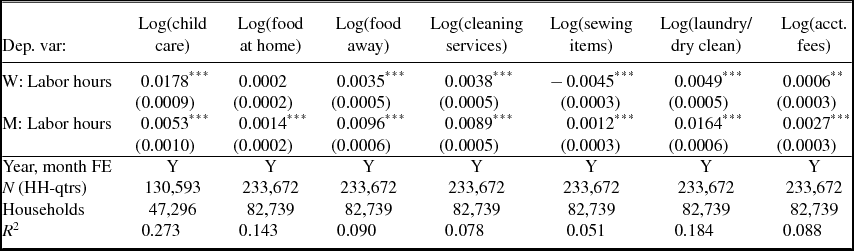
Table 14 shows the effect of the number of labor hours per week on seven different expenditure categories: childcare services, food used at home, food away from home, cleaning services, sewing supplies (for clothing), laundry and dry cleaning, and fees for accounting services. These categories are chosen as items that would be close substitutes for home production activities, with the exception of sewing supplies which would be an input for home production. The first three columns are expenditures that are directly comparable to the analysis from the PSID.
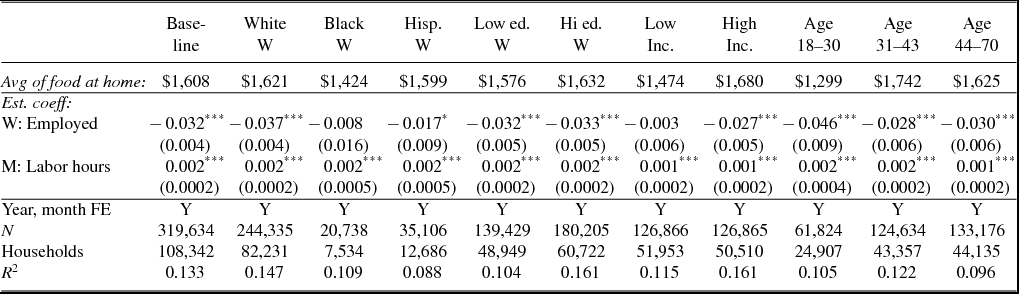
Looking at expenditures on childcare, we see that these purchases are on average 1.78% higher for each additional hour the woman works in the labor force. This estimate is very close to the estimate from the fixed effects model in Table 5 of 1.8% higher expenditures annually for each additional hour of work. When we analyzed food used at home in the PSID, we did not find a significant effect of women’s labor supply in any direction and found similar results at the intensive margin for women who are working in the CEX as well. Using the detailed expenditure categories in the CEX, we are able to construct a more specific measure for this variable. Included in “Food at Home” is purchases of food and nonalcoholic beverages at grocery/convenience/specialty stores. “Food Away” represents food purchases to be consumed outside of the home. Included in this category is food and nonalcoholic beverages at restaurants, school meals purchased for children, and purchases for catered affairs. For each additional hour the woman works per week, the expenditures on food away from home increase by 0.35% on average.
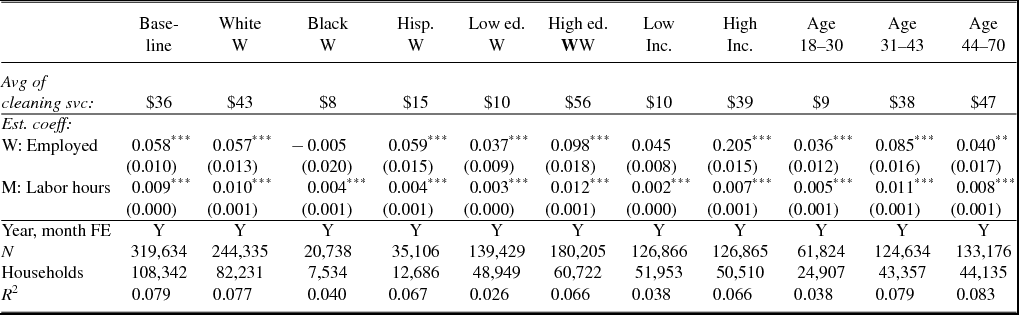
Next, we look at purchased cleaning services such as housekeepers or maids. This represents the market substitute for housework hours explored in the PSID and ATUS data. Just as we saw that time spent on housework decreased when the woman worked additional hours, the expenditures on cleaning services increase. Though the data come from different surveys, this is suggestive that households may be replacing time spent cleaning their own houses with services purchased in the market. The effect on purchases of sewing items is included as an interesting case. Similar to food used at home, this would be an input to home production. Consider that, households have the choice between spending time in home production and hemming their own pants, or they can pay for this service in the market. We find that purchases of sewing items decreases as the woman works more hours. Contrasting this, we look at expenditures on noncoin operated laundry and dry cleaning services. The households spend on average 0.49% more on dry cleaning for each hour that the woman is employed. This could be evidence of replacing doing your own laundry at home; however, it also could be that working women just have more clothing that needs to be dry cleaned. The final expenditure category that we explore is fees for accounting services: a household can do their own taxes at the end of the year, or they can choose to pay someone to complete their taxes for them. Comparing this to the ATUS data, this expenditure category would correspond to “Home Management” activities which includes financial activities for the household. When the woman works more in the market sector, expenditures on accounting services are higher.
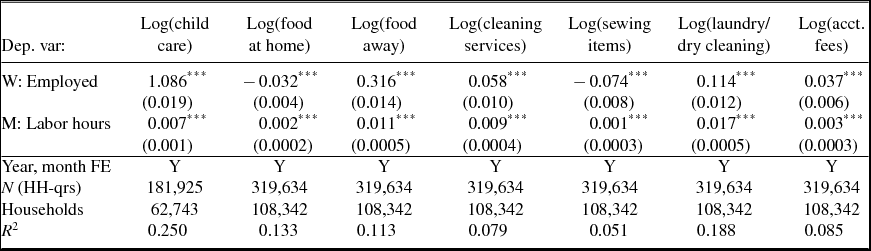
The effect of women’s employment at the extensive margin of labor supply for the CEX variables is explored in Table 15. In the CEX data, the definition of “employed” is if the woman was working at the date of the interview. As expected, for all expenditures, the more hours the man works, the more each good/service is purchased by the household. We see similar, larger effects of the woman being employed for all of the expenditure categories compared to Table 14. In addition, at the extensive margin, we now see that compared to women who do not work, married women spend about 3.2% less on food used at home.
Expenditures of married households in the CEX: Husband employed

Sample weights are used. Standard errors are clustered by household ID to account for each individual being present multiple times. *,**,*** indicate significance at the 10%, 5%, and 1% level.
Expenditures of married households in the CEX: Husband employed

Sample weights are used. Standard errors are clustered by household ID to account for each individual being present multiple times. *,**,*** indicate significance at the 10%, 5%, and 1% level.
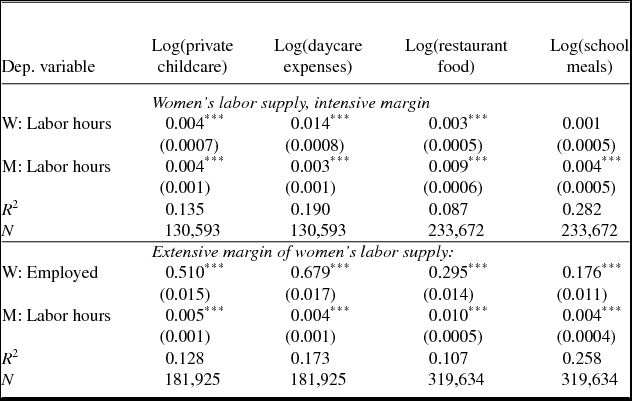
The CEX has very detailed expenditure information for the households in the survey, so we are able to focus more specifically on how different types of households spend their money. A few select categories of interest are shown in Table 16. First, we breakdown the expenditures on childcare into private childcare (such as babysitting or other care for children in your home or someone else’s home) and paid daycare services. Both of the estimated coefficients are positive and significant; however, we see a larger coefficient on paid daycare services. Note that in the CEX, these expenditures do not necessarily need to be payments to legitimate businesses, but also could be casual payments to a babysitter. This would fit with the idea that households where the woman is working must replace the lost time caring for their children somehow. While some households may pay for day to day care in the home, babysitting services are also likely purchased by couples going out to dinner, the movies, etc. Purchases of daycare services are more clearly a replacement for day to day care of their children. The last two columns go into greater detail on the source of expenditures on food away from home. We look at the effect of women’s employment on food purchased at restaurants, as well as meals purchased at school for children. So, we might think that a working mother is more likely to have her child buy lunch at school instead of packing a lunch to send with her kids. We find a larger effect on food purchased at restaurants, and when the woman is working these expenditures are on average 30% higher.
Detailed expenditure categories, married households: Husband employed

Sample weights are used. Standard errors are clustered by household ID to account for each individual being present multiple times. *,**,*** indicate significance at the 10%, 5%, and 1% level.
6.5. Interactions Between the Labor Supply of Men and Women
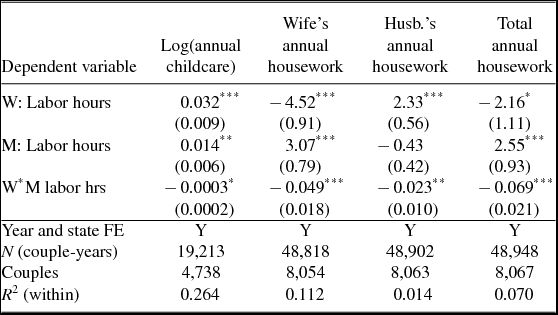
While the previous results have provided evidence that working women are substituting away from home production activities toward purchased services, thus far we have only analyzed the case where the husband is working. In addition, there has been only limited discussion of how the interaction of their employment choices affects these household decisions. First, using evidence from the PSID, we explore how the interaction of men’s and women’s work hours affects their expenditure and time use in Table 17.
PSID: Interaction of men’s and women’s hours

Sample weights are used. Standard errors are clustered by household ID to account for each individual being present multiple times. *,**,*** indicate significance at the 10%, 5%, and 1% level.
Table 17 shows fixed effects regression results for four outcome variables when including this interaction term. First, for child care, we now observe a positive significant effect of men’s hours on expenditures. While a significant, positive coefficient was estimated for men’s labor hours, the magnitude is about half as large as it is for women. The interaction term for men’s hours times women’s hours is negative and significant at the 10% level. This suggests that the more hours the husband is working, there is a smaller response on childcare expenditures from an additional hour of work for the wife. The converse is also true, the positive effect of the man’s work hours on childcare spending is declining the more the woman is working. This result means that a household likely faces a large initial cost of enrolling their child(ren) in a daycare program, but after enrollment, there is likely a relatively small marginal cost of adding another hour of care if they decide to work an additional hour. This hypothesis is supported in the data as we observe that the more hours either spouse is working, the more likely it is that the household has any childcare expenditures. Only 20% of married households with nonworking women pay for any childcare and this percentage increases to 33% and 45% for part-time and full-time working women, respectively.
The next three columns look at how the interaction of husbands’ and wives’ working hours affect how much time each spends on housework activities. In all cases, we see negative interaction terms. So, when a woman works, she spends less time on housework, and this effect only grows the more hours her husband is working. The effect is similar for men’s work hours and housework hours. In addition, we observed that both men and women work more in the household when their spouses work additional hours. Given the negative interaction terms, this effect is also declining the more the spouse is working. This could be because if both spouses are working more, they can more easily afford market substitutes for housework. Finally, the results on total housework provide interesting insight into the complex relationship. For women, additional hours of work mean less overall housework is done and this effect is only increasing the more her husband is working. The coefficient on men’s work hours is positive however, suggesting that at lower levels of women’s employment, more housework is done overall. Given the magnitudes of these coefficients, the effect will switch to negative once the wife works about 36 hours per week. At that point, additional hours of work for the man will also decrease overall housework. This could be evidence that households where the woman only works part time have more traditional gender roles.
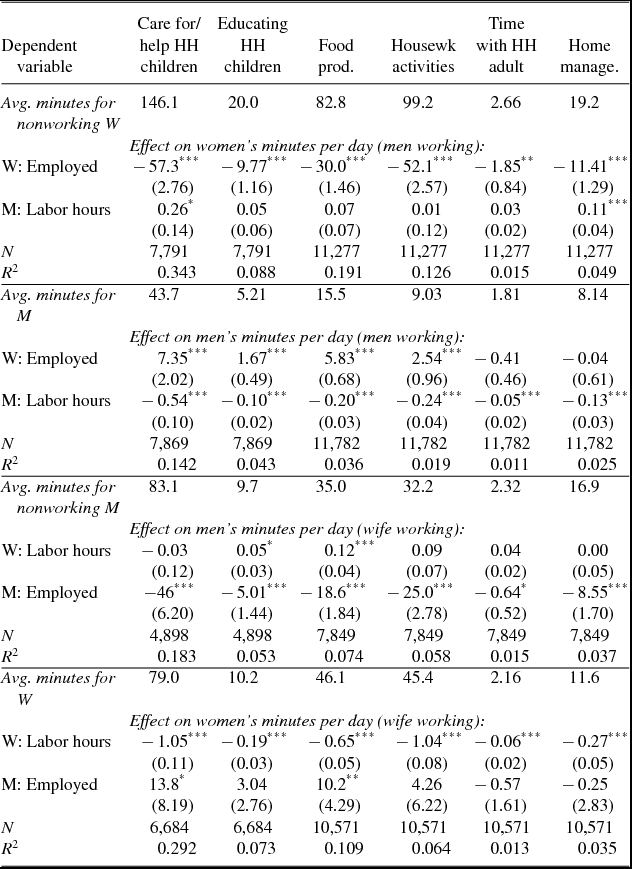
Next, Table 18 explores how employment of either spouse affects the time they spend on various home production activities in the ATUS. Four different cases are considered: (1) the effect of a woman’s employment on her own time use when her husband is working, (2) how a wife’s employment affects her employed husband’s time use, (3) the effect of a man’s employment on his own time use when his wife is employed, and (4) the effect of a man’s employment on his wife’s time use when she is working. To compare the size of the estimated effects, the average minutes spent on each home production activity for the relevant group is shown.
ATUS: Effect of men’s and women’s employment on home production

Sample weights are used. Robust standard errors are in parentheses. *,**,*** indicate significance at the 10%, 5%, and 1% level. Coefficients are measured in minutes per day.
The first set of regressions are how the wife’s employment affects her time use for women with working husbands. Thus, the average minutes in each category are for all nonworking married women. So for example, nonworking women spend about 146 minutes per day caring for their children, but when women are employed this time is reduced by about 57 minutes per day. In all categories, we observe that women who work spend less time on home production activities. To see the degree to which men are making up for this lost time in home production when women work, we use the next set of regressions to see how a woman’s employment affects her husband’s time use. This second set of regressions are for working men, and we observe that for childcare, educating children, food production, and housework, men increase their time spent on these activities when their wives are employed. However, in every instance, the man does not fully make up for the lost time in home production of the woman. So, we observed that working women spent 57 minutes less per day caring for their children, and men with employed wives spend only 7.35 additional minutes per day caring for their children. Likewise, employed women spend 30 minutes less on food preparation and men with employed wives spend only six additional minutes on this activity. Thus, we can see for these activities, the household is either needing to supplement the production of these activities with purchased services, improving the efficiency of their time spent on home production, or just consume less of these activities.
We observe similar effects of men’s employment on both spouse’s time use. As with women, men who are employed (with working wives) spend less time on all home production activities compared to nonworking men. Nonworking men spend considerably less time on all home production activities compared to nonworking women. So while nonworking women spend 146 minutes per day on childcare, nonworking men only spend 83 minutes. For childcare, the size of the effect of men’s employment is similar to working women with a reduction of 46 fewer minutes. Thus, in percentage terms the reduction in men’s time due to employment is larger than for married women. The same is true in nearly all categories of home production. Finally, the last set of regressions show how a man’s employment affects the time his employed wife spends on home production. Again, women in part make up the lost time from men’s home production but not entirely: working men spend 46 fewer minutes caring for children but the man being employed increases the woman’s time on childcare by only 14 minutes. Women make up a large part of the lost time from their husband’s employment in food production, but in other cases, such as housework, there is no significant effect of the husband’s employment on his wife’s time use.
7. CONCLUSIONS AND FUTURE WORK
This paper explored how a woman’s labor supply impacts household time use and expenditure decisions for married households. We quantified the extent to which employed women substitute away from home produced goods and services to market produced goods. Using three different data sources, we found that the micro-level evidence is consistent with home production theory. Compared to other parts of the literature, the combination of these different surveys provides a comprehensive look at both sides of the home production/market production decision for households. We are able to explore both the time spent on household activities as well as observe how households spend their money. We find that expenditures on market goods with close home production substitutes are higher and home production times lower for families in which the woman is employed.
Data from the PSID allowed us to control for selection bias with respect to the employment decisions of the woman by including household fixed effects. These data showed that households where the woman works have higher expenditures on paid childcare and food away from home (market substitutes for home production) and lower expenditures for food used at home (potentially a measure of home production). In addition, women who are employed for more hours report fewer annual hours of housework in the PSID.
Next, the ATUS gave us detailed time use information about a number of households surveyed in the CPS. We looked at married households and explored the differences in time spent on various activities related to home production between households where the woman is and is not employed. However, these data are a series of repeated cross-sections which exhibit the same problems with selection bias previously mentioned. The potential presence of selection does not negate our findings that women who are employed spend less time on food preparation, care of their children, and housework compared to women who are not employed. The lower time use on home production categories and the higher expenditures on their close market substitutes provide insight into the types of home production activities that are replaced with purchased market goods and services when women enter the labor market.
Using information from the CEX, we were able to delve deeper into the specifics of what households spend their earnings on. With the detailed expenditure categories, we analyzed summary variables that contained only those items that were determined to be good substitutes for home production. Households where the woman is employed spend more of their income on childcare, food away from home, cleaning services, laundry and dry cleaning, and accounting services. On the other hand, when looking at categories that are inputs to home production, households where the woman is working spend less on food used at home and on sewing materials for clothing.
Finally, the relationship between men’s and women’s labor supply was explored. Men and women exhibited very different responses in terms of the expenditures and time use due to an additional hour of work. In general, the response of men was much smaller, perhaps because of traditional divisions of labor in the household since it was observed that men spent considerably less time on all home production activities, even when controlling for employment. Using the ATUS data, we examined how men respond in their time use when their wives are employed, and vice versa. For both spouses, being employed is correlated with a reduction in time spent on each activity. Across all categories, men increase their time spent on home production when his wife is employed, but only make up for a portion of her loss of time. Similar results are observed for women whose husbands are employed.
One common theme across these surveys was the fact that the largest magnitude of effects was observed for childcare. We believe this is due to the uniqueness of caring for children as one home production activity. While working women can still cook dinner at home, clean their houses, etc.[perhaps by sacrificing leisure as Nickols and Fox (Reference Nickols and Fox1983) suggest], they cannot care for their children during the hours that they are at work. However, for younger children especially, the same number of hours of care must still be provided in some way. If you do not have relatives or other unpaid options to providing this care, households will likely need to purchase childcare services. Thus, it is unsurprising that we observe such large effects on childcare expenditures and time use for working women.
We provided evidence to support models of time allocation of the household; however, there are still areas of improvement which have been left for future work. The authors used a measure of potential household income to control for differences in income across households who have already made their labor supply decisions. In addition, we used household fixed effects in the PSID to control for unobserved heterogeneity across households; however, there is likely still selection bias in the labor supply decisions of women that is not full accounted for. In particular, it would be ideal to be able to find an instrument for female labor supply to solidify the results.
APPENDICES A: ADDITIONAL ANALYSIS OF PSID HOUSEHOLDS
Table A.1 includes the full specification of all regression models using PSID households.
B: INCOME CONTROLS: MEN’S INCOME VS. PREDICTED POTENTIAL FULL-TIME EARNINGS
This section provides additional detail about the procedure used in generating the full-time potential income of households. We use similar methods to Garfinkel et al. (Reference Garfinkel, Haveman and Betson1978), with a Heckman (Reference Heckman1979) correction for selection in the decision of women whether or not to work. We estimate potential income for the household separately by gender and race.
Women: For the women in the sample, there is a two-stage process to estimate potential full-time income. Using a probit model, we predict the employment status for women controlling for the man’s age, education, and fertility variables for the household. We do this separately for women who are white, black, Hispanic, and other races. From this first-stage regression, we generate the inverse Mills ratio for each individual as in Heckman (Reference Heckman1979). The second-stage procedure is then to predict the log of women’s income with the following regressors: inverse Mills ratio, age and education of the woman, fertility variables, region dummy variables, weeks and hours worked for the woman, and time fixed effects. This is also performed separately for each race group. We finally predict what the log of earnings would be if the woman worked 40 hours per week for 50 weeks per year.
Log of annual childcare expenditures: Married households, husband employed

Men: Since all of the men included in the sample are employed, and married men have extremely high rates of employment, we do not use the Heckman selection correction. The procedure for predicting the man’s potential full-time income is the same as for the woman, excluding the inverse Mills ratio as a regressor. This estimate is then added to the potential income of the woman to create Potential Household Income.
The results in Table B.1 show a selected number of variables with the two different income controls. Since the CEX and ATUS do not use a fixed effect model, we could reasonably expect that the different income controls might be more important in these regressions. We do see larger changes in the estimated coefficients in the CEX regressions than in the PSID. However, despite the fact that the coefficients are smaller, they are still very significant with the inclusion of the potential household earnings.
Expenditures of married households in the CEX: Husband employed

C: DEMOGRAPHIC ANALYSIS OF THE ATUS AND CEX
Below are additional demographic analysis tables for selected outcome variables from the ATUS and CEX surveys. Additional tables of demographic analysis with all outcomes presented from any of the three surveys are available on request. In this subsection, we present a more complete demographic analysis of the ATUS. We predict the effect of women’s employment on time-use categories for different subgroups of the sample. The subsamples are created using categories of race, education, age, and man’s earnings.
Table C.1 shows the regressions for time spent caring for and helping household children for married women where the husband in the household is employed. White and Hispanic married women spend more time on average caring for their children than do black women; however, employed women in all races spend about 50–60 minutes less per day on childcare than nonworking married women. There are also large differences in average time spent caring for children between low-educated and high-educated women, which is consistent with existing literature. On average, women with a college degree or more spend about 23 more minutes per day on childcare than women with less education. Within each education group, women who work spend less time on childcare than women who do not work, by about 50 and 60 minutes, for low-educated and high-educated women, respectively. Breaking groups up by husband’s earnings produces similar results. Women whose husbands earn lower than the median age-standardized income spend less time with the children on average than women whose husbands earn greater than the median age-standardized income. Age appears to be an important determinant for average time spent on childcare for household children. Women of child-bearing age, which are those in the youngest two age group categories, spend more time taking care of children than those who are not of child-bearing age. Women who are employed and of child bearing age spend about 1 hour per day less time caring for their children than those who are not employed. Employed women over the age of 44 only spend about 21 minutes less per day caring for household children.
Average time spent on food preparation and presentation does not show much variation within the subcategories of age and income. White women and black women spend around 50 minutes per day on food preparation and presentation, but Hispanic women on average spend an additional 40 minutes per day. The difference in time use between women who are employed and not employed is greater for Hispanics than for white and black respondents. Education also plays a role in time spent on food preparation. Women with a high-school education or less spend on average 17 more minutes per day on food preparation and presentation compared to those with higher education. The difference between employed women and women who are not working is consistent between these groups, with women who are employed spending about 30 minutes less time preparing meals than women who are not employed. While the time spent on food preparation is about the same across the different age groups in the sample, when employed the oldest age group has the smallest reduction in time at 25 fewer minutes per day.
The average time women with an employed husband spend on housework is presented in Table C.3. Average time spent on housework by the married woman does not vary much by age or income group, but differs by race and education. Similar to food preparation, Hispanics spend the largest amount of time on housework compared to other races. White, black, and Hispanic women spend about 58, 49, and 84 minutes per day on housework, respectively. Black women only spend 49 minutes per day on housework on average, but employed black women spend over 1 hour less per day on housework compared to black women who are not employed. The difference between employed and not employed women is larger for those who have only achieved high-school education or less.
Time spent caring for household children: Married households, husband employed

Time spent on food preparation: Married households, husband employed

Time spent on housework: Married households, husband employed

The findings from the ATUS corroborate the findings from the PSID and the consistency between the findings offers support for the conjecture that married working women replace home produced services with market purchased goods when they enter the labor market. Childcare expenditures are higher in married two earner households and women in married two earner households spend less time taking care of their children. Food expenditures away from the home are also higher for married households in which the woman spouse is employed compared to married households in which the woman is not employed. Hours spent on food preparation and clean up are also lower for married households with working women. In the PSID, we see that households where the woman is employed spend more on food away from home. Expenditures on food purchased to be used at home is not significantly different between employed and not-employed women, but it is unclear the direction this should take. If employed women purchase more ready-made or prepared meals instead of the components used to make meals expenditures on food at home may not be different or may be higher if there is a premium paid for prepared meals.
Finally, we examine differences across demographic groups among the CEX households by race, education, income, and age of the woman in the household. Since childcare and food away from home overlap with the PSID and generate similar results, they are excluded here. In this section, we will examine expenditures on food used at home and cleaning services.
Across most of the demographic groups, we can see that expenditures on food used at home is consistently around $1,500–1,700 in Table C.4. One major exception is that the youngest households, where the woman is between 18–30 spend significantly less. On average, households where the woman is working spend 3.2% less on food for use at home. This translates to a decrease of about $52 per quarter. We see some groups with a larger response, such as those households where the woman is 18–30 or 31–43. On the other hand, we do not see an effect on expenditures on food from grocery stores for black women, or lower income households.
While relatively few households spend money on cleaning services in the CEX (about 7% of all households), it is an interesting expenditure category to explore because it is a clear substitute to home production, specifically home production typically performed by the woman. We saw in the PSID data that men only spent about 1/4 the amount of time that women do on housework at only a few hours per week (which could have included activities such as landscaping, repairs, etc.). If the measure of time use could have been more specific to household cleaning, the differences are likely to be even more stark. In Table C.5, we see that in particular high education/income households have very large increases of 9.8–20.5% in their expenditures on cleaning services when the woman is employed. In addition, while the very youngest and oldest households increase their consumption of cleaning services by only a small amount, those households with women ages 31–43 have on average 8.6% higher expenditures.
Expenditures on food used at home, married households: Husband employed

Expenditures on cleaning services, married households: Husband employed