1. Introduction
Abstractive summarization is the task of creating a short, accurate, informative, and fluent summary from a longer text document. It attempts to reproduce the semantics and topics of original text by paraphrasing. Recently, sequence to sequence models (Rush et al. Reference Rush, Chopra and Weston2015; Chopra et al. Reference Chopra, Auli and Rush2016; Nallapati et al. Reference Nallapati, Zhou, dos Santos, Gülçehre and Xiang2016; See et al. 2017; Paulus et al. Reference Paulus, Xiong and Socher2018) have made great progress on abstractive summarization. A recent study (Bai et al. Reference Bai, Kolter and Koltun2018) suggests that, without additional, complicated structures or features, convolutional sequence to sequence (CNN seq2seq) models (Gehring et al. Reference Gehring, Auli, Grangier, Yarats and Dauphin2017; Fan et al. Reference Fan, Grangier and Auli2018; Liu et al. Reference Liu, Luo and Zhu2018) are more effective and can be trained much faster due to their intrinsic parallel nature compared to recurrent neural networks (RNNs). Furthermore, unlike RNN-based models, the convolutional models have more stable gradients because of their backpropagation paths. Self-attention-based model is the basis of many recent state-of-the-art (SOTA) systems, which always need multi-layer self-attention and have greater computational complexity than CNN seq2seq models (Vaswani et al. Reference Vaswani, Bengio, Brevdo, Chollet, Gomez, Gouws, Jones, Kaiser, Kalchbrenner, Parmar, Sepassi, Shazeer and Uszkoreit2018). Thus, we take CNN seq2seq models as the target model to improve on and compare with in this paper.
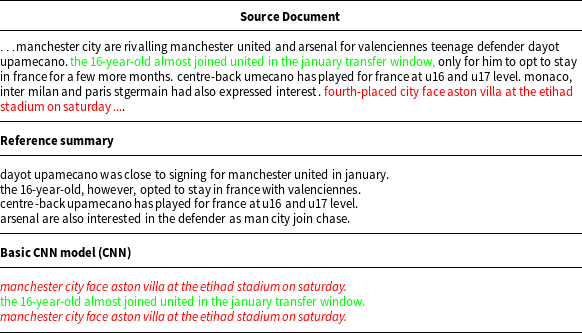
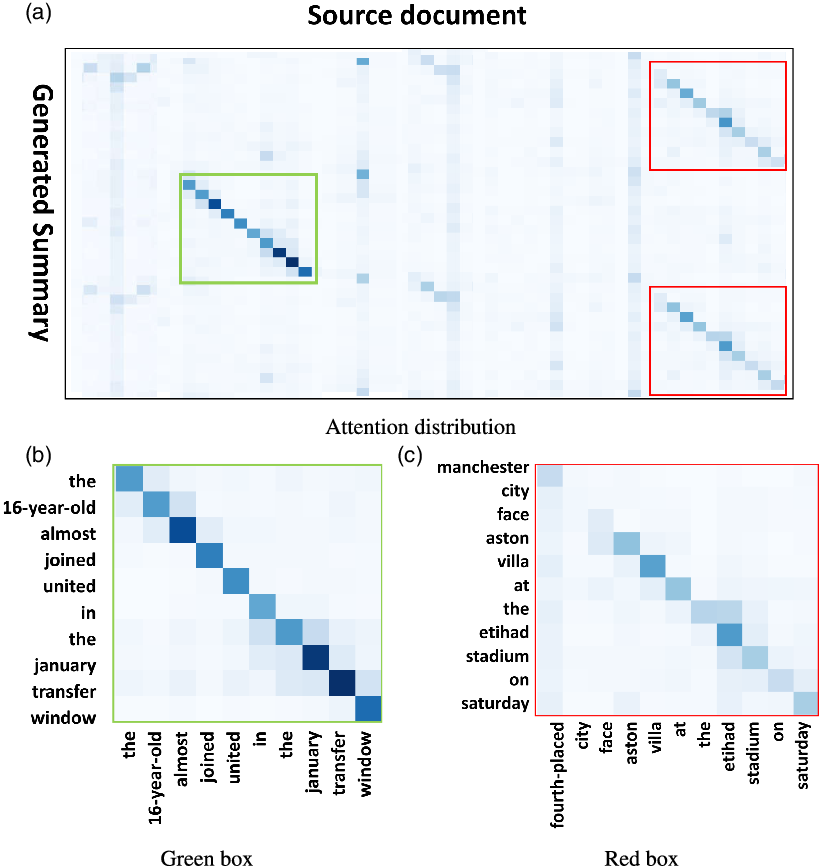
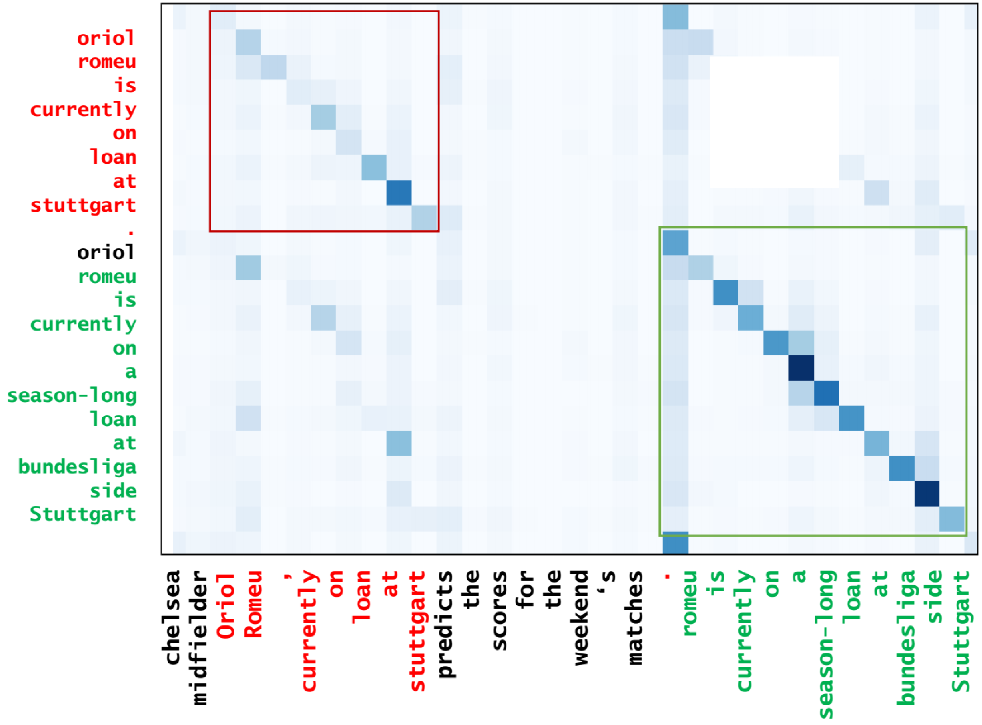
Unfortunately, just like RNN-based models, CNN-based models also produce summaries with substantial repeated word sequences which impacts the reading efficiency. Table 1 illustrates one test case from the CNN/Daily Mail summarization dataset. In this case, the basic CNN produces two identical sentences (italicized) in the result. Unlike machine translation or paraphrasing in which the output words and input words are almost one-to-one aligned, the output of summarization is “compressed” from the input document. Naturally, every sentence or word sequence in the summary corresponds to one or more places in the source document. If there were two identical word sequences in the summary, they might be looking at and summarizing the same “spots” in the source. This is evident from the attention map for the three sentences generated by CNN, shown in Figure 1. The first and third sentences attend to the same location in the source (red boxes), while the second sentence attends to another separate location in the source (green box). The two attention maps in the red boxes are very similar.
Summary generated by the basic CNN model. The parts of source document and summary in the same color denote that they are aligned by the CNN

Attention for example on CNN model in Table 1.

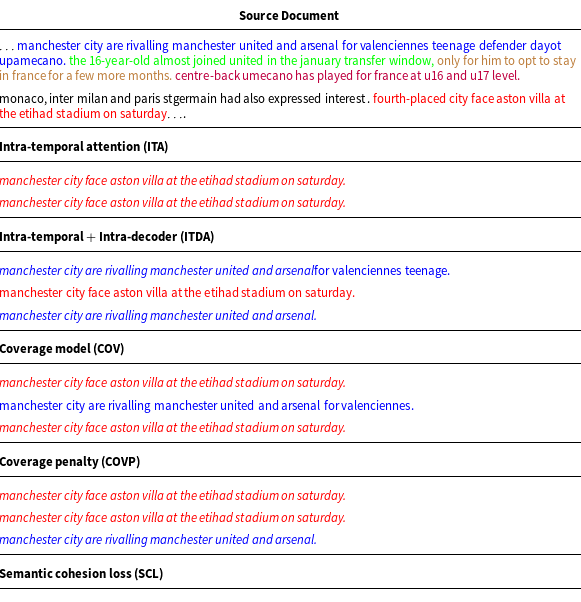
Driven by this intuition, a few efforts have been made on “remembering” what has been focused on before at decoding. For example, Paulus et al. (Reference Paulus, Xiong and Socher2018) and Fan et al. (Reference Fan, Grangier and Auli2018) use intra-temporal attention (Nallapati et al. Reference Nallapati, Zhou, dos Santos, Gülçehre and Xiang2016) as well as intra-decoder attention to avoid attending to the same parts in the source by revising attention scores while decoding. See et al. (2017) and Gehrmann et al. (Reference Gehrmann, Deng and Rush2018) respectively propose coverage mechanism and coverage penalty, which records the sum of attention distributions of all previously generated words in a different way to track the summarized information. While these approaches discourage repetition to some extent, they do so in an indirect manner. That is, they do not make use of the attention information in the source directly. Consequently, they may still generate repeated phrases, especially in long sentences (shown in the first five sections of Table 2).
Generated summaries of the source in Table 1. The sentences in italicized are repetitive sentences. Each summary segment and its attended POI in source document are in the same color

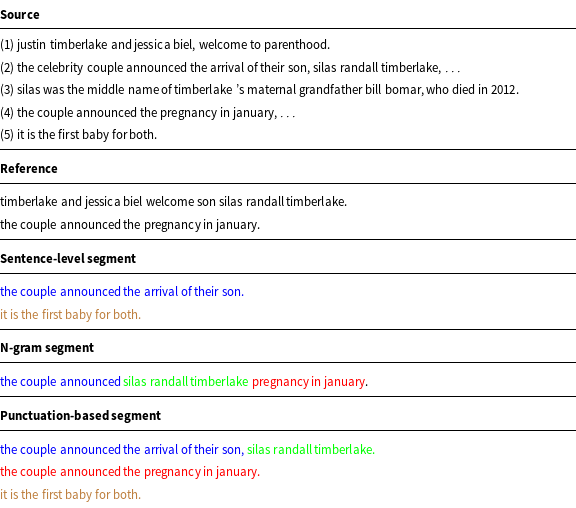
In this paper, we propose an attention filter mechanism that directly redistributes the attention from each word in the output summary to the source. It does so by computing the parts of interest (POIs) in the source per segment in the summary and then minimizing the attention scores of words in these POIs that have already been attended to by the preceding segments during decoding. POIs are the segments of source document that are attended by the segments in its corresponding summary, such as the green and red segments of the source document in Table 1 and Figure 1. Different segments in summary thus do not attend to the same semantic spots of source, and repetition is reduced. We can get segments in different ways. As shown in Table 3, we compare the segments in different types. The baseline with a sentence as the segment (sentence-level segment) always loses important information in reference summary, such as “silas randall timberlake.” The first sentence in generated summary based on sentence-level segment attends to the second sentence in source. The attention score of the second sentence in source is minimized, and this source sentence is no longer attended. So, the model with sentence-level segment loses the important information “silas randall timberlake” during decoding. The baseline with N-gram as a segment (N-gram segment) may bring about grammatical and semantic problems. Suppose that N equals 3Footnote a, as shown in Table 3, the green part of generated summary-based N-gram segment does not attend to the “the couple announced” in source document. As N-gram cannot be seen as a complete and accurate semantic unit, the decoder of model with N-gram segment attends to the segment in source with inaccurate grammar and semantics. Thus, the generated summary based on N-gram segment has grammatical and semantic errors. We use punctuations to separate the source or target into segments (punctuation-based segments), since punctuations play an important role in written language to organize the grammatical structures and to clarify the meaning of sentences (Briscoe Reference Briscoe1996; Kim Reference Kim2019; Li et al. Reference Li, Wang and Eisner2019b). It is very simple but effective. In this paper, a segment means a sentence or clause delimited by punctuation, which carries syntactic and semantic information. Specifically, we calculate the attention in terms of segments (larger semantic units than tokens and smaller semantic units than sentences) which intuitively helps with the emphasis of attention and POIs in source. This is different from previous approaches which all do not exactly pinpoint these parts in the source, which we believe is critical in reducing repetition.
The summary generated by attention filter mechanism with different types of segments. The parts of text in different colors denote segments. The segments in the same color attend to the same POI in the source

Despite the above effort, there are cases, where similar sentences exist in the same source document:
Example 1. “the standout fixture in the league on saturday sees leaders chelsea welcome manchester united … chelsea midfielder oriol romeu, currently on loan at stuttgart, … romeu is currently on a season-long loan at bundesliga side stuttgart.”
In this case, even if the decoder attends to different POIs of source document as it produces words, repetition may still result. At different time steps, the decoder may attend to sentences that are similar in different positions. One potential solution to this is semantic cohesion loss (SCL) (Çelikyilmaz et al. Reference Çelikyilmaz, Bosselut, He and Choi2018) which takes the cosine similarity between two consecutively generated sentences as part of the loss function. It may attend to the same POI and generate similar sentences (SCL row in Table 2). The other is Diverse Convolutional Seq2Seq Model (DivCNN) (Li et al. Reference Li, Liu, Litvak, Vanetik and Huang2019a), which introduces determinantal point processes (DPPs) (Kulesza and Taskar Reference Kulesza and Taskar2011) into deep neural network (DNN) attention adjustment. DPPs can generate subsets of input with both high quality and high diversity (QD-score). For abstractive summarization, DivCNN takes hidden states of DNN as QD-score. DivCNN selects the attention distribution of the subsets of source document with high QD-score first and then adds the selected attention distribution into model loss as a regularization. DivCNN does not directly redistribute the attention, so it may still attend to similar POIs. To improve QD-score, DivCNN tends to attend to scattered subsets of sentences in source document, which leads to semantic incoherence. As shown in Table 2 (DivCNN row), the content about the 16-year-old is inconsistent with source document. Besides, trigram decoder (TRI) (Paulus et al. Reference Paulus, Xiong and Socher2018) directly forbids repetition of previously generated trigrams at test time. While this simple but crude method avoids the repeat of any kind completely, it ignores the fact that some amount of repetition may exist in natural summaries. On the other hand, the meddling of the sentence generation during beam search causes another problem: it tends to generate sentences that are logically incorrect. In Table 2 (TRI row), the defender dayot didn’t really play for France, according to the source. That is, the subject and object are mismatched. As trigram cannot reflect the complete semantic information, trigram decoder is likely to generate logically incorrect summaries due to the trigram-based meddling of the sentence generation during testing. In order to avoid the logical incorrectness caused by trigram decoder, we introduce a sentence-level backtracking decoder (SBD) that prohibits the repeat of the same sentence at test time. Compared with trigram decoder, SBD can avoid repetition and generate more logical summaries. Our summary produced for the example is shown in the last section of Table 2.
Reducing repetition in abstractive summarization provides high-quality summaries for users and improves their reading efficiency. We expect that other natural language generation (NLG) tasks suffered from repetition problem can be enhanced with our approach. Our contributions are summarized as follows:
-
(1) We find the reasons behind repetition problem in abstractive summaries generated by CNN seq2seq models through observing the attention map between source documents and summaries.
-
(2) We propose an effective approach that redistributes attention scores during training time and prevents repetition by sentence backtracking at runtime to reduce repetition in CNN seq2seq model.
-
(3) Our approach outperforms the SOTA repetition reduction approaches on CNN-based models substantially by all evaluation metrics, including ROUGE scores, repeatedness and readability.
Next, we present the basic CNN seq2seq model and our extension, followed by the evaluation of our approach and a discussion of related work.
2. Approach
In this section, we describe the model architecture used for our experiments and propose our novel repetition reduction method, which is an extension to the basic model.Footnote b
In summarization task, the input (source document) and output (summary) are both sequences of words. Suppose the input and output are respectively represented as
 $\textbf{x} = (x_{1},x_{2},...,x_{m})$
and
 $\textbf{y} = (y_{1}, y_{2},..., y_{n})$
(
 $m>n$
), the goal is to maximize the conditional probability
 $p(\textbf{y}|\textbf{x})$
:
 \begin{equation}p(\textbf{y} | \textbf{x}) \!=\! {\prod^n_{t} {p(y_{t} | y_{1}, y_{2},..., y_{t-1}, \textbf{x}})}\end{equation}
Furthermore, we aim to generate summaries that are not only fluent and logically consistent with the source documents, but also with a small amount of repeatedness, which is natural in human-written summaries.
2.1. Basic CNN seq2seq model
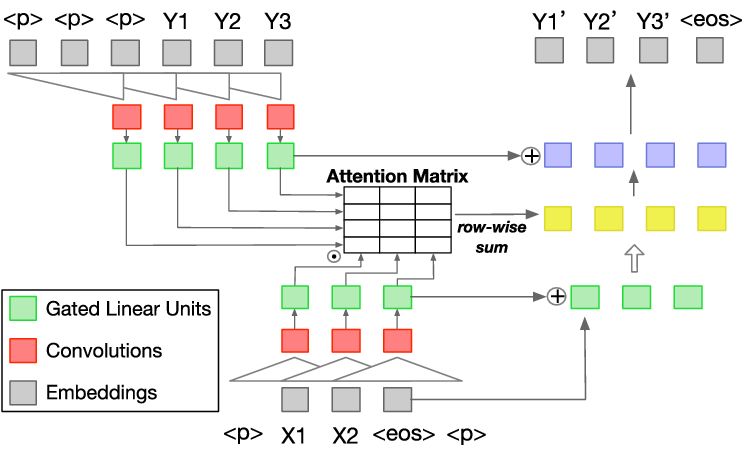
Our basic model is multi-layer convolutional seq2seq networks (Gehring et al. Reference Gehring, Auli, Grangier, Yarats and Dauphin2017) with attention mechanismFootnote c, as illustrated in Figure 2.
Convolutional seq2seq model.

For CNN seq2seq models, we combine word embeddings and position embeddings to obtain input
 $\mathbf{X} = (X_1,...,X_m)$
and output
 $\mathbf{Y}=(Y_1,...,Y_n)$
. We denote
 $\mathbf { z } ^ { l } = ( z _ { 1 } ^ { l } , \ldots , z _ { m } ^ { l } )$
and
 $\mathbf { h } ^ { l } = ( h _ { 1 } ^ { l } , \ldots , h _ { n } ^ { l } )$
respectively as convolutional output of the encoder and decoder in the l-th layer. Each element of the output generated by the decoder network is fed back into the next layer of decoder network. In each layer, GLU (Dauphin et al. Reference Dauphin, Fan, Auli and Grangier2017) and residual connections (He et al. Reference He, Zhang, Ren and Sun2016) are used respectively as a nonlinear gate and guarantee for sufficient depth of the network:
 \begin{equation} h _ { i } ^ { l } = GLU \left( W ^ { l } \left[ H _ {i-k/2 } ^ { l - 1 } , \ldots , H _ { i+k/2 } ^ { l - 1 } \right] + b _ { w } ^ { l } \right) + H _ { i } ^ { l - 1 }\end{equation}
where k is kernel width. W and b are trainable parameters.
For each decoder layer, the multi-step attention integrates encoder information. We compute decoder state
 $d_{i}^{l}$
for attention via
 \begin{align} d _ { i } ^ { l } &= W _ { d } ^ { l } h _ { i } ^ { l } + b _ { d } ^ { l } + Y _ { i } \end{align}
 \begin{align} a _ { i j } ^ { l } &= \frac { \exp \left( d _ { i } ^ { l } \cdot z _ { j } ^ { u } \right) } { \sum _ { t = 1 } ^ { m } \exp \left( d _ { i } ^ { l } \cdot z _ { t } ^ { u } \right) } \end{align}
 \begin{align} c _ { i } ^ { l } &= \sum _ { j = 1 } ^ { m } a _ { i j } ^ { l } \left( z _ { j } ^ { u } + X_j \right) \end{align}
 \begin{align} H_i^l &= c _ { i } ^ { l } + h_i^l\end{align}
where
 $d_{i}^{l}$
is decoder state,
 $z_{j}^{u}$
is the encoder state, u is the last layer of encoder, and
 $a_{ij}$
is attention score. The inner product between decoder state and encoder outputs is used to measure the affinity. The conditional input to the current decoder layer is a weighted sum of the encoder states and input representations. We get
 $H^l_i$
by adding
 $c _ { i } ^ { l }$
to
 $h_{i}^{l}$
, which forms the input for the next decoder layer or the final output.
Finally, we compute the probability distribution for the next word using the top decoder output:
 \begin{equation} p \left( y _ { i + 1 } | y _ { 1 } , \ldots , y _ { i } , \mathbf { x } \right) = \operatorname { softmax } \left( W _ { o } H _ { i } ^ { L } + b _ { o } \right)\end{equation}
2.2. Attention filter mechanism (ATTF)
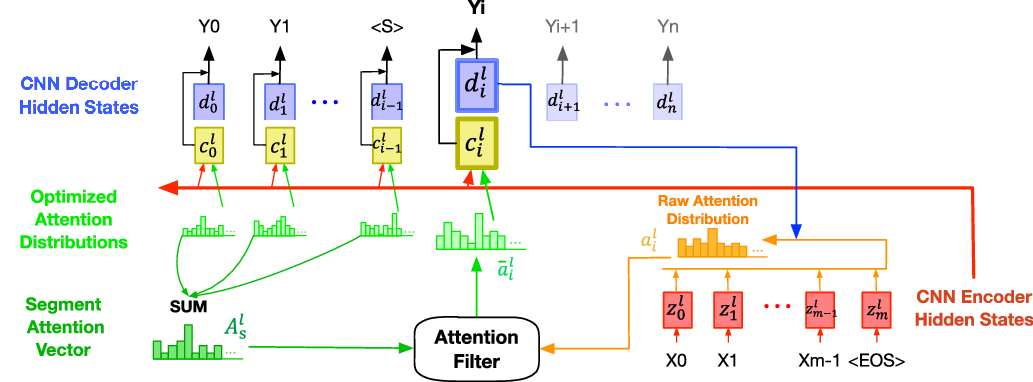
We propose an ATTF as a novel extension to the basic model, which can record previously attended locations in the source document directly and generate summaries with a natural level of repeatedness. This method aims at relieving the repetition problem caused by decoders attending to the same POI in source document.
Overview of Attention Filter Mechanism (ATTF).

2.2.1. Notations
In this mechanism, both source document and summary are respectively split into segments by punctuations. For the convenience of description, we take “sections” as the segments in source document and “segments” as the segments in summary. We denote the punctuation marks as <S>.
 $\mathbf{u}=(u_{0},u_{1},...,u_{M})$
denotes the positions of <S> in source document and
 $\mathbf{v}=(v_{0},v_{1},...,v_{N})$
denotes the positions of <S> in summary. Both
 $u_{0}$
and
 $v_{0}$
are
 $-1$
. Therefore, we can represent source document as
 $\mathbf{U}=(U_{1},U_{2},...,U_{M})$
and
 $\mathbf{V}=(V_{1},V_{2},...,V_{N})$
as summary.
 $U_i$
is the i-th section and
 $V_i$
is i-th segment. Both
 $U_i$
and
 $V_i$
are the sequences of tokens without punctuation tokens.
Let D denote the number of tokens in the source document.
 $a_i^l=(a_{i1}^l, a_{i2}^l,..., a_{ij}^l,..., a_{iD}^l)$
is a D-dimensional vector that records the attention scores in l-th layer of the i-th token in the summary over tokens in the source document. We define segment attention vector in the l-th layer as
 $A^{l}=(A_{0}^{l}, A_{1}^{l},..., A_{N}^{l})$
. For s-th segment
 $V_s$
,
 $A_s^l=(A^l_{s1}, A^l_{s2},...,A^l_{sD})$
is a vector representing segment attention distribution over tokens in the source document.
 $A^l_{sj}$
is the attention score between
 $V_s$
and j-th token in the source document.
2.2.2. Description
To measure the relevance between j-th token of the source document and the s-th segment
 $V_s$
, we sum up attention scores of each token in the s-th segment over j-th token of the source document:
 \begin{equation} A_{sj}^{l} = \sum_{i=v_{s-1}+1}^{v_{s}-1}a_{ij}^{l}\end{equation}
We set
 $A_{0}^{l}$
as a zero vector, because nothing is attended before generating the first segment.
To find the most attended sections of segment
 $V_s$
, we sort the elements inside the filter vector,
 $A_{s}^{l}$
, in descending order, and record the top k elements’ positions in the source document as:
 $\mathbf{p}=(p_{1},...,p_{k})$
where
 $k=v_{s}-v_{s-1}-1$
. In the other words,
 $\mathbf{p}$
records the position of k words most attended to
 $V_s$
in the source document. k is the same as the number of tokens in the s-th segment, because each token in a segment is aligned with at least one token in source document, according to the principle of the seq2seq model. Thus, for the s-th segment, we can find its most attended sections by
 $\mathbf{p}$
. We locate the elements at
 $\mathbf{p}$
in the source document as well as the sections they belong to. For section
 $U_t$
, we take the tokens that belong to
 $U_t$
and are located in the positions of
 $\mathbf{p}$
as
 $P_{U_{t}}$
. If the size of
 $P_{U_{t}}$
is larger than
 $\beta$
, a predefined constant, the section
 $U_{t}$
is a POI of segment
 $V_{s}$
, which should not be attended to again.
 $\mathbb{U}_{s}$
denotes a set of all such POIs for
 $V_s$
.
 $\mathbb{U}_{0}$
is an empty set.
We construct two multi-hot vectors
 $g_{s}$
and
 $g^{\prime}_{s}$
for each segment
 $V_{s}$
. The dimensions of them are the number of tokens in source document, D, which are the same as the dimension of
 $A_{s}^{l}$
. For
 $g_{s}$
, we set elements on the position of tokens belonging to sections in
 $\mathbb{U}_{s}$
to 0, and the elements on other positions to 1.
 $g_{sj}$
is the j-th elements of
 $g_s$
. If
 $g_{sj}=0$
, it means that the j-th token is attended by segment
 $V_s$
during the generation of
 $V_s$
.
 $g^{\prime}_{sj}$
is j-th element of
 $g^{\prime}_{s}$
, which is the flipped version of
 $\prod \limits_{q=1}^{s}g_{qj}$
. In the other words,
 $g^{\prime}_{sj}$
is
 $1-\prod \limits_{q=1}^{s}g_{qj}$
. If
 $\prod \limits_{q=1}^{s}g_{qj}=0$
and
 $g^{\prime}_{sj}=1$
, it means that the j-th token of the source document has been attended before. The filter on
 $a_{ij}^{l}$
in Equation (4) is given as:
 \begin{equation} \tilde{a}_{ij}^{l} = a_{ij}^{l}\prod_{q=1}^{s}g_{qj} + \min \limits_{A_{s}}\left(\frac{A_{sj}^{l}}{v_{s}-v_{s-1}-1}\right)g_{sj}^{\prime}\end{equation}
where
 $\tilde{a}_{ij}^l$
is the filtered attention score.
 $A_{sj}$
is the attention score between j-th token of the source document and the s-th segment.
 $g_{sj}$
and
 $g_{sj}^{\prime}$
denote whether j-th token of the source document has been attended. We penalize the attention score of attended tokens in source document. We take the minimum attention score between tokens in source document and summary (i.e.,
 $\min \limits_{A_{s}}(\frac{A_{sj}^{l}}{v_{s}-v_{s-1}-1})$
) as the attention score between the i-th token in target and the attended tokens in the source. Equation (5) now becomesFootnote d
 \begin{equation} \tilde{c} _ { i } ^ { l } = \sum _ { j = 1 } ^ { m } \tilde{a}_{ij}^{l} \left( z _ { j } ^ { u } + X_j \right)\end{equation}
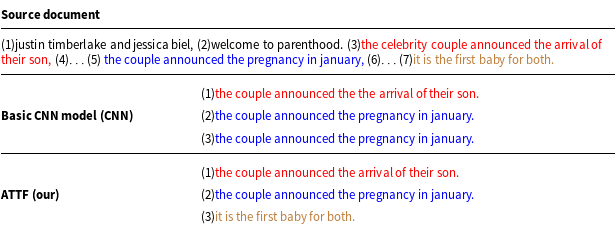
By using segment-wise attention and revising attention scores of attended POIs directly, our model optimizes the attention distribution between the encoder states and decoder states in such a way that the alignment relationship between source document and summary is enhanced, and noise for attention from encoder outputs is reduced. As shown in Table 4, the segments in the example are separated by punctuation. For the basic CNN model, the second and third sentence repeatedly attend to the fifth segment in source document. After applying ATTF model, the attention scores of the third and fifth segment in source document are penalized during generating words in the third sentence of ATTF. The last sentence of the summary generated by ATTF attends to the seventh segment in source.
Summary generated by the basic CNN model and ATTF model. The segments of summary use the same color as their attended section in the source document

The ATTF helps avoid repeatedly attending to the same POIs and therefore avoid repetition in summary generation.
2.3. Sentence-level backtracking decoder (SBD)
To tackle repeated sentences or phrases in the source (Example 1), we propose a SBD.
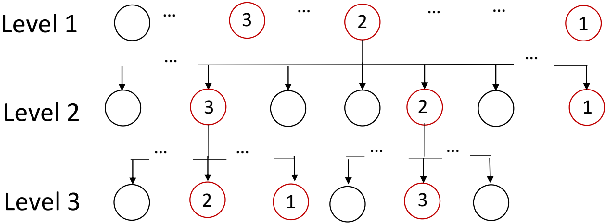
At test time, we prevent the decoder from generating identical or very similar sentences more than once via backtracking. An intuitive solution is to backtrack the generation process to the beginning of the repeated segment and regenerate it by following the second best choice in the beam. We call this simple approach SBD-b1. However, this is suboptimal because the parents of the current top b choices may not include all the top b choices at the parent level. Here b is the beam size. As shown in Figure 4, suppose that level 3 is the beginning of the repeated segment, the first choices at level 1 and 2 are excluded by beam search.
Backtracking in Beam Search (
 $b=3$
). This figure shows the progress of generating summary at test. The circles denote the candidate words (choices) in vocabulary, which are sorted by the probability of being selected in descending order. Each circle at level l has N choices at level
 $l+1$
. N is the number of words in vocabulary. The number in circles is the order of these choices according to the probability. The generation order is from level 1 (top) to level 3 (bottom).

An alternative approach (SBD-b2) backtracks all the way until the current top b choices all share the same prefix token sequence. This means that the current best choices in the beam reach some consensus that the generated prefix summary is good and should be retained. While this algorithm backtracks further and may include better choices, it does not completely solve the problem of SBD-b1. As shown in Figure 4, suppose that level 3 is the beginning of the repeated segment and the second choice in level 1 is the only prefix token sequence of top b choices in level 2, the first and third choices at level 1 are excluded by beam search after generating words based on the second choice in level 1.
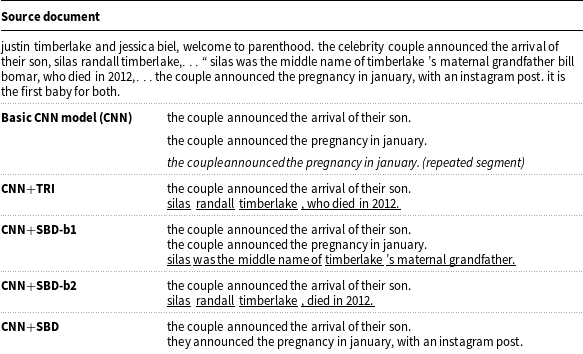
Our best approach (SBD) backtracks to the beginning of the whole summary and regenerates all the choices in the beam up to the point before the repeated segment. That way, all the best choices are known to the algorithm and we can make an optimal choice after excluding the first word of the previously repeated segment. As shown in Table 5, SBD-b1 and SBD-b2 backtrack the generator process to “january.” and “son.” respectively. The summaries generated by SBD-b1 and SBD-b2 are incoherent and inconsistent with the source document. Our best approach (SBD) will save the sequence before repeated segment, that is, “the couple announced the arrival of their son. the couple announced the pregnancy in january.” and backtrack to the beginning of the summary and regenerate the summary. When the saved sequence appears in the beam, we remove the first word (“the”) in repeated segment from the choices vocabulary. Compared with SBD-b1 and SBD-b2, SBD generates more fluent and coherent summaries.
Summary generated by basic CNN model with different backtracking methods

To determine whether two sentences, p and q, are similar, we define a boolean function as:
 \begin{equation} sim(p,q) = \begin{cases} 1 &\mbox{if $o(p,q) > n\text{ OR }o(p,q) > \frac{1}{2}\cdot l$}\\ \\[-7pt] 0 &\mbox{others} \end{cases}\end{equation}
where o(p,q) denotes the length of the longest common substring (LCS) between p and q, l is the minimum of the lengths of p and q, and n is a constant.
 $sim(p,q)=1$
means the two sentences are similar.
This method cooperates with ATTF in reducing repetition caused by the noises in dataset. Compared with TRI, SBD does not interrupt the beam search process in the middle of a sentence, hence significantly reducing related grammatical and factual errors. As shown in Table 5, the summary generated by SBD is grammatical and factual. Besides, SBD is capable of producing a more informative summary since it yields more chances to other candidate sentences.
3. Evaluation
In this section, we introduce the experimental set-up and analyze the performance of different models.
3.1. Datasets
CNN/Daily Mail (Hermann et al. Reference Hermann, Kociský, Grefenstette, Espeholt, Kay, Suleyman and Blunsom2015)Footnote e is a popular summarization dataset, which contains news articles paired with summaries. There are 286,817 training pairs, 13,368 validation pairs, and 11,487 test pairs. Table 1 shows an example pair from training data. We follow See et al. (2017) in data preprocessing and use the non-anonymized version, which fills in the blanks with answer named entities.
Also, we tried our model on other two abstractive summarization datasets about news, which are Newsroom (Grusky et al. Reference Grusky, Naaman and Artzi2018) and DUC 2002Footnote f. For Newsroom, there are 1,321,995 document–summary pairs, which are divided into training (76%), development (8%), test (8%), and unreleased test (8%). At testing, we use 8% released test data. DUC-2002 (DUC) is a test set of document–summary pairs. We use the models trained on CNN/Daily Mail to do the test on DUC and demonstrate the generalization of the models.
3.2. Model parameters and evaluation metrics
In the following experiments, we tokenize source documents and targets using the word tokenization method from NLTK (Natural Language Toolkit). The NLTK module is a massive toolkit, aimed at helping with the entire natural language processing (NLP) methodology. All the competing models contain eight convolutional layers in both encoders and decoders, with kernel width of 3. For each convolutional layer, we set the hidden state size to 512 and the embedding size to 256. To alleviate overfitting, we apply a dropout (
 $p=0.2$
) layer to all convolutional and fully connected layers. Similar to Gehring et al. (Reference Gehring, Auli, Grangier, Yarats and Dauphin2017), we use Nesterov’s accelerated gradient method (Sutskever et al. Reference Sutskever, Martens, Dahl and Hinton2013) with gradient clipping
 $0.1$
(Pascanu et al. Reference Pascanu, Mikolov and Bengio2013), momentum
 $0.99$
, and initial learning rate
 $0.2$
. Training terminates when learning rate
 $\le 10e-5$
. Beam size
 $b=5$
at test time.

We set the threshold
 $\beta$
to 3, because nearly 90% of sections are with length
 $>=$
3. We set n (Equation (11)) to 5, since less than 5% of reference summaries have the LCS of less than 5. We use the following evaluation metrics:
-
ROUGE scores (F1), including ROUGE-1 (R-1), ROUGE-2 (R-2), and ROUGE-L(R-L) (Lin Reference Lin2004). ROUGE-1 and ROUGE-2, respectively, refer to the overlap of unigram (each word) and bigrams between the generated summaries and reference summaries. ROUGE-L denotes Longest Common Subsequence (LCS)-based statistics. ROUGE-2 is the most popular metric for summarization.
-
Repeatedness (Rep) includes N-gram repeatedness, sentence repeatedness, and total repeatedness, which reflects the effectiveness of different methods on repetition reduction.
-
– N-gram repeatedness is the percentage of repeated N-grams in a summary:
(12)where \begin{equation}Rep_{ngram} = \frac{n_{ngram}}{N_{ngram}}\end{equation}
$n_{ngram}$
is the number of repeated N-grams and
$N_{ngram}$
is the total number of N-grams in a summary.
-
– Sentence repeatedness is the percentage of repeated sentences in a summary:
(13)where
\begin{equation}Rep_{sent} = \frac{n_{sent}}{N_{sent}}\end{equation}
$n_{sent}$
is the number of repeated sentences and
$N_{sent}$
is the total number of sentences in a summary. For sentence repeatedness, if the sentences contain the same trigram, these sentence are repetitve sentences.Footnote g
-
– Total repeatedness (Algorithm 1) is a comprehensive score that unifies word-level and sentence-level repeatedness. It is not computed by N-gram repeatedness score and sentence repeatedness score.
-
-
Repeatedness Correlation measures how well the total repeatedness scores of summaries generated by each model correlate with total repeatedness scores of reference summaries. The more the correlative generated summary and reference summary are, the better generated summary is. The correlation is evaluated with a set of three metrics, including Pearson correlation (r), Spearman rank coefficient (
$\rho$
), and Kendall’s tau coefficient (
$\tau$
). Given total repeatedness scores of reference summaries (ref) and their corresponding generated summaries (gen),
$X=score(ref)=(x_1, x_2,..., x_n)$
and
$Y=score(gen)=(y_1, y_2,..., y_n)$
, we can get paired data
$(X,Y)={(x_1, y_1), (x_2, y_2),..., (x_n, y_n)}$
. n is the number of pairs.-
– For Pearson correlation (r),
(14)where
\begin{equation}r = \frac{\sum_{i=1}^{n}(x_i - \overline{X})(y_i - \overline{Y})} {\sqrt{\sum_{i=1}^{n}(x_i - \overline{X})^{2}\cdot\sum_{i=1}^{n}(y_i - \overline{Y})^{2}}}\end{equation}
$\overline{X}$
and
$\overline{Y}$
are the mean of variables of X and Y.
-
– For Spearman rank coefficient,
(15)where
\begin{equation}\rho = \frac{\sum_{i=1}^{n}(R(x_i) - \overline{R(X)})(R(y_i) - \overline{R(Y)})} {\sqrt{\sum_{i=1}^{n}(R(x_i) - \overline{R(X)})^{2} \cdot\sum_{i=1}^{n}(R(y_i)-\overline{R(Y)})^{2}}}\end{equation}
$R(x_i)$
and
$R(y_i)$
are the rank of
$x_i$
and
$y_i$
.
$\overline{R(X)}$
and
$\overline{R(Y)}$
are the mean rank of X and Y.
-
– For Kendall’s tau coefficient,
(16)where
\begin{equation}\tau = \frac{n_c - n_d}{n_c + n_d} = \frac{n_c - n_d}{n(n-1)/2}\end{equation}
$n_c$
is the number of concordant pairs.
$n_d$
is the number of discordant pairs. Any pair of total repeatedness scores
$(x_{i},y_{i})$
and
$(x_{j},y_{j})$
, where
$i<j$
. They are said to be concordant, if both
$x_{i}>x_{j}$
and
$y_{i}>y_{j}$
; or if both
$x_{i}<x_{j}$
and
$y_{i}<y_{j}$
. They are said to be discordant, if
$x_{i}>x_{j}$
and
$y_{i}<y_{j}$
; or if
$x_{i}<x_{j}$
and
$y_{i}>y_{j}$
. If
$x_{i}=x_{j}$
or
$y_{i}=y_{j}$
, the pair is neither concordant nor discordant.
-
-
Readability (Readable) is a human evaluation, which can be used as the supplement to ROUGE. We educate human annotators to assess each summary from four independent perspectives:
-
– (1) Informative: How informative the summary is? Is the summary logically consistent with source document?
-
– (2) Coherent: How coherent (between sentences) the summary is?
-
– (3) Fluent: How grammatical the sentences of a summary are?
-
– (4) Factual: Are there any factual errors in the summary?
Readability score will be judged on the following five-point scale: Very Poor (1.0), Poor (2.0), Barely Acceptable (3.0), Good (4.0), and Very Good (5.0). The score reflects the fluency and readability of the summary.
-


We use readability to complement ROUGE scores, since Yao et al. (Reference Yao, Wan and Xiao2017) showed that the standard ROUGE scores cannot capture grammatical or factual errors. We randomly sample 300 summaries generated by each model and manually check their readability. Each summary is scored by four judges proficient in English. The Cohen’s Kappa coefficient between them is
 $0.66$
, indicating agreement. Here we use the average annotation score.
3.3. Baselines
Our goal is to evaluate the effectiveness of our repetition reduction technique. We need to select a basic model and implement different repetition reduction methods on top of it. After applying different repetition reduction methods, the basic model should be able to largely reflect the difference in the effectiveness of these repetition reduction methods. The basic model also needs to have higher training efficiency (higher speed and less memory usage) without being limited by computing resources while ensuring the quality of generation.
We choose to implement all existing repetition reduction techniques on top of vanilla CNN seq2seq model, because the vanilla CNN seq2seq model is fast and enjoys the best accuracy among the other vanilla RNN seq2seq models such as RNN seq2seq model and LSTM seq2seq model (Bai et al. Reference Bai, Kolter and Koltun2018; Gehring et al. Reference Gehring, Auli, Grangier, Yarats and Dauphin2017). The vanilla CNN seq2seq model and vanilla self-attention-based model have similar feature capture capabilities. With long inputs, the self-attention-based models will have greater computational complexity (Vaswani et al. Reference Vaswani, Bengio, Brevdo, Chollet, Gomez, Gouws, Jones, Kaiser, Kalchbrenner, Parmar, Sepassi, Shazeer and Uszkoreit2018), such as Transformer. As the inputs of summarization are very long, the self-attention-based models always need much more time during training and testing. Besides, the self-attention-based models contain more training parameters, which need more memory usage at training and testing time.
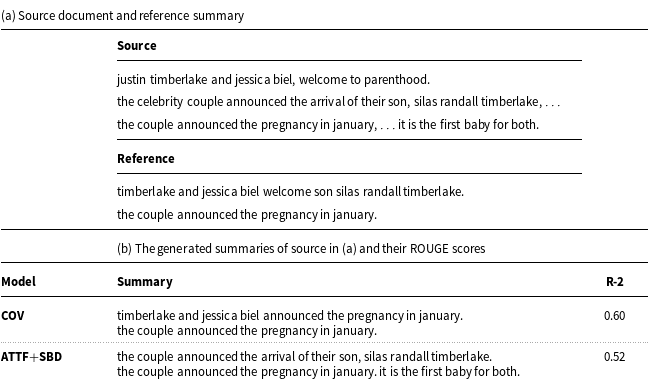
We did not implement the repetition reduction methods on top of the seq2seq models with higher ROUGE scores, because the effectiveness of the repetition reduction is not necessarily reflected in the ROUGE (See et al. 2017; Paulus et al. Reference Paulus, Xiong and Socher2018; Fan et al. Reference Fan, Grangier and Auli2018). As shown in Table 6, after reducing repetition, the summary becomes better, but the ROUGE score is not improved. Therefore, our evaluation mainly compares the effectiveness of different repetition reduction techniques in terms of all four metrics above. As known, ROUGE is not very good at evaluating abstractive summarization and the room for improvement on the ROUGE scores is very limited. If the repetition reduction methods were applied on top of the models with higher ROUGE scores, the differences in ROUGE scores by these repetition reduction techniques would be indistinguishable and complicate the analysis. Hence, in this work, we construct seven baselines by converting repetition reduction techniques developed on RNN seq2seq models to their counterparts on vanilla CNN seq2seq models, to be fair. The baselines are as follows:
-
CNN is the original convolutional seq2seq model (Gehring et al. Reference Gehring, Auli, Grangier, Yarats and Dauphin2017).
-
ITA integrates intra-temporal attention (Nallapati et al. Reference Nallapati, Zhou, dos Santos, Gülçehre and Xiang2016) in CNN seq2seq model, which normalizes attention values using attention history through timestamps.
-
ITDA adds intra-decoder attention mechanism (Paulus et al. Reference Paulus, Xiong and Socher2018) based on ITA, which also normalizes attention values using past decoders states. It is transferred to CNN seq2seq model in Fan et al. (Reference Fan, Grangier and Auli2018).
-
COV adopts the coverage mechanism (See et al. 2017), where repeatedly attending to the same locations is penalized in the form of coverage loss.
-
COVP adds the coverage penalty (Gehrmann et al. Reference Gehrmann, Deng and Rush2018) to loss function, which increases whenever the decoder repeatedly attends to the same locations of source document.
-
SCL adds semantic cohesion loss (Çelikyilmaz et al. Reference Çelikyilmaz, Bosselut, He and Choi2018) to loss function. Semantic cohesion loss is the cosine similarity between two consecutive sentences.
-
DivCNN uses DPPs methods (Micro DPPs and Macro DPPs) to produce attention distribution (Li et al. Reference Li, Liu, Litvak, Vanetik and Huang2019a). DPPs consider both quality and diversity, which helps model attend to different subsequences in source document.
-
TRI uses trigram decoder (Paulus et al. Reference Paulus, Xiong and Socher2018) at testing. The generation of repetitive trigrams is banned during beam search.
Example of generated summaries

3.4. Results
Segmentation. As shown in Table 3, we can get segments from the documents and summaries in three ways: sentence-level segment, N-gram segment, and punctuation-based segment.
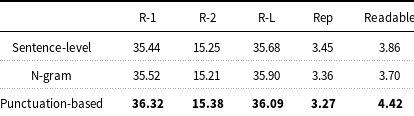
Table 7 shows the results of ATTF trained using different segmentation methods. The ATTF trained by punctuation-based segments performs best in terms of all evaluation metrics. The ROUGE scores and repeatedness scores of these three segmentation methods are similar because they all redistribute the attention distribution and avoid attending to the same segments. The difference is only from the different type of segments. As shown in Table 7, the ATTF trained on sentence-level segments achieve a higher readability score than the ATTF trained on N-gram segments, and the ROUGE scores of sentence-level segmentation is lower than N-gram segmentation. The former is because N-gram segments may cause grammatical and semantic problems and the latter is because the model with sentence-level segment may lose the important information, as shown in Table 3.
ROUGE scores, total repeatedness scores (%), and readablity scores of the summaries in CNN/Daily Mail dataset generated by the ATTF model using sentence-level, N-gram, and punctuation-based segments

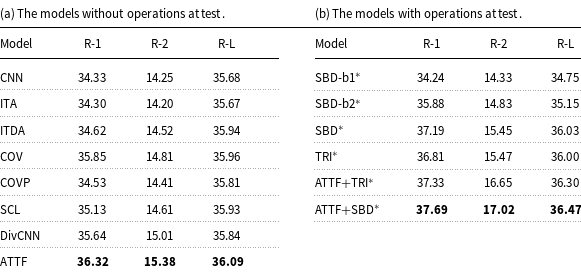
Accuracy. As shown in Table 8, our model (ATTF+SBD) outperforms all the baselines in ROUGE scores, indicating we are able to generate more accurate summaries.
ROUGE scores on CNN/Daily Mail dataset. In our experiments, * means that the model applies the repetition reduction methods to the decoder during test

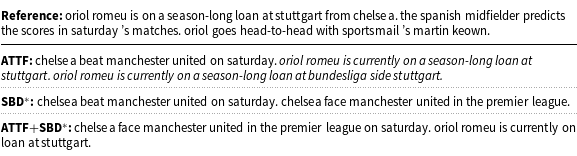
Without any special operations at testing, our ATTF model achieves the highest score on ROUGE, showing its effectiveness in improving summary quality. Models with SBD or TRI at testing are more effective than the basic CNN seq2seq model because more information is involved in summary generation as a byproduct of repetition reduction. Compared with its two variants, SBD is a little slower but has higher ROUGE scores, reflecting its advantage due to better choices taken globally. Therefore, we use SBD as our backtracking decoder in the following experiments. The number of explored candidate hypotheses, up to a point of repetition, is less than 30 tokens. The ROUGE score of SBD is higher than TRI on R-1 and R-L, but lower on R-2. The reason is that R-2 and R-L, respectively, evaluate bigram-overlap and longest common sequence between the reference summary and generated summary. This is in line with different techniques in SBD and TRI, the former promoting the diversity of sentences, and the latter promoting that of trigrams. SBD has higher ROUGE scores than ATTF, because the summaries from SBD do not have the repetition caused by attending to similar sentences in source. Unlike ATTF, SBD cannot obtain the ability to attend to different POIs through training. In Table 10, the sentences in SBD are not repetitive but summarized from the same POI. The summaries may lose important information when only using SBD. The readability score of SBD is lower than ATTF in Table 9.
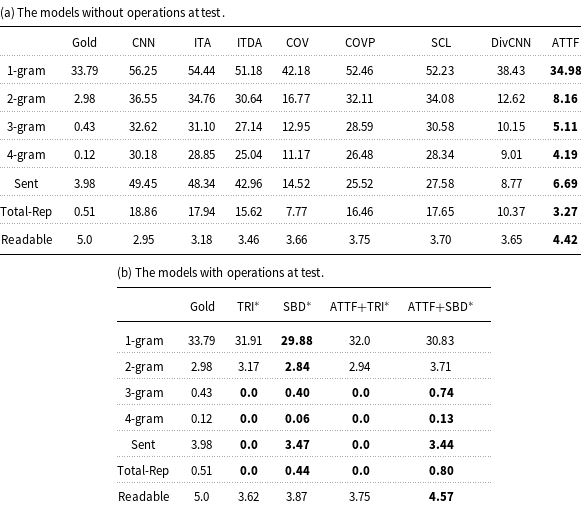
Repeatedness scores (%) and readability scores on CNN/Daily Mail dataset. The “Gold” denotes reference summaries, which are the most readable. By default, the readability score of reference summaries is judged to be 5.0

Summaries generated from Example 1

For models that tackle repetition both at training and test time, ATTF+SBD outperforms ATTF+TRI. SBD works in synergy with ATTF, and they together process information with section/segment as a unit. ATTF+SBD scores higher ROUGE than the other baselines, demonstrating its power to reduce repetition and generate more accurate summaries. Besides, as shown in Table 6, the quality of a summary cannot be evaluated by ROUGE scores alone. ATTF+SBD obviously produces a better, logically more consistent summary despite a lower ROUGE score. Due to the variable nature of abstractive summarization, ROUGE is not the optimal evaluation metric. Repeatedness and readability score, in our opinion, are important complementary metrics to ROUGE scores.
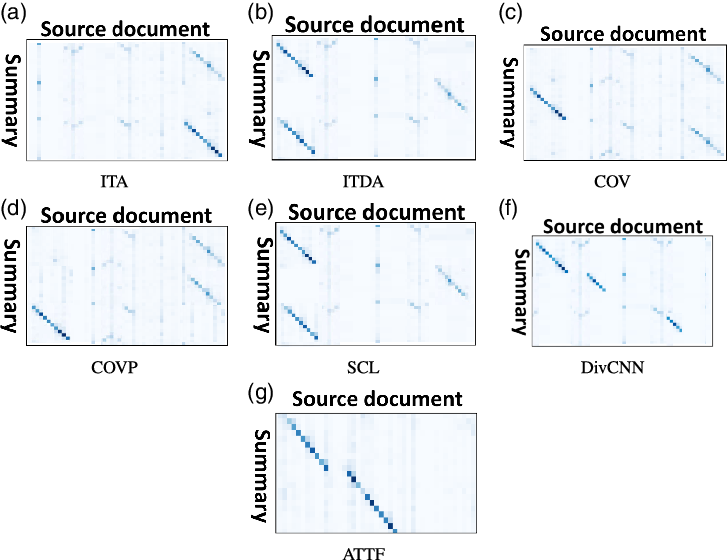
Repeatedness. To demonstrate the effectiveness of ATTF and SBD in reducing repetition, we compare repeatedness (Table 9) of generated summaries. Lower repeatedness means the model is more capable of reducing repetition. In Table 9, Gold row shows the repeatedness scores of reference summaries. ATTF achieves the lowest score among all baselines without any operations at test time. As shown in Tables 1 and 2 and Figure 5, baseline models suffer from severe repetition problem because they attend to the same POIs of the source document. DivCNN adjusts attention distribution in an indirect manner that adds the attention of the subsets (with high-quality diversity score) selected from source document into the loss. Thus, DivCBNN may still attend to similar but different sentences, resulting in lower ROUGE scores and higher repeatedness. Besides, DivCNN is trained to attend to diversity subsets, which means that the selected subsets are more scattered (as shown in Figure 5) and lead to semantic incoherence. However, ATTF attends to different POIs and generates summaries such as this:
Attention distribution of summaries for the source in Table 1.

ATTF: manchester city are rivalling manchester united and arsenal for defender dayot pamecano. the 16-year-old joined in the january transfer window only for him to opt to stay in france.
Compared with the Gold standard, ATTF still generates some repetitive sentences due to similar sentences in source such as Example 1. The summary generated by ATTF and its local attention are shown in Table 10 and Figure 6. Also, SBD further reduces the repetition when combined with ATTF.
As shown in Table 9, TRI has the lowest total repeatedness score. It does not generate any repetitive N-grams (N
 $>$
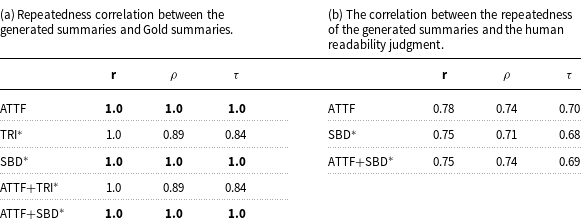
2) and sentences because TRI prevents the generation of the same trigrams during testing. But as the Gold row shows, reference summaries do have some natural repetition. Therefore, we evaluate the correlation of repeatedness distribution between generated summaries and reference summaries (Table 11(a)). Our proposed models perform best, which indicates that ATTF and SBD are more capable of producing summaries with a natural level of repeatedness. In addition, as shown in Table 11(b), the correlations between the repeatedness and the human readability judgment are about 0.7, which means that the repeatedness score is useful. The repetition in summaries will affect coherence between sentences and the readability of summaries.
Correlation Evaluation (
 $\textbf{r}$
= Pearson,
 ${\rho}$
= Spearman and
 $\mathbf{\tau}$
= Kendall’s tau)

Attention distribution for ATTF in Table 10.

Readability. As shown in Table 9, the models with ATTF achieve the highest readability score among all baselines, which means ATTF is more readable. As shown in Table 9(b), TRI achieves the best scores on repeatedness, but lower readability scores than other models. Readability is a human evaluation metric considering the logical correctness. (See Section 3.2). As shown in Table 9 and Table 13, the Readable scores of the models with TRI are lower than the models with SBD, which indicates the effectiveness of SBD on logical correctness. Specially, after using TRI, the readability of ATTF+TRI becomes lower than ATTF. This means that the TRI will bring logical incorrectness to the generated summaries. TRI interrupts the process of sentence generation during beam search through trigrams that cannot reflect the complete grammatical structure and semantic information. TRI is likely to generate summaries with more grammatical and factual errors. SBD forbids the repetition at sentence-level during testing, which considers complete grammatical structure and semantic information. As shown in Table 2 and Table 5, SBD weakens the influence of the meddling of sentence generation during beam search and generates more readable summaries. The higher ROUGE scores show that SBD enhances the performance of CNN and ATTF by reducing the repetitive unreadable sentences.
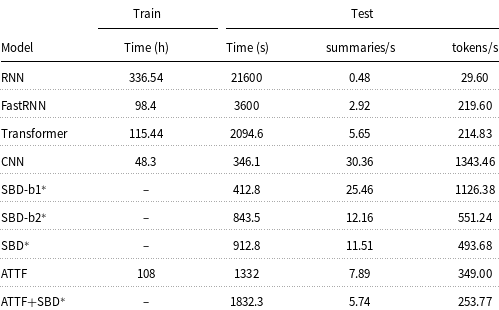
Time and speed of training and testing. The training time of the model with SBDs is empty because SBDs are only used during testing

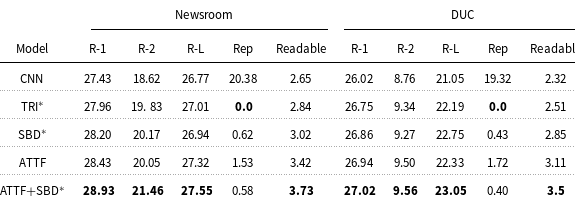
ROUGE scores, total repeatedness (Rep), and readability on Newsroom and DUC

Speed. We compare the speed of our model on CNN/Daily Mail to RNN (See et al. 2017), FastRNN (Chen and Bansal Reference Chen and Bansal2018) and Transformer-large (Vaswani et al. Reference Vaswani, Shazeer, Parmar, Uszkoreit, Jones, Gomez, Kaiser and Polosukhin2017) which used K40. We perform experiments on GTX-1080ti and scale the speed reported for the RNN methods, since GTX-1080ti is twice as fast as K40 (Gehring et al. Reference Gehring, Auli, Grangier, Yarats and Dauphin2017).
As shown in Table 12, the CNN is faster than Transformer based on multi-head self-attention mechanism. In terms of computational complexity, Vaswani et al. (Reference Vaswani, Shazeer, Parmar, Uszkoreit, Jones, Gomez, Kaiser and Polosukhin2017) show that the per-layer complexity of self-attention is
 $O(n^2d)$
and the per-layer complexity of CNN is
 $O(knd^2)$
. n is the sequence length, d is the representation dimension, and k is the kernel width of convolutions. So the difference between the complexity of Transformer and CNN depends on n, d, and k. In our experiments, we follow Gehring et al. (Reference Gehring, Auli, Grangier, Yarats and Dauphin2017) in the experimental setting for CNN and Vaswani et al. (Reference Vaswani, Shazeer, Parmar, Uszkoreit, Jones, Gomez, Kaiser and Polosukhin2017) for Transformer. Both experimental settings are standard settings of the vanilla models. As the average sequence length of source documents in our datasets is more than 500, the n in the complexity of CNN and Transformer is greater than 500. The representation dimension of CNN,
 $d_{cnn}$
, is 256. The representation dimension of Transformer,
 $d_{trans}$
, is 1024. The kernel width of CNN is 3. Thus, in our experiment, the speed of CNN is faster. The training speed and testing speed of CNN+ATTF are faster than RNN seq2seq model and Transformer since the training of CNN is parallel. The gap of training/testing time between ATTF and Transformer is not much larger, but the memory usage of Transformer is much larger than ATTF. This is because that Transformer has more trainable parameters than ATTF. The training speed and testing speed of FastRNN are faster than RNN because FastRNN is not an end-to-end model. FastRNN is a two-stage framework, which first uses an extractor to extract several salient sentences from source document and then uses an abstractor to summarize each salient sentence. The final summary is the concatenation of these summarized salient sentences. The extractor in FastRNN is a pointer network with a sequence of sentences as input. The encoder of extractor is the same as RNN. The FastRNN adopts RNN as abstractor and trains extractor and abstractor in parallel, which speeds up the encoder and decoder of RNN seq2seq model by shortening the input and output. As an end-to-end model, the input and output of our CNN+ATTF model are sequences of words in complete source document and summary, which are much longer than the input and output of the extractor and abstractor of FastRNN. The training speed of CNN+ATTF is similar to FastRNN as the CNN can be trained in parallel. The testing speed of CNN+ATTF is faster than FastRNN because FastRNN should extract sentences first and then abstract each sentence during test.
The convergence rate of models with ATTF depends on three aspects: dataset, basic model, and experimental settings. For dataset, ATTF redistributes the attention distribution between source documents and summaries during decoding, which dynamically searches the attended segment in source by the predicted segments in summary. Thus, the convergence rate of the models with ATTF depends on the length of source documents and summaries. The ATTF applied on better basic models converges faster, because better basic models learn the alignment between source documents and summaries better. The experimental setting also impacts the convergence rate of the model with ATTF. At the beginning of training, a large learning rate makes the model converge faster. When most of the samples have been trained, the model converges rapidly by decreasing the learning rate.
As shown in Table 8 and Table 12, SBD is the best SBD. Compared with SBD-b1 and SBD-b2, SBD logs higher ROUGE scores without losing much on speed. ATTF+SBD achieves the best ROUGE scores and its training time and testing time do not increase too much.
Generalization. Table 13 shows the generalization of our abstractive system to other two datasets, Newsroom and DUC 2002, where our proposed models achieve better scores than vanilla CNN seq2seq model in terms of ROUGE scores, readability and repeatedness. We use the same settings of
 $\beta=3$
in Section 2.2.2 and
 $n=5$
in Equation (11), because the proportion of segments with length greater than 3 and reference summaries with LCS greater than 5 were about 90%. As shown in Table 13, our proposed models can generalize better on other datasets about news, along with repetition reduction and the improvement of readability. This shows that our proposed models can be generalized well.
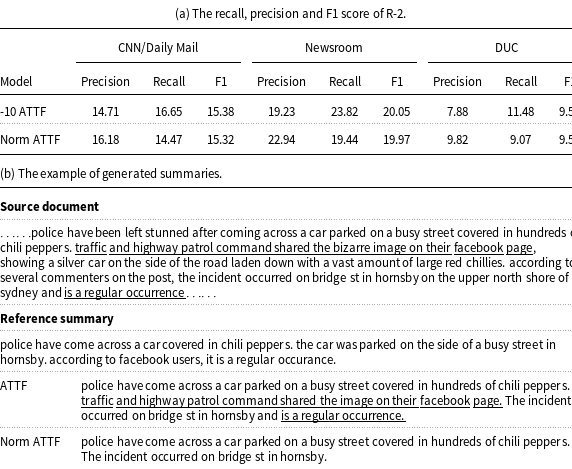
Normalization. The attention scores of the basic attention mechanism without filtering satisfy the probability distribution. As for the filtered attention scores of ATTF, we penalize the attention scores of the tokens that have been attended to in the source document and keep the attention scores of other tokens in the source document the same. In this way, we can keep the difference of attention scores between the tokens that have not been attended to, which may avoid ignoring some source contents that need to be summarized. After re-normalizing the filtered attention scores, the decoder tends to attend to the tokens of the source document with high filtered attention scores. It can also prevent the attention scores of the tokens that have not been attended to from too small.
As shown in Table 14, the R-2 F1 scores of ATTF and ATTF with re-normalized attention scores (Norm ATTF) are similar over all datasets. ROUGE recall measures how well a generated summary matches its corresponding reference summary by counting the percentage of matched n-grams in the reference. ROUGE precision indicates the percentage of n-grams in the generated summary overlapping with the reference. ATTF is always better than Norm ATTF on R-2 recall, and Norm ATTF is better than ATTF on R-2 precision. As shown in Table 14(b), since the difference of attention scores is not magnified by normalization, the summary generated by ATTF can more comprehensively attend to the information in the source. However, when the attention scores of the tokens that have not been attended to are too small, the decoder may attend to less important information of the source, such as “traffic and highway patrol……” (ATTF row) in Table 14(b). The summary generated by Norm ATTF is likely to miss some important information, such as “it is a regular occurrence.”, due to the magnified differences between filtered attention scores.
The comparison of ATTF and the re-normalized ATTF (Norm ATTF)

Comparison of ATTF and TRI. In our experiments, the TRI is the basic CNN seq2seq model with trigram decoder during test. For ROUGE scores, as shown in Table 8 and Table 13, ATTF gets lower ROUGE scores than TRI on CNN/Daily Mail and higher ROUGE scores on Newsroom and DUC. For repeatedness scores, as shown in Table 9 and Table 13, the difference between ATTF and TRI in Newsroon is smaller than that between ATTF and TRI in CNN/Daily Mail. As some of the source documents in CNN/Daily Mail have the similar but different segments (as shown in Figure 6), ATTF may attend to such segments and generate summaries with repetition. The summaries with repetition always achieve lower ROUGE scores. The better performance of ATTF on Newsroom and DUC indicates the ATTF is more effective than TRI in the case of the datasets without repetition in source document. As shown in Table 11, the repeatedness correlation scores of ATTF are higher than TRI, which indicates the summaries generated by ATTF are more similar to human-written summaries. Besides, the readability scores of ATTF are better than TRI on all datasets, which means that the summaries generated by the attention-based modification are more fluent and readable than simple trigram blocking.
Significance Test. We use significance test to prove that the ROUGE scores in Table 8 are reliable. We take t-test (Loukina et al. Reference Loukina, Zechner and Chen2014) as our significance test to measure that the ROUGE scores between our proposed approach (ATTF+SBD) and each baseline are significant or not. As shown in Table 15, all p-values are less than 0.05. The smaller the p-value, the higher the significance. Thus, the difference in the similarity results is significant.
p-value of significance test between our best proposed model (ATTF+SBD) and baselines on ROUGE scores

Overall, the summaries generated by sequence-to-sequence models with attention mechanism always contain repetition. Through our observations, there are two reasons for repetition in abstractive summarization. One is that the traditional attention mechanisms attend to the same location in source document at decoding. The other is that the attention mechanism attends to the repetitive sentences in different locations in source document. As shown in Figure 5 and Table 10, our proposed ATTF and SBD effectively mitigate the above two problems. As ATTF deals with incorrect attention distribution between the inputs of encoder and decoder to reduce repetition in generated summaries, the seq2seq models with attention mechanism between encoder and decoder can be improved via ATTF. The SBD can only be used at testing, which is suitable for the models with decoder. Since RNN-based and transformer-based seq2seq models, including attention mechanism between encoder and decoder, always suffer from repetition in generated summaries, we can reasonably deduce that these models will benefit from our proposed ATTF and SBD as well. The higher ROUGE scores (Table 8) of our model mean that the summaries generated by our model are more similar to their corresponding reference summaries. The natural-level repeatedness and higher readability score (Table 9) of our model indicate that our model can produce summaries with higher quality. ATTF is applied to the attention mechanism between encoder and decoder, which impacts the time of decoding at training and testing. SBD only impacts the time of decoding during test. ATTF+SBD takes about the same amount of time for additional models to slow down. For RNNs and transformers, after adding ATTF+SBD, there would be less than six times slowdown (as shown in Table 11, for the vanilla CNN, there is a roughly six times slowdown after adding ATTF+SBD), since RNNs and transformers spend more training time and testing time on encoding than CNN. As a result, our model can improve the reading speed and accuracy of reading comprehension.
4. Related work
In this section, we discuss neural-based abstractive summarization and some previous work on repetition reduction methods in abstractive summarization.
4.1. Neural-based abstractive summarization
Automatic summarization condenses long documents into short summaries while preserving the important information of the documents (Radev et al. Reference Radev, Hovy and McKeown2002; Allahyari et al. Reference Allahyari, Pouriyeh, Assefi, Safaei, Trippe, Gutierrez and Kochut2017; Shi et al. Reference Shi, Keneshloo, Ramakrishnan and Reddy2021). There are two general approaches to automatic summarization: extractive summarization and abstractive summarization. Extractive summarization selects sentences from the source articles, which can produce grammatically correct sentences (Bokaei et al. Reference Bokaei, Sameti and Liu2016; Verma and Lee Reference Verma and Lee2017; Naserasadi et al. Reference Naserasadi, Khosravi and Sadeghi2019; Zhong et al. Reference Zhong, Liu, Wang, Qiu and Huang2019). Abstractive summarization is a process of generating a concise and meaningful summary from the input text, possibly with words or sentences not found in the input text. A good summary should be coherent, non-redundant, and readable (Yao et al. Reference Yao, Wan and Xiao2017). Abstractive Summarization is one of the most challenging and interesting problems in the field of NLP (Carenini and Cheung Reference Carenini and Cheung2008; Pallotta et al. Reference Pallotta, Delmonte and Bristot2009; Sankarasubramaniam et al. Reference Sankarasubramaniam, Ramanathan and Ghosh2014; Bing et al. Reference Bing, Li, Liao, Lam, Guo and Passonneau2015; Rush et al. Reference Rush, Chopra and Weston2015; Li et al. Reference Li, He and Zhuge2016; Yao et al. Reference Yao, Wan and Xiao2017; Nguyen et al. Reference Nguyen, Cuong, Nguyen and Nguyen2019).
Recently, neural-based (encoder–decoder) models (Rush et al. Reference Rush, Chopra and Weston2015; Chopra et al. Reference Chopra, Auli and Rush2016; Nallapati et al. Reference Nallapati, Zhou, dos Santos, Gülçehre and Xiang2016; See et al. 2017; Paulus et al. Reference Paulus, Xiong and Socher2018; Liu and Lapata Reference Liu and Lapata2019; Wang et al. Reference Wang, Quan and Wang2019; Lewis et al. Reference Lewis, Liu, Goyal, Ghazvininejad, Mohamed, Levy, Stoyanov and Zettlemoyer2020; Liu et al. Reference Liu, Jia and Zhu2021) have made some progress for abstractive summarization. Most of them use RNNs with different attention mechanisms (Rush et al. Reference Rush, Chopra and Weston2015; Nallapati et al. Reference Nallapati, Zhou, dos Santos, Gülçehre and Xiang2016; See et al. 2017; Paulus et al. Reference Paulus, Xiong and Socher2018). Rush et al. (Reference Rush, Chopra and Weston2015) are the first to apply the neural encoder–decoder architecture to text summarization. See et al. (2017) enhance this model with a pointer generator network which allows it to copy relevant words from the source text. RNN models are difficult to train because of the vanishing and exploding gradient problems. Another challenge is that the current hidden state in an RNN is a function of previous hidden states, so RNN cannot be easily parallelized along the time dimension during training and evaluation, and hence training them for long sequences becomes very expensive in computation time and memory footprint.
To alleviate the above challenges, convolutional neural network (CNN) models (Gehring et al. Reference Gehring, Auli, Grangier, Yarats and Dauphin2017; Fan et al. Reference Fan, Grangier and Auli2018; Liu et al. Reference Liu, Luo and Zhu2018; Zhang et al. Reference Zhang, Li, Wang, Fang and Xiao2019b) are applied into seq2seq models. Gehring et al. (Reference Gehring, Auli, Grangier, Yarats and Dauphin2017) propose a CNN seq2seq model equipped with gated linear units (Dauphin et al. Reference Dauphin, Fan, Auli and Grangier2017), residual connections (He et al. Reference He, Zhang, Ren and Sun2016), and attention mechanism. Liu et al. (Reference Liu, Luo and Zhu2018) modify the basic CNN seq2seq model with a summary length input and train a model that produces fluent summaries of desired length. Fan et al. (Reference Fan, Grangier and Auli2018) present a controllable CNN seq2seq model to allow users to define high-level attributes of generated summaries, such as source style and length. Zhang et al. (Reference Zhang, Li, Wang, Fang and Xiao2019b) add a hierarchical attention mechanism to CNN seq2seq model. CNN-based models can be parallelized during training and evaluation. The computational complexity of these models is linear with respect to the length of sequences. CNN model has shorter paths between pairs of input and output tokens so that it can propagate gradient signals more efficiently. CNN model enables much faster training and more stable gradients than RNN. Bai et al. (Reference Bai, Kolter and Koltun2018) showed that CNN is more powerful than RNN for sequence modeling. Therefore, in this work, we choose the vanilla CNN seq2seq model as our base model.
4.2. Repetition reduction for abstractive summarization
Repetition is a persistent problem in the task of neural-based summarization. It is tackled broadly in two directions in recent years.
One direction involves information selection or sentence selection before generating summaries. Chen and Bansal (Reference Chen and Bansal2018) propose an extractor–abstractor model, which uses an extractor to select salient sentences or highlights and then employs an abstractor network to rewrite these sentences. Sharma et al. (Reference Sharma, Huang, Hu and Wang2019) and Bae et al. (Reference Bae, Kim, Kim and Lee2019) also use extractor–abstractor model with different data preprocessing methods. All of them can not solve repetition in seq2seq model. Tan et al. (Reference Tan, Wan and Xiao2017) and Li et al. (Reference Li, Xiao, Lyu and Wang2018a); Li et al. (Reference Li, Xiao, Lyu and Wang2018b) encode sentences using word vectors and predict words from sentence vector in sequential order, whereas CNN-based models are naturally parallelized. While transferring RNN-based model to CNN model, the kernel size and the number of convolutional layers cannot be easily determined when converting between sentences and word vectors. Therefore, we do not compare our models to those models in this paper.
The other direction is to improve the memory of previously generated words. Suzuki and Nagata (Reference Suzuki and Nagata2017) and Lin et al. (Reference Lin, Sun, Ma and Su2018) deal with word repetition in single-sentence summaries, while we primarily deal with multi-sentence summaries with sentence-level repetition. There is almost no word repetition in multi-sentence summaries. Jiang and Bansal (Reference Jiang and Bansal2018) add a new decoder without attention mechanism. In CNN-based model, attention mechanism is necessary to connect encoder and decoder. Therefore, our model also is not compared with the above models in this paper. The following models can be transferred to CNN seq2seq model and are used as our baselines. See et al. (2017) integrates coverage mechanism, which keeps track of what has been summarized, as a feature that helps redistribute the attention scores in an indirect manner, in order to discourage repetition. Tan et al. (Reference Tan, Wan and Xiao2017) use distraction attention (Chen et al. Reference Chen, Zhu, Ling, Wei and Jiang2016), which is identical to coverage mechanism. Gehrmann et al. (Reference Gehrmann, Deng and Rush2018) add coverage penalty to loss function which increases whenever the decoder directs more than 1.0 of total attention toward a word in encoder. This penalty indirectly revises attention distribution and results in the reduction of repetition. Çelikyilmaz et al. (Reference Çelikyilmaz, Bosselut, He and Choi2018) uses SCL, which is the cosine similarity between two consecutive sentences, as part of the loss that helps reduce repetition. Li et al. (Reference Li, Liu, Litvak, Vanetik and Huang2019a) add DPPs methods into DNN attention adjustment and takes attention distribution of subsets selected from source document by DPPs as the part of loss. Paulus et al. (Reference Paulus, Xiong and Socher2018) propose intra-temporal attention (Nallapati et al. Reference Nallapati, Zhou, dos Santos, Gülçehre and Xiang2016) and intra-decoder attention which dynamically revises the attention distribution while decoding. It also avoids repetition at test time by directly banning the generation of repeated trigrams in beam search. Fan et al. (Reference Fan, Grangier and Auli2018) borrows the idea from Paulus et al. (Reference Paulus, Xiong and Socher2018) and builds a CNN-based model.
Our model deals with the attention in both encoders and decoders. Different from the previous methods, our attention filter mechanism does not treat the attention history as a whole data structure but divides it into sections (Figure 3). Previously, the distribution curve of accumulated attention scores for each token in the source document tends to be flat, which means critical information is washed out during decoding. Our method emphasizes previously attended sections so that important information is retained.
Given our observation that repetitive sentences in the source are another cause for repetition in summary, which cannot be directly resolved by manipulating attention values, we introduce SBD. Unlike Paulus et al. (Reference Paulus, Xiong and Socher2018), we do not ban repetitive trigrams in test time. Instead, our decoder regenerates a sentence that is similar to previously generated ones. With the two modules, our model is capable of generating summaries with a natural level of repetition while retaining fluency and consistency.
4.3. Pretrained models for summarization
The pretrained transformer language models have success in summarization tasks.
Some of the pretrained summarization models apply pretrained contextual encoders, such as BERT (Devlin et al. Reference Devlin, Chang, Lee and Toutanova2019). BERT proposes a transformer-based masked language model, where some of the tokens of an input sequence are randomly masked, and the goal is to predict these masked tokens with the corrupted sequence as input. Liu and Lapata (Reference Liu and Lapata2019) introduce a document-level encoder based on BERT which is able to express the semantics of a document and obtain representations for its sentences. Zhong et al. (Reference Zhong, Liu, Chen, Wang, Qiu and Huang2020) leverage the BERT in a Siamese (Bromley et al. Reference Bromley, Bentz, Bottou, Guyon, LeCun, Moore, Säckinger and Shah1993) network structure to construct a new encoder for the representation of the source document and reference summary. Zhang et al. (Reference Zhang, Wei and Zhou2019a) propose a novel HIBERT encoder for document encoding and apply HIBERT to summarization model.
Others are pretrained on sequence-to-sequence (seq2seq) models. UniLM (Dong et al. Reference Dong, Yang, Wang, Wei, Liu, Wang, Gao, Zhou and Hon2019) is a multi-layer transformer network, which utilizes specific self-attention masks based on three language model (i.e., unidirectional, bidirectional, and seq2seq language models) to control what context the prediction conditions on. The seq2seq language model in UniLM attends to bidirectional contexts for source document and left contexts only for summary. For the pretraining seq2seq model, BART (Lewis et al. Reference Lewis, Liu, Goyal, Ghazvininejad, Mohamed, Levy, Stoyanov and Zettlemoyer2020) uses an arbitrary noising function to corrupt input, instead of the masked language model. Then, the corrupted input is reconstructed by training on a transformer seq2seq model. ProphetNet (Qi et al. Reference Qi, Yan, Gong, Liu, Duan, Chen, Zhang and Zhou2020) trains on the transformer seq2seq model and takes future n-gram prediction as self-supervised. PEGASUS (Zhang et al. Reference Zhang, Zhao, Saleh and Liu2020) uses self-supervised objective Gap Sentences Generation to train a transformer seq2seq model. Compared with previous pretrained models, PEGASUS masks sentences rather than smaller continuous text spans. Through fine-tuning the pretrained models or representations on summarization task, the quality of generated summaries can be improved.
The excellent performance of the pretrained summarization models is from large-scale training datasets and heavy network structures, which always brings huge consumption of training time and memory space. However, the goal of our approach is to reduce repetition in abstractive summarization. The comparison results of the summaries generated by the vanilla models adding different reducing repetition methods can obviously show the effectiveness of different reducing repetition methods. Thus, we take the vanilla model as our basic model and do not compare our proposed approach with the pretrained models.
5. Conclusion
Abstractive summarization plays an important part in NLP tasks. Its goal is to generate a short summary which expresses the main ideas of the source document. CNNs have met great success in abstractive summarization. Compared with RNNs, CNNs are more effective and can be trained much faster due to their intrinsic parallel nature and more stable gradients. However, we find that repetition is a persistent problem in the task of CNN seq2seq abstractive summarization.
In this paper, we focus on the repetition problem in abstractive summarization based on CNN seq2seq model with attention mechanism. We analyze two possible reasons behind the repetition problem in abstractive summarization: (1) attending to the same location in source and (2) attending to similar but different sentences in source. In response, we presented two methods to modify existing CNN seq2seq model, that is, a section-aware attention mechanism (ATTF) and a SBD. The ATTF can record previously attended locations in the source document directly and prevent decoder from attending to these locations. The SBD prevents the decoder from generating similar sentences more than once via backtracking at test. The proposed models are able to train a model that produces summaries with natural-level repetition that are fluent and coherent. It means that the summaries generated by our model are more accurate and readable. This can help user quickly get the main information from large of textual data, saving reading time and improving reading efficiency. As some other NLG tasks based on seq2seq model with attention mechanism are orthogonal to our proposed methods, they can also be enhanced with our proposed models. In order to assess the effectiveness of our proposed approaches in repetition reduction, we presented two evaluation metrics: Repeatedness and repeatedness correlation. Repeatedness measures the repetition rate of N-grams and sentences in summaries. Repeatedness correlation tests how well the repetition of generated summaries correlate with natural-level repetition. We also argue that ROUGE is not a perfect evaluation metric for abstractive summarization. The standard ROUGE scores cannot capture grammatical or factual errors. Thus, we proposed readability score to complement ROUGE scores. Readability is a human evaluation, which measures the fluency and readability of the summary. Our approach outperforms the baselines in all evaluation metrics, including ROUGE scores, repeatedness, repeatedness correlation, and readability.
Competing Interests
Yizhu Liu and Xinyue Chen are the students of Shanghai Jiao Tong University. Xusheng Luo is employed at Alibaba Group. Kenny Q. Zhu is employed at Shanghai Jiao Tong University.