Introduction
Soil nutrient deficiency is a major factor in determining current yield levels in Sub-Saharan Africa (SSA) (IIRR, 2002). Studies show that the majority of soils in smallholder fields in SSA are depleted and that nutrient depletion is ongoing (van Beek et al., Reference van Beek, Elias, Selassie, Heesmans, Segaye, Feyisa, Tolla, Melmuye, Gebremeskel and Mengist2016). Contributing factors include unbalanced and low levels of fertilizer application, complete removal of crop residues and dung burning for household fuel (Elias, Reference Elias2016; Elias et al., Reference Elias, Morse and Belshaw1998; Stoorvogel and Smaling, Reference Stoorvogel and Smaling1990). Fertilizer use intensity in SSA is estimated to be less than 1% of the world average (Kelly and Naseen, Reference Kelly and Naseen2009; Yamano and Kijima, Reference Yamano and Kijima2010). The average fertilizer use intensity from 2000 to 2003 in SSA was 9 kg ha−1, compared to 86 kg ha−1 in Latin America, 104 kg ha−1 in South Asia, 142 kg ha−1 in Southeast Asia (Crawford et al., Reference Crawford, Jayne and Kelly2006), and 288 kg ha−1 in Europe and USA (Hernandez and Torero, Reference Hernandez and Torero2011). According to Mutegi et al. (Reference Mutegi, Kabambe, Zingore, Harawa and Wairegi2015), one of the major challenges for effective nutrient management in SSA is the lack of site-specific fertilizer recommendations that are appropriate for the socioeconomic conditions of the farmers. Fertilizer recommendations in SSA are mostly generalized for all soil types and ecological conditions, irrespective of the huge diversities in the biophysical, ecological, and socioeconomic conditions. This blanket fertilizer recommendation approach has resulted in low fertilizer use efficiency, low factor productivity, and development of multi-nutrient deficiency in soils, ultimately leading to declining crop productivity and low farmer profitability.
Like many places in SSA, the agriculture sector in Ethiopia is dominated by smallholder farmers and characterized by low productivity partly due to declining soil fertility (Belachew and Abera, Reference Belachew and Abera2010; Scoones and Toulmin, Reference Scoones and Toulmin1999). Improving the productivity, profitability, and commercialization of agriculture has been the major agricultural policy concern in recent years (Belay et al., Reference Belay2003; Gebremedhin et al., Reference Gebremedhin, Hoekstra and Tegegne2006). Fertilizer application is one of the yield-enhancing strategies and constitutes a central focus of the Ethiopian agricultural extension policy (Abebayehu et al., Reference Abebayehu, Misginaw, Abraham, Solomon, Alemayehu and Bayu2014). The extension system uses a package approach that consists of improved seed, blanket recommendation for fertilizer application, and cultural agricultural practices (tillage, row planting, seeding rate, pest control, etc.). However, the use of both improved seed and fertilizer is still quite limited despite government efforts to encourage their adoption (Yu and Nin-Pratt, Reference Yu and Nin-Pratt2014). In fact, a study by the World Bank indicates that much of the increase in production over the past decade can be explained by area expansion rather than by widespread productivity growth (World Bank, 2011). Another study, conducted under controlled conditions, showed that adoption of the complete package by smallholder farmers [use of certified wheat seed, lower seeding rates, row planting, and balanced use of urea and di-ammonium phosphate (DAP)] increased wheat (Triticum aestivum) yields by approximately 14% (Abate et al., Reference Abate, Bernard, de Brauw and Minot2018). Combined use of fertilizer and improved seeds for strategic crops such as maize and wheat resulted in 12% production growth between 2003/2004 and 2007/2008 (IFPRI, 2010). However, the reported yield gain is not enough to match increasing demand for food by the ever-growing population of Ethiopia. Moreover, additional cultivable lands in the highlands have become scarce. Therefore, Ethiopia has strong incentives to improve future agricultural outputs through increased use of fertilizers along with other yield-enhancing interventions.
Until recently, fertilizer selection was limited to N and P resulting in unbalanced nutrient supply and mining of the soils for other nutrients. The agricultural extension system has issued a national blanket recommendation of 100 kg DAP (18–46% N-P2O5) and 100 kg urea (46% N) per ha for most cereals, except for barley (100-50 kg DAP-urea ha−1). According to a previous diagnostic study, the average actual fertilizer use in cereal crops is 45 kg ha−1 (IFPRI, 2010), while the average nutrient consumption is 26 kg ha−1 (FAO, 2017), far below the recommendation. Low and sub-optimal fertilizer application is further reflected in the low fertilizer use efficiency (kg grain yield per kg nutrient) which ranges between 9 and 17 kg grain of maize per kg N in Ethiopia, compared to Tanzania where it is 18–36 kg maize grain per kg N (IFPRI, 2010). This limited fertilizer effectiveness needs to be addressed by generating site-specific information (Kihara et al., Reference Kihara, Nziguheba, Zingore, Coulibaly, Esilaba, Kabambe, Njoroge, Palm and Huising2016). To this effect, the first step is to understand the determinants of fertilizer and its use intensity by major crops. Understanding the determinants of fertilizer use among smallholder farmers is crucially important to guide the extension system components and messaging. Therefore, this study was conducted to explore the socioeconomic and biophysical determinants of fertilizer use in the 30 high potential highland districts of Ethiopia. The study sets out to identify drivers and pathways to promote more rapid and extensive use of fertilizer.
Material and Methods
Theoretical model and empirical specifications
According to the von Neumann–Morgenstern utility function, farmers, as decision-makers, are assumed to maximize expected utility (EU) function defined over alternatives (W). In this case, when confronted with a choice between two alternative practices, the ith farmer compares the EU with the modern intervention (MI) to the EU with the traditional intervention (TI). While direct measurement of farmers’ perceptions and risk attitudes on farming technology are not available, inferences can be made for variables that influence the distribution and EU evaluation of the technology. These variables are used as a vector ‘X’ of attributes of the choices made by farmer ‘i’ and ϵ i is a random disturbance that arises from unobserved variation in preferences, attributes of the alternatives, and errors in optimization. Given the usual discrete choice analysis and limiting the amount of non-linearity in the likelihood function, EUmi (W) and EUti (W) may be written as:
 $${\rm{E}}{{\rm{U}}_{mi}}\;(W) = {\alpha _m}\,{{\rm{X}}_i} \;+ \;{\epsilon _{mi}} \ldots $$
 $${\rm{E}}{{\rm{U}}_{ti}}\;(W) = {\alpha _t}\,{{\rm{X}}_i} \;+\; {\epsilon _{ti}} \ldots $$
The difference in EU may then be written as:
 $${\rm{E}}{{\rm{U}}_{mi}}\;({\rm{W}}) - {\rm{E}}{{\rm{U}}_{ti}}\;({\rm{W}}) = ({\alpha _m}\,{{\rm{X}}_i} + {\epsilon _{mi}}) - ({\alpha _t}\,{{\rm{X}}_i} + {\epsilon _{ti}}) = ({\alpha _m} - {\alpha _t})\;{{\rm{X}}_i} + ({\epsilon _{mi}} - {\epsilon _{ti}}) = \alpha \,{{\rm{X}}_i} + {\epsilon _i} \ldots $$
A preference for the MI will result if EU mi (W) − EU ti (W) > 0, whereas a preference for the TI will be revealed if EU mi (W) − EU ti (W) < 0. The observed adoption choice of an agricultural technology (e.g., the use of fertilizers) is hypothesized to be the end result of socioeconomic characteristics of farmers and a complex set of inter-technology preference comparisons made by farmers (Adesina and Forson, Reference Adesina and Forson1995). The empirical analysis permits investigation of the decision whether or not to adopt fertilizers and the conditional level of the technology (amount of fertilizer to be used) if the initial adoption decision was made. Several hypotheses can be derived on these two sets of decision – factors that affect adoption and factors that affect intensity of fertilizers use.
Study area, sampling procedure, and data source
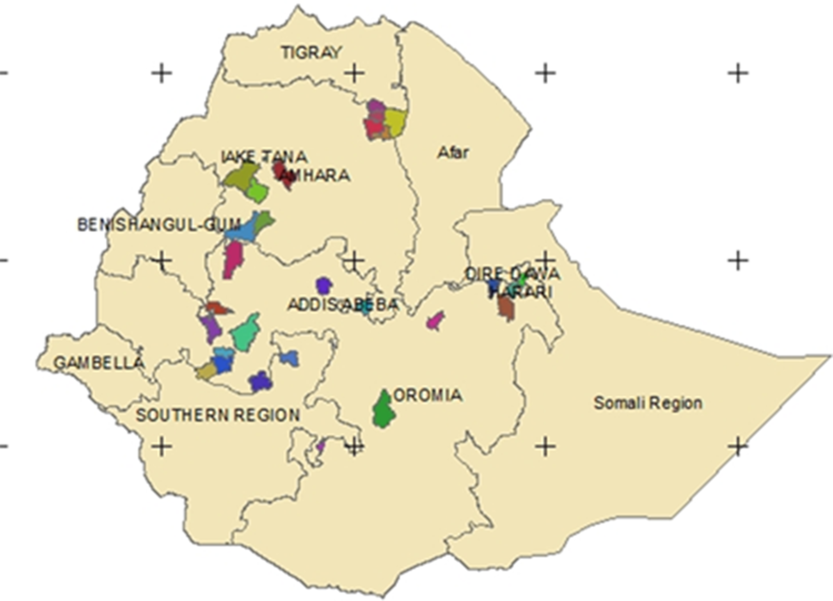
This study involved extensive surveys administered among smallholder farmers in Ethiopia to collect data on fertilizer use and decision-making processes. The study was conducted in 30 high potential districts of the Ethiopian highlands during the 2013/2014 cropping season covering the 4 main administrative regions. The main rainy season in Ethiopia usually starts in early June and extends up to September. Figure 1 presents the locations of the study districts, which are a subsample of the high potential agricultural districts identified by the National Agricultural Growth Program. Sample districts were selected using consecutive sampling techniques. A structured questionnaire was prepared and pretested in all study districts. Then, 2880 households were systematically selected from strata of model and non-model farmersFootnote 1 using a simple random procedure to compare farmers’ typology linkage with optimal fertilizer application.
The questionnaire captured data on type of cereal cultivated, amount of fertilizer applied and optimal rate, land allocation in 2013 crop season, household demography and household resource endowment, access to institutional services and infrastructure, location, and agroecology. Five major cereals that account for the bulk of food production and fertilizer consumption in the Ethiopian highlands were considered. These include tef (Eragrostis tef Zucc), maize (Zea mays), wheat (Triticum aestivum), barley (Hordeum vulgare), and sorghum (Sorghum bicolor). Actual fertilizer use against the recommended application rate (as defined by the extension system) was computed for each cereal crop and land allocation. Household characteristics included demography (sex, age and educational of household head, family size, dependency ratio, and education status) and household resource endowment (e.g., farm size, livestock ownership, annual gross income, etc.). Spatial variables included proximity to all-weather road, distance to market and farmer training centers, and agroecological zone, and institutional factors such as membership to cooperatives and contact with extension agents were also collected and analyzed. Survey data were analyzed using regression and probit models to detect factors contributing to decisions on fertilizer use and rate of application.
Econometric specification: the double hurdle model
Double hurdle (DH) model, also known as two-tier model, is a corner solution model in which zero values associated with non-participation are assumed to be the outcome of rational choice (Wooldridge, Reference Wooldridge2002). It is an extension of the Tobit model, but relaxes the restriction imposed by the Tobit model by allowing different mechanisms to determine the discrete probability of participation and volume of fertilizer applied, conditional on participation. The DH model is more flexible and appropriate for this dataset and study than the Tobit model because it allows for consideration that household-related characteristics, location-specific factors, and access to institutional services may affect a farmer’s decision to apply fertilizer. However, once the decision to apply has been made, different set of factors may affect the quantity applied. The DH model also allows the same factor to affect participation and amount applied in different ways. Therefore, the DH model proposed by Cragg (Reference Cragg1971) was implemented in this study. This model has been widely applied to technology adoption and other utility maximization decisions (Adeyemo and Salman, Reference Adeyemo and Salman2016; Danso-Abbeam et al., Reference Danso-Abbeam, Dagunga and Sedem Ehiakpor2019; Holden and Quiggn, Reference Holden and Quiggin2017). The Cragg’s model assumes that farming household heads make two sequential decisions with regard to adoption and intensity of use of fertilizers. The first hurdle is the fertilizer adoption equation, estimated by using a probit model as described below:
 $${\rm{d}}{{\rm{*}} \over i}{\rm{ = X}}{{\rm{'}}_{{\rm{1i}}}}{\beta _{\rm{1}}}{\rm{ + }}{\mu _{\rm{i}}},{\mu _{\rm{i}}}\tilde{\rm{N}}({\rm{0}},{\rm{1}}) \ldots $$
 $${{\rm{d}}_i} = \{ 1\,{\rm{if}}\,{\rm{d}}_i^* > 0\,\;{\rm{and}}\,\;{\rm{is}}\,\;0\,{\rm{if}}\,{\rm{d}}_i^* \le 0\} $$
where d i * is the latent discrete adoption choice variable that denotes binary censoring, X’ 1i is vector of explanatory variables hypothesized to influence adoption choice, and β i is vector of parameters. μ i is the standard error term and is the observed quantity of fertilizer representing the respondent’s participation decision (i.e., 1 = the respondent is reporting fertilizer intensity greater than 0 and 0 = otherwise).
The second hurdle involves an outcome equation, which uses a truncated model to determine the extent of fertilizer use. This stage uses observations only from farming household heads that reported positive, or greater than, optimum fertilizer use intensity. The truncated model, which closely resembles the Tobit model, was expressed as:
 $${{\rm{Y}}^*}_i = {\rm{ X}}{{\rm{'}}_{{\rm{2i}}}}{\beta _{\rm{2}}}{\rm{ + }}{{\rm{v}}_{\rm{i}}}_{\rm{i}}\;\tilde\;\;{\rm{N}}({\rm{0}},{\delta ^{\rm{2}}}) \ldots $$
Location map of the 30 study districts in the Ethiopian highlands.

Y i is the observed fertilizer use intensity for the sample respondents. Y is the amount of fertilizer use intensity where individual sample households applied for crop production.
As shown by Katchova and Miranda (Reference Katchova and Miranda2004), the log-likelihood for the Tobit model consists of the probabilities for non-approval and a classical regression for the positive values of α:
 $$InL = {\sum _{{\alpha _i} = 0}}{\rm{ }}In\phi {\rm{ }} - {{{x_i}{\beta'}_\alpha } \over {{\rm{ }}\sigma }}{\rm{ }} + \sum\limits_{{\alpha _i}{\rm{ > }}0} {In} \left[ {{\rm{ }}{1 \over \sigma }\phi {\rm{ }}\left( {{{{\alpha _i} - {x_i}{\beta'}_\alpha } \over \sigma }{\rm{ }}} \right)} \right]$$
Cragg (Reference Cragg1971) relaxed the assumption that the same covariates and the same parameter vector affect both the loan approval decision and the loan volume decision. Following Cragg, this study considers a hurdle model in which a lender makes a two-step decision. In the first step, a probit model represents a farm household’s decision to apply fertilizer (Ci):
 $$P({{\rm{C}}_{\rm{i}}}{\rm{ = 0}}) = \varphi ( - \Upsilon {\rm{'}}{Z_i})$$
If this hurdle is crossed and a fertilizer use intensity (volume) decision is made (C i = 1), a truncated regression (equation 6) describes the choice of how much fertilizer to apply (α i > 0). The log-likelihood in Cragg’s model is thus a sum of the log-likelihood of the probit model (the first two terms) and the log-likelihood of the truncated regression model (the second two terms) (Katchova and Miranda, Reference Katchova and Miranda2004):
 $$InL = \sum\limits_{{\alpha _i} = 0} {In\phi ( - {\gamma \hskip 1pt'}{Z_i})} \sum\limits_{{\alpha _i} \gt 0} {\left\{ {In\phi ({\gamma \hskip 1pt'}{Z_i}) + In\left[ {{1 \over 2}\phi \left( {{{{\alpha _i} - \beta _\alpha '{x_i}} \over \sigma }} \right) - In\phi \left[ {{{\beta _\alpha '{x_i}} \over \sigma }} \right]} \right]} \right\}} $$
Results
Descriptive statistics and definition of the variables used in econometric model
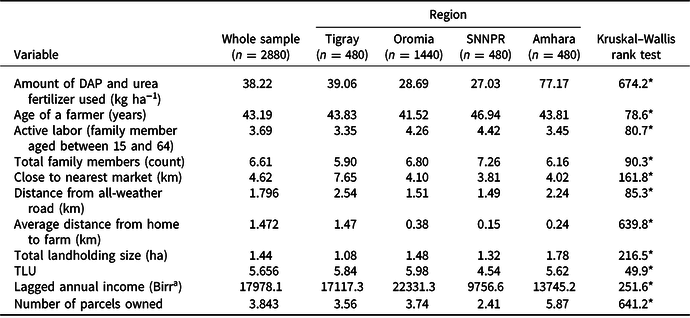
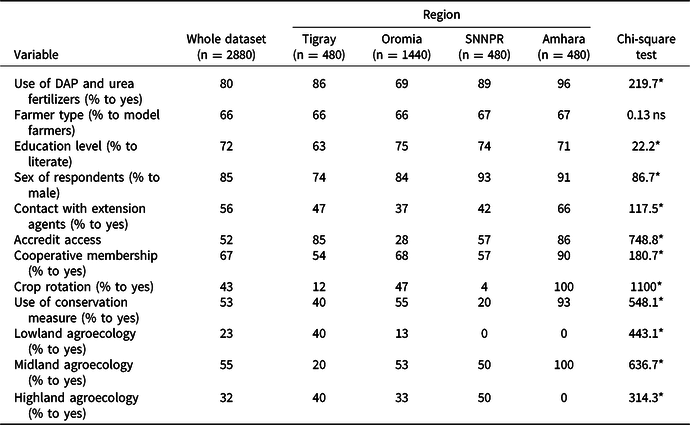
Table 1 summarizes the statistics of the dataset and shows significant differences between the regions, especially for distances to markets and roads and annual incomes. Table 2 summarizes the variables of the dataset and shows that 80% of surveyed households use fertilizer for cereal. The chi-square tests in Table 1 showed there was statistically significant variation among regions in, for instance, access to institutional services like extension, credit, and cooperative membership.
Mean descriptive statistics of continuous variables (%) per region

Note: Shapiro–Wilk and Shapiro–Francia tests for normality reject the null hypothesis at 0.05 for variables considered. aIn 2013, the average conversion of USD to Ethiopian Birr was 1 USD = 18.627 ETB (Source: www.ceicdata.com/World%20Bank).
*Significant (p < 0.001).
Descriptive statistics of variables (%)

ns, not significant.
*Significant (p < 0.001)
Fertilizer use
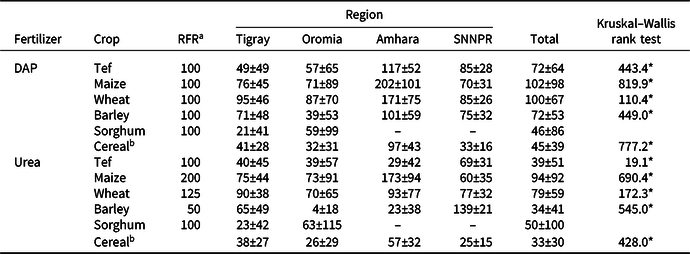
The majority of farmers (80%) in the study area used fertilizer in cereal crops (Table 2). There were significant (p < 0.01) regional differences, with the highest proportion of households applying fertilizer (96%) in Amhara, followed by Southern Nations, Nationalities, and Peoples’ Region (SNNPR) (89%), Tigray (86%), and Oromia (69%), respectively. The average rate of DAP and urea applied was calculated with average for tef, maize, wheat, barley, and sorghum as 72, 102, 100, 72, and 46 kg ha−1, respectively (Table 3). The application level of urea fertilizer for the same crops was 39 kg ha−1 for tef, 94 kg ha−1 for maize, 79 kg ha−1 for wheat, 34 kg ha−1 for barley, and 50 kg ha−1 for sorghum. Based on these findings, only maize and wheat crops received the average recommended amount of DAP fertilizer while none of the crops received recommended amount of urea. According to Kefyalew (Reference Kefyalew2011), the average application rate of DAP and urea combined per hectare of cultivated land was 57 kg ha−1 for wheat, 40 kg ha−1 for tef, 29 kg ha−1 for maize, and 22 kg ha−1 for barley.
DAP and urea fertilizer applications by crop and combined for major cereals (kg ha−1) per region

aRFR is the recommended fertilizer rate promoted by the agricultural extension system (kg ha−1).
bThe cereal crops considered in this study are tef, maize, wheat, barley, and sorghum only.
*Significant (p < 0.001).
Fertilizer use for cereal crops
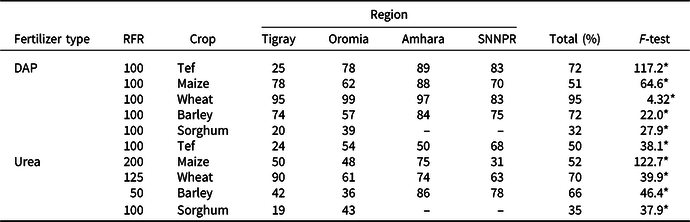
DAP was more extensively used than urea for all cereal crops, except for sorghum (see Table 4). The percentage of farmers who used optimal fertilizers rate is presented in Table 5. For tef, farmers applied 72% of the recommended rate of DAP but only 50% of the recommended urea. For maize, the highest level of DAP application in relation to the recommended was in Amhara region, followed by Tigray. Farmers growing wheat applied 95% of the recommended rate of DAP. Despite the low intensity of urea fertilizer applied compared to DAP for all crops, wheat received the highest rate while sorghum the lowest for both DAP and urea. The one-way analysis of variance showed that the fertilizer use intensity varied significantly across regions for all crops.
Difference from recommended fertilizer rate per crop and per region (%)

Note: The use intensity percentage is computed based on the RFR for the respective crops and represented farmers who use optimal rate.
*Indicates significant difference (p < 0.001).
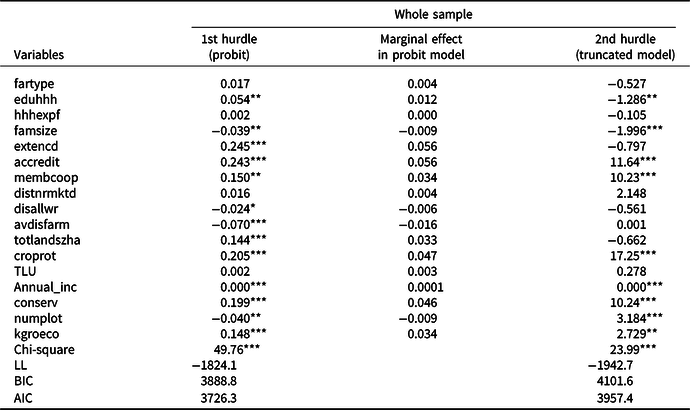
Maximum likelihood estimates of double hurdle models for adoption and optimum fertilizer use intensity in selected regions of Ethiopia

Fartype, farm type; Eduhhh, education level household head; hhhexpf, household expenditures on farm inputs; farmsize, farm size; extencd, access to extension services; accredit, access to credit; membcoop, membership to primary cooperative; distnrmktd, distance to nearest market; disallwr, distance to all-weather road; avdisfar, average distance between plots to the farm; totlanszha, total land size; croprot, crop rotation; TL, tropical livestock units; annual inc, annual income; conserve, application of conservation methods; numplot, number of plots, agroeco, agroecological zone.
*** significant at 1%, ** significant at 5%, * significant at 10%.
Estimation results
The maximum likelihood estimates of the independent DH model for fertilizer use intensity, the likelihood ratio, and the information criteria attest to the reliability of the model by region as shown in Table 5. The results show that factors influencing the two-stage decision relating to adoption and fertilizer use intensity can well be expressed using the independent DH model. Coefficients in the first hurdle indicate how a given decision variable affects the likelihood (probability) to adopt fertilizer. Those in the second hurdle indicate how decision variables influence the level of fertilizer usage. The result of the first hurdle (probit model) indicates that education status of the household head, family size, active labor force, access to extension service, access to credit, membership to cooperatives, distance to all-weather road, average distance to farm plots, farm size, use of crop rotation, number of farm plots owned, annual gross income, and agroecologyFootnote 2 are all significant decision variables influencing the probability of adopting fertilizer technology. The marginal effects of the probit model show changes in the probability of fertilizer adoption to increase with, predominantly, increasing access to credit, cooperative membership, farm size, application of soil and water conservation, and medium and highland agroecology. On the other hand, probability of fertilizer adoption decreased, predominantly, with increasing distances to fields, roads, and markets. The fertilizer use intensity among the farm households was influenced by education status of household head, family size, access to credit, membership to cooperatives, use of crop rotation, annual income, number of farm plots owned, use of soil and water conservation, and agroecology. Differences between regions were mainly found in crop rotation and Tropical Livestock Units (TLUs) (Table 5).
Discussion
According to Ariga et al. (Reference Ariga, Jayne, Kibaara and Nyoro2008), fertilizer use intensity in Ethiopia is on average 17 kg ha−1, which is comparable to application rates elsewhere SSA but low when compared to the smallholder highland farms in Kenya and the rest of the world. Several authors reported that this low fertilizer use is due to market and non-market-based constraints, for example, high cost of fertilizers and lack of varieties (Agbahey et al., Reference Agbahey, Grethe and Workneh2015; Dercon and Christiaensen, Reference Dercon and Christiaensen2011; EEA, 2006; Matsumoto and Yamano, Reference Matsumoto and Yamano2009). This study shows higher rates of fertilizer application for major crops (Table 4) and this can be explained by increasing supply and availability of fertilizers, as well as improvements in extension support over the last few years. Moreover, the present study targeted high agricultural potential areas, which may create a bias when compared to the national average.
This study showed that access to credit, cooperative membership, farm size, the application of soil and water conservation practices, and agroecological zones were main factors determining the fertilizer adoption and intensity of use (Table 5). Our results are in line with those of Gebremedhin et al. (Reference Gebremedhin, Jaleta and Hoekstra2009).
Farmers living in a lowland agroecological zones applied significantly lower levels of fertilizer when compared to farmers in the midland and highland agroecological zones (Table 5). This difference is associated with drought risks in the lowlands. In agreement with Kassie et al. (Reference Kassie, Shiferaw and Geoffrey2011) and Pender and Gebremedhin (Reference Pender and Gebremedhin2007), this study found that fertilizers provide a higher crop return per hectare in wetter areas than in the drought prone areas suggesting that agroecology influences the level of fertilizer application. The negative and significant influence of agroecology at less than 1% significance level was also reported by another study in southern Ethiopia (Endrias et al., Reference Endrias, Ayalneh, Belay and Elias2013). Model farmers are more likely to use fertilizer compared to non-model farmers although not statistically significant (Table 5).
Access to credit and cooperative memberships were the two institutional factors that were found to positively and significantly influencing the level of fertilizer use. A change in farmers’ status from not accessing credit to accessing credit, and from non-membership to membership of cooperatives significantly enhanced fertilizer use intensity. Endale (Reference Endale2010) also reported the positive and significant influence of credit on fertilizer adoption. The major reason for the positive influence of access to finance is the agricultural production gap between land preparation and gathering of the final output. Small farmers have difficulties in financing the lag between application of fertilizer and the generation of return, and access to credit fills this gap and boosts the adoption of fertilizer and other agricultural inputs.
Two explanatory variables related to resource endowment turn out to influence fertilizer application on cereal crops. These are tropical livestock units and gross annual income. A unit increase in tropical livestock unit can increase fertilizer application by 0.32 kg. Similarly, gross annual income positively and significantly influences fertilizer application on cereal at 1% level of significance (Table 5). Livestock affects fertilizer adoption in many ways. The direct effect is that farmers can sell their livestock to finance fertilizer or that livestock can serve as collateral for fertilizer credit. These results agree with Endale (Reference Endale2010), who reported the significant and positive influence of livestock ownership on levels of fertilizer application. Plots located far from homestead were found to receive less fertilizer and as landholding size increased, fertilizer application declined (Table 5). Similar result was reported by another study done in the Tigray region (Gebreselassie and Sanders, Reference Gebreselassie and Sanders2006). Apparently, farm size can both indicate extensive (low fertilizer) systems in dry land areas as to well-endowed farms in high potential areas.
Conclusion
The study showed that farmers’ decision to adopt fertilizer and the decision on the intensity of use of fertilizer are two independent decisions. In spite of some region-specific differences, the most important factors are household resource endowments (livestock ownership, farm size, etc.), institutional services (credit and membership to cooperatives), infrastructure (proximity to markets and roads), and communities’ indigenous knowledge (crop rotation, use of soil and water conservation). Policies to increase fertilizer uptake could, for instance, include strengthening cooperatives, access to credits, and infrastructure development. This study highlights that, to increase fertilizer uptake, a concerted effort is needed which goes beyond the traditional supply push strategy.
Acknowledgements
This research was funded by the Netherlands Embassy in Ethiopia through the Capacity Building for Scaling up of Evidence Based Best Practice in Agricultural Production in Ethiopia (CASCAPE) project. The authors wish to thank the Netherlands Embassy for financial support and all technical staff involved in data collection and data management.