1. Introduction
Supercavitation is a special case of cavitation which can be employed to create a bubble of gas inside water, large enough to encompass an object travelling through it. It greatly reduces the skin friction drag on the object, enabling achievement of high speeds under water. The creation of a supercavity is thus of great interest for naval applications, e.g. high-speed underwater vehicles. From an initially non-cavitating flow, the conditions required for a moving object underwater to form a natural supercavity are very stringent. Therefore, ventilation is generally used to form a supercavity artificially, by blowing non-condensable gas into the low-pressure region at the rear part of the moving object. Ventilated supercavitation has been investigated by many prior researchers through analytical, experimental and numerical approaches. This process generally depends on the physical parameters such as incoming velocity
 $(U)$
, ventilation flow rate
 $(\dot{Q}_{A})$
, ambient pressure
 $(P_{\infty })$
, cavity pressure
 $(P_{C})$
and cavitator diameter
 $(d_{C})$
. These parameters are commonly expressed using following dimensionless groups: Froude number,
 $Fr=U/\sqrt{gd_{C}}$
; air entrainment coefficient,
 $C_{Q}$
 $=\dot{Q}_{A}/Ud_{C}^{2}$
; cavitation number,
 ${\it\sigma}_{C}=(P_{\infty }-P_{C})/(1/2{\it\rho}U^{2})$
etc., where
 $g$
and
 ${\it\rho}$
denote gravitational acceleration and water density, respectively. The prior studies in the area of ventilated supercavitation focus on deriving empirical or semi-empirical relations for these dimensionless quantities to characterize supercavity geometry and ventilation demand, which is the amount of gas required to form and sustain a supercavity (Epshtein Reference Epshtein1973; Logvinovich Reference Logvinovich1973; Spurk & König Reference Spurk and König2002). It has been shown that the ventilation demand depends not only on the flow conditions, but also on specific features of the flow patterns in the cavity sealing zone, commonly referred to as the closure mechanism or closure mode (Logvinovich Reference Logvinovich1973). Although a variety of supercavity closure modes have been identified and studied separately, there is no universally accepted theory on the relationship between closure mechanism and ventilation demand as yet (Semenenko Reference Semenenko2001a
). To accurately estimate gas requirements for underwater applications using supercavitation, it would be profitable to systematically study the closure mechanisms under different flow conditions and determine the criteria that govern the transition among different closure modes.
To date, many authors have studied different closure modes, and the empirical relationships governing different closure modes have been discussed (e.g. Cox & Clayden Reference Cox and Clayden1956; Campbell & Hilborne Reference Campbell and Hilborne1958; Kapankin & Gusev Reference Kapankin and Gusev1984; Semenenko Reference Semenenko2001a
; Kawakami & Arndt Reference Kawakami and Arndt2011). In the published literature on ventilated supercavitation, four main closure modes have been widely reported: re-entrant jet (RJ), twin vortex (TV), quad vortex (QV) and pulsating cavity (PC). The RJ closure is reported to occur when Fr is high, i.e. when the effect of gravity is not significant. In such a case, the hydrostatic pressure gradient is negligible as compared to the dynamic forces and thus the cavity closely resembles an axisymmetric shape. The cavity rear end fills with foam which is periodically ejected in the form of toroidal vortices (Semenenko Reference Semenenko2001a
). The TV closure is usually observed at low Fr and
 ${\it\sigma}_{c}$
values, when the effect of gravity becomes predominant. According to Cox & Clayden (Reference Cox and Clayden1956), for TV closure, the locus of the centroids of the cavity section tends to rise under buoyancy forces, and the cavity is effectively cambered upwards and is no longer axisymmetric. The circulation set-up around the supercavity due to the hydrostatic pressure gradient produces a lift force which is equal and opposite to the buoyancy force on the bubble. This circulation about the cavity mid-plane, associated with this lift force, sheds downstream in the form of two counter-rotating vortices. Thus, this streamwise vorticity due to the cavity asymmetry eventually splits the supercavity lengthwise into two vortex tubes through which the ventilation air escapes out of the supercavity. Although a significant number of studies have been conducted to investigate the criteria for the formation of TV and RJ closure and their transitions (e.g. Campbell & Hilborne Reference Campbell and Hilborne1958; Buyvol Reference Buyvol1980; Spurk & König Reference Spurk and König2002), there is a lack of agreement on the empirical formulations and physical phenomena reported from different studies (e.g. Peng et al.
Reference Peng, Wang, Pan and Yan2006; Zhang et al.
Reference Zhang, Wei, Zhang, Wang and Yu2007; Zhou et al.
Reference Zhou, Yu, Min and Yang2010; Kawakami & Arndt Reference Kawakami and Arndt2011; Skidmore et al.
Reference Skidmore, Brungart, Lindau and Moeny2015). For instance, the first such empirical criterion for transition was given by Campbell & Hilborne (Reference Campbell and Hilborne1958) based on experiments conducted in a whirling arm channel for a limited range of Fr from 5 to 25. Their experiments show that a RJ cavity occurs at
 ${\it\sigma}_{C}Fr>1$
, and a TV cavity forms at
 ${\it\sigma}_{C}Fr<1$
. Later, Buyvol (Reference Buyvol1980) proposed the criterion for the existence of a RJ cavity as
 ${\it\sigma}_{C}^{1.5}Fr^{2}>1.5$
. More recently, a slightly different condition for a RJ cavity is provided by Spurk & König (Reference Spurk and König2002) as
 ${\it\sigma}_{C}Fr^{2}>1$
. However, contrary to the published reports, experiments at Saint Anthony Falls Laboratory (SAFL) show that the RJ closure occurs at low Fr, and is not observed even at very high values of
 ${\it\sigma}_{C}Fr$
(Kawakami & Arndt Reference Kawakami and Arndt2011). Similar to Kawakami & Arndt (Reference Kawakami and Arndt2011), many other studies reported only one closure mode across a wide range of
 ${\it\sigma}_{C}$
and Fr, and found other types of closures to be conspicuously unattainable. For example, some studies have only reported the occurrence of a TV closure in their closed-wall water tunnel (e.g. Cox & Clayden Reference Cox and Clayden1956; Kawakami Reference Kawakami2010; Zhou et al.
Reference Zhou, Yu, Min and Yang2010) or free-surface channel (e.g. Campbell & Hilborne Reference Campbell and Hilborne1958), while others only observe a RJ closure in a closed-wall water tunnel facility (e.g. Gadd & Grant Reference Gadd and Grant1965; Skidmore Reference Skidmore2013). The QV mode is a special case of a stable vortex closure, where each vortex of the TV further splits into two such that one pair of vortices lies above the other. The QV was first reported by Kapankin & Gusev (Reference Kapankin and Gusev1984), and more recently by Kawakami & Arndt (Reference Kawakami and Arndt2011) at low Fr and
 $C_{Q}$
values. However, the formation mechanism and criterion for this closure are not well understood. The PC closure, first observed by Silberman & Song (Reference Silberman and Song1961), has been reported in many other studies (e.g. Song Reference Song1961; Karlikov et al.
Reference Karlikov, Reznichenko, Khomyakov and Sholomovich1987; Semenenko Reference Semenenko2001a
,Reference Semenenko
b
; Skidmore Reference Skidmore2013), typically at high air entrainment rates. This regime is different from other closure types since the entire supercavity has a wavy surface, and the gas loss is primarily due to periodic ejections of an air–water mixture at the rear of the supercavity, causing great variation in its length. Akin to other closure modes, the conditions governing the occurrence of pulsating cavities are also not clear (Silberman & Song Reference Silberman and Song1961; Michel Reference Michel1984; Stinebring et al.
Reference Stinebring, Billet, Lindau and Kunz2001; Paryshev Reference Paryshev2003).
The observed discrepancies from the above-mentioned studies in predicting the supercavity closure mode can be attributed to several factors, e.g. the nature of experimental facility (e.g. towing tank, closed-wall tunnel versus free-surface facility, etc.), blockage (defined in terms of percentage as
 $B=d_{C}/D_{T}$
, where
 $D_{T}$
is the tunnel equivalent diameter) etc., but the exact bearings of the variation of these parameters on supercavitation phenomena are not understood on a fundamental physical level. Hence, in this study, we have attempted an in-depth investigation into the phenomena of supercavity closure in order to better understand the impact of flow conditions, including the blockage and the flow facility on the dynamics of ventilated supercavities.
The current paper is structured as follows: § 2 provides the details of the experimental methods. In § 3, experimental observations on supercavity closure under different flow conditions are reported. Subsequently, in § 4, we propose a theory to explain the occurrence of different supercavity closure modes observed in our experiments. The fundamentals are laid out in § 4 and are further extended to discuss the results of prior studies conducted across different experimental facilities and other characteristics of supercavitation in § 5.
2. Experimental methods
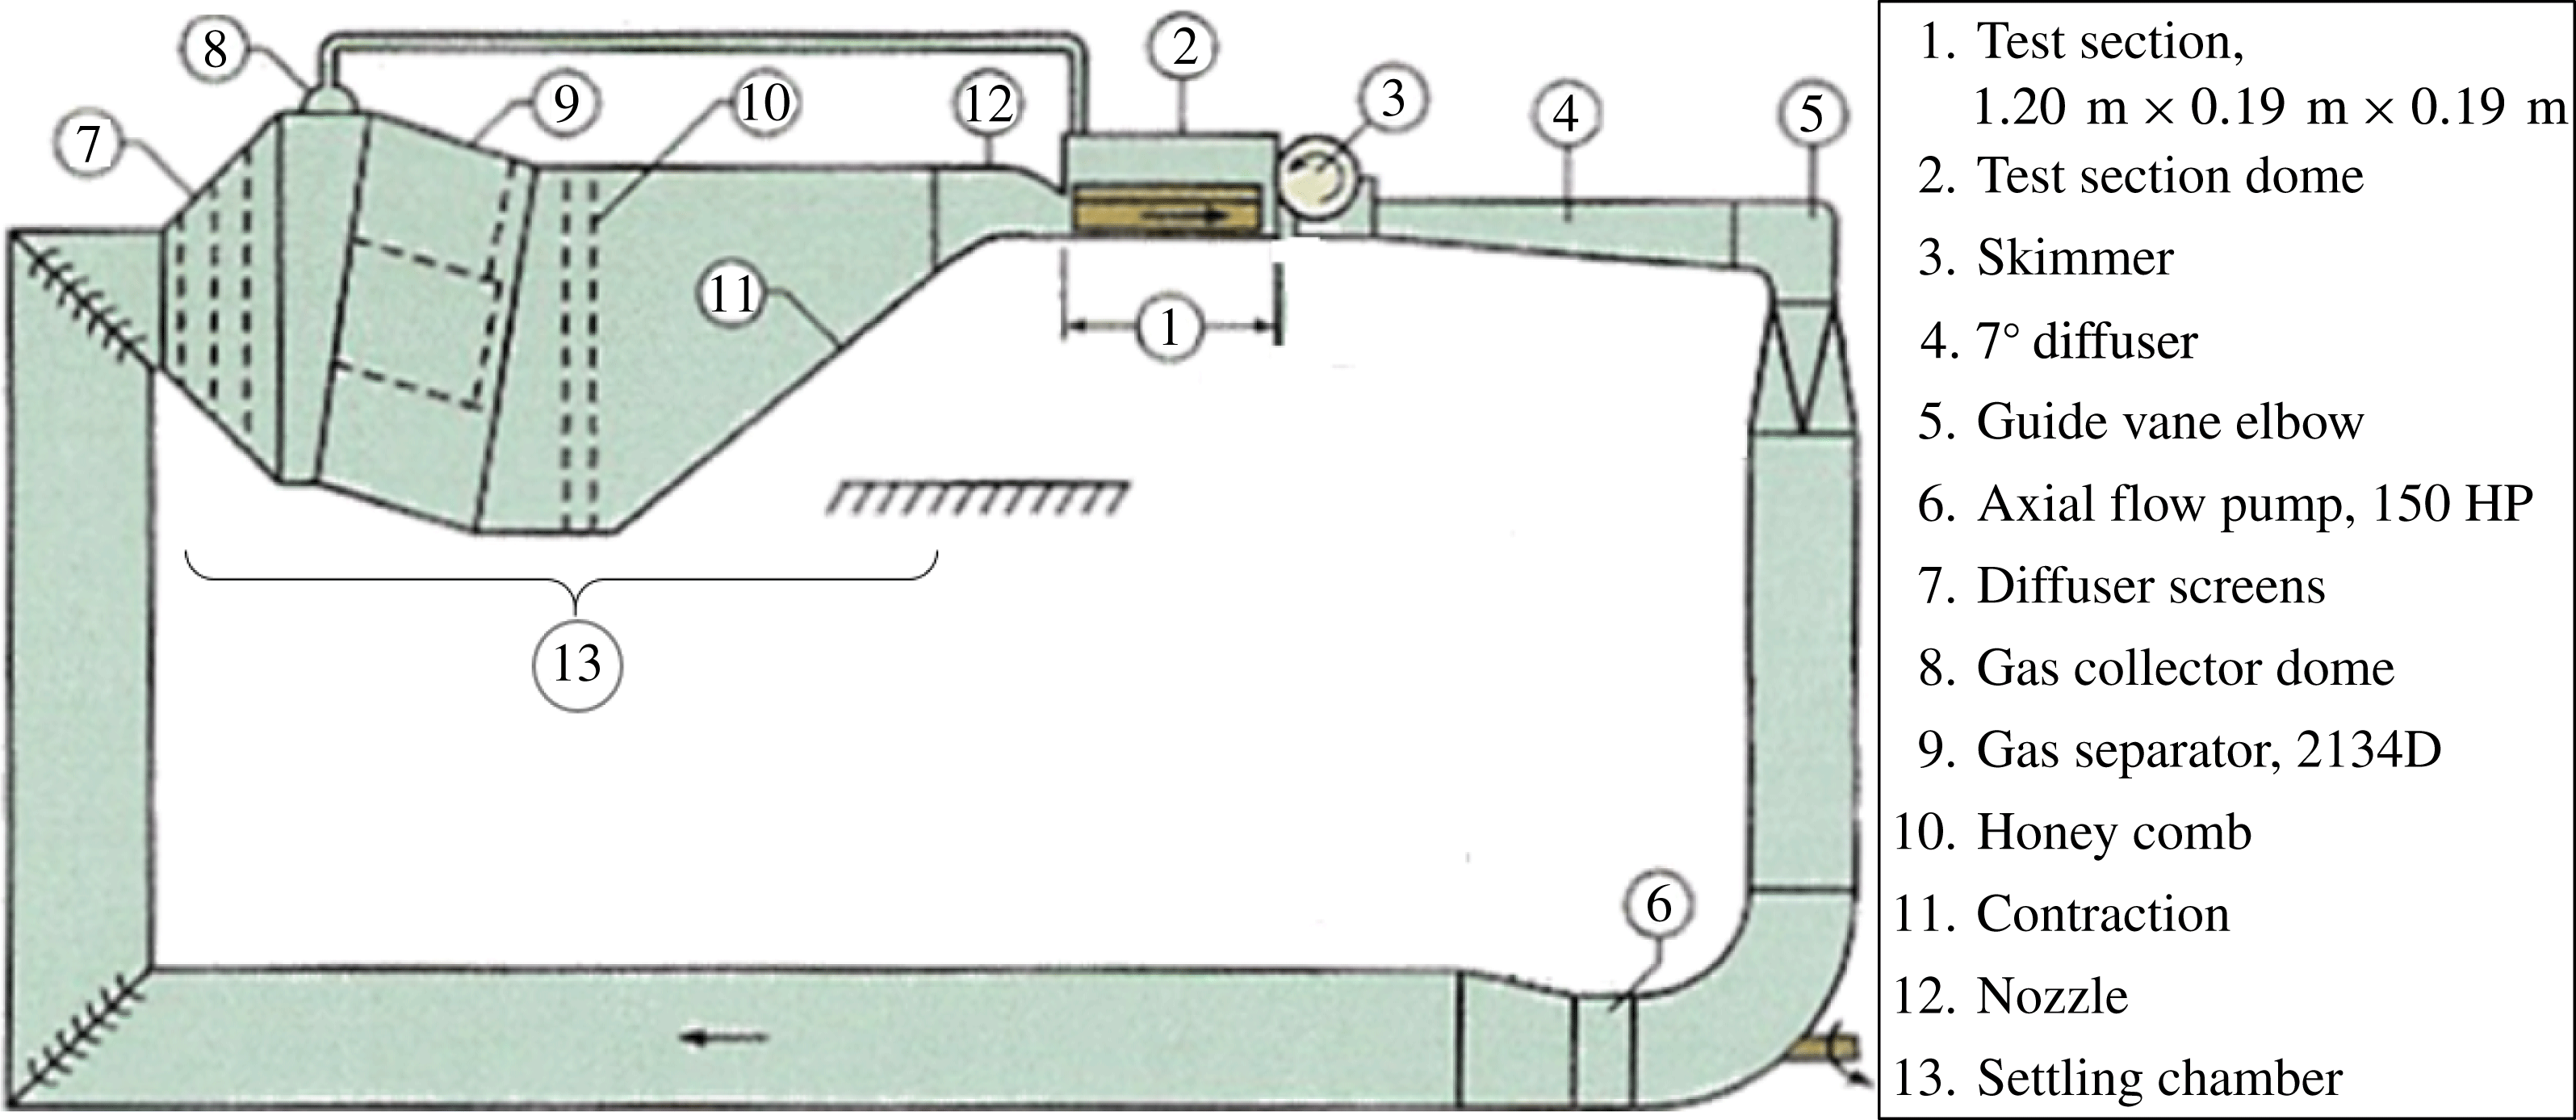
The experiments were conducted to image ventilated supercavity closure and to obtain the corresponding pressure measurements inside the cavity under different flow conditions. The study was conducted at the Saint Anthony Falls Laboratory’s high-speed water tunnel, which is shown as a schematic in figure 1. It is a recirculating, closed-jet facility with absolute pressure regulation. It has a horizontal test section of 1.20 m in length, with a
 $0.19~\text{m}\times 0.19~\text{m}$
square cross section (i.e. 0.21 m in hydraulic diameter). The two side walls and the bottom wall of the test section are made of Plexiglas for optical access. The tunnel is designed for cavitation and air ventilation studies and is capable of operating at a velocity in excess of
 $20~\text{m}~\text{s}^{-1}$
with a turbulence level of approximately 0.3 %. As shown in figure 1, the facility includes a large dome-shaped settling chamber, which provides for fast removal of the air bubbles generated during cavitation and ventilation experiments. This feature allows the cavitation experiments to be conducted for extended periods with little change in test-section conditions.
Schematic of the SAFL water tunnel facility.

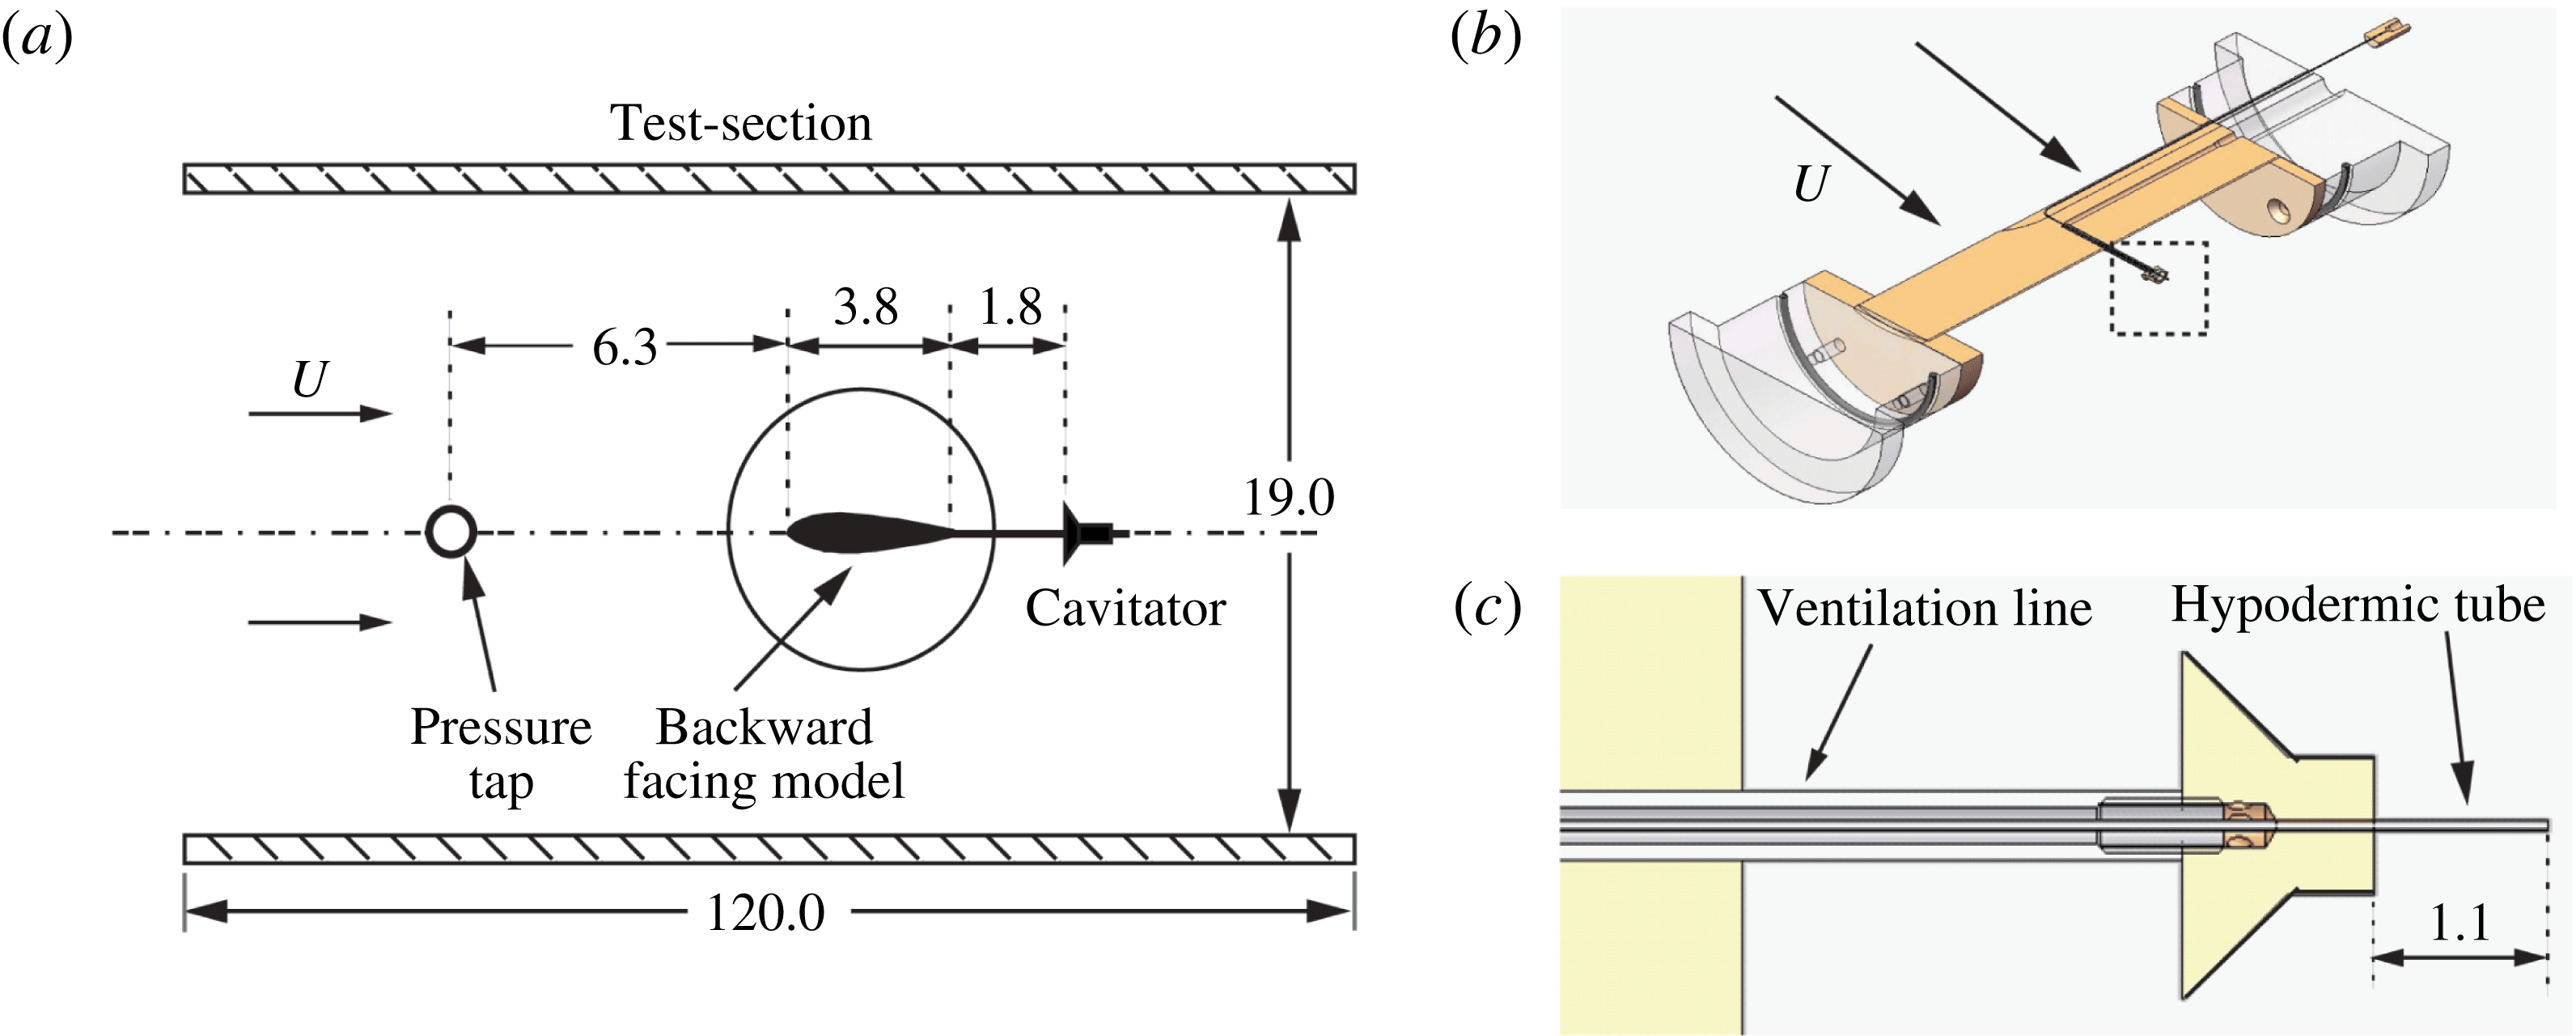
The ventilated supercavitation experiments were performed with the backward facing cavitator model, as described in Kawakami & Arndt (Reference Kawakami and Arndt2011) and shown in figure 2. In the backward facing model, a thin NACA0012 hydrofoil strut is placed upstream of the cavitator to avoid the interaction between the formed cavity and the strut body, leading to a free closure, as reported by Logvinovich (Reference Logvinovich1973). To minimize the disturbance to the flow, the thickness of the hydrofoil strut is just enough to envelope the ventilation pipe running to the cavitator. The maximum thickness and the chord length of the hydrofoil are 5 mm and 41 mm, respectively. The hydrofoil spans the test section and is mounted near its geometric centre. The angle of attack of the hydrofoil is measured between the axis of the test section and the axis perpendicular to the flat surface of the disk cavitator. For all the results reported in this paper, the angle of attack is fixed at
 $0^{\circ }$
with a measurement uncertainty of
 $\pm 0.5^{\circ }$
. Both the cavitators and the hydrofoil are made of brass and polished to a smooth finish. High-speed videos of the supercavity under such a configuration reveal that the thin and streamlined hydrofoil strut upstream does not produce a considerable disturbance, and only a slight wake signature is observed on the side of the cavity.
The images and the videos of the supercavity closure are obtained with a
 $1k\times 1k$
pixel Photon APX-RS camera, which is capable of acquiring
 $3000~\text{frames}~\text{s}^{-1}$
at full resolution. To ensure uniform backlighting in these videos and images, a light shaping diffuser is placed between the light source and the flow. Pressures in the test section and the supercavity are measured using two separate Validyne AP-10 pressure transducers. A Validyne DP-10 differential pressure transducer is employed to measure the differential pressure between the settling chamber and test section and is used to calculate test-section velocity. The pressure transducers are calibrated before each experiment and the pressure lines are purged with compressed air once before the pressure measurements are recorded at each condition. The calibrations are performed using a mercury manometer for both transducers. The pressure transducer calibrations are linear, with R-squared values typically 0.9999 or higher for both transducers. Standard errors of the pressure calibrations are approximately 0.1 kPa for both absolute pressure transducers. These errors lead to a maximum error of
 $0.11~\text{m}~\text{s}^{-1}$
in the velocity measurement, with a mean error of approximately
 $0.02~\text{m}~\text{s}^{-1}$
(Karn, Arndt & Hong Reference Karn, Arndt and Hong2015a
).
(a) A side view of the test section and the mounting configuration of the backward facing cavitator. (b) A sectional view and (c) a close-up view of the cavitator, ventilation line and the hypodermic tube used for pressure measurement. The dimensions shown in the figure are in centimetres.

The imaging of the supercavity closure and pressure measurements are conducted with four sizes of cavitators: 10, 20, 30 and 40 mm in diameter (corresponding to
 $B=5\,\%$
, 9 %, 14 % and 19 %, respectively), across a wide range of test-section flow speeds and ventilation flow rates. Test-section flow speed is controlled through the rotational velocity of the tunnel’s axial flow impeller which is driven with a 75 HP alternating current motor. During experiments, tunnel water temperature is monitored using a YSI thermistor, which varies between 16 and
 $22\,^{\circ }\text{C}$
over the course of the tests. In our experiments, the water surface in the settling chamber is vented to the atmosphere, and the test-section pressure is determined by the water velocity inside. Since the cross-sectional area of the settling chamber is significantly larger than that of the test section, the water velocity in the settling chamber is negligible compared to that in the test section. Thus, from a conservation of energy principle, as the water velocity in the test section increases, the test-section pressure decreases. The ventilation flow rate to the cavitator is controlled and measured by an Omega Engineering FMA-2609A mass flow controller. In our experiments, air flux is reported at standard conditions (i.e. a temperature of 273 K and a pressure of 1 bar) in terms of standard litres per minutes (SLPM). In the current work, the corresponding air entrainment coefficient at standard conditions is defined as
 $C_{Qs}=\dot{Q}_{As}/Ud_{C}^{2}$
, where
 $\dot{Q}_{As}$
represents the air ventilation flow rate at standard conditions which is a direct reading from the mass flow controller. It is worth noting that in the present study, the mass flow rate (or volume flow rate at standard conditions) is employed instead of the volume flow rate used in the literature to give a sense of the ventilation requirement corresponding to each specific type of closure. The rationale behind adapting this definition is that, for the operation of supercavitating vehicles, it is the mass flow rate of air that determines the ventilation requirements to be carried on board. The full-scale reading of the MFC is 55 SLPM and the uncertainty in the flow measurement is
 $\pm 1\,\%$
of the full-scale reading. A few data points in our experiments are also collected at flow rates exceeding 55 SLPM. These large ventilation flow rates are regulated by a valve at the inlet to an Omega Engineering rotameter with a maximum mass flow rate of 100 SLPM. Factory calibrations are used for the rotameter and the uncertainty in the rotameter’s scale is less than 2 % of the value. Overall, in our experiments, the maximum uncertainty in the measurement of
 $C_{Qs}$
, Fr and
 ${\it\sigma}_{C}$
are estimated to be 2 %, 2 % and 2.2 %, respectively.
3. Experimental observations
3.1. Observations of different closure modes
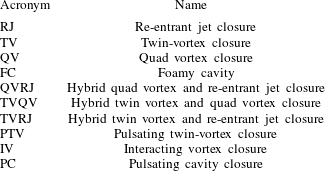
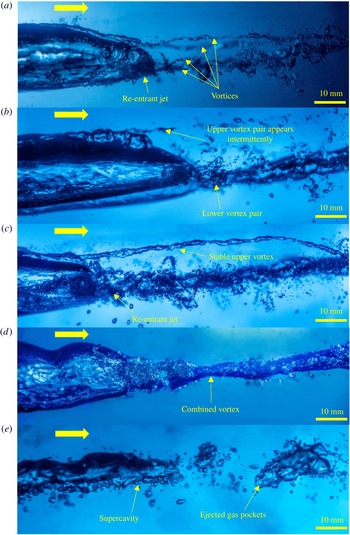
There are a variety of closure modes observed in our experiments, with the vortex-based closure mode being dominant. The acronyms and the names of different closure modes are summarized in table 1. In general, there are four stable states of a ventilated supercavity (figure 3), which include three stable closure modes (i.e. RJ, TV and QV), and the foamy cavity (FC). The FC refers to the state before the clear supercavity is formed, when the cavity consists of bubbles and foam without a clear gas–water interface (Savchenko Reference Savchenko2001). In addition, as shown in figure 4, five unstable closure modes are discovered in our experiments, i.e., hybrid quad vortex and re-entrant jet closure (QVRJ), hybrid twin vortex and quad vortex closure (TVQV), hybrid twin vortex and re-entrant jet closure (TVRJ), a pulsating twin-vortex closure (PTV) and an interacting vortex closure (IV). These unstable modes are either observed at the transition of two stable closure modes or at high ventilation flow rates (
 ${>}55$
SLPM). For example, a QVRJ closure occurs at the transition of QV and RJ closure, and is characterized by a foamy end with four vortices, exhibiting the characteristics of both QV and RJ (figure 4
a). TVQV closure is formed during the transition between QV and TV modes (figure 4
b). The number of vortices for TVQV changes intermittently at the closure, fluctuating between one and four and with the bottom two being usually more stable than the upper ones. The TVRJ mode yields similar features as those of QVRJ, but only two vortices appear at the closure (figure 4
c). At ventilation flow rates above 55 SLPM, an IV mode is observed, where the two vortices interact with each other to form one single thick vortex at the closure (figure 4
d). At flow conditions similar to that for IV but at lower blockage (i.e.,
 $B=5\,\%$
), PTV occurs, where both the vortices pulsate in longitudinal direction, and the cavity end intermittently breaks into elongated air pockets due to Kelvin–Helmholtz instability on the cavity surface (Kuklinski, Castano & Henoch Reference Kuklinski, Castano and Henoch2001). Note that the PC reported in the literature (Silberman & Song Reference Silberman and Song1961; Skidmore Reference Skidmore2013) is not observed in our experiments, and more information including images of PC can be found in a recent paper by Skidmore et al. (Reference Skidmore, Brungart, Lindau and Moeny2015).
The acronyms and the names of different closure modes observed in our experiments. Note that FC listed here is considered as a state of supercavity not a closure mode. High speed videos of some of these closure modes have been provided as supplemental movies (see supplementary material available at http://dx.doi.org/10.1017/jfm.2015.680).

Side views of various stable states of the ventilated supercavity observed in our experiments: (a) RJ, (b) TV, (c) QV, (d) FC. All the images are obtained for the 20 mm cavitator, corresponding to
 $B=9\,\%$
. Note that the vortices are filled with air, and one vortex is hidden behind the other for both TV and QV closures due to the perspective of the camera. The horizontal arrow in the figures indicates the direction of water flow.

Side views of the various unstable closure modes observed in our experiments: (a) QVRJ, (b) TVQV, (c) TVRJ, (d) IV, (e) PTV. PTV mode is observed at
 $B=5\,\%$
while all other modes correspond to
 $B=9\,\%$
. Note that the vortices are filled with air, and one vortex is hidden behind the other for both TV and QV closures due to the perspective of the camera. The horizontal arrow in the figures indicates the direction of water flow.

The trends of these closure modes and the transitions between them are studied by varying the parameters Fr and
 $C_{Qs}$
. A closure map is obtained (Fr versus
 $C_{Qs}$
) by holding Fr constant and lowering
 $C_{Qs}$
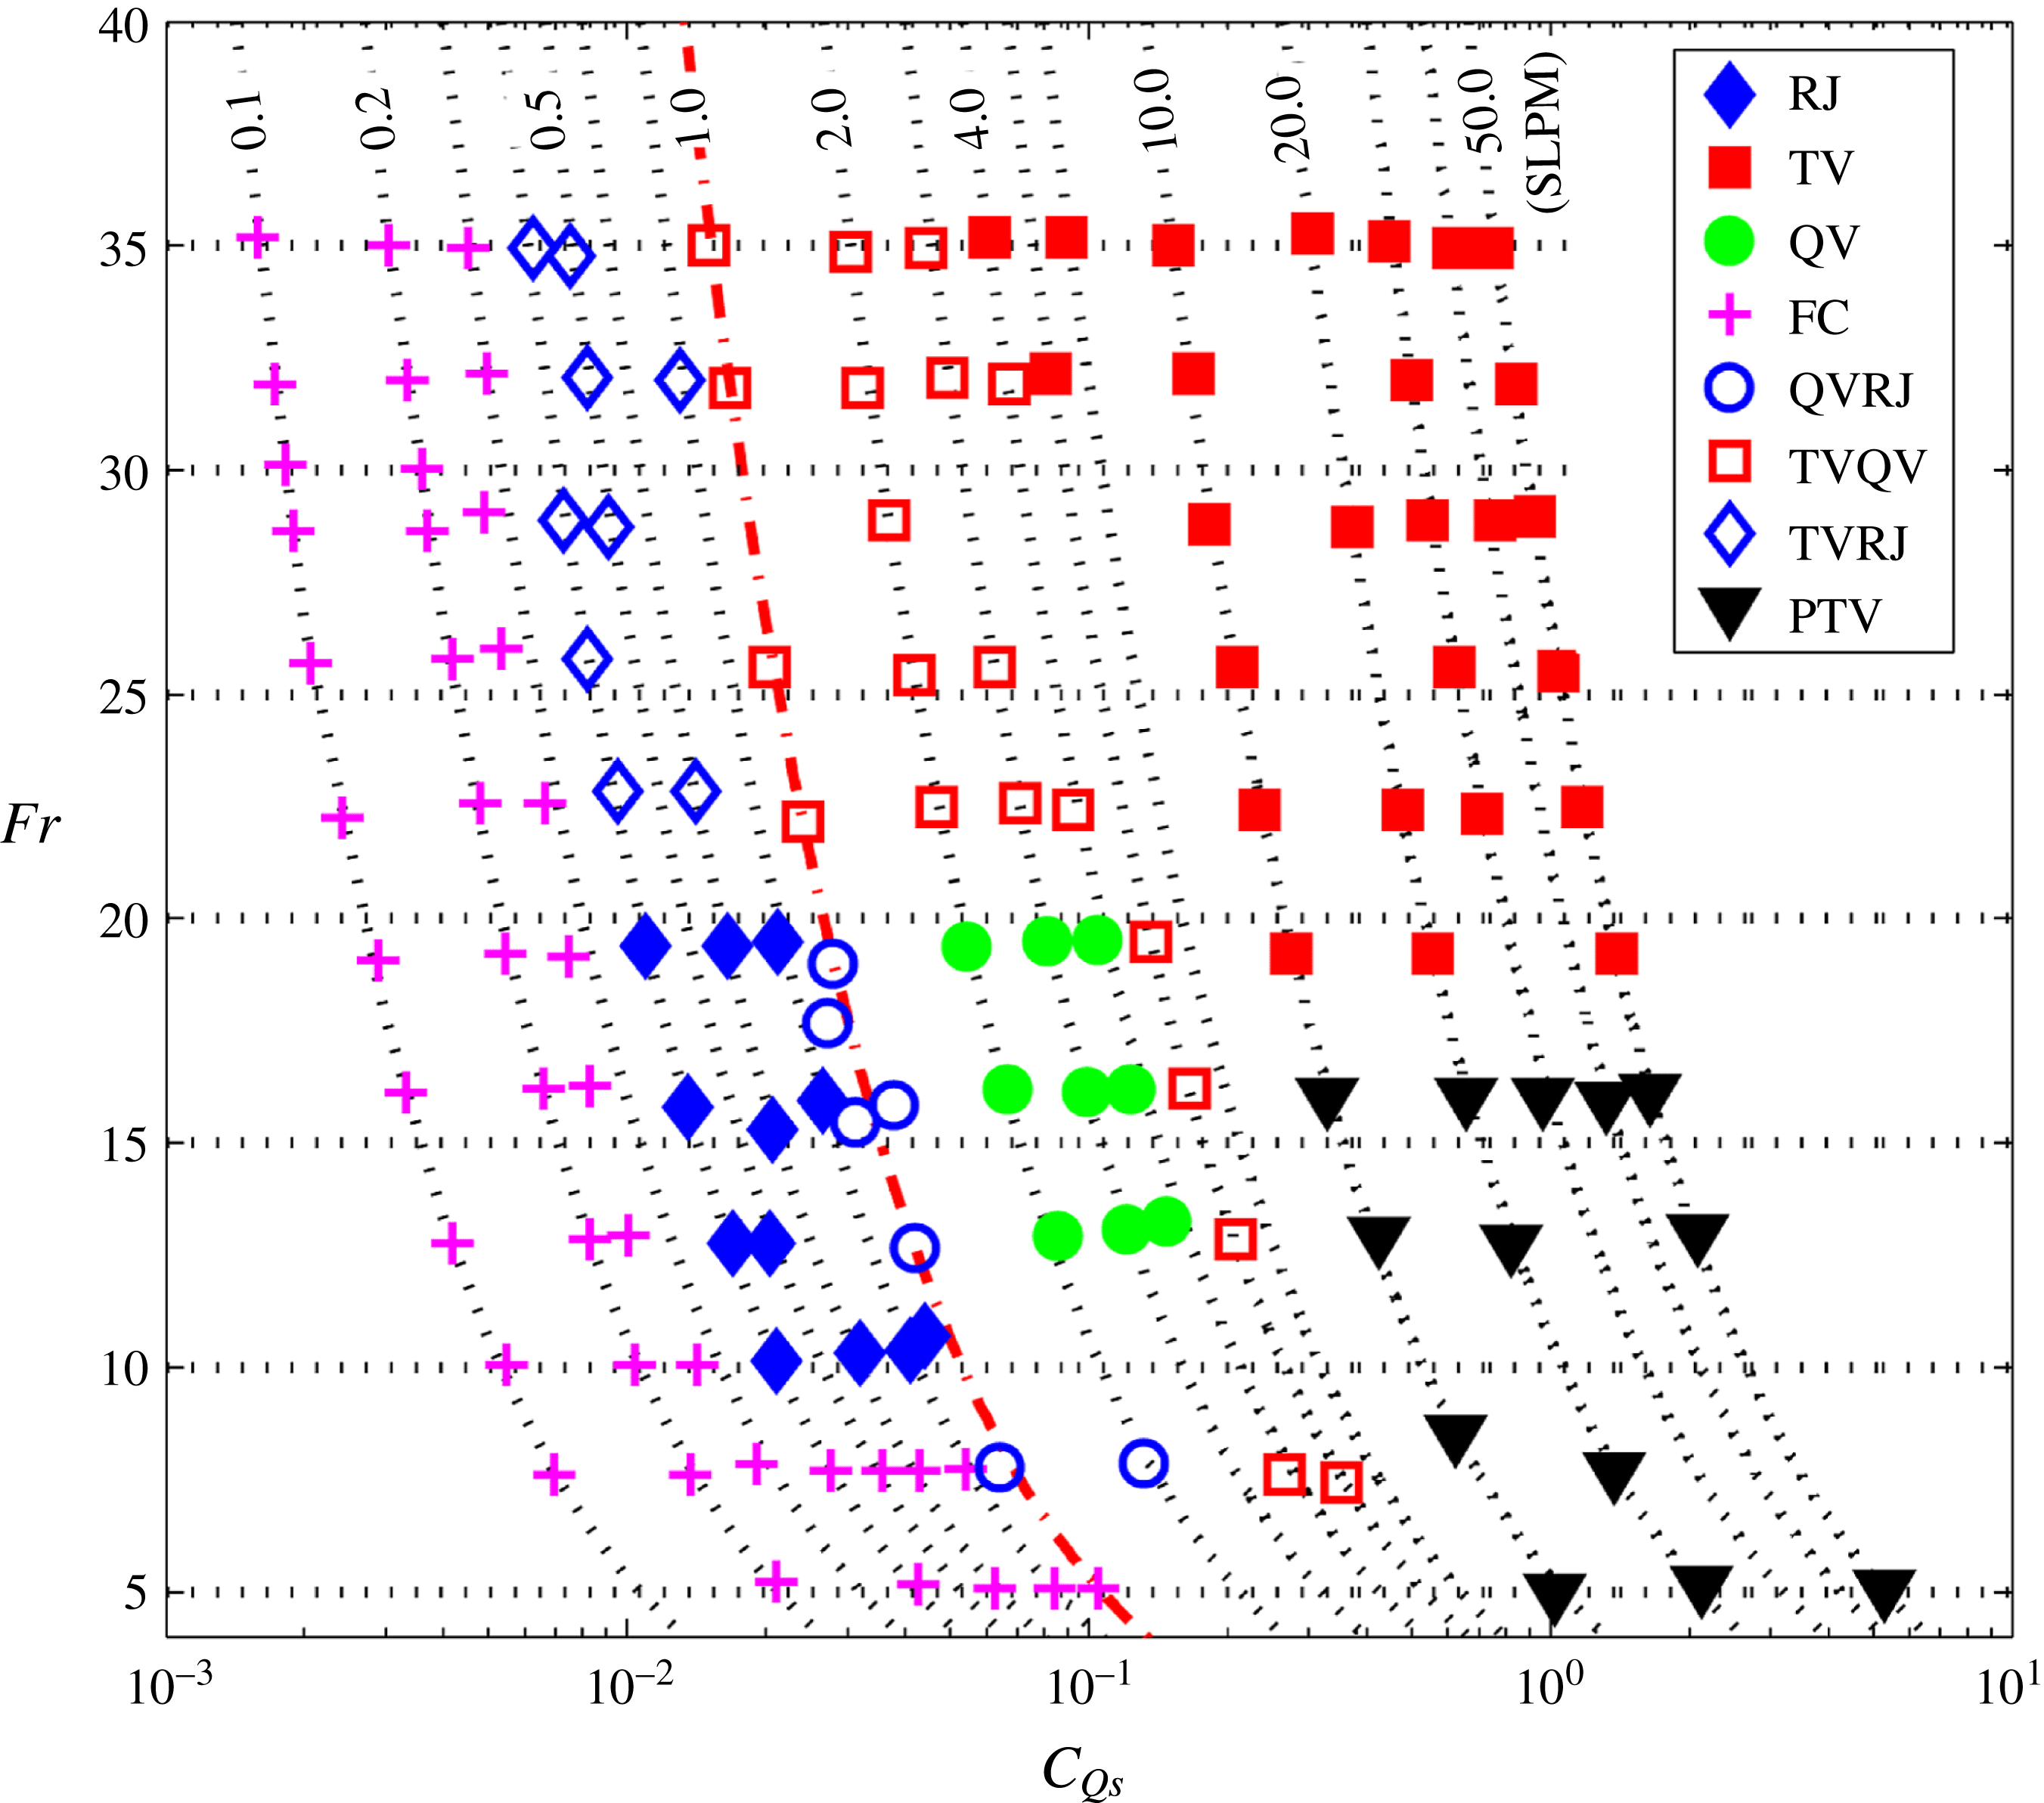
from 10 to 0.001. Figure 5 shows the closure map at a fixed blockage of
 $B=5\,\%$
, which corresponds to the lowest blockage in our experiments. In this closure map, a movement along the
 $x$
-axis corresponds to a fixed Fr (or constant water velocity) and increasing
 $C_{Qs}$
, while the slanted curves denote the lines of each fixed ventilation flow rate.
Closure map of different closure modes at
 $B=5\,\%$
. The slanted dotted lines denote lines of fixed ventilation flow rates. The values of the ventilation flow rate (in SLPM) are indicated on a selected number of the curves. The red dash-dotted line denotes the line of ‘critical ventilation flow rate’.

The closure map identifies separate regimes for a foamy cavity state and a supercavity state where different closure modes are observed (figure 5). In general, a foamy cavity state occurs at very low values of
 $C_{Qs}~({<}0.01)$
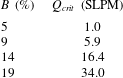
, when the ventilation flow rate, dependent on Fr, is not sufficient to sustain a supercavity. In particular, a critical ventilation flow rate,
 $Q_{crit}$
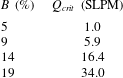
(defined at standard conditions) of 1.0 SLPM for the chosen cavitator (marked as a red dash-dotted line) is identified, which governs the transition from the supercavity state to the foamy cavity state. Above this critical ventilation rate, the supercavity does not transition to a foamy cavity as Fr is reduced, even to very low values. On the other hand, below this critical ventilation rate, the supercavity collapses into a foamy cavity as Fr deceases from an initial high value.
In a supercavity state, the regime for each closure mode, represented by the range of Fr and
 $C_{Qs}$
, can be clearly identified in the closure map (figure 5). For stable closure modes, the TV occurs at high values of
 $C_{Qs}$
and Fr (
 $C_{Qs}>0.2$
,
 $Fr>20$
), while QV is concentrated in moderate
 $C_{Qs}$
and Fr (
 $C_{Qs}=0.03$
–0.15,
 $Fr=12$
–20). In comparison, RJ closure appears at low to moderate Fr (
 $Fr=10$
–20) and in a narrow range of small
 $C_{Qs}$
(
 $=0.02$
–0.04). It has been found that RJ closure is susceptible to transition upon small changes in Fr or
 $C_{Qs}$
, and a rapid reduction in
 $C_{Qs}$
(at a fixed Fr) leads to supercavity collapse (a further discussion on this susceptibility is provided in § 5.4). The unstable modes are located in the transitional regimes between different stable modes. Specifically, the regimes of TVRJ and QVRJ are adjacent to the RJ regime, but situated at a higher values of Fr and
 $C_{Qs}$
, respectively. Upon an increase in
 $C_{Qs}$
from TVRJ, the closure mode migrates to TVQV and then to TV. Similarly, with further increment of
 $C_{Q}$
, the supercavity transits gradually from QVRJ to QV, and TVQV. At very high
 $C_{Qs}$
(
 ${>}0.5$
), the supercavity becomes less stable and PTV is observed. It is noteworthy that each closure mode shown in the closure map is independent of the path taken to obtain it as long as the path does not intersect with the foamy cavity state. In other words, the same closure map can be depicted by changing Fr or
 $C_{Qs}$
in many other ways provided a supercavity is maintained during the variation of flow conditions.
To elucidate the interrelationships between
 ${\it\sigma}_{C}$
,
 $C_{Qs}$
and different cavity states, the variation in cavity states upon a change in
 $C_{Qs}$
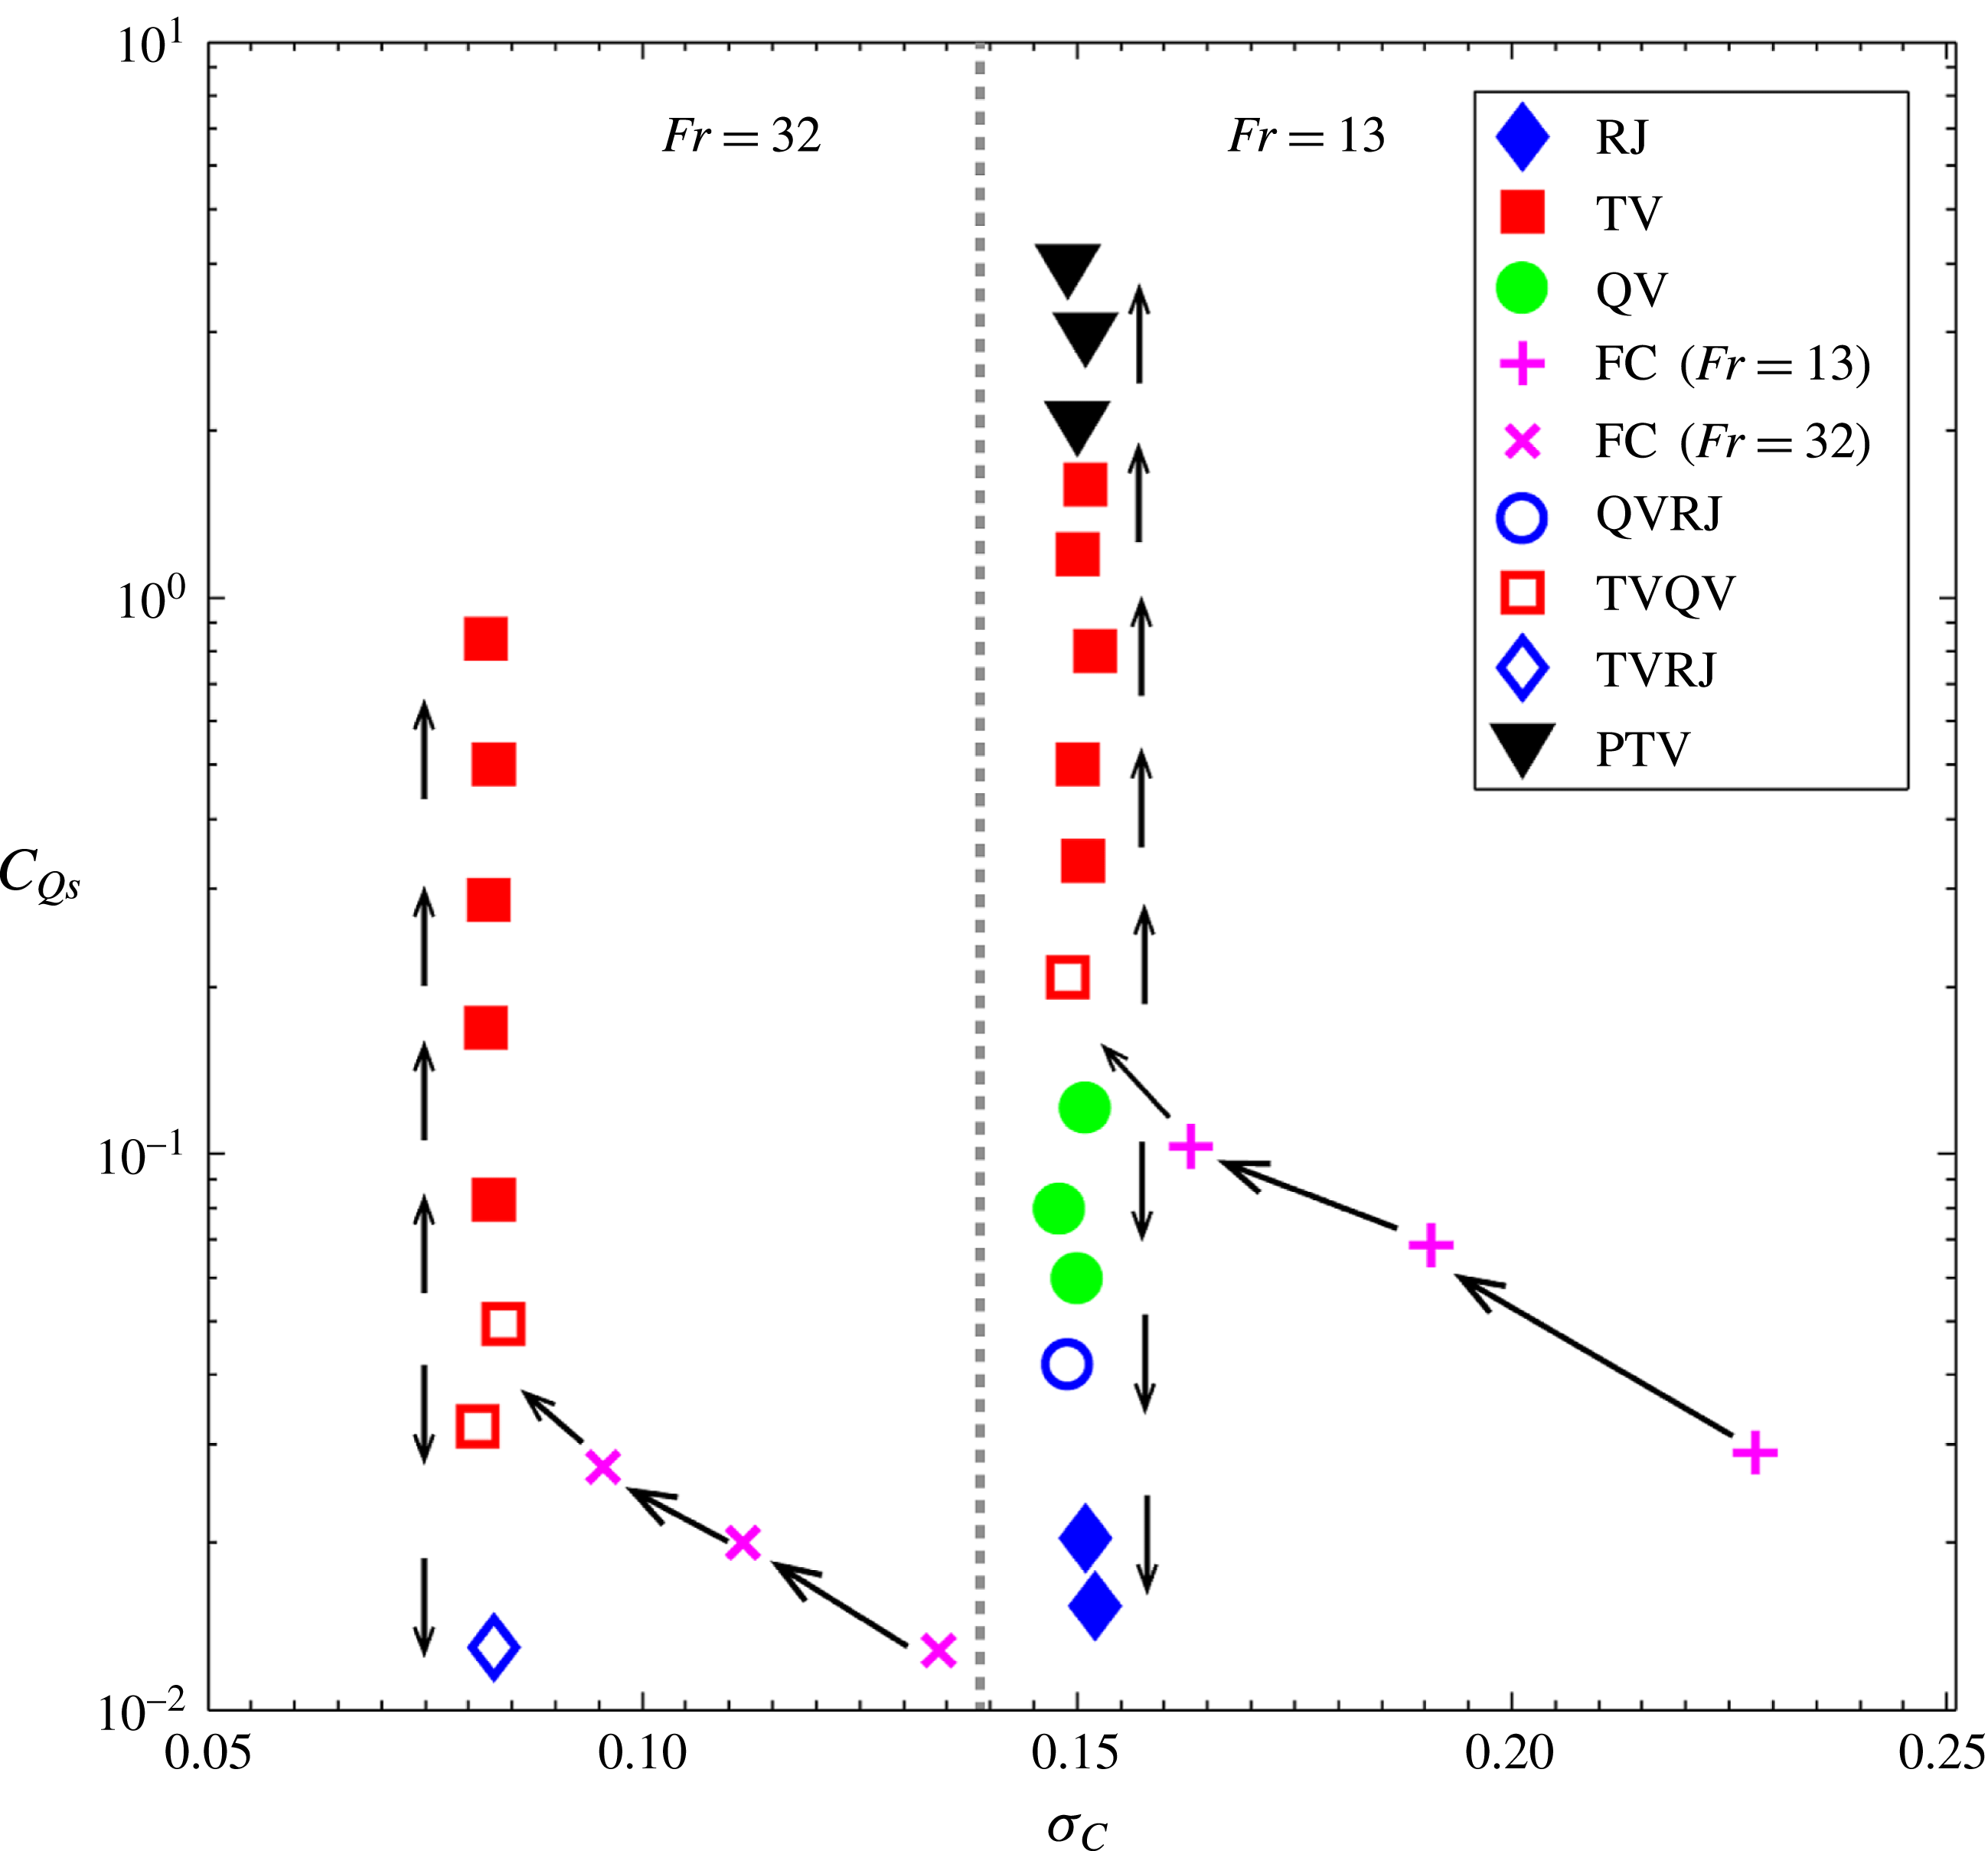
are examined at two selected Fr numbers. As figure 6 shows, at both Fr numbers, upon increment in
 $C_{Qs}$
,
 ${\it\sigma}_{C}$
decreases for a foamy cavity and the cavity size increases until a supercavity (i.e. the cavity with a clear interface) is formed. With further increase in
 $C_{Qs},{\it\sigma}_{C}$
does not change and the supercavity yields TV closure. More interestingly, as long as a supercavity state is attained,
 $C_{Qs}$
can be decreased to very low values while still maintaining the cavity and the same
 ${\it\sigma}_{C}$
. This phenomenon is referred to as ‘ventilation hysteresis’, and has been reported by a few prior studies (e.g. Song Reference Song1961; Savchenko Reference Savchenko2001; Kawakami & Arndt Reference Kawakami and Arndt2011). As shown by our experiments, although such a decrement in
 $C_{Qs}$
does not alter
 ${\it\sigma}_{C}$
, the cavity closure changes from TV to RJ. Since
 ${\it\sigma}_{C}$
stays fixed and the test-section pressure does not change appreciably upon the variation in ventilation flow rate, it can be inferred that the pressure inside the supercavity does not vary with
 $C_{Qs}$
. Therefore, the simultaneous change in closure mode indicates that the internal supercavity pressure is determined not only by a combination of Fr and
 $C_{Qs}$
, but also the supercavity closure mechanism. This implication can be related to Spurk & König’s theory (Spurk & König Reference Spurk and König2002), which suggests that the supercavity closure is associated with a change in streamline curvature at the cavity rear portion. Specifically, the curvature of the RJ mode effectively limits ventilation leakage at the closure, promoting pressure build-up inside the cavity. Thus, although the value of
 $C_{Qs}$
for a RJ closure is significantly lower than that of a TV mode, the pressure inside the supercavity stays nearly the same as that of a TV mode.
Variation of different closure modes upon the change of
 $C_{Qs}$
for two selected Fr numbers at
 $B=5\,\%$
. The arrows denote gradual changes in ventilation flow rate. The dotted vertical line in the middle separates the data points corresponding to the two Fr numbers.

3.2. Blockage effects
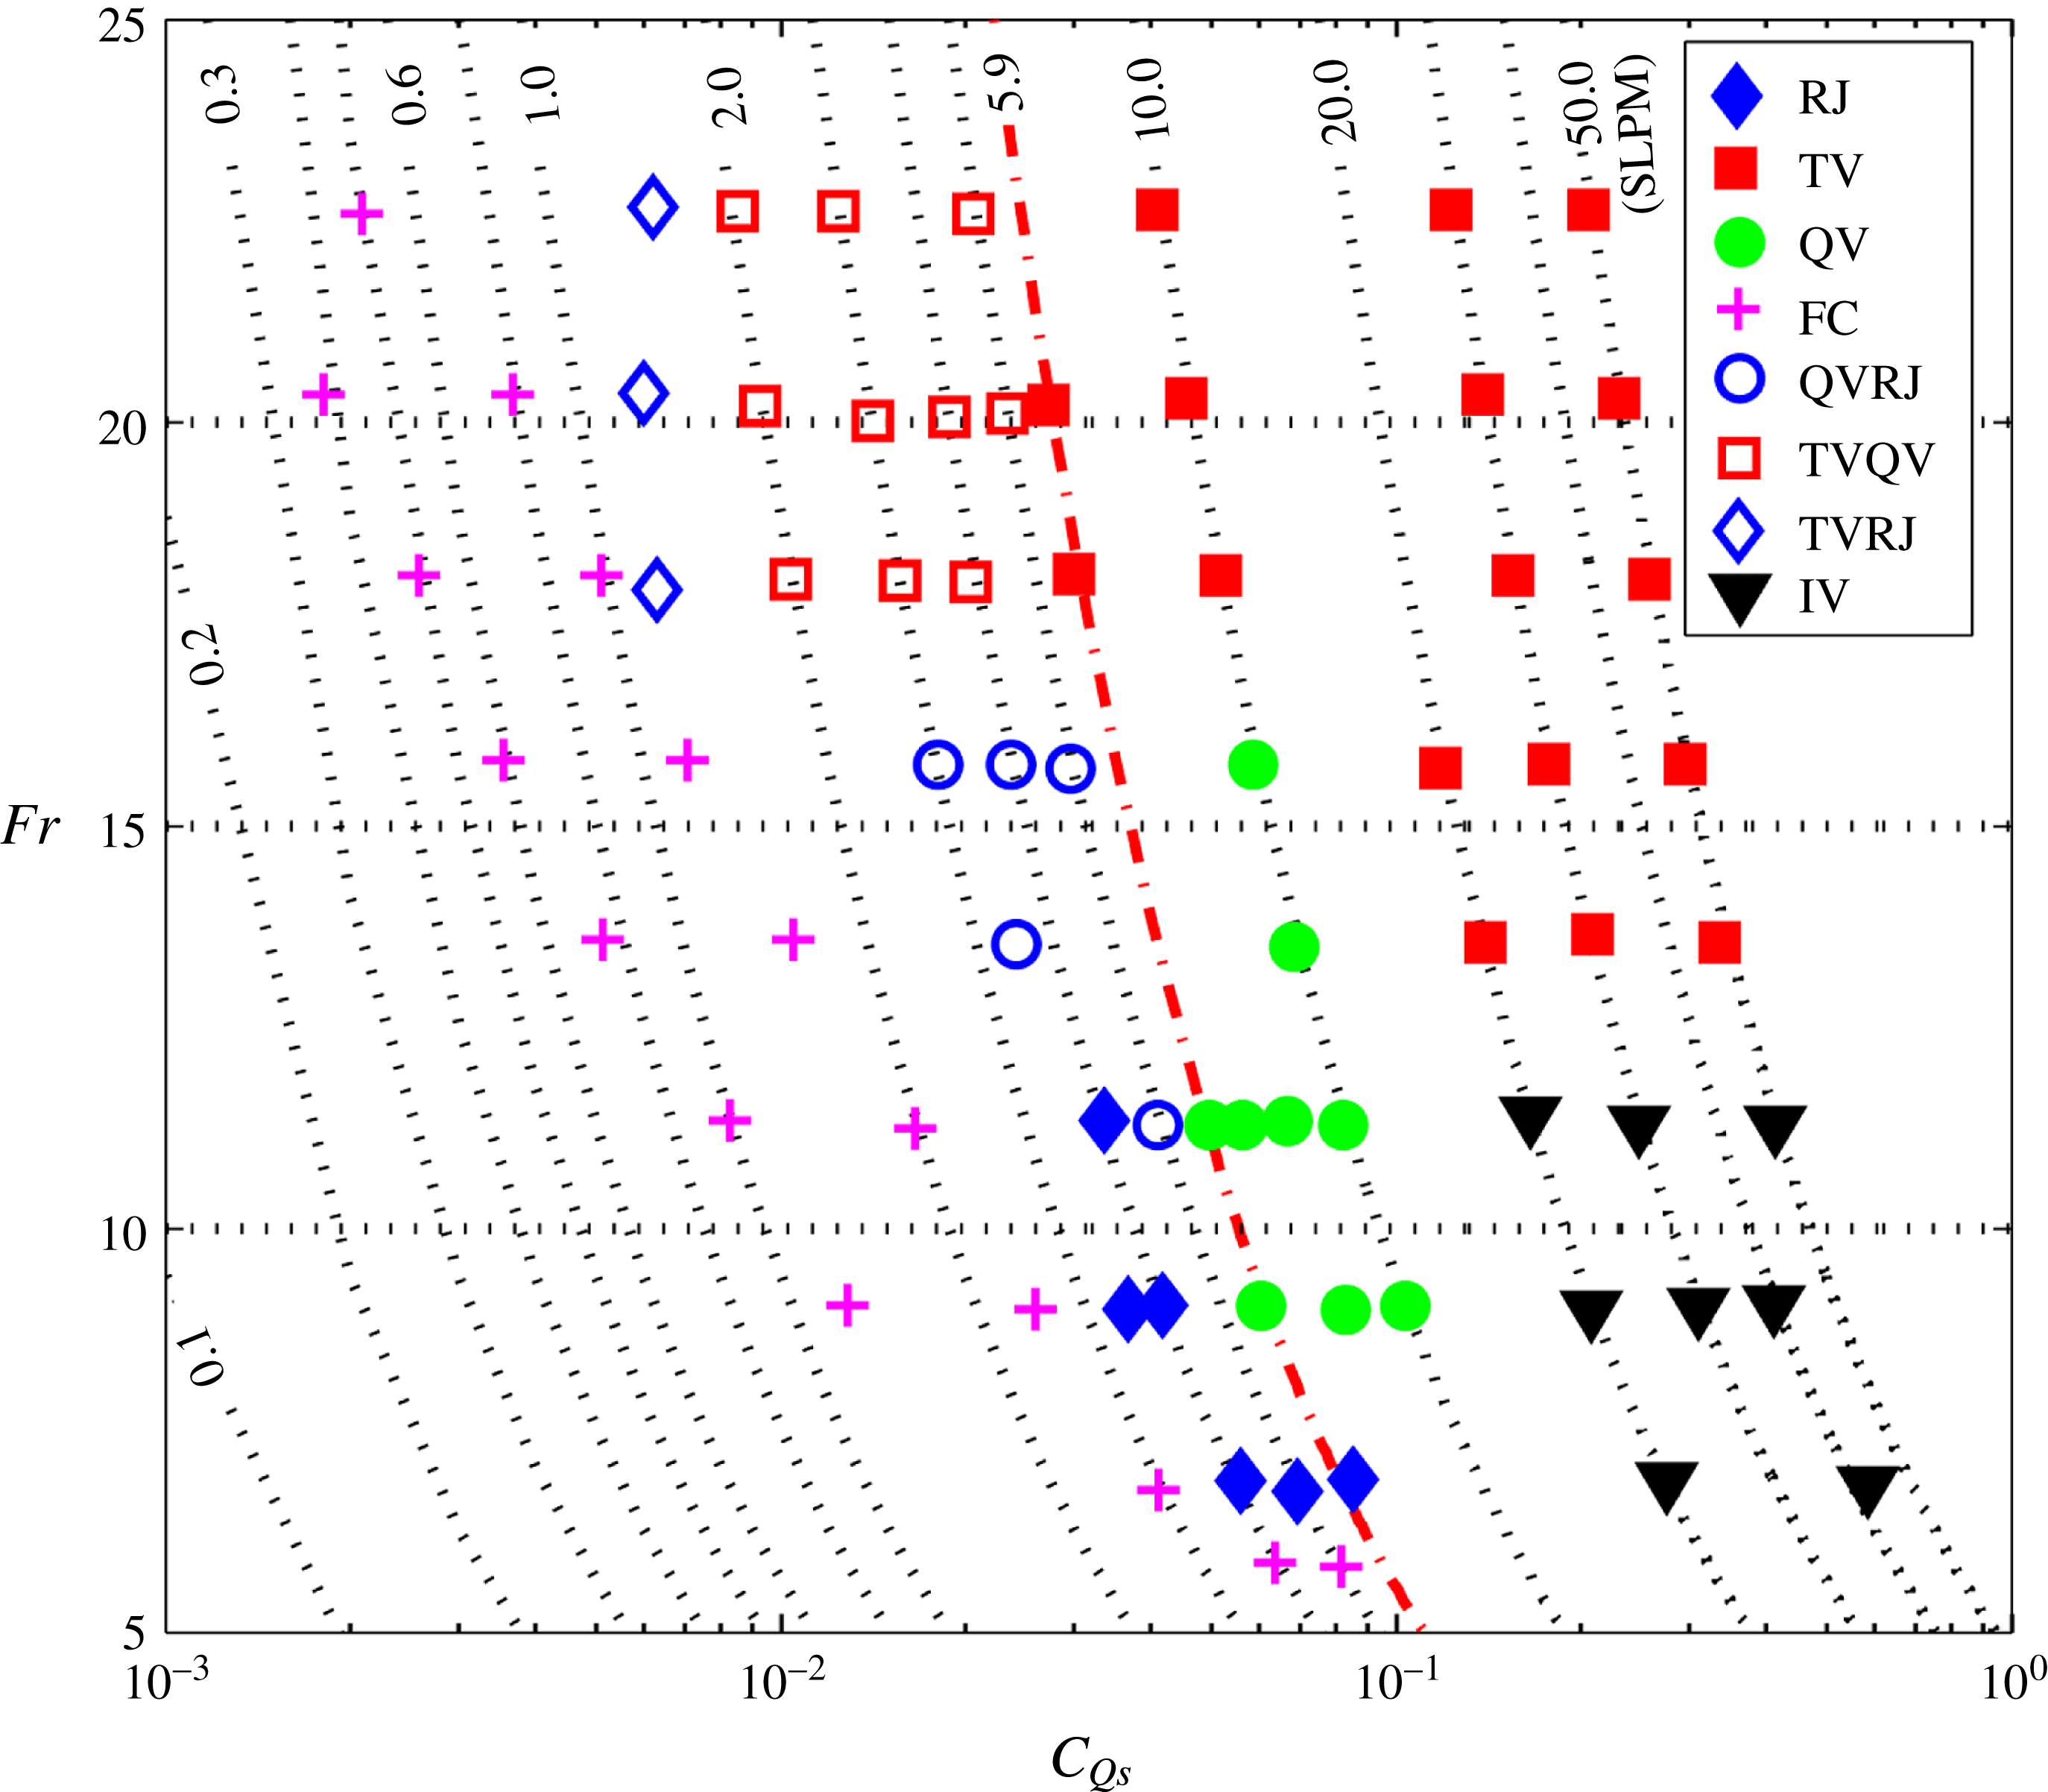
To examine the blockage effect on closure modes, figure 7 shows a closure map for
 $B=9\,\%$
in comparison with the one for
 $B=5\,\%$
presented in figure 5. The comparison shows that the trends for the distribution of closure modes are similar, except that the PTV closure, which appears in the bottom right of the closure map for
 $B=5\,\%$
, is replaced by the IV closure for
 $B=9\,\%$
. It is noteworthy that, essentially, both PTV and IV closures are unstable variants of the TV mode obtained at low Fr and high
 $C_{Qs}$
. At higher blockages, the closure maps remain largely the same, and are thus not shown here for brevity.
Closure map of different closure modes at
 $B=9\,\%$
. The slanted dotted lines denote lines of fixed ventilation flow rates. The values of the ventilation flow rate (in SLPM) are indicated on a selected number of the curves. The red dash-dotted line denotes the ‘critical ventilation flow rate’.

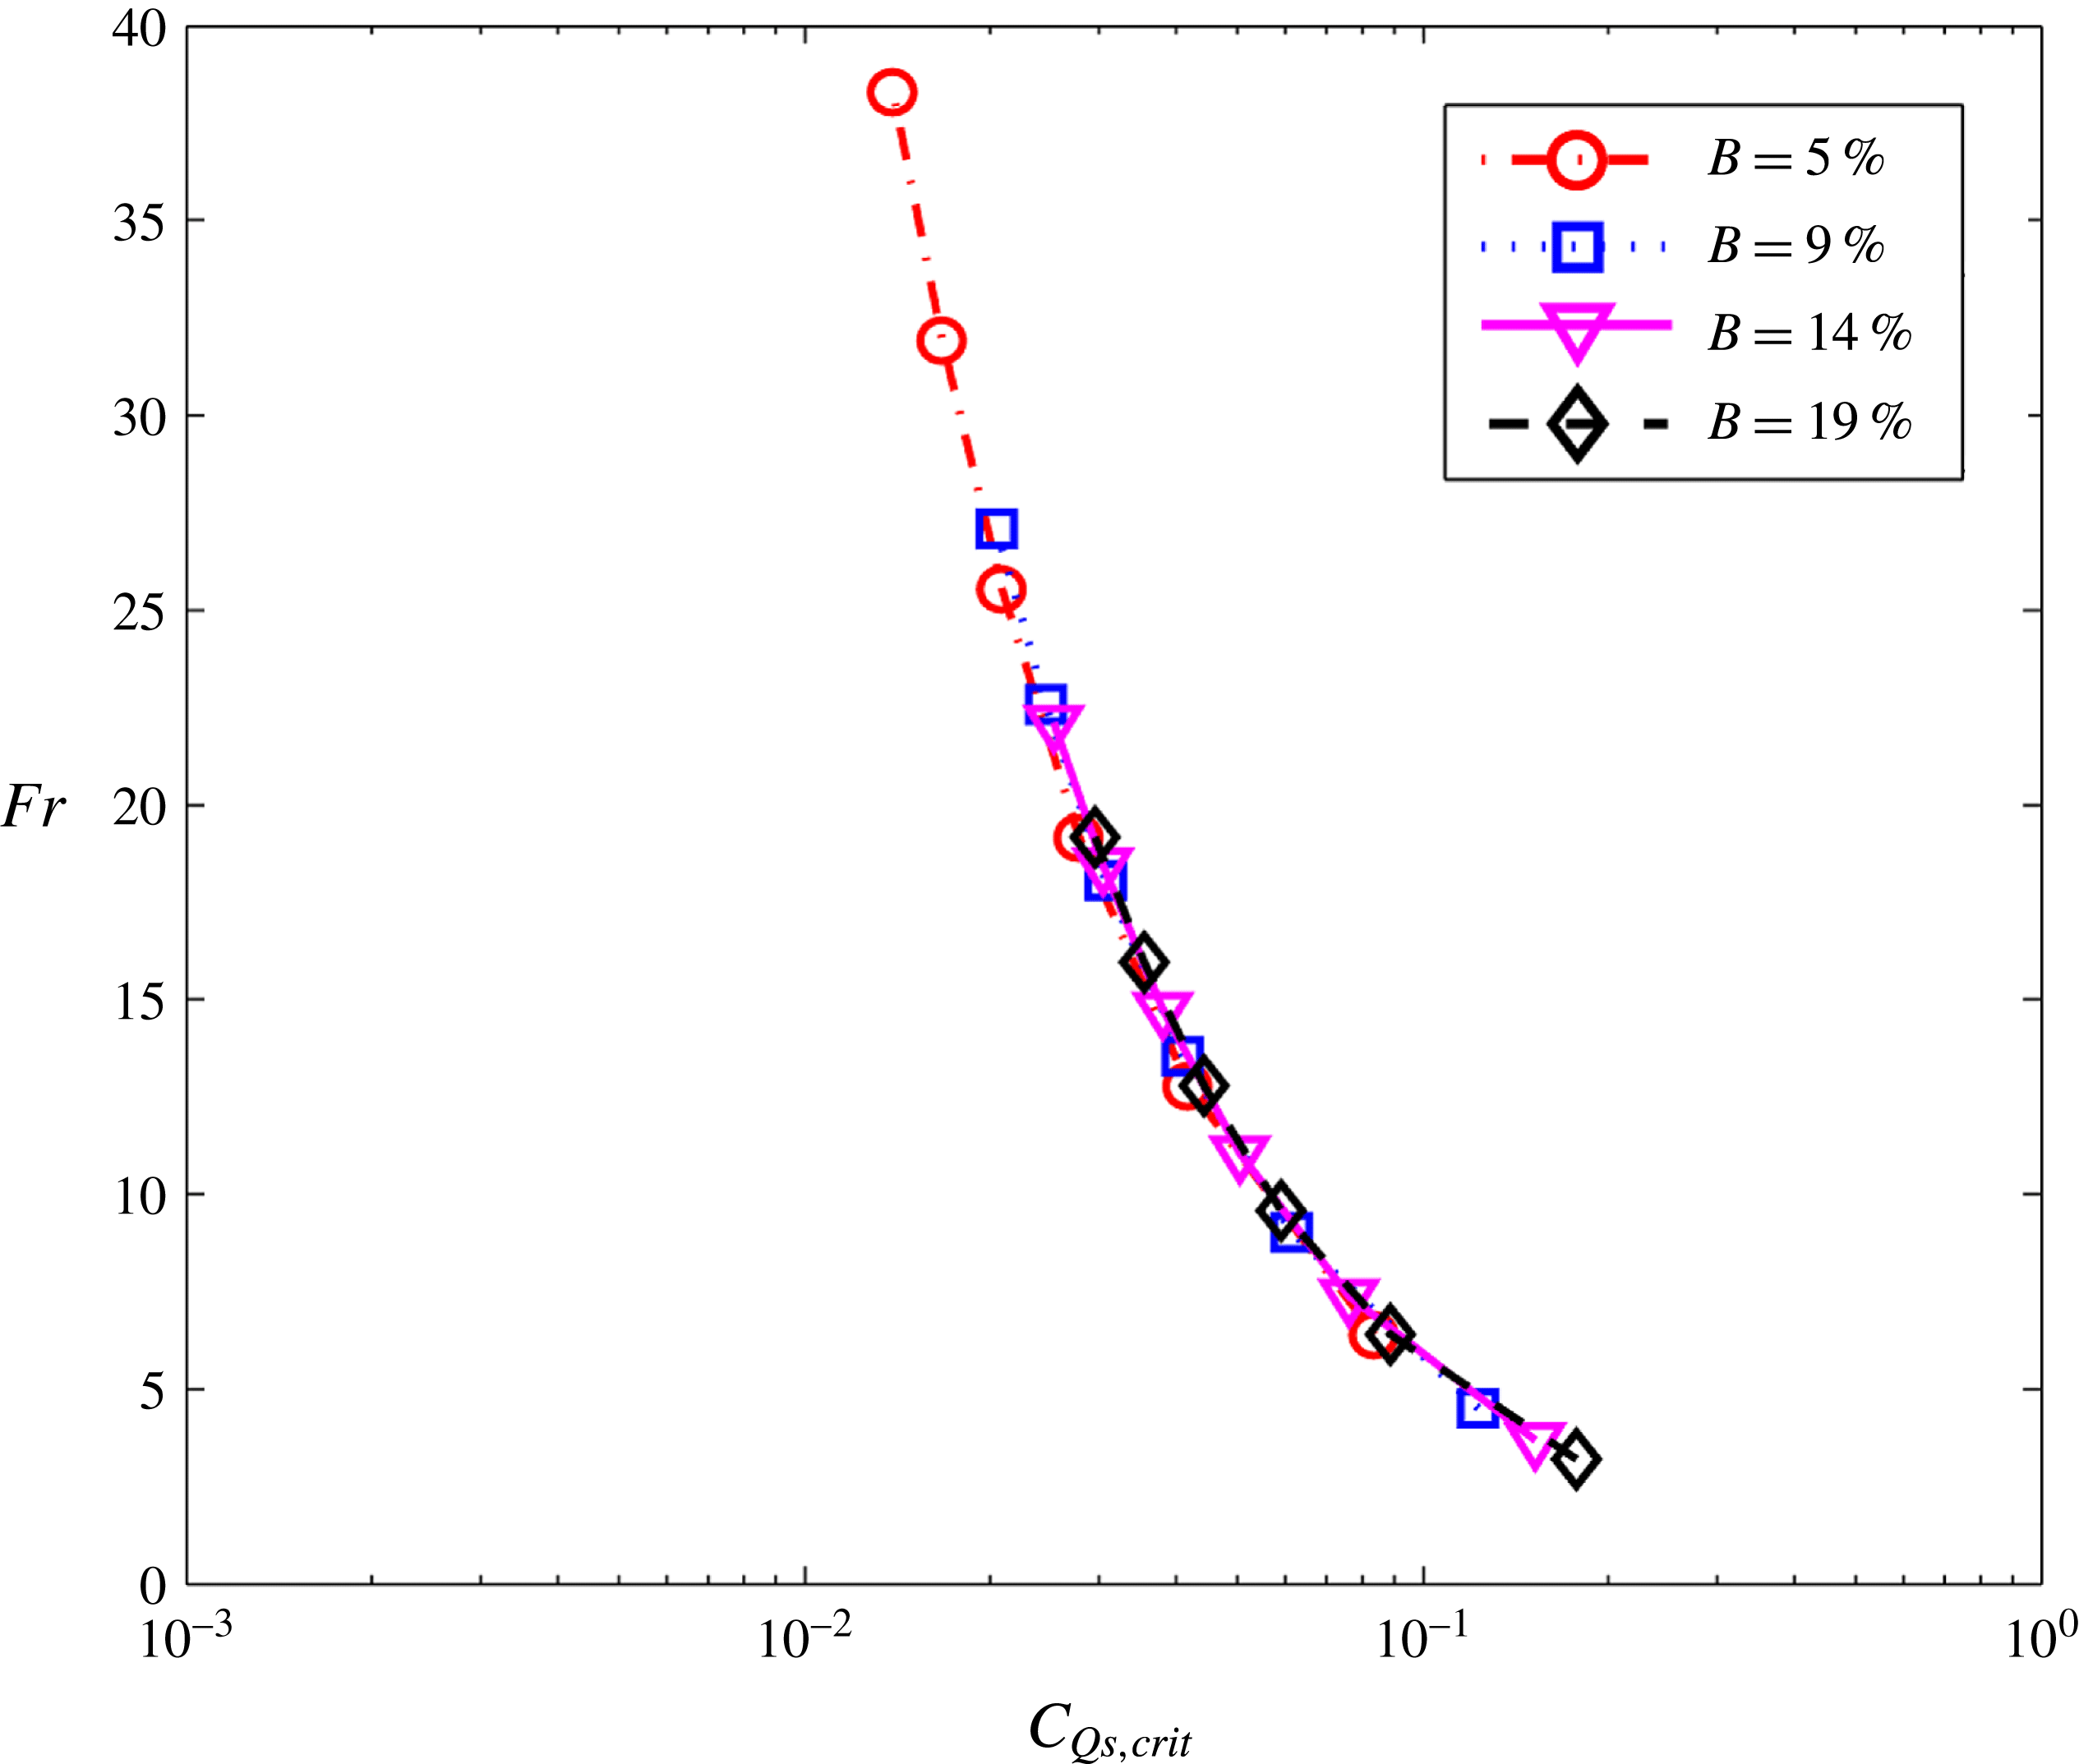
According to figure 7, a critical ventilation rate has also been identified at higher blockage. This critical rate grows with increasing blockage, as shown in table 2. Moreover, an interesting aspect of the critical air entrainment becomes evident when the data are further analysed by plotting the critical air entrainment coefficient
 $(C_{Qs,crit})$
versus Fr (figure 8). As shown, the curves for the critical air entrainment at different blockage ratios collapse onto a single hyperbolic curve, i.e.
 $Fr\times C_{Qs,crit}=0.532$
, which suggests that the characteristics of the critical air entrainment is independent of the blockage effect.
Relationship between Fr and
 $C_{Qs,crit}$
for different blockage ratios.

Critical ventilation flow rates at different blockage ratios.
Variation of
 ${\it\sigma}_{C}$
with Fr at different blockage ratios
 $.$
The dotted lines indicate the minimum values of
 ${\it\sigma}_{C}$
and the corresponding Fr when
 ${\it\sigma}_{C}$
reaches minimum.

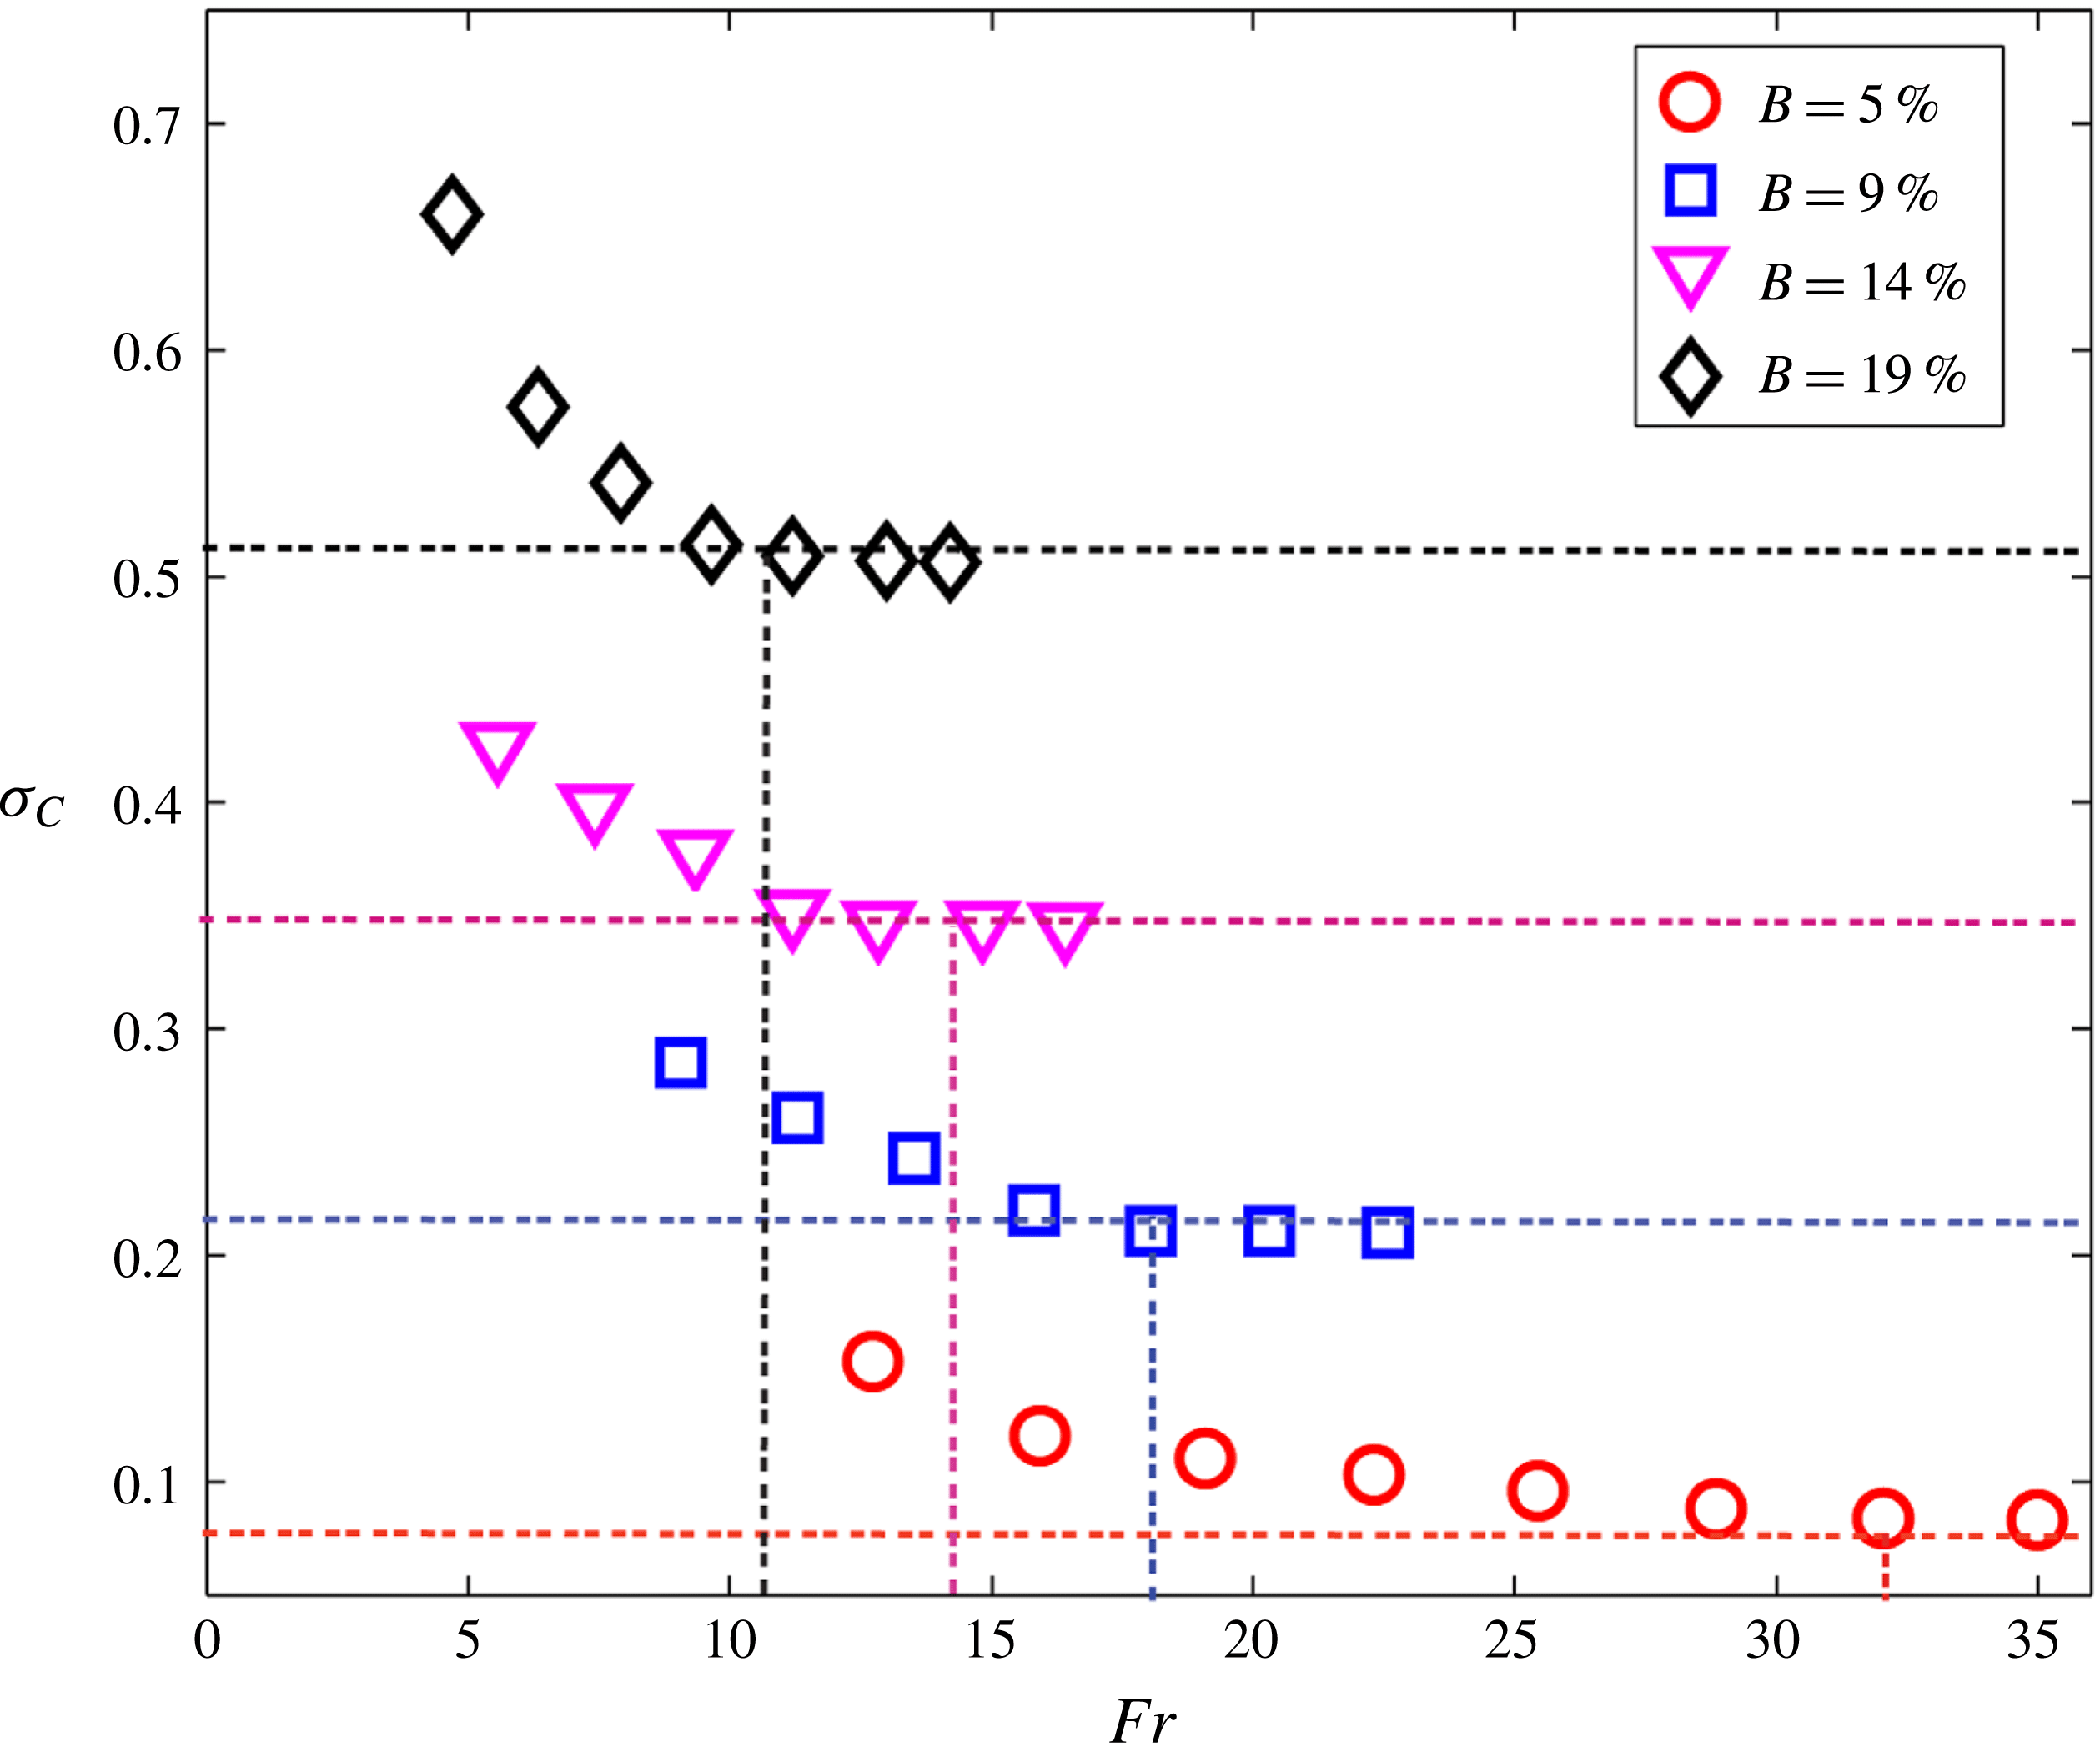
As shown in figure 6,
 ${\it\sigma}_{C}$
reaches a minimum value when a supercavity state is attained, and stays fixed upon further changes in
 $C_{Qs}$
. Here, the trend of
 ${\it\sigma}_{C}$
with varying Fr is examined at different blockage ratios in figure 9. For each blockage ratio,
 ${\it\sigma}_{C}$
decreases at different rates as Fr increases. As high values of Fr are approached
 $,{\it\sigma}_{C}$
reaches a minimum value (
 ${\it\sigma}_{C,min}$
), and further reduction in
 ${\it\sigma}_{C}$
is limited with any further increment in Fr. For
 $B=5\,\%$
, 9 %, 14 % and 19 %, the values of
 ${\it\sigma}_{C,min}$
are 0.08, 0.21, 0.35 and 0.51, and are obtained at Fr of 32, 18, 14 and 11, respectively. Such dependence of
 ${\it\sigma}_{C}$
on Fr can be attributed to the choking phenomenon encountered in a closed-wall water tunnel due to the blockage effect (Gadd & Grant Reference Gadd and Grant1965; Kawakami Reference Kawakami2010). Using control volume analysis, Kawakami (Reference Kawakami2010) showed that
 ${\it\sigma}_{C}$
can be approximated by the maximum diameter of the supercavity
 $(D_{C})$
and the hydraulic diameter of the closed-wall water tunnel as
 $$\begin{eqnarray}\sqrt{1+{\it\sigma}_{c}}=\left(1-\left(\frac{D_{C}}{D_{T}}\right)^{2}\right)^{-1}.\end{eqnarray}$$
The above expression suggests a dependence of
 ${\it\sigma}_{C}$
on
 $D_{C}$
. Since our observations show that
 $D_{C}$
depends upon Fr for a fixed blockage, and it attains a minimum with an increase in Fr, a consequent decrement in
 ${\it\sigma}_{C}$
is limited with increasing Fr.
The blockage effect on the occurrence of different closure modes is further investigated under a range of flow conditions defined using ‘Flow number’
 $(F_{L})$
according to a prior study of ventilated cavitation by Kshatriya, Patwardhan & Eaglesham (Reference Kshatriya, Patwardhan and Eaglesham2007), and Reynolds number (Re). The
 $F_{L}$
is a dimensionless number defined as
 $F_{L}=\dot{Q}_{As}/\dot{Q}_{Ws}$
, where
 $\dot{Q}_{As}$
and
 $\dot{Q}_{Ws}$
are the air ventilation flow rate and water flow rate at standard conditions through the test section, respectively. The Re is constructed using the incoming flow velocity, hydraulic diameter of the water tunnel and kinematic viscosity
 $({\it\nu})$
according to
 $Re=UD_{T}/{\it\nu}$
. Unlike
 $C_{Qs}$
and Fr,
 $F_{L}$
and Re offer a characterization of the flow conditions independent of cavitator size, facilitating the examination of the blockage effect, although
 $F_{L}$
can be expressed in terms of
 $C_{Qs}$
and
 $B$
, i.e.
 $(4/{\rm\pi})C_{Qs}B^{\text{2}}$
.
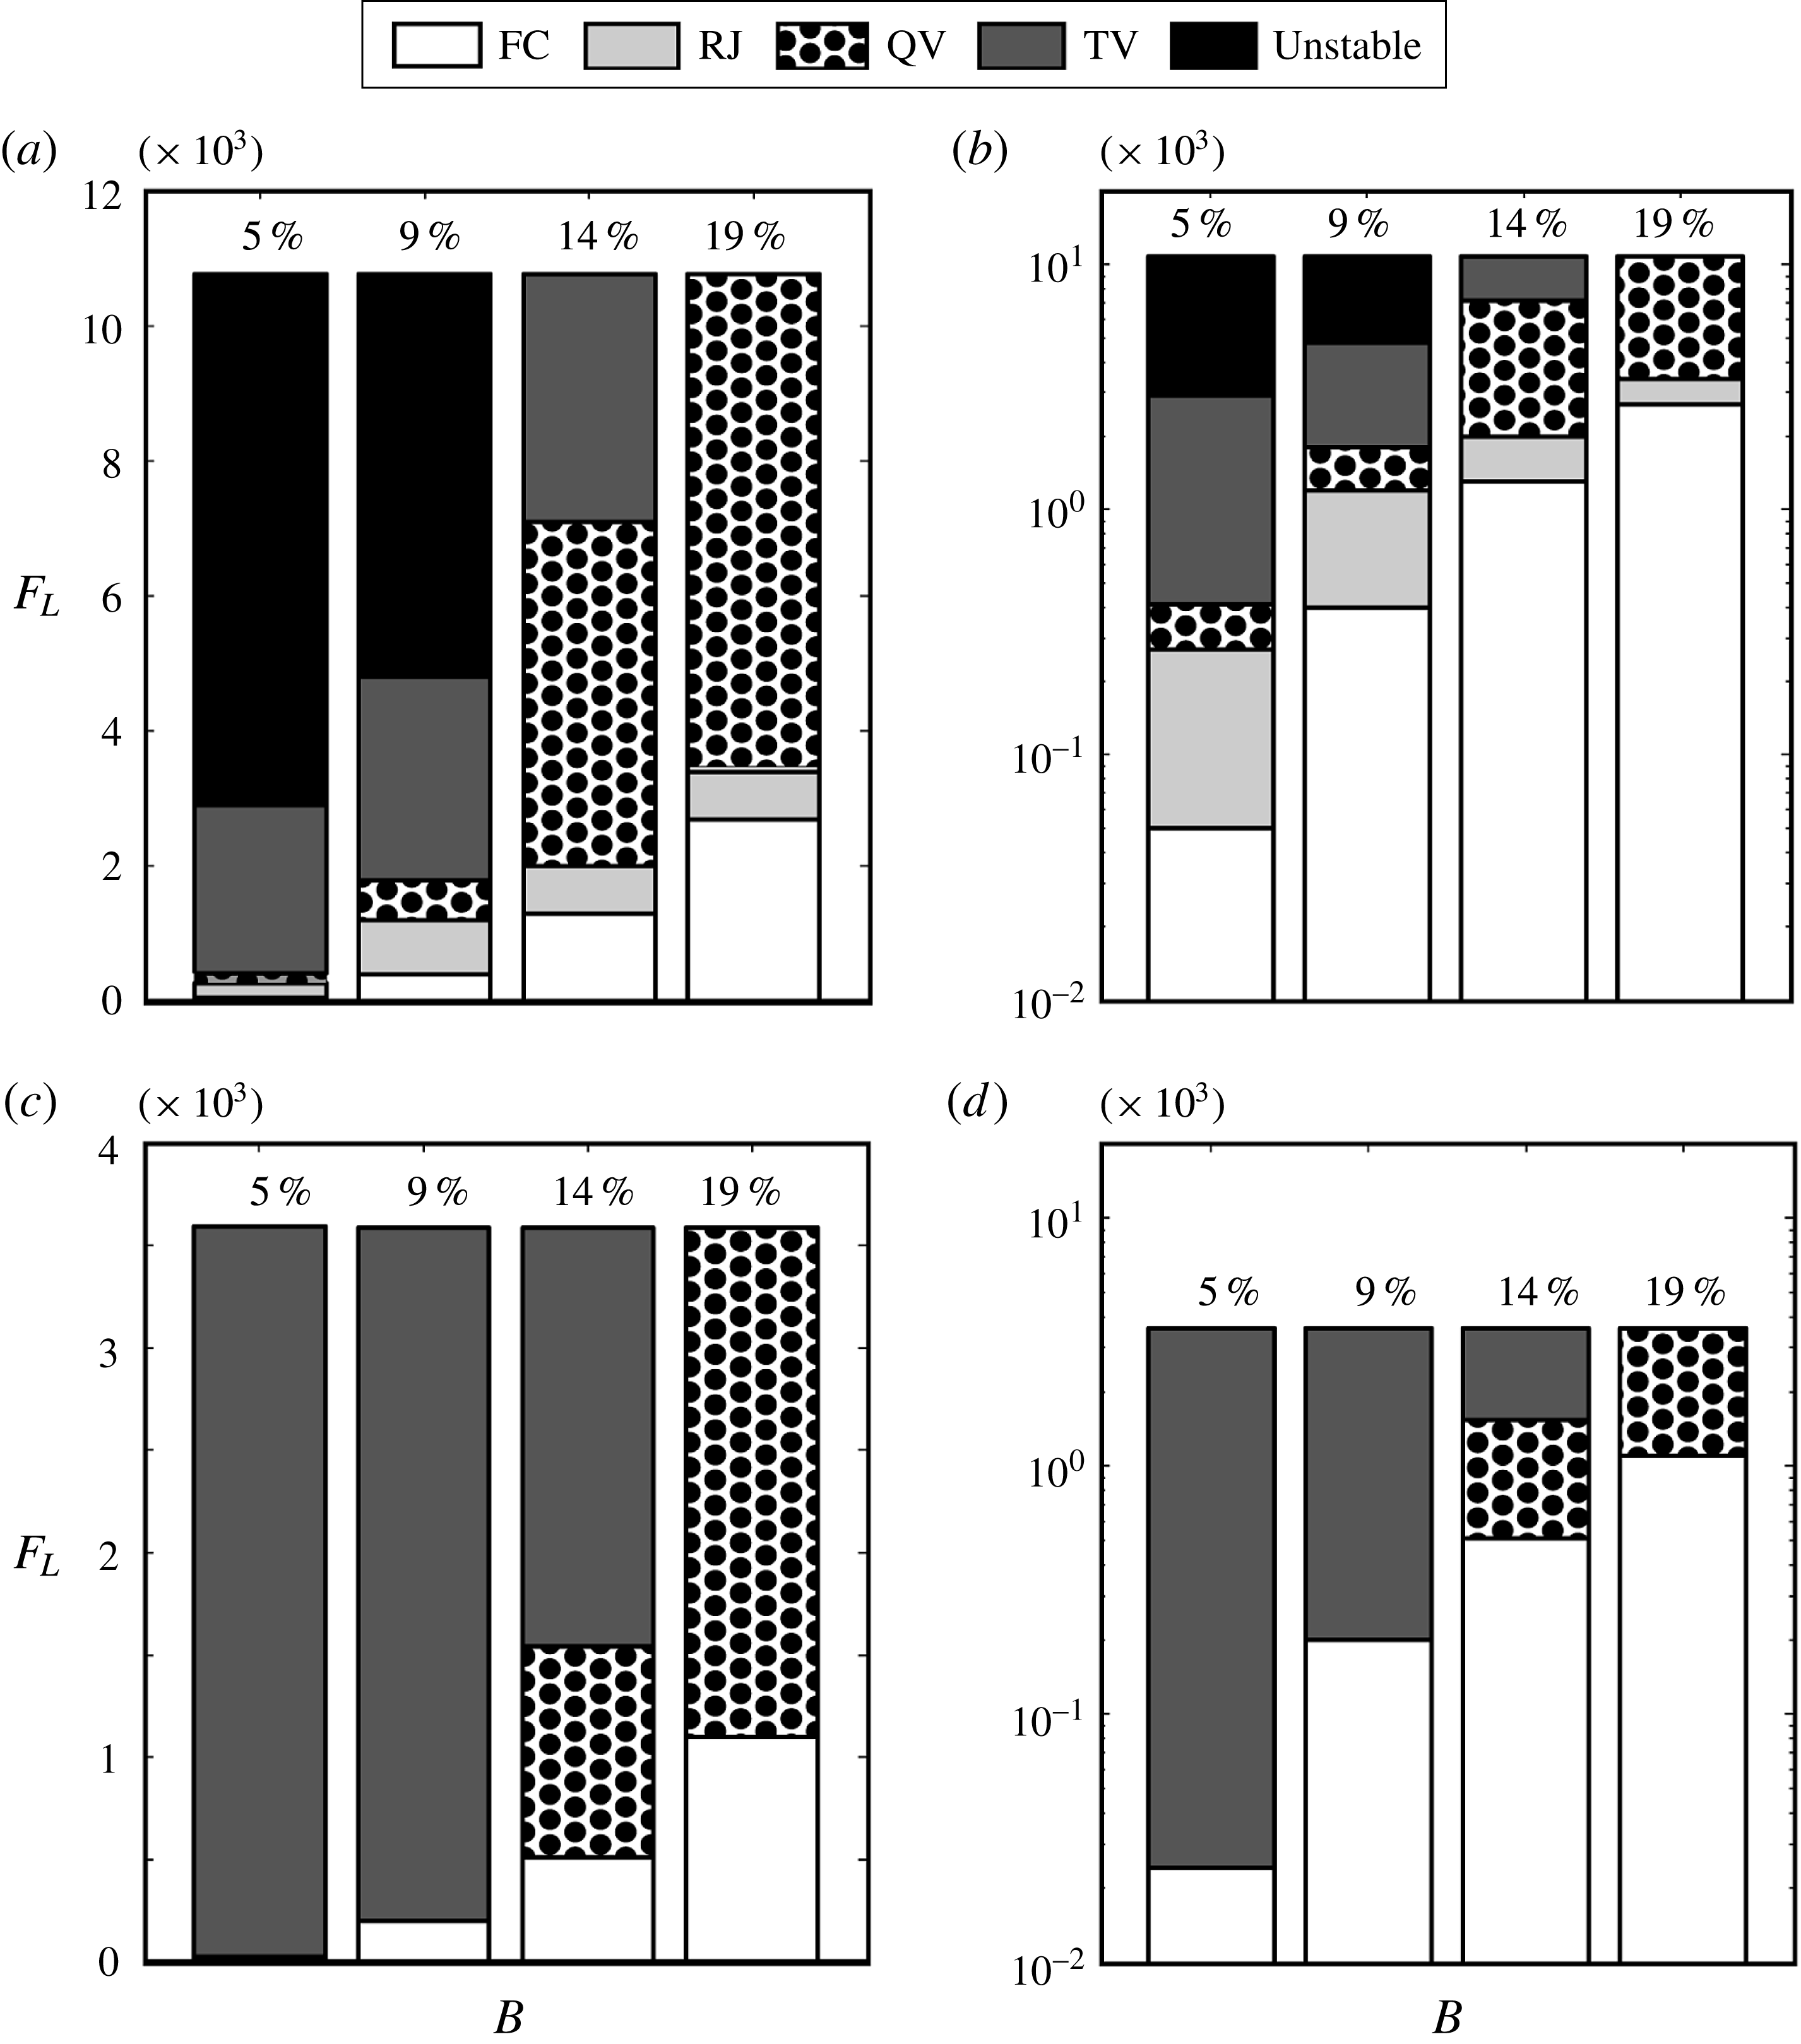
Based on the framework above, figure 10 provides a summary of the distribution of different closure modes corresponding to
 $F_{L}$
at two selected Re numbers for four blockage ratios in our experiments. The stable states of the supercavity (i.e. FC, RJ, TV and QV) are primarily considered here for comparison among different blockage ratios. The unstable closure modes shown in the figure refer to PTV for
 $B=5\,\%$
and IV for
 $B=9\,\%$
. The hybrid closure modes (i.e. QVRJ, TVRJ and TVQV) occur over a narrow range of
 $F_{L}$
and are thus excluded from the figure.
Variation of different closure modes with
 $B$
and
 $F_{L}$
at (a)
 $Re=6.42\times 10^{\text{5}}$
, linear scale (b)
 $Re=6.42\times 10^{\text{5}}$
, logarithmic scale (c)
 $Re=1.93\times 10^{6}$
, linear scale (d)
 $Re=1.93\times 10^{6}$
, logarithmic scale. The figures in percentage above the bars represent the values of
 $B$
.

As figures 10(a,b) show, at
 $Re=6.42\times 10^{\text{5}}$
, a larger
 $F_{L}$
is required to reach to a supercavity state from FC as
 $B$
increases. This trend may be more related to the effect of cavitator size rather than the blockage ratio. A possible explanation for this trend is that the transition of FC into a supercavity is driven by bubble coalescence. With increasing ventilation flow rate, it is observed that both the size and number of bubbles increase at the periphery of the cavity. For a larger cavitator size, the bubbles in the foam are more sparsely situated and thus more air is required to drive this coalescence process for its transition to a supercavity. Furthermore, as the figures show, for all blockage ratios, the RJ mode is always located between the FC and vortex-based closures and over a narrow range of small
 $F_{L}$
consistent with Cox & Clayden (Reference Cox and Clayden1956). With increasing
 $F_{L}$
, the closure transitions gradually from RJ to QV mode, then to TV and unstable modes (i.e. PTV for
 $B=5\,\%$
, IV for
 $B=9\,\%$
). It is clear that the range of
 $F_{L}$
for QV increases significantly as
 $B$
increases. Since the extent of the RJ mode does not vary appreciably with the change in
 $B$
, the expansion of the
 $F_{L}$
range for QV indicates the tendency to form vortex-based closures as
 $B$
increases. Note that the range of
 $F_{L}$
for QV at
 $B=19\,\%$
may persist beyond the upper limit of
 $F_{L}$
, as displayed in the figures, which is constrained by the test-section length for observation (since the cavity elongates beyond the test section as
 $F_{L}$
increases) in our experimental facility. The above observation regarding blockage effect is supported by a number of prior studies in ventilated supercavitation (e.g. Karlikov & Sholomovich Reference Karlikov and Sholomovich1966; Zhou et al.
Reference Zhou, Yu, Min and Yang2010; Skidmore Reference Skidmore2013). For example, the experimental results of Skidmore show that a large water tunnel (i.e. 1.219 m in diameter) leads to RJ closure whereas a smaller one, of 0.305 m diameter, yields only a TV mode. Using a numerical approach and taking into account the effect of blockage on the pressure outside the supercavity, another study by Zhou et al. (Reference Zhou, Yu, Min and Yang2010) presented a good match with the Campbell & Hilborne criterion (Campbell & Hilborne Reference Campbell and Hilborne1958) for transition to TV.
As shown in figure 10(c,d), when Re increases by a factor of three (i.e.
 $Re=1.93\times 10^{\text{6}}$
) in comparison with the results in figure 10(a,b), the trend of the closure mode distribution under the influence of
 $F_{L}$
and
 $B$
changes, although the trend of FC largely remains the same as before. The RJ mode almost disappears for all blockage ratios. Further, the QV mode disappears for the lower values of
 $B$
of 5 % and 9 %, suggesting that an increase in Re promotes the occurrence of TV mode over QV.
To summarize, based on the presented observations in §§ 3.1, 3.2, it can be concluded that the supercavity closure is not merely a function of Fr,
 $C_{Qs}$
and
 ${\it\sigma}_{C}$
, as discussed by numerous prior studies. Instead, a clear understanding of the physical mechanism is needed while formulating a criterion that determines supercavity closure viz. flow conditions, blockage effect and the type of experimental facility, etc. In the following sections, we present a hypothesis for the physical mechanism determining supercavity closure, provide supporting evidence for this hypothesis and use it further to explain experimental observations at SAFL and other facilities.
4. Hypothesis and explanation of observations
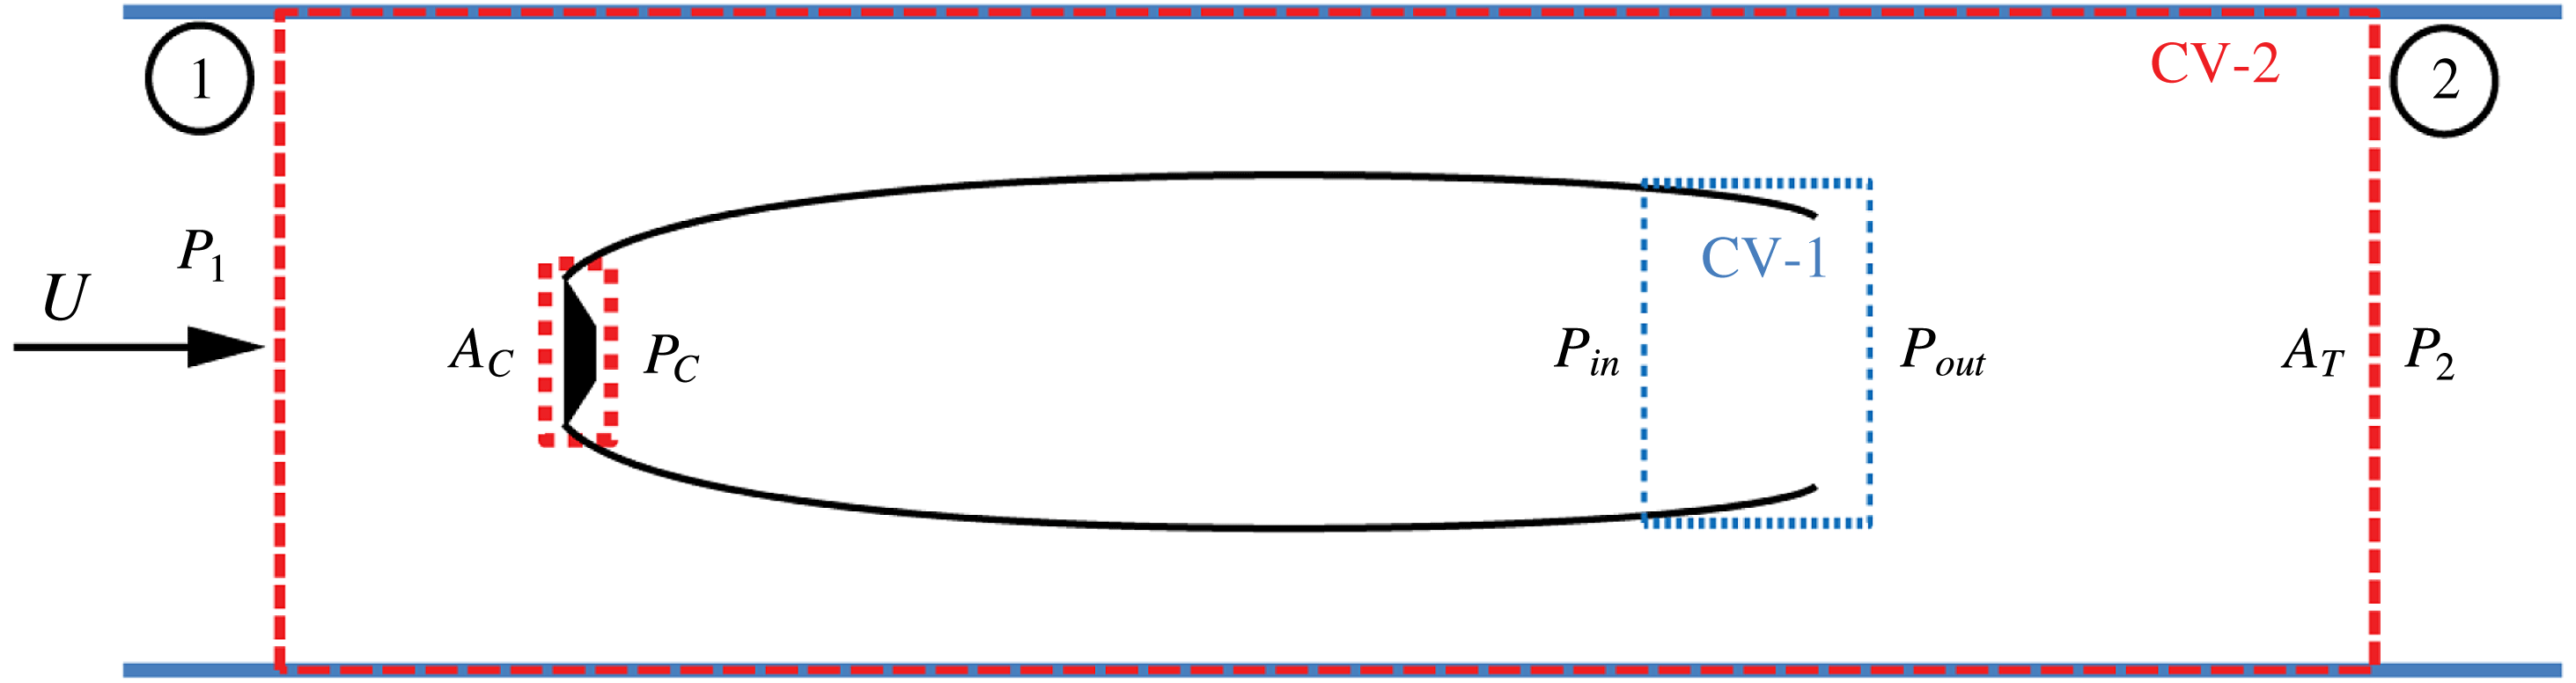
A hypothesis regarding the physical mechanism that determines the closure modes of a ventilated supercavity is proposed in order to explain the experimental observations. The hypothesis posits that the closure mechanism is mainly determined by the pressure difference across the gas–water interface at the cavity closure. This pressure difference is constructed in a dimensionless form as
 ${\rm\Delta}\tilde{P}=(P_{out}-P_{in})/q=\tilde{P}_{out}-\tilde{P}_{in}$
, where
 $q\,(=1/2{\it\rho}U^{2})$
is the dynamic pressure of water in the test section and
 $\tilde{P}_{in}$
and
 $\tilde{P}_{out}$
are the dimensionless static pressures inside and just outside the cavity at the closure, respectively (illustrated in figure 11). Note that
 $P_{in}$
may deviate from the mean cavity pressure due to the internal flows of the supercavity (Pan et al.
Reference Pan, Lu, Chen and Hu2010). We hypothesize that the change of Fr,
 $C_{Qs},B$
or type of experimental facility leads to the change of
 ${\rm\Delta}\tilde{P}$
, resulting in the variation of closure modes. Based on a momentum analysis of the control volume at the closure (CV-1 in figure 11),
 ${\rm\Delta}\tilde{P}$
is determined by the gas/water phase momentum across the closure, and other physical factors such as surface tension. Among these factors, the net water momentum flux at the closure is dominant since the water density is much higher than that of the ventilated air. It is noteworthy that a number of prior studies have examined cavity closure using physics-based analysis. For instance, Tulin (Reference Tulin1964) used momentum theory to show a pressure recovery at the closure of the supercavitating propellers, although his study did not involve different closure modes. Using boundary-layer analysis, Spurk & König (Reference Spurk and König2002) noted that the cavity closure is determined by the change of streamline curvature at the rear portion of the cavity.
Schematic showing the two control volumes related to the supercavity. CV-1 is the control volume at the closure, and CV-2 is the one encompassing the entire cavity.

According to the conceptual framework above, for the RJ mode, the
 ${\rm\Delta}\tilde{P}$
is dominated by the momentum of the re-entrant water jet, while for a vortex-based closure (e.g. TV and QV modes), such pressure difference is significantly smaller in the absence of a re-entrant jet, i.e.
 ${\rm\Delta}\tilde{P}_{RJ}\gg {\rm\Delta}\tilde{P}_{TV},{\rm\Delta}\tilde{P}_{QV}$
. Nevertheless, the distinct geometric differences between various vortex-based closures suggest that surface tension may contribute to a small variation of pressure difference at the closure which causes the change of closure mode. The influence of surface tension on twin-vortex closures has been admitted in the prior studies by Cox & Clayden (Reference Cox and Clayden1956), Epshtein (Reference Epshtein1973), Logvinovich (Reference Logvinovich1973) and more recently by Shi, Itoh & Takami (Reference Shi, Itoh and Takami2000). In the case of a stable air bubble in water, the surface tension on the curved interface induces a pressure difference across a bubble film. In a similar manner, we speculate here that the variation of mean curvature at the closure among different vortex-based closure modes indicates a surface tension effect and a small variation of
 ${\rm\Delta}\tilde{P}$
. Since a QV closure results from the further splitting of each vortex of a TV closure, it is further hypothesized that the mean curvature at QV closure is smaller than that for a TV mode. Consequently, the pressure difference for the QV mode is smaller than that for TV, i.e.
 ${\rm\Delta}\tilde{P}_{QV}>{\rm\Delta}\tilde{P}_{TV}$
. Summarily, the above discussion leads to a
 ${\rm\Delta}\tilde{P}$
criterion for the occurrence of different closure modes, i.e.
 ${\rm\Delta}\tilde{P}_{RJ}\gg {\rm\Delta}\tilde{P}_{QV}>{\rm\Delta}\tilde{P}_{TV}$
. Specifically, this criterion implies that RJ mode occurs when
 $\tilde{P}_{out}$
is significantly higher than
 $\tilde{P}_{in}$
. As
 ${\rm\Delta}\tilde{P}$
reduces to a critical value, when it is no longer sufficient to sustain a re-entrant jet, the closure region transitions from RJ to vortex-based closures, and from QV to TV gradually as
 ${\rm\Delta}\tilde{P}$
continues to decrease.
The above framework can be further extended to include the blockage effect of a closed-wall water tunnel. This extension is conducted through a momentum analysis on the control volume encompassing the entire supercavity (i.e., CV-2 as shown in figure 11). The CV-2 consists of the horizontal control surfaces coinciding with the test-section walls, vertical surfaces located far upstream (with pressure
 $P_{1}$
) and downstream (with pressure
 $P_{2}$
) of the cavity and the surfaces that just enclose the cavitator. Assuming that the viscous shear stress on the horizontal control surfaces is negligible, the horizontal momentum equation of CV-2 can be expressed as follows:
 $$\begin{eqnarray}P_{1}A_{T}=P_{2}A_{T}+F_{D},\end{eqnarray}$$
where
 $A_{T}$
represents the cross-sectional area of the tunnel and
 $F_{D}$
is the drag force on the cavitator. To show the connection among the above equation,
 ${\it\sigma}_{C}$
and
 $B$
, the following relations are used:
 $$\begin{eqnarray}F_{D}=C_{D}A_{C}\left(1/2{\it\rho}U^{2}\right)=C_{D}A_{C}q\end{eqnarray}$$
 $$\begin{eqnarray}{\it\sigma}_{C}=\left(P_{1}-P_{C}\right)/q\end{eqnarray}$$
 $$\begin{eqnarray}A_{C}/A_{T}=B^{2},\end{eqnarray}$$
 $$\begin{eqnarray}C_{D}=C_{xD}(1+{\it\sigma}_{C})\end{eqnarray}$$
where,
 $A_{C}$
is the cross-sectional area of disk cavitator and
 $P_{C}$
is the internal cavity pressure measured close to the cavitator, as shown in figure 11.
 $C_{xD}$
is a constant equalling 0.82 for a disk cavitator (Stinebring et al.
Reference Stinebring, Billet, Lindau and Kunz2001). As a result,
 $$\begin{eqnarray}(P_{2}-P_{c})/q={\it\sigma}_{C}(1-C_{xD}B^{2})-C_{xD}B^{2}.\end{eqnarray}$$
Since a ventilated supercavity is predominantly filled with air, and the air density is significantly smaller than that of water, the difference between
 $P_{C}$
and
 $P_{in}$
cannot be significant. According to Nesteruk (Reference Nesteruk2014), a constant
 ${\it\sigma}_{C}$
over the entire cavity surface can be assumed for a ventilated cavity i.e.
 $P_{C}\approx P_{in}$
. Further, assuming
 $P_{out}\approx P_{2}$
, we obtain:
 $$\begin{eqnarray}{\rm\Delta}\tilde{P}={\it\sigma}_{C}(1-C_{xD}B^{2})-C_{xD}B^{2}.\end{eqnarray}$$
The above equation shows the direct connection between
 ${\rm\Delta}\tilde{P}$
and the blockage ratio. In addition, based on this equation, an estimate of
 ${\rm\Delta}\tilde{P}$
can be obtained from the current measurements, which provides experimental evidence of the proposed
 ${\rm\Delta}\tilde{P}$
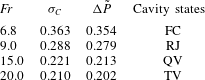
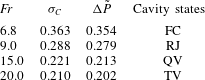
criterion. As an example, table 3 presents estimated
 ${\rm\Delta}\tilde{P}$
along with the observed closure modes for
 $B=9\,\%$
. The different Fr numbers are selected at
 $C_{Qs}=0.04$
to include different cavity states in the flow map shown in figure 5. As the table shows, as estimated
 ${\rm\Delta}\tilde{P}$
reduces, supercavity transitions from a RJ to a QV, and then to a TV closure, consistent with the proposed criterion. Note that the estimated
 ${\rm\Delta}\tilde{P}$
may differ slightly from the
 ${\rm\Delta}\tilde{P}$
in the proposed criterion due to the assumptions made to derive (4.7).
Variation of estimated
 ${\rm\Delta}\tilde{P}$
with cavity states for
 $B=9\,\%$
. Typical dimensional values of pressures inside and outside of the cavity can be obtained from the supplemental files.
Furthermore, we also conducted some experiments to study the effect of a relative change in pressure inside and outside of the cavity on supercavity closure for hybrid modes. In these experiments, the test-section pressure was adjusted independently with fixed Fr and
 $C_{Qs}$
. The results show that a slight change in the test-section pressure can lead to the transition of hybrid closure modes to stable modes. For instance, it is observed that for QVRJ closure, an increase in test-section pressure (i.e. larger
 $\tilde{P}_{out}$
and
 ${\rm\Delta}\tilde{P}$
) leads to a transition to the RJ mode, whereas a decrease in the pressure (i.e. smaller
 $\tilde{P}_{out}$
and
 ${\rm\Delta}\tilde{P}$
) makes the closure transition to a QV mode. It should be noted here that a change in test-section pressure is also coupled with a change in the value of
 $C_{Q}$
, which might also contribute to such closure transitions. Similarly, the recent study by Karn et al. (Reference Karn, Monson, Ellis, Hong, Arndt and Gulliver2015b
) suggests an effect of variation in
 ${\rm\Delta}\tilde{P}$
on supercavity closure under unsteady flow conditions.
It is worth pointing out that it is difficult to carry out pressure measurements inside and outside of the closure because of the presence of the highly unsteady two-phase flow at the supercavity rear portion, and limitations of the available experimental techniques. However, the evidence presented above provide both qualitative and quantitative support for our proposed
 ${\rm\Delta}\tilde{P}$
criterion in determining supercavity closure. The developed framework is now employed to further explain the experimental observations as follows.
4.1. Variation of closure with Fr or
 $C_{\mathbf{Qs}}$

Based on the above discussion, we postulate that the variation of flow conditions (i.e. the change in
 $C_{Qs}$
and Fr) leads to a change in
 ${\rm\Delta}\tilde{P}$
, thus causing the transition among closure modes reported in § 3.1. Specifically, for a fixed
 $B$
and Fr, an increase in
 $C_{Qs}$
implies an increase in cavity pressure, which results in higher
 $\tilde{P}_{in}$
. Since
 $\tilde{P}_{out}$
is little dependent on
 $C_{Qs}$
, the
 ${\rm\Delta}\tilde{P}$
is likely to continue decreasing with increasing
 $C_{Qs}$
. According to the proposed
 ${\rm\Delta}\tilde{P}$
criterion, this reduction of
 ${\rm\Delta}\tilde{P}$
can lead to a gradual transition of closure modes from RJ to QV, and then to TV, consistent with the observations presented in figure 6. On the other hand, for fixed
 $B$
and
 $C_{Qs}$
, an increase in Fr, corresponding to higher water velocity, leads to an increment in fluid dynamic pressure and a decrement in static pressure outside the closure, and thus reduces
 $\tilde{P}_{out}$
. However, the increase in Fr also leads to a reduction in
 $\tilde{P}_{in}$
due to the change in cavity geometry. Therefore, its net effect on
 ${\rm\Delta}\tilde{P}$
cannot be readily decoupled from
 $C_{Qs}$
. This phenomenon causes some subtle variation in closure-mode transition at different
 $C_{Qs}$
values upon change in Fr, as observed in figures 5 and 7.
4.2. Variation of supercavity closure with blockage ratios
The equation (4.7) provides a direct link between
 ${\rm\Delta}\tilde{P}$
and blockage ratios. As it shows, higher blockage leads to smaller
 ${\rm\Delta}\tilde{P}$
, promoting the occurrence of TV modes according to the proposed
 ${\rm\Delta}\tilde{P}$
criterion. This conclusion is consistent with the experimental observations and prior studies reported in § 3.2. It worthwhile noting that at a high blockage, two additional effects have a bearing on the
 ${\rm\Delta}\tilde{P}$
. First, the growth of the turbulent boundary layer at the test-section walls effectively reduces the flow area and leads to a longitudinal pressure gradient in the test section (Wu, Whitney & Brennen Reference Wu, Whitney and Brennen1971). Second, the wall viscous effect, which is neglected in the derivation of (4.7), may also become substantial. Nevertheless, these effects would contribute to a greater drop in
 $\tilde{P}_{out}$
, as compared to
 $\tilde{P}_{in}$
, thus resulting in a lower
 ${\rm\Delta}\tilde{P}$
, which is in favour of the occurrence of TV mode.
As shown in figure 10, the TV mode is dominant, even at the lowest blockage ratio, which indicates the presence of a considerable blockage effect in our experiments according to the proposed framework. This assessment is supported by a recent experiment using a large water tunnel (Skidmore Reference Skidmore2013). In this study, a maximum blockage ratio of 1.6 % is observed to yield RJ closure as the dominant mode, which is still significantly lower than the smallest
 $B$
in our experiments (i.e. 5 %). It is important to note that the effect of cavitator size may also play a role when interpreting the observations of RJ closure modes at different blockage ratios. According to a number of prior studies (Gopalan & Katz Reference Gopalan and Katz2000; Callenaere et al.
Reference Callenaere, Franc, Michel and Riondet2001; Kshatriya et al.
Reference Kshatriya, Patwardhan and Eaglesham2007), a slender cavity generated from a small cavitator does not yield sufficient adverse pressure gradient to create a re-entrant jet and consequently, TV is favoured. Gadd & Grant (Reference Gadd and Grant1965) conjectured that the observation of RJ modes in their water tunnel experiments with relatively high blockage (i.e.,
 $B=7$
–11 %) may be related to the large size of cavitators used (i.e., 8–14 cm in diameter). Therefore, it is possible that the attainment of the RJ closure mode in a closed-wall facility requires not only a low
 $B$
, but also a cavitator of sufficient size.
5. Summary and discussion
A study has been conducted to investigate the physical mechanisms determining the closure formation and transition between different closure modes for ventilated supercavitation. We carried out the experiments in a closed-wall recirculating water tunnel to image ventilated supercavity closure using high speed and high-resolution photography and to measure pressure inside the cavity over a wide range of flow conditions. Apart from the classical closure modes reported in the literature, the study has revealed a number of new closure modes occurring during the transition between classical modes, or under very specific flow conditions. We construct closure maps to depict the flow regimes of each closure mode as a function of Fr and
 $C_{Qs}$
for different blockage ratios. Based on the closure map, a critical ventilation flow rate is identified at each blockage ratio, and the corresponding critical air entrainment coefficient is found to be independent of blockage ratio. It has also been observed that in the process of generating a supercavity by increasing ventilation flow rate, the cavitation number gradually reduces to a minimum value and stays fixed upon further increment in ventilation rate. Once a supercavity is formed, the ventilation rate can be decreased to a much lower value with no change in cavitation number while still maintaining a supercavity. This process is accompanied by a transition in closure modes, which generally goes from twin vortex, to quad vortex and then to re-entrant jet. In addition, the blockage effect is shown to play an important role in promoting the occurrence of twin-vortex closure modes. Subsequently, a physical framework governing the variation of closure modes is proposed, and is used to explain mode transition upon change of flow conditions, including the blockage effect. In the discussion below, this framework is further extended to examine the closure variation across different types of flow facilities, the natural supercavity closure and the pulsating supercavity reported in the literature, and sheds light on a recent numerical study of supercavity internal flows.
5.1. Closure of a ventilated supercavity in a free-surface facility
The fundamentals established in § 4 can be extended to explain the different observations of supercavity closure obtained in a free-surface facility. For such a facility,
 $P_{out}$
is primarily controlled by the pressure at the free surface and the depth of submergence, which determines the hydrostatic pressure outside the supercavity, whereas
 $P_{in}$
is largely regulated by the ventilation flow rate. Specifically, unlike the closed-wall tunnel, both the pressure upstream of the cavity and the pressure outside the closure in a free-surface facility are dictated by the presence of the free surface, and are less dependent on Fr. Thus, for the same set of Fr,
 $C_{Qs}$
and upstream cavity pressure, the pressure difference at the closure
 $({\rm\Delta}\tilde{P})$
in a free-surface facility is generally larger than that in a closed-wall tunnel. According to our discussion in § 4, this difference in attainable
 ${\rm\Delta}\tilde{P}$
between facilities implies that free-surface facilities favour the occurrence of RJ over TV compared with the closed-wall tunnels influenced by the blockage effect. Similarly, the above discussion also suggests that for the same Fr and
 $C_{Qs}$
, an increasing depth of submergence leads to a consequent decrease in
 $C_{Q}$
, and promotes RJ over TV closure in a free-surface facility. These inferences are consistent with general trends of the closures observed in closed wall and free-surface facilities (e.g. Cox & Clayden Reference Cox and Clayden1956; Campbell & Hilborne Reference Campbell and Hilborne1958; Epshtein Reference Epshtein1973). Note that our reasoning does not preclude the possibility of TV occurrence in a free-surface facility, or the formation of RJ in a closed wall tunnel, but rather provides a qualitative comparison of the trends of occurrence of RJ or TV modes in different types of facilities.
5.2. On the closure of a natural supercavity
In a natural supercavity, the
 $P_{in}$
is equal to the vapour pressure. Therefore
 $P_{out}$
, determined by
 $B$
in a closed-wall tunnel or hydrostatic pressure head at the cavity closure for a free-surface facility, is usually much higher than
 $P_{in}$
. This large difference in pressure leads to a high value of
 ${\rm\Delta}\tilde{P}$
, and the occurrence of RJ closure is favoured based on our discussion in § 4. To verify this, natural supercavitation experiments are conducted at SAFL by systematically varying Fr at different values of
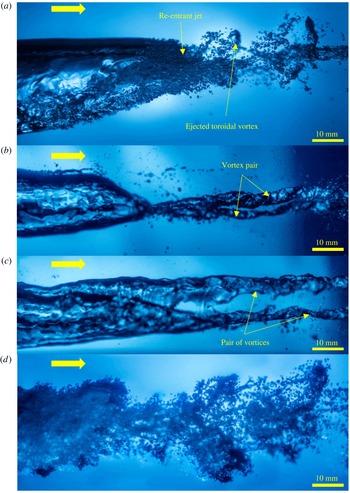
 $B$
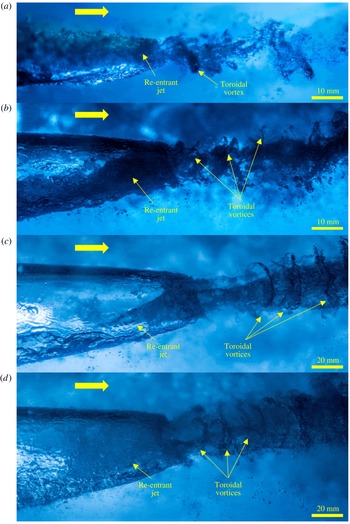
, and it is observed that the RJ closure is the dominant mode for a natural supercavity (figure 12). As the figure shows, the RJ closure is marked by the presence of such recurrent toroidal vortices in the wake of the cavity. According to Semenenko (Reference Semenenko2001a
), the re-entrant jet at the cavity rear creates a foamy region, which moves as a toroidal vortex, experiencing tangential stresses from the cavity wall and the forces due to the pressure gradient in the central part of the cavity. The growth of these vortices continues with the incoming vapour–water mixture until a time when both these forces (i.e. tangential force and pressure force) are equal and the vortices are ejected in a recurrent fashion. This invariable occurrence of RJ closure for natural supercavitation agrees with the experiments reported from different facilities (e.g. Logvinovich Reference Logvinovich1973; Hrubes Reference Hrubes2001; Semenenko Reference Semenenko2001a
; Vlasenko Reference Vlasenko2003; Zhang et al.
Reference Zhang, Wei, Zhang, Wang and Yu2007; Ahn et al.
Reference Ahn, Kim, Jun, Kim and Lee2013).
Closure images of natural supercavity at (a)
 $B=5\,\%$
, (b)
 $B=9\,\%$
, (c)
 $B=14\,\%$
, (d)
 $B=19\,\%$
. Note that the vortices are filled with water vapour. The horizontal arrow indicates the direction of the water flow.

5.3. On the occurrence of pulsating cavity closure
Based on our discussion in § 4, we posit that cavity pulsation may result from the periodic pressure fluctuations inside the cavity, which necessitates the presence of a free surface in the facility since the tunnel walls would restrict the radial expansion of the cavity associated with pulsation. Despite the debate regarding the mechanism of PC in the literature, a careful scrutiny of the experimental facilities in all the reported studies reveals the presence of a free surface either in the test section, or in a tank connected to the test section (e.g. Song Reference Song1961; Michel Reference Michel1984; Skidmore Reference Skidmore2013). This remark is further supported through a comparison among (Silberman & Song Reference Silberman and Song1961; Skidmore Reference Skidmore2013) and our current study. Specifically, Silberman & Song observed PC across a much wider range of flow conditions in a vertical water tunnel with two free surfaces compared to Skidmore’s experiments in a free-surface flume. In addition, in our current experiments at the SAFL closed-wall water tunnel, the pulsating cavity is not obtained even though the experiments are conducted over a wide range of water velocity and air ventilation flow rate at all blockage ratios.
5.4. Dependence of supercavity behaviour upon internal cavity flow
The previous sections have delineated how our proposed hypothesis can be used to explain the supercavity closure under a variety of flow environments. It is noteworthy that one of the key premises of our theory is that the internal flow within a ventilated supercavity can yield a non-uniform pressure distribution, and thus affect cavity closure. However, due to the experimental challenges involved in quantifying flows across a gas–water interface, very few researchers have examined internal cavity flows. Using a numerical approach, a recent study by Kinzel, Lindau & Kunz (Reference Kinzel, Lindau and Kunz2009) shows that the internal flow within the cavity core is intricately related to the ventilation flow rate. For
 $C_{Qs}$
greater than a threshold value (i.e.,
 $C_{Qs,thres}$
), the mean flow velocity inside the cavity core
 $(U_{C})$
is in the downstream direction (i.e.,
 $U_{C}>0$
) and a pressure-driven twin-vortex cavity results. For
 $C_{Q}$
close to
 $C_{Qs,thres}$
, there is negligible flow of air inside the cavity core and the mean flow velocity is close to zero, and a RJ closure occurs. On the other hand, when
 $C_{Qs}$
is less than
 $C_{Qs,thres,}$
there is flow recirculation inside the cavity and the mean flow velocity inside the cavity core is in the upstream direction (i.e.,
 $U_{C}<0$
). Here, we combine their numerical results with our proposed framework in § 4 to explain some interesting observations pertaining to closure transitions in our experiments, which highlights the significance of internal flow within a cavity. In particular, we will focus on the following four observations as noted in § 3:
(1) Critical ventilation flow rate: our experiments show a critical ventilation flow rate
 $(Q_{crit})$
for each blockage ratio, below which the supercavity collapses (i.e. transition to FC) as Fr is decreased from a large initial value. As shown in table 3, large
 ${\rm\Delta}\tilde{P}$
values lead to a transition of a supercavity into FC state. Based on our framework in § 4.1, as Fr is decreased at a fixed
 $B$
(or, cavitator cross-sectional area
 $A_{c}$
), the consequent reduction in dynamic pressure and increment of test-section pressure leads to an increment in
 $\tilde{P}_{out}$
. For the cavity to be sustained,
 $\tilde{P}_{in}$
has to be high enough to ensure
 $U_{C}>0$
, and prevent water at the cavity rear rushing into the upstream portion of the cavity causing cavity collapse. Since
 $\tilde{P}_{in}$
at different Fr depends upon the ventilation flow rate, there exists a critical ventilation flow rate corresponding to each cavitator, such that
 ${\rm\Delta}\tilde{P}$
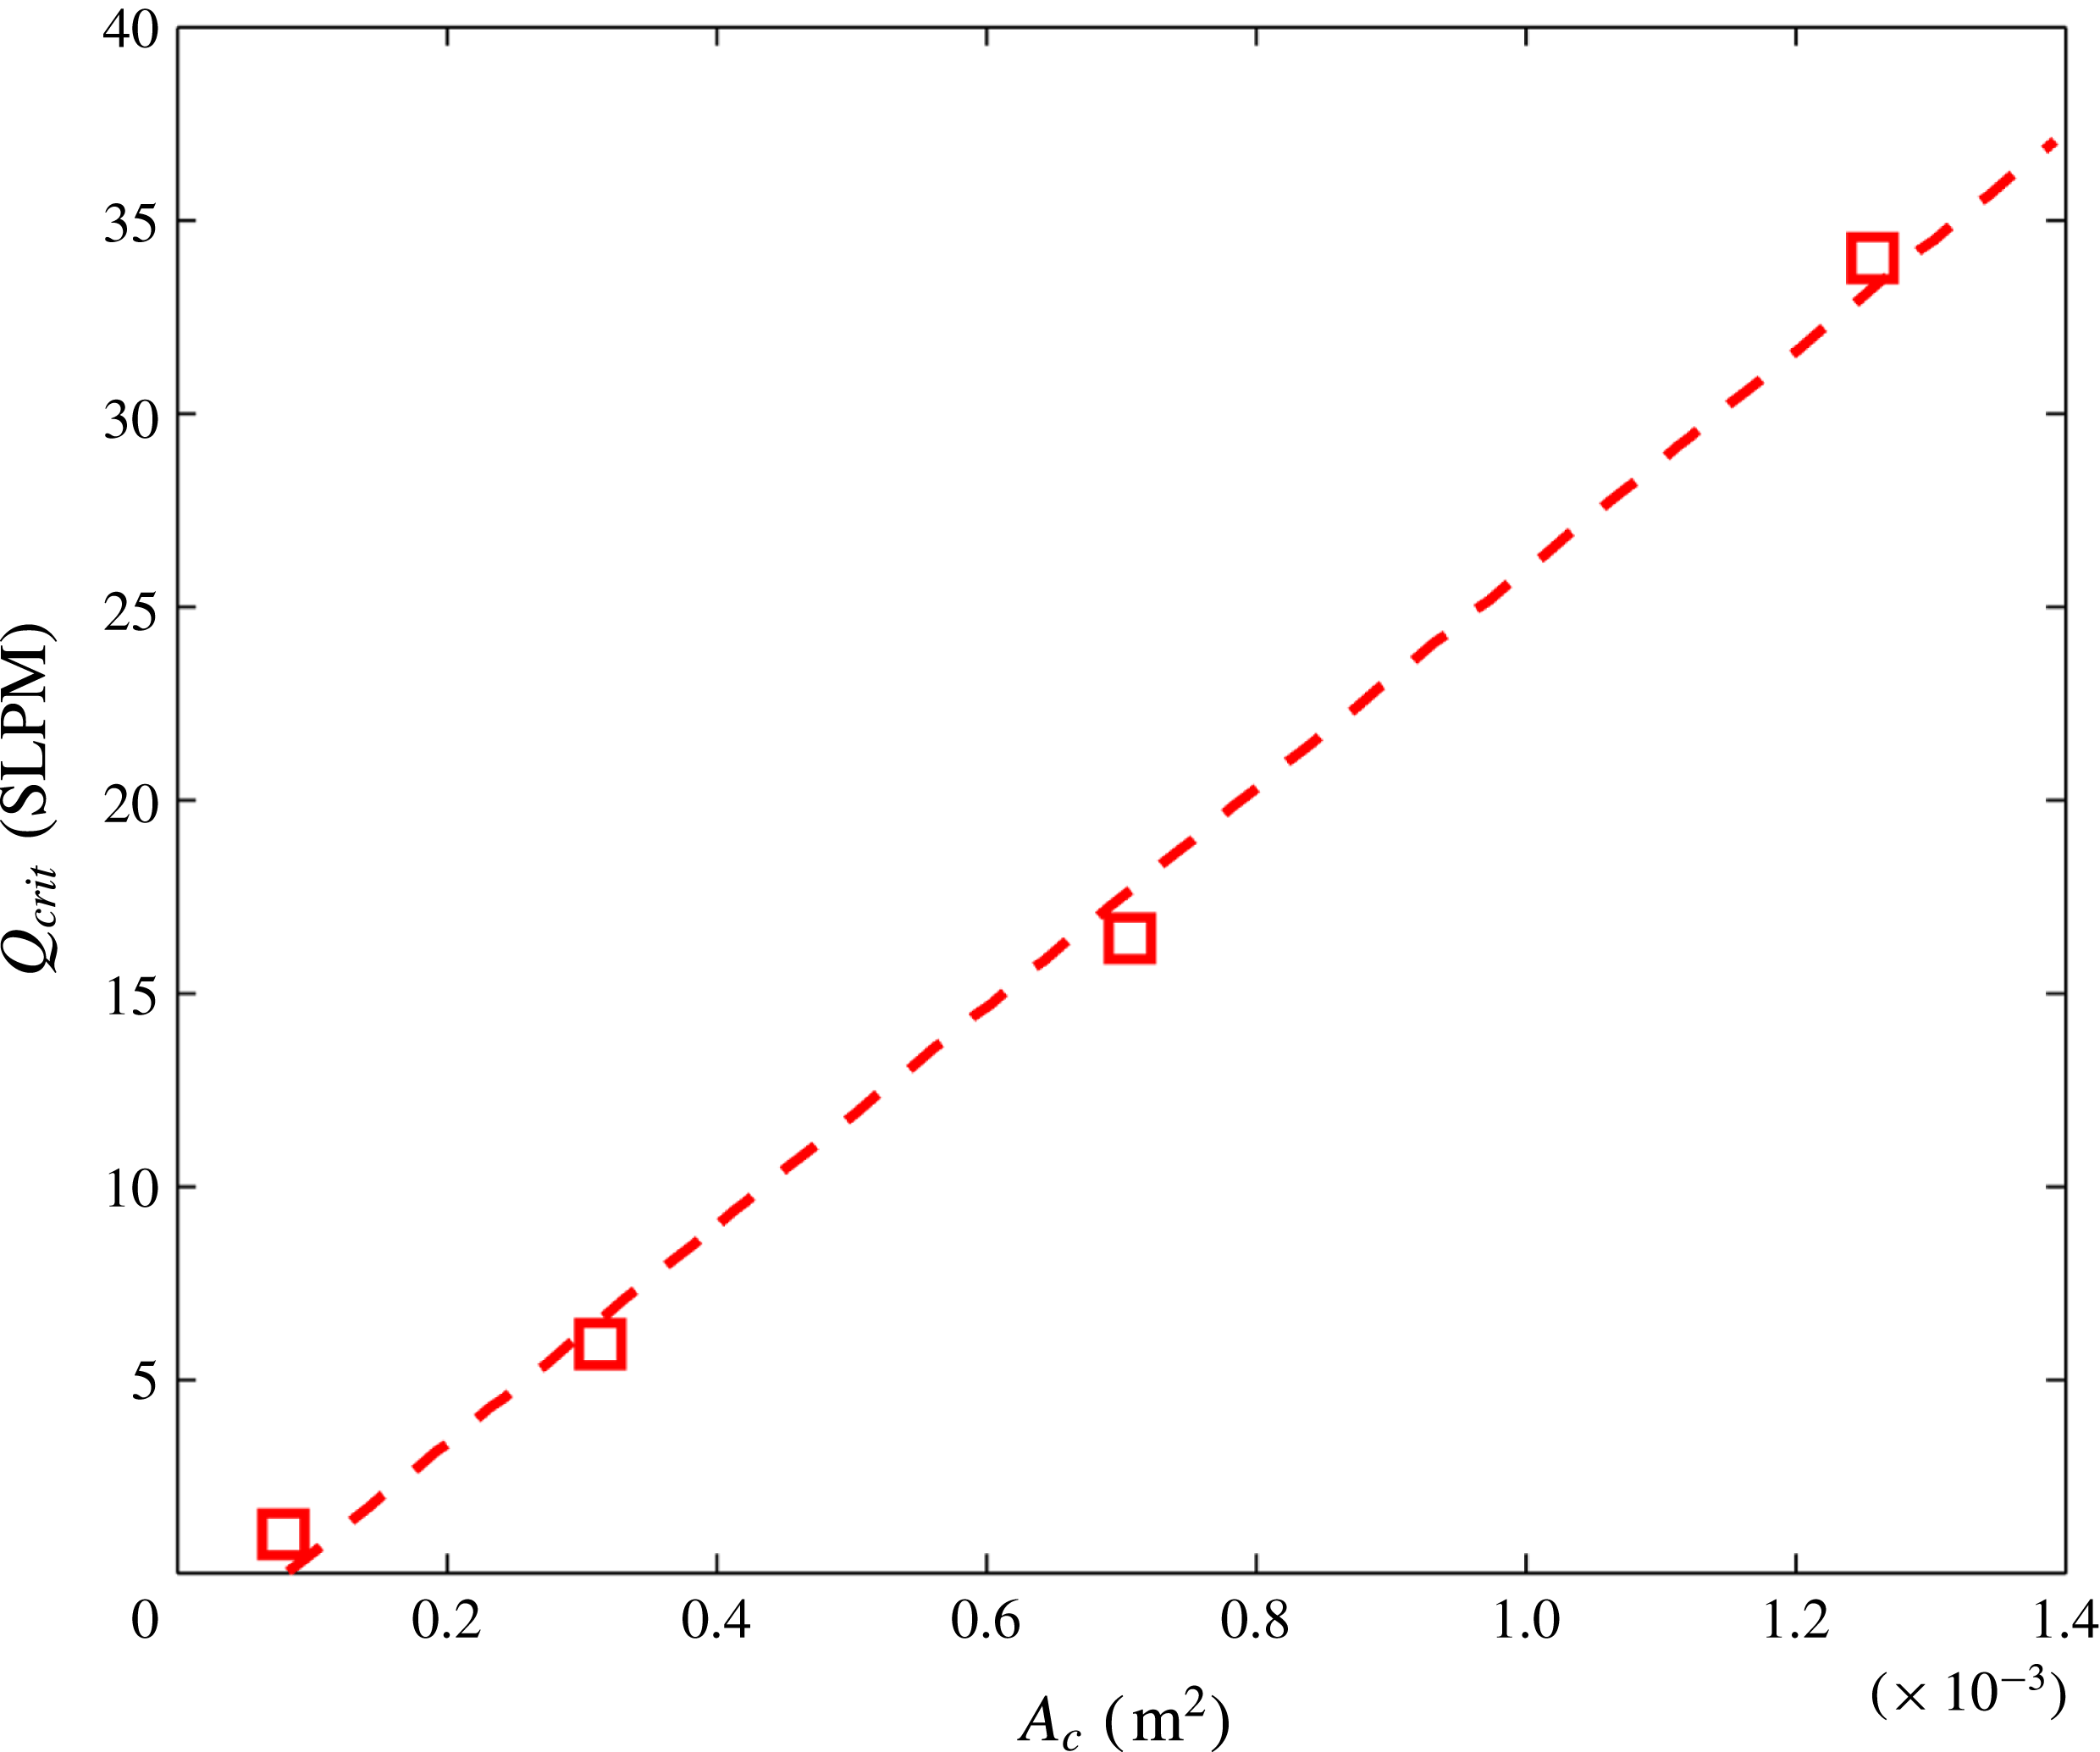
is small enough to prevent cavity collapse in the range of Fr tested. This argument has been supported by examining the dependence of
 $Q_{crit}$
on cavitator size presented in figure 13, which shows direct proportionality of
 $Q_{crit}$
with respect to
 $A_{c}$
.
(2) Ventilation hysteresis: significantly higher ventilation flow rate is required to establish a supercavity than to sustain it. FC consists of a number of closely packed small individual bubbles, which increase both in number and size upon increments in ventilation flow rate due to bubble coalescence events (Wu Reference Wu1972; Kshatriya et al.
Reference Kshatriya, Patwardhan and Eaglesham2007). With further increase in the ventilation flow rate, the bubbles along the periphery are subjected to high-shear flow, resulting in elongation and coalescence until a clear supercavity is formed. Thus, to drive this coalescence process into a supercavity necessitates sufficient ventilation flow to generate a pressure-driven twin-vortex cavity with
 $U_{C}>0$
. However, once a supercavity is formed, it is possible to maintain the cavity by lowering
 $C_{Qs}$
. Upon such reduction in ventilation flow, the internal cavity flow adapts itself (i.e.,
 $U_{C}$
reduces and becomes non-positive) with a simultaneous change in closure mechanism.
(3) Path selectivity: RJ closure cannot be generated from a foamy cavity by increasing ventilation flow rate. It can only be obtained by gradually decreasing ventilation flow rate from an established TV closure. This phenomenon is related to the ventilation hysteresis discussed above. According to our discussion, a minimum ventilation flow rate (i.e.
 $C_{Qs,thres}$
) is required to drive the process of bubble coalescence for generating the supercavity. For RJ closure,
 $U_{C}$
is close to zero, which generally corresponds to a large
 ${\rm\Delta}\tilde{P}$
and air entrainment coefficient below
 $C_{Qs,thres}$
. Therefore, RJ closure can only be obtained by lowering
 $C_{Qs}$
after the supercavity is formed.
(4) Susceptibility: the formation of RJ closure is sensitive to the changes in Fr and
 $C_{Qs}$
. During the transition from TV to RJ closure, an abrupt reduction in Fr or
 $C_{Qs}$
leads to cavity collapse. Further, RJ closure is stable only in a very narrow range of Fr and
 $C_{Qs}$
. As discussed above, the attainment of RJ requires
 $U_{C}$
to reduce to a value very close to zero. During this process, an abrupt change in water velocity or ventilation rate (corresponding to a change in Fr or
 $C_{Qs}$
) could set up a strong recirculation in the upstream direction (i.e.
 $U_{C}<0$
), causing cavity breakdown.
Dependence of
 $Q_{crit}$
upon
 $A_{c}$
. The square symbol denotes the
 $Q_{crit}$
corresponding to each cavitator used in the experiments, and the straight line is the least-square linear fit of the square symbols.

However, to substantiate above reasoning and elucidate the flow physics inside a supercavity requires some advanced imaging experiments across the water–supercavity interface, which might be considered in future investigations.
Acknowledgement
This work is supported by Office of Naval Research – United States (Program manager: Dr R. Joslin) under grant no. N000140910141 and the startup of J.H. from the University of Minnesota. A.K. acknowledges support from the Doctoral Dissertation Fellowship, Graduate School, University of Minnesota Twin cities. We also acknowledge the help of an undergraduate student from Department of Aerospace Engineering and Mechanics, Mr R. De, who helped with digital photography.
Supplementary data
Supplementary data is available at http://dx.doi.org/10.1017/jfm.2015.680.