


INTRODUCTION
Crime and violence impose severe costs on residents of affected areas. In high-violence contexts, state-provided security is typically concentrated in wealthier neighborhoods and central business districts, leaving urban peripheries to face chronic violence with little state protection (Caldeira and Holston Reference Caldeira and Holston1996; Koonings and Kruijt Reference Koonings, Kruijt, Koonings and Kruijt2007; Skaperdas Reference Skaperdas2001). Criminal markets—particularly the retail drug trade—are central drivers of this violence. Yet paradoxically, criminal organizations involved in illicit markets often establish informal institutions that restrict certain types of crime and provide public goods to residents (Arias Reference Arias2018; Arias and Barnes Reference Arias and Barnes2017; Blair et al. Reference Blair, Moscoso-Rojas, Castillo and Weintraub2022; Feltran Reference Feltran2012; Gambetta Reference Gambetta1993; Leeds Reference Leeds1996; Lessing Reference Lessing2021; Magaloni, Franco-Vivanco, and Melo Reference Magaloni, Franco-Vivanco and Melo2020; Skarbek Reference Skarbek2024).
The motives for such governance vary: to win local residents’ loyalty; to follow a particular organizational ethos (Firmino Amarante and Gonçalves de Melo Reference Firmino Amarante and Gonçalves de Melo2020); to deter state intervention (Blattman et al. Reference Blattman, Duncan, Lessing and Tobón2024); or to reassure clients in illicit markets (Blattman et al. Reference Blattman, Duncan, Lessing and Tobón2024; Lessing Reference Lessing2021; Magaloni, Franco-Vivanco, and Melo Reference Magaloni, Franco-Vivanco and Melo2020; Skarbek Reference Skarbek2024). While much research focuses on how criminal groups govern illicit markets, these organizations also govern the physical territories where those markets operate—areas inhabited by gang members, their families, and broader communities.
In this article, I show that where criminal governance creates order, predictability, and a safer business environment, it can foster local economic development. While conventional wisdom and prior research emphasize the negative economic externalities of crime, especially in contexts underserved by the state (Koonings and Kruijt Reference Koonings, Kruijt, Koonings and Kruijt2007), recent studies reveal that the effects of organized crime on development are heterogeneous. In areas where criminal entrants are numerous and governance remains extractive, organized crime depresses economic outcomes and material well-being (Brown et al. Reference Brown, Montero, Schmidt-Padilla and Sviatschi2025; Melnikov, Schmidt-Padilla, and Sviatschi Reference Melnikov, Schmidt-Padilla and Sviatschi2022).
Focusing on São Paulo, Brazil, I examine how the Primeiro Comando da Capital (PCC) reshaped the incentives for criminal conflict, sharply reduced homicides, and in doing so improved economic activity in previously violence-plagued areas. This study addresses one central research question: can criminal governance generate positive economic externalities? I contribute to the literature by showing that criminal governance can support development when organizations institutionalize rules and resolve disputes that previously fueled violence and instability.
Criminal governance arrangements have emerged in other high-violence contexts in Latin America and beyond, often motivated by a desire to minimize state intervention and protect illegal rents (Acemoglu, De Feo, and De Luca Reference Acemoglu, De Feo and De Luca2020; Blattman et al. Reference Blattman, Duncan, Lessing and Tobón2024; Buonanno et al. Reference Buonanno, Durante, Prarolo and Vanin2015; de la Sierra Reference de la Sierra2020; Gambetta Reference Gambetta1993; Lessing Reference Lessing2021; Varese Reference Varese2006; Volkov Reference Volkov2002). However, much of the existing empirical work has focused on criminal organizations that rely on protection rackets and extortion as a business model (Brown et al. Reference Brown, Montero, Schmidt-Padilla and Sviatschi2025; Melnikov, Schmidt-Padilla, and Sviatschi Reference Melnikov, Schmidt-Padilla and Sviatschi2022). By contrast, the PCC’s governance model in São Paulo is distinctive: it does not engage in systematic extortion of residents or local businesses, instead funding its operations primarily through drug trafficking (Biondi Reference Biondi2014; Dias Reference Dias2008).
Long-run positive externalities from criminal governance are rare, in part because such governance is typically fragile—constantly contested by the state and rival gangs (Brown et al. Reference Brown, Montero, Schmidt-Padilla and Sviatschi2025; Bruhn Reference Bruhn2021; Zaluar and Barcellos Reference Zaluar and Barcellos2013). São Paulo presents a notable exception. Over the 1990s and 2000s, the PCC introduced a qualitatively different model of criminal governance aimed explicitly at imposing order and pacifying the criminal ecosystem through regulation (Biondi Reference Biondi2016; Feltran Reference Feltran2018). In doing so, the PCC developed the bureaucratic and enforcement capacity to deliver state-like functions, including violence control, contract enforcement, and dispute resolution—hallmarks of what Tilly (Reference Tilly, Evans, Rueschemeyer and Skocpol1985) describes as foundational state functions.
Drawing on previous ethnographic research and my own fieldwork, I theorize that the PCC improves the business environment by introducing order, predictable rule enforcement, and credible dispute resolution mechanisms, fostering a degree of legitimacy absent in Brazil’s urban peripheries, where the state often operates extrajudicially (Barcellos Reference Barcellos1992; Brinks Reference Brinks2003; Ruotti Reference Ruotti2016). Building on the criminal governance literature, I document the economic development impacts of “hegemonic organized crime” (Feltran Reference Feltran2018) by studying São Paulo’s peripheries—the largest and most economically significant urban region in South America. My econometric analysis focuses on the staggered spread of the PCC across São Paulo’s favelas and peripheries, capitalizing on temporal and spatial variation in gang presence between 2003 and 2013.
To identify these effects, I leverage the plausibly exogenous timing of PCC territorial expansion, following the identification strategy in Biderman et al. (Reference Biderman, de Mello, de Lima and Schneider2019). I implement a difference-in-differences (DiD) design, comparing favelas newly exposed to PCC governance with those not-yet-treated, focusing on outcomes such as formal employment, firm creation, and nighttime luminosity as a proxy for informal economic activity (Zhao et al. Reference Zhao, Zhou, Li, Cao, He, Yu and Li2019). I improve upon prior approaches by adopting the double-robust estimator for staggered treatment effects developed by Callaway and Sant’Anna (Reference Callaway and Sant’Anna2021), which corrects for known biases in traditional two-way fixed-effects models.
My analysis draws on administrative employment data (RAIS), satellite-based luminosity data (DMSP-OLS), Brazilian census data (IBGE 2001; 2011), and original geocoded data on PCC presence based on millions of citizen reports to São Paulo’s crime hotline (Biderman et al. Reference Biderman, de Mello, de Lima and Schneider2019). To address potential identification threats, I complement the quantitative analysis with field interviews with São Paulo police officers and engage with extensive ethnographic and sociological scholarship on PCC governance (Biondi Reference Biondi2014; Feltran Reference Feltran2018; Lessing Reference Lessing2021).
My findings show that PCC entry into a territory causes economically and statistically significant increases in the number of formal jobs and formal firms. I also find that PCC presence increases the levels of nighttime luminosity in São Paulo’s favelas. I interpret the results in light of previous qualitative findings on the PCC’s operations, arguing that unlike criminal organizations that control territories through overt armed presence, the PCC operates as a rules-based institution that fosters coordination and reduces inter-gang conflict (Feltran Reference Feltran2008a; Reference Feltran2018).
This article makes several contributions to the literature on crime, governance, and development. First, it provides causal evidence that criminal governance, when institutionalized and hegemonic, can generate positive economic externalities in contexts of chronic state absence. While previous research has documented the negative developmental impacts of extortion-based or fragmented criminal governance (Brown et al. Reference Brown, Montero, Schmidt-Padilla and Sviatschi2025; Melnikov, Schmidt-Padilla, and Sviatschi Reference Melnikov, Schmidt-Padilla and Sviatschi2022), I show that a rules-based, non-extractive governance regime like that of the PCC can reduce violence and improve local economic conditions simultaneously.
Second, this study extends the political economy of violence literature by theorizing how criminal organizations can transform local economic environments by reshaping both the “world of crime” and the conditions for licit market activity (Acemoglu, De Feo, and De Luca Reference Acemoglu, De Feo and De Luca2020; Gambetta Reference Gambetta1993; Volkov Reference Volkov2002). Third, methodologically, this article advances identification strategies in the study of criminal governance by applying state-of-the-art staggered DiD estimators (Callaway and Sant’Anna Reference Callaway and Sant’Anna2021) to new administrative and geospatial data on criminal presence and economic outcomes. Finally, by focusing on São Paulo—a large, economically central, and theoretically pivotal case—I offer findings that speak to broader debates on non-state governance, institutional order, and development in weak-state settings globally.
CONTEXT: CRIMINAL GOVERNANCE IN THREE ANALYTICAL PERIODS
São Paulo’s experience with the PCC offers a crucial setting for testing how criminal governance can simultaneously reduce violence and improve local economic conditions. The city’s transformation from fragmented, violent criminal competition to hegemonic, rule-based governance presents what Eckstein (Reference Eckstein2000) calls a “crucial case” and Gerring (Reference Gerring2007; Reference Gerring, Boix and Stokes2011) labels a “pathway case” for theory development. The PCC’s emergence and territorial consolidation reshaped both homicide dynamics (Biderman et al. Reference Biderman, de Mello, de Lima and Schneider2019; Feltran Reference Feltran2010; Reference Feltran2012) and the local business environment, providing a rare empirical opportunity to assess how non-state actors affect both domains.
In the late 1990s, São Paulo’s criminal world was marked by highly localized gang competition and extreme violence, often referred to as the “gang wars” period. Violence stemmed largely from competition over drug market rents, where territory changed hands frequently through force. This instability had two compounding effects:
-
1. High homicide rates: endless cycles of revenge killings and territorial disputes drove homicide levels to among the world’s highest for a city of São Paulo’s size.
-
2. Hostile business environment: the violence produced severe economic externalities—businesses faced direct threats (e.g., robbery, theft, and closure due to violence) and indirect costs (e.g., reduced consumer mobility, infrastructure damage, and elevated security risks).
Additionally, police forces contributed to instability, often siding with one gang over another based on bribes or personal networks. Meanwhile, prisons were ungoverned spaces, fostering the very criminal rivalries that spilled over into street violence (Biondi Reference Biondi2016; Ruotti Reference Ruotti2016).
By the early 2000s, the PCC had established internal prison hegemony, curbing violence within correctional facilities through rule-based conflict resolution and credible deterrence mechanisms (Biondi Reference Biondi2016). Importantly, this model began diffusing from prisons to peripheral neighborhoods. The “white flag” period marks the start of intentional street-level governance by PCC affiliates, many of whom returned to their home territories after incarceration. Three key governance innovations transformed both the violence landscape and the business environment:
-
1. Prohibition on unauthorized homicides: violence, particularly lethal violence, became centrally regulated and significantly reduced (Biderman et al. Reference Biderman, de Mello, de Lima and Schneider2019; Feltran Reference Feltran2018).
-
2. Arms control: the visible circulation of firearms diminished, lowering the probability of opportunistic violence that could disrupt daily life and commerce (Feltran Reference Feltran2018).
-
3. Drug market regulation: the cartelization of retail drug markets prohibited competitive violence among dealers, standardizing prices and bribes, and creating predictable conditions for informal economic activity (Lessing and Willis Reference Lessing and Willis2019).
-
4. Consignment-based incentives: by providing drugs on consignment, the PCC aligned dealer incentives with long-term compliance and stability (Lessing and Willis Reference Lessing and Willis2019).
These interventions had dual effects: they drastically curtailed homicides while also reducing transaction risks for local businesses, both licit and illicit.
Starting in 2003, depending on the locality, the PCC established full territorial and institutional hegemony across São Paulo’s favelas and peripheries (Feltran Reference Feltran2008a; Reference Feltran2008b; Reference Feltran2011). The period between 2003 and 2012 represents the apex of rule-based criminal governance in the city. Homicide rates fell sharply citywide, a trend directly linked in time and geography to PCC expansion (Biderman et al. Reference Biderman, de Mello, de Lima and Schneider2019). More subtly, but equally important for this study, the business environment improved in several ways:
-
• Reduced violent risk for businesses: retail shops, banks, and small firms faced lower threats of robbery, extortion, and interpersonal violence (Biondi Reference Biondi2014; Dias Reference Dias2008).
-
• Stabilization of consumer mobility: residents could safely circulate and engage in market activity, facilitating demand-side economic growth.
-
• Protection from police disruptions: by reducing visible crime and using strategic bribery, the PCC minimized police incursions, making neighborhoods more predictable for investment and trade (Blattman et al. Reference Blattman, Duncan, Lessing and Tobón2024; Ruotti Reference Ruotti2016).
-
• Expanded informal and formal markets: as trust in neighborhood safety grew, residents and outside actors alike became more willing to invest in businesses and infrastructure, increasing both informal economic activity (proxied by nighttime luminosity) and formal economic indicators such as employment and firm creation.
Scholars have documented a range of PCC governance practices that likely contributed to this dual transformation: theft and robbery prohibitions (Biondi Reference Biondi2014; Dias Reference Dias2008); limits on local boss discretion and intra-gang violence (Feltran Reference Feltran2012); formalized forums for conflict resolution (Biondi Reference Biondi2014); protection for victims of domestic violence (Ruotti Reference Ruotti2016); and the strategic regulation of police–community interactions (Ruotti Reference Ruotti2016). Together, these measures drove down violence and reduced key barriers to economic development.
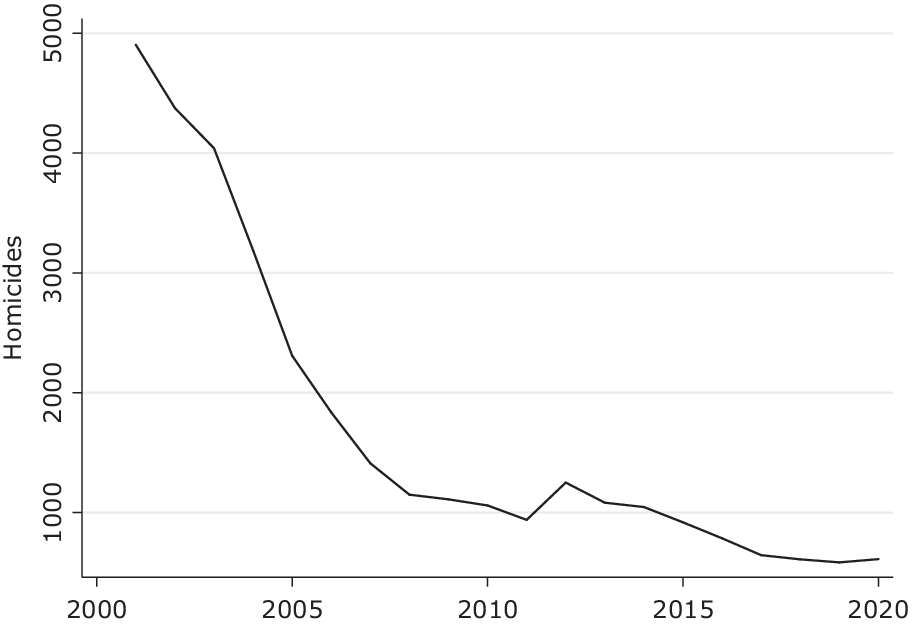
Figure 1 illustrates the dramatic decline in homicides coinciding with PCC territorial expansion (2003–09). In the empirical analysis that follows, I evaluate whether these governance-induced reductions in violence were accompanied by improvements in formal employment, firm creation, and nighttime luminosity in São Paulo’s favelas.
The São Paulo Paradox: Homicide Reduction in the City of São Paulo as Criminal Governance Spreads
Note: Number of homicides per year in the city of São Paulo, based on data from Centro de Estudos da Metrópole (2021).

Figure 1. Long description
The Y axis is labeled Homicides and ranges from 0 to 5000 in increments of 1000. The X axis represents years from 2000 to 2020 in 5 year increments. The data line begins at its highest point in 2001 with approximately 4900 homicides. It shows a steep linear decrease until 2005 where it reaches approximately 2300. The downward trend continues at a slightly less aggressive rate until 2008 where it levels off near 1100. Between 2008 and 2011 the line remains relatively flat with a slight dip to 900 in 2011. There is a small peak in 2012 reaching approximately 1250 followed by a steady decline through the rest of the decade. By 2017 the number drops below 1000 and reaches its lowest point of approximately 600 in 2019 before a very slight uptick in 2020.
Notably, there is a contentious discussion in Brazil regarding the role of the PCC in pacifying São Paulo (Freire Reference Freire2018; Justus et al. Reference Justus, de Castro Cerqueira, Kahn and Moreira2018). Some authors, as well as the state security forces, argue that the PCC did not, in fact, decrease homicides in São Paulo, and any improvement observed during this period should be attributed mostly, or solely, to policies implemented by the state (Freire Reference Freire2018). A police prosecutor interviewed for this project emphatically stated that “this whole notion [i.e., the PCC pacified São Paulo] is a conspiracy theory.” In this article, I cannot rule out that improvement in public security practices in the State of São Paulo may have contributed to the reduction in homicides observed in Figure 1. However, the evidence in Biderman et al. (Reference Biderman, de Mello, de Lima and Schneider2019)—showing that the decrease in homicides can be observed at the favela level and is aligned with data on PCC expansion—is arguably stronger and is able to control for any policies being implemented in the state.
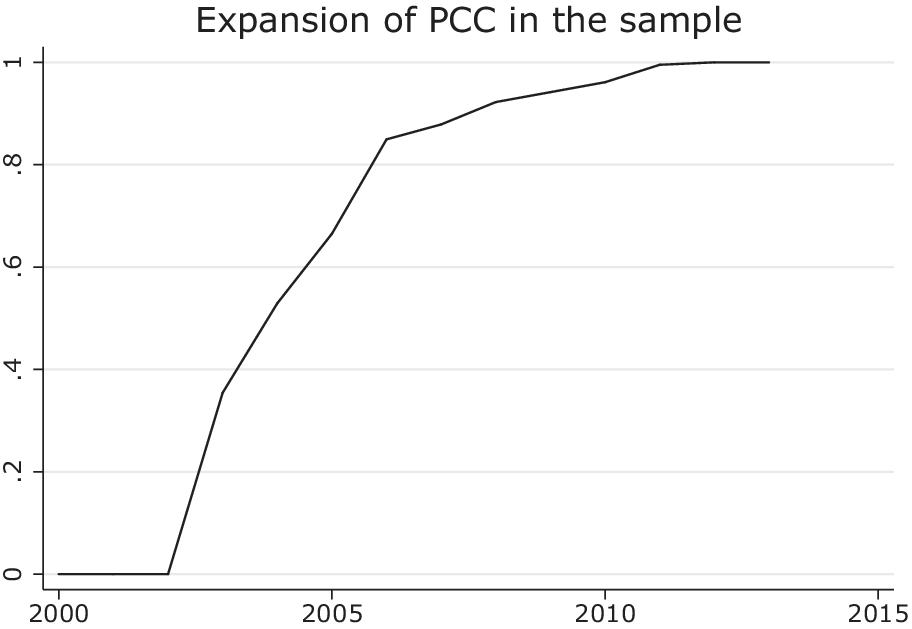
Meanwhile, studies such as Justus et al. (Reference Justus, de Castro Cerqueira, Kahn and Moreira2018) and Freire (Reference Freire2018) offer quantitative analyses that are limited from a qualitative perspective. Freire (Reference Freire2018), for instance, inaccurately claims that the PCC only fully consolidated its power in 2006 (see Figure 2) and that the subsequent decline in homicides was uniformly distributed across São Paulo. In reality, the PCC spread in favelas mostly between 2003 and 2006, and homicide rates declined more rapidly and sharply in the city’s favelas—areas that initially had the highest levels of violence (Biderman et al. Reference Biderman, de Mello, de Lima and Schneider2019). Justus et al. (Reference Justus, de Castro Cerqueira, Kahn and Moreira2018), on the other hand, use the number of PCC attacks in 2006 at the municipal level as a proxy for PCC strength, a measure that lacks theoretical justification. They overlook the fact that these attacks were strategically orchestrated and do not necessarily indicate the group’s actual power in those areas. In contrast, Biderman et al. (Reference Biderman, de Mello, de Lima and Schneider2019) find a homicide reduction associated with PCC expansion, employing a more robust identification strategy, leveraging granular datasets, and accounting for state-level policy changes. Their approach is better suited to isolating the impact of the PCC on homicide trends in São Paulo.
Share of the Areas in the Sample with Reports of PCC Activity
Note: Data on PCC activity come from Disque-Denúncia (Biderman et al. Reference Biderman, de Mello, de Lima and Schneider2019). The data include only areas (Área de Ponderação [APs]) where PCC activity has been reported at least once (purple in Figure 3).

Figure 2. Long description
The line graph plots the share of areas with P C C activity over time. The horizontal X axis represents years from 2000 to 2015 in five-year increments. The vertical Y axis represents the share from 0 to 1 in increments of point 2.
* From 2000 to 2002, the share remains at 0.
* Starting in 2002, there is a steep linear increase, reaching approximately point 35 by 2003 and point 65 by 2005.
* The growth rate slows slightly but remains positive, reaching point 85 by 2006.
* From 2006 to 2011, the line shows a gradual asymptotic curve upward, reaching point 95.
* By 2012, the share reaches 1 and remains at this maximum level through 2013.
THEORY
In this article, I argue that under specific institutional conditions, alternative providers of order and stability—such as criminal organizations—can generate significant economic gains in underserved urban areas. I posit that the institutional mechanisms developed to sustain criminal hegemony and reduce homicides—such as procedural rule enforcement, violence suppression, and market regulation—not only decreased violence but also mitigated the broader negative externalities of criminal disputes. In doing so, these institutions fostered greater predictability and reduced risk, enabling increased trade, investment, and economic development in previously marginalized and violence-prone urban regions.
Background
Classic scholarship has long noted the role of violent actors in providing governance where state capacity is weak (Gambetta Reference Gambetta1993; Varese Reference Varese2006; Volkov Reference Volkov2002). In contexts such as Italy and the former Soviet Union, mafia-like organizations created credible enforcement mechanisms that supported capitalist development. Extending this tradition, recent political economy research has highlighted the dual embeddedness of criminal governance in both legal markets and state politics (Acemoglu et al. Reference Acemoglu, De Feo, De Luca and Russo2022; Acemoglu, De Feo, and De Luca Reference Acemoglu, De Feo and De Luca2020; Acemoglu, Robinson, and Santos Reference Acemoglu, Robinson and Santos2013; Blattman et al. Reference Blattman, Duncan, Lessing and Tobón2023; Reference Blattman, Duncan, Lessing and Tobón2024; Dipoppa Reference Dipoppa2021; Trudeau Reference Trudeau2022).
Yet the economic consequences of criminal governance remain contested. On the one hand, criminal control often undermines investment, entrepreneurship, and welfare (Brown et al. Reference Brown, Montero, Schmidt-Padilla and Sviatschi2025; Melnikov, Schmidt-Padilla, and Sviatschi Reference Melnikov, Schmidt-Padilla and Sviatschi2022). On the other hand, studies such as Sobrino (Reference Sobrino2020) and Blattman et al. (Reference Blattman, Duncan, Lessing and Tobón2024) reveal more nuanced patterns. Sobrino (Reference Sobrino2020) finds that violent cartel competition in Mexican poppy-growing regions coincided with both higher homicide rates and improved access to public services among the poor. Blattman et al. (Reference Blattman, Duncan, Lessing and Tobón2024), focusing on Medellín, show that non-extortionary, drug-funded gangs sometimes provide governance to stabilize territory and minimize state intervention.
Theoretical Expectations
When you consider that the main violence indicator is homicide, the feeling of security may increase (…) but beyond that…. the legitimacy built by the crime is large and people are not afraid anymore… The crime is not there to steal and kill [anymore], sometimes it is even there to protect. Criminals’ dialogue with the communities has created a way for commerce to come in, for public transit to come in. The man who installs internet is not scared, because he knows nothing will happen to him. There may not be a police patrol, but there is another security.Footnote 1
A key unresolved question in this literature concerns the conditions under which criminal governance reduces violence in a sustained, predictable manner, thereby facilitating economic development. I argue that scale, hegemony, and institutionalization are central. Unlike fragmented or competition-driven criminal rule, hegemonic criminal governance—where a single actor establishes durable and predictable authority—reduces both current and future conflict incentives.
The PCC governance in São Paulo exemplifies this logic. Drawing on ethnographic (Biondi Reference Biondi2014; Feltran Reference Feltran2018; Lessing Reference Lessing2021; Lessing and Willis Reference Lessing and Willis2019; Ruotti Reference Ruotti2016) and quantitative research (Biderman et al. Reference Biderman, de Mello, de Lima and Schneider2019), I document how PCC hegemony suppresses intra-gang and inter-gang violence through three institutional mechanisms: informal procedural justice, arms control, and market regulation. Rule enforcement follows collegiate decision making, with predictable sanctions implemented—attributes that enhance institutional legitimacy (Feltran Reference Feltran2018).
PCC governance minimizes both horizontal violence (gang-on-gang) and vertical violence (community-targeted coercion). Unlike extractive models observed elsewhere (Brown et al. Reference Brown, Montero, Schmidt-Padilla and Sviatschi2025; Melnikov, Schmidt-Padilla, and Sviatschi Reference Melnikov, Schmidt-Padilla and Sviatschi2022), PCC governance forbids theft, extortion, and petty crime (Biondi Reference Biondi2014; Ruotti Reference Ruotti2016). For example, Ruotti (Reference Ruotti2016) reports how the arrival of PCC in one favela eliminated chronic theft, improving commercial viability for small businesses. Further, by reducing unpredictability and physical risk, PCC governance addresses key barriers to investment in peripheries (Arias and Barnes Reference Arias and Barnes2017; Koonings and Kruijt Reference Koonings, Kruijt, Koonings and Kruijt2007). This shift reshapes residents’ time horizons and trust in local institutions (Malvasi Reference Malvasi2012; North, Wallis, and Weingast Reference North, Wallis and Weingast2008), encouraging household and commercial investment.
Unlike the unstable peace generated by temporary truces (Brown et al. Reference Brown, Montero, Schmidt-Padilla and Sviatschi2025), the PCC’s sustained hegemony lowers expectations of future conflict. This is crucial: the predictability of future security conditions is what distinguishes PCC-led governance from more transient forms of criminal order (Feltran Reference Feltran2018). I posit that hegemonic criminal governance—characterized by scale, institutionalization, and non-extractive rule—can produce positive economic externalities in contexts of state absence. By mitigating both direct (violence) and indirect (uncertainty, coercion) barriers to investment, such governance transforms local economies. While these developments emerge from illegitimate actors, they produce de facto public goods.
In contrast, where criminal governance remains fragmented, extractive, or unpredictable, economic outcomes will likely remain negative, as shown in studies of extortion-heavy regimes (Brown et al. Reference Brown, Montero, Schmidt-Padilla and Sviatschi2025; Melnikov, Schmidt-Padilla, and Sviatschi Reference Melnikov, Schmidt-Padilla and Sviatschi2022). The São Paulo case thus illustrates how scale and institutional design within criminal organizations shape their developmental impact.
RESEARCH DESIGN
This study employs a multi-method research design to estimate the causal effects of the PCC’s territorial expansion on economic development outcomes in São Paulo’s underserved urban areas. I implement two complementary empirical strategies to evaluate the PCC’s impact on both formal economic indicators (employment and firm creation) and informal economic activity (proxied by nighttime luminosity). Both approaches leverage the plausibly exogenous, staggered timing of PCC expansion across São Paulo’s favelas and peripheries.
Following the identification strategy developed by Biderman et al. (Reference Biderman, de Mello, de Lima and Schneider2019), I compare units exposed to PCC presence at a given time to geographically and temporally comparable units not-yet-treated—those exposed later to PCC governance. This DiD design exploits staggered treatment timing (Callaway and Sant’Anna Reference Callaway and Sant’Anna2021) to isolate the effect of PCC expansion while accounting for time-invariant unit characteristics and common shocks.
Measuring PCC Presence
The independent variable—PCC presence—is drawn from over 10 million geolocated reports to São Paulo’s public–private crime hotline, Disque-Denúncia, between 2003 and 2012 (Biderman et al. Reference Biderman, de Mello, de Lima and Schneider2019). I classify a favela as treated upon observing two consecutive reports mentioning PCC-related keywords (e.g., “the brothers” and “the Party”) usually linked to drug trafficking, prison breaks, illegal utilities, or graffiti. Textual data were processed via text-as-data methods by Biderman et al. (Reference Biderman, de Mello, de Lima and Schneider2019), as detailed in the Supplementary Material. Given that underreporting is possible, I treat these measures as conservative lower bounds on actual PCC presence. For replication data, see Pantaleão (Reference Pantaleão2025).
Units of Analysis and Outcome Variables
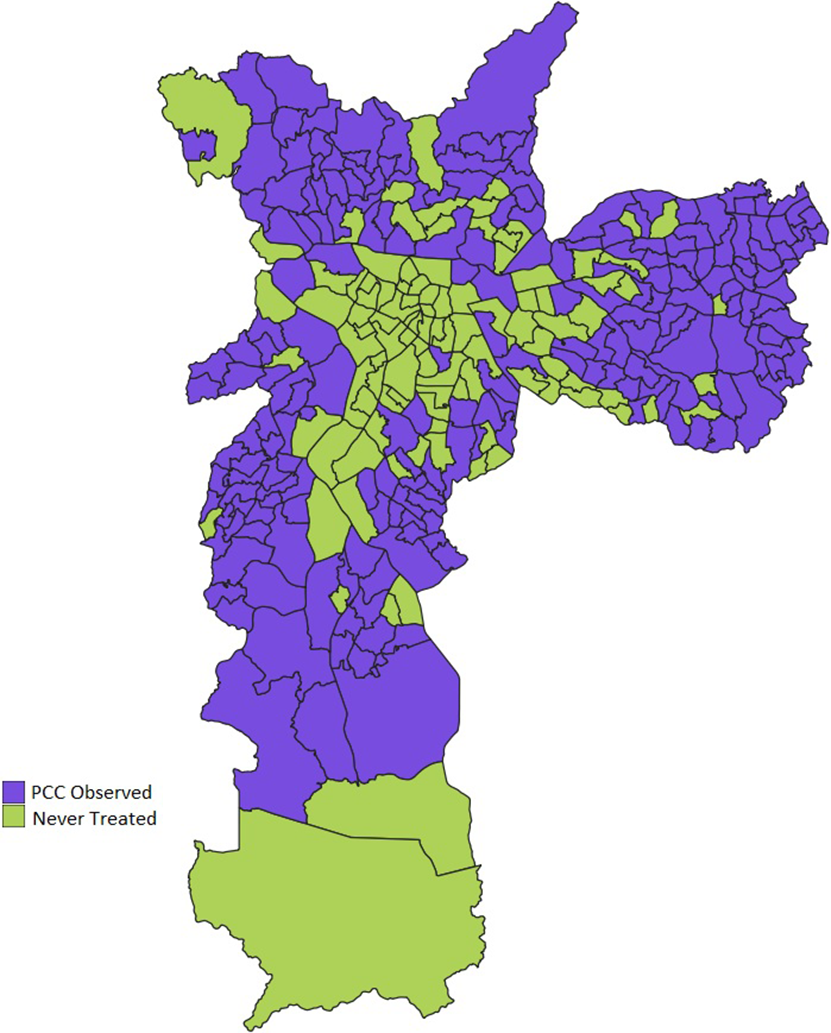
For formal economic outcomes, the unit of analysis is the AP—a spatial unit aggregating contiguous census tracts with similar infrastructure and sociodemographics (see Figure 3), widely used in Brazilian urban policy (GeoSampa 2016). I focus on 206 APs that contain favelas and experienced PCC presence at some point between 2003 and 2013. I define treatment at the AP level as the first instance where any favela within an AP registers PCC presence. All purple APs in Figure 3 contain at least one favela where I have reports of PCC presence.
APs in the City of São Paulo Containing Favelas and Reports of PCC Presence
Note: The central green units are much richer areas in the baseline that were never treated. Meanwhile, the staggered sample of interest is made up of APs in poorer areas that have favelas within them and where I observe PCC presence through Disque-Denúncia. I do not directly compare these groups in the regression models as they all focus on the staggered sample that is more comparable. Map is based on Disque-Denúncia (Biderman et al. Reference Biderman, de Mello, de Lima and Schneider2019) and São Paulo City data.

Figure 3. Long description
A geographical map of São Paulo divided into numerous small administrative units. The map uses a two-color legend located at the bottom-left.
* At the center of the city, there is a dense cluster of light green units labeled Never Treated. These units extend slightly toward the South and Northwest.
* Surrounding this central core, the majority of the city is shaded in purple, labeled P C C Observed.
* In the North and Northeast, purple units dominate the landscape with only a few scattered green units.
* To the East, a large, elongated section of the city is almost entirely purple.
* In the South, the map transitions from purple units into several very large light green units at the southernmost tip.
* The West and Northwest peripheries are primarily purple, with a small cluster of green units at the far Northwest edge.
For the informal economic outcomes, I conduct a second analysis at the favela level, using nighttime luminosity (DMSP-OLS) data as a proxy for informal economic development (Zhao et al. Reference Zhao, Zhou, Li, Cao, He, Yu and Li2019). This finer-grained approach leverages the same identification design but focuses on the favela as the treatment unit. Employment and firm data come from RAIS (Ministry of Labor) and are aggregated at the AP level. Nighttime light data are obtained from the National Oceanic and Atmospheric Administration’s Earth Observation Group and processed by the Payne Institute for Public Policy (NOAA N.d.).
Identification Strategy: Difference-in-Differences
The staggered timing of PCC entry across favelas allows me to identify treatment effects by comparing treated units with not-yet-treated units over time (Callaway and Sant’Anna Reference Callaway and Sant’Anna2021; Magaloni, Franco-Vivanco, and Melo Reference Magaloni, Franco-Vivanco and Melo2020). This setup mitigates concerns about confounding time trends. I further improve on prior work (Biderman et al. Reference Biderman, de Mello, de Lima and Schneider2019) by adopting double-robust difference-in-differences (drDiD) estimators, which avoid biases associated with negative weighting inherent in traditional two-way fixed-effects models (Callaway and Sant’Anna Reference Callaway and Sant’Anna2021). This approach estimates the average treatment effect on the treated by cohort and time since treatment, allowing me to construct event-study plots showing dynamic treatment effects.
For model specification, I estimate

where Y represents the dependent variable of interest, T represents the measurement of time and takes the value of each unit of time (e.g., 2001, 2002, and 2003), and G is the variable that defines the treatment cohort, taking the value of t when the unit was treated for the first time (e.g., if PCC is reported in a favela in 2003, then G = 2003 for that unit). The model assumes that once treatment begins, it cannot be reversed—a condition supported by the data. The estimator calculates the average effect of treatment, e years after implementation, for each cohort treated at that time. The results are grouped and used to plot the event studies that are showcased below (Figures 4– 6).
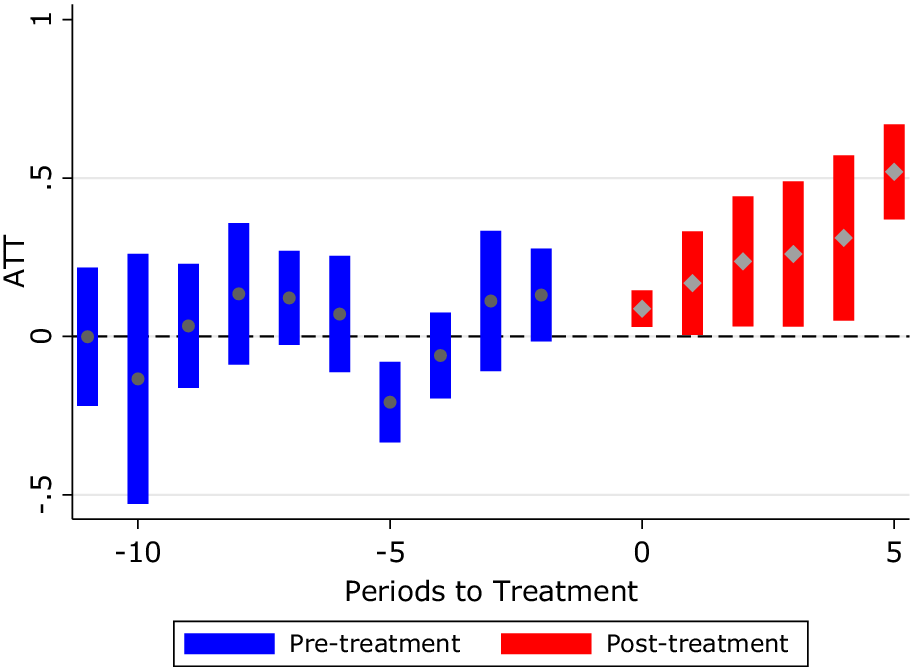
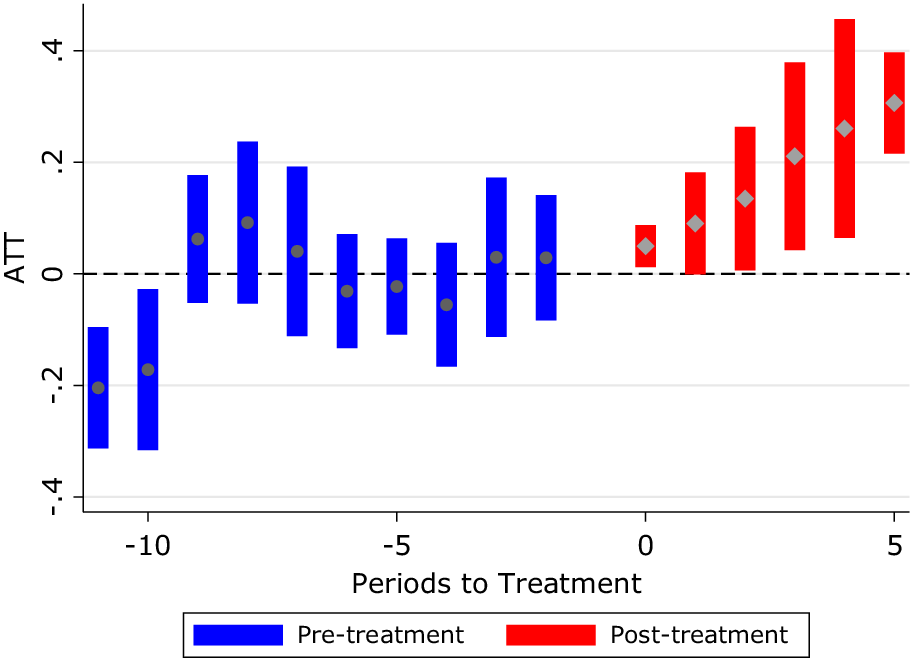
Job Creation Subsequent to PCC Entry
Note: This figure presents the event-study specifications described in the model. The results were obtained by the author using Callaway and Sant’Anna (Reference Callaway and Sant’Anna2021) with data from RAIS/Ministry of Labor. The units of analysis are highlighted in Figure 3. The model includes a control for subprefecture, which accounts for location-specific public policies. The estimator does not provide coefficients for controls. The event study displays the evolution of outcomes over time.

Figure 4. Long description
The Y-axis is labeled A T T and ranges from negative 0.5 to 1. The X-axis is labeled Periods to Treatment and ranges from negative 11 to 5. A horizontal dashed line marks the zero point on the Y-axis.
From left to right:
- Pre-treatment phase (periods negative 11 to negative 2): Represented by blue vertical bars with grey circular markers. The markers fluctuate around the zero line, with the lowest point at period negative 10 and the highest pre-treatment point at period negative 8. Most confidence intervals (blue bars) cross the zero line.
- Post-treatment phase (periods 0 to 5): Represented by red vertical bars with grey diamond markers. Starting at period 0, there is a consistent upward linear trend. The point estimate at period 0 is slightly above zero, and each subsequent period shows a higher A T T value, reaching approximately 0.5 by period 5. The confidence intervals (red bars) for periods 1 through 5 are entirely above the zero line, indicating statistical significance.
To validate the parallel trends assumption, I conduct placebo tests and visualize pre-treatment dynamics via event-study plots (Callaway and Sant’Anna Reference Callaway and Sant’Anna2021). Additional tests using the 2000 Brazilian Census (IBGE 2001) data reveal no significant pre-existing differences in social development indicators between early- and late-treated favelas. I also implement tests using OLS and Poisson estimates, and using newer estimators following Borusyak, Jaravel, and Spiess (Reference Borusyak, Jaravel and Spiess2024) to ensure robustness across alternative DiD specifications. Further, I replicate and extend Biderman et al. (Reference Biderman, de Mello, de Lima and Schneider2019) by re-analyzing homicide data with updated methods (results in the Supplementary Material).
Threats to Identification
Three main threats could bias results. (1) Measurement error in PCC presence would mean false positives or delayed reporting in Disque-Denúncia data could misclassify treatment timing. Following Biderman et al. (Reference Biderman, de Mello, de Lima and Schneider2019), I address this by adopting conservative coding rules and conducting robustness checks. (2) Selection bias in PCC expansion: PCC might expand into areas with favorable pre-trends. Census-based placebo tests and pre-trend analyses suggest no such bias. (3) Changes in reporting or law enforcement response: as Biderman et al. (Reference Biderman, de Mello, de Lima and Schneider2019) show, PCC entry does not significantly affect victimization survey reporting rates or police seizure patterns, reducing concern that changes in state behavior are driving results.
Qualitative Validation
This quantitative analysis is informed and corroborated by extensive qualitative research on PCC governance (Biondi Reference Biondi2014; Reference Biondi2016; Dias Reference Dias2008; Feltran Reference Feltran2012; Reference Feltran2018; Godoi Reference Godoi2015; Lessing and Willis Reference Lessing and Willis2019; Malvasi Reference Malvasi2012; Ruotti Reference Ruotti2016). Prior ethnographies highlight the PCC’s predictable rule enforcement, conflict resolution mechanisms, and neighborhood-level governance structures (Helmke and Levitsky Reference Helmke and Levitsky2004).
To triangulate these accounts, I conducted semi-structured interviews with São Paulo police officers and street-level security officials involved in public safety between 2003 and 2010.Footnote 2 Interviewees were selected based on their leadership roles in CONSEGs (González and Mayka Reference González and Mayka2023), a key state-community policing forum.Footnote 3 Interviews explored shifts in crime patterns, police tactics, and perceptions of the PCC’s role in local security and economic order. Interview scripts were approved by Fundação Getulio Vargas’ Ethics Committee (CEPH/FGV; Report No. P.353.2023), in November 2023.
RESULTS
Main Results: Formal Jobs and Businesses
The main results presented in this article refer to the impacts of PCC presence in a given AP on two outcomes of interest: the number of formal jobs and the number of formal businesses. The estimates shown in Figures 4 and 5 suggest a strong, steady impact of the PCC on employment and a large increase in entrepreneurship and investment. The results are almost entirely driven by an increase in commerce, with smaller effects on services, and no impact on industry—the three categories available for analysis in the data. This suggests the formalization of previously informal activities or increased entrepreneurial investment in low-productivity, street commerce businesses, as expected by baseline social conditions and urban patterns (Table 1).
Firm Openings Subsequent to PCC Entry
Note: This figure presents the event-study specifications described in the model. The results were obtained by the author using Callaway and Sant’Anna (Reference Callaway and Sant’Anna2021) with data from RAIS/the Ministry of Labor. The units of analysis are highlighted in Figure 3. The model includes a control for subprefecture which accounts for location-specific public policies. The estimator does not provide coefficients for controls. The event study displays the evolution of outcomes over time.

Figure 5. Long description
The graph plots A T T on the vertical Y-axis, ranging from negative 0.4 to 0.4, against Periods to Treatment on the horizontal X-axis, ranging from negative 10 to 5. A dashed horizontal line marks the zero point on the Y-axis.
* Pre-treatment phase (blue): Ten data points represented by grey circles with vertical blue bars indicating confidence intervals. From period negative 10 to negative 1, the values fluctuate between negative 0.2 and 0.1, generally remaining close to the zero baseline.
* Post-treatment phase (red): Six data points represented by grey diamonds with vertical red bars. Starting at period 0, there is a clear upward trend. The A T T value begins just above 0 at period 0 and increases linearly to approximately 0.3 by period 5. The confidence intervals (red bars) also shift upward, with the lower bounds moving above the zero line after period 1.
A legend at the bottom identifies blue as Pre-treatment and red as Post-treatment.
Descriptive Statistics

Table 1. Long description
The table contains seven columns: Variable, Obs. (Observations), Mean, Std. dev. (Standard Deviation), Control mean, Min, and Max. There are four rows of data:
* Number of jobs per A P: 2,060 observations, mean 5,723.80, standard deviation 8,118.17, control mean 6,039.18, minimum 34, maximum 61,224.
* Number of businesses per A P: 2,060 observations, mean 414.45, standard deviation 418.95, control mean 441.91, minimum 8, maximum 2,726.
* Log number of jobs per A P: 2,060 observations, mean 7.95, standard deviation 1.23, control mean 7.77, minimum 3.56, maximum 11.02.
* Log number of businesses per A P: 2,060 observations, mean 5.59, standard deviation 0.97, control mean 5.48, minimum 2.20, maximum 7.91.
Note: Own elaboration with data from GeoSampa (2016).
The estimates shown in Tables 2 and 3 suggest that the PCC presence is associated with 15.5% more formal jobs on average, with the number of businesses increasing by about 23.7% on average. This implies that the PCC presence has caused an annual increase of 0.19 standard deviations in the number of businesses and 0.16 standard deviations in the number of formal jobs. Numerically, this amounts, on average, to 1,568 [CI: 858, 2998] new formal jobs and 67 [CI: 28, 101] new businesses per AP, all else being equal, between 2000 and 2012. Furthermore, the pre-trends are not statistically significant in Table 3, suggesting that there were no statistically significant differences between treatment and control groups in the periods leading up to PCC entry.
Simple DiD Estimate

Table 2. Long description
The table consists of six columns: Outcome, Simple A T T, Std. err., z, P > z, and 95% conf. interval.
* Row 1 (Log number of jobs): Simple A T T is 0.237; Std. err. is 0.067; z is 3.53; P > z is 0.000; 95% conf. interval is 0.105 – 0.369.
* Row 2 (Log number of businesses): Simple A T T is 0.155; Std. err. is 0.044; z is 3.47; P > z is 0.001; 95% conf. interval is 0.067 – 0.242.
The data indicates a positive treatment effect for both variables, with the log number of jobs showing a higher coefficient than the log number of businesses.
Note: This table presents the simple coefficients obtained from estimating specifications described in model. The results were obtained by the author using Callaway and Sant’Anna (Reference Callaway and Sant’Anna2021) with data from RAIS/Ministry of Labor. The units of analysis are highlighted in purple in Figure 3. The model includes controls for local subprefecture, which account for location-specific public policies. The estimator does not provide coefficients for controls.
drDiD Estimate

Table 3. Long description
A table with six columns: Outcome, Post-average, Std. err., z, P > z, and Pre-trend std. error.
* Row 1: Outcome is Log number of jobs. Post-average is 0.2637. Std. err. is 0.0714. z is 3.69. P > z is 0.000. Pre-trend std. error is 0.0089 to 0.0496.
* Row 2: Outcome is Log number of businesses. Post-average is 0.1755. Std. err. is 0.0481. z is 3.65. P > z is 0.000. Pre-trend std. error is minus 0.0231 to 0.0241.
Note: This table presents the simple coefficients obtained from estimating specifications described in the model. The results were obtained by the author using Callaway and Sant’Anna (Reference Callaway and Sant’Anna2021) with data from RAIS/Ministry of Labor. The units of analysis are highlighted in purple in Figure 3. The model includes controls for local subprefecture, which account for location-specific public policies. The estimator does not provide coefficients for controls. Post-average refers to the average effect after implementation, whereas pre-trends are the average of the pre-treatment periods shown in the event studies.
The estimates suggest that PCC’s hegemonic criminal governance had a significant impact on local economic conditions. This is demonstrated by the ability of criminal governance and its effects on criminals’ behavior to generate positive externalities in its area of operation, extending not only to favelas (as I demonstrate in the next section) but also to formal outcomes, measured through formal jobs and businesses. I test the parallel trends assumption using both the drDiD pre-trends command and the event-study function from Callaway and Sant’Anna (Reference Callaway and Sant’Anna2021). Table 3 reports the results for the pre-event trend, which are not statistically significant, suggesting that the groups’ outcomes were not different before the treatment. An estimate of the drDiD model, including never-treated units, is available in the Supplementary Material, and is equivalent to the estimates that include only not-yet-treated units, although parallel trends are violated when estimating the number of jobs.
Results from Nighttime Luminosity (DMSP)
To strengthen the test of the hypothesis, I have conducted exercises with nighttime luminosity measured by the US NOAA. I use the nighttime luminosity index constructed using satellite imagery as a proxy for levels of income that vary despite changes in levels of formality. These types of data have been used as a proxy for income and development in both rural and urban settings (Zhao et al. Reference Zhao, Zhou, Li, Cao, He, Yu and Li2019). I downloaded cloud-free DMSP-OLS raster data from the NOAA official website. For each favela in the sample, I extracted the mean value for the DMSP-OLS. I created a panel between the years 2000 and 2013 and modified the original variables by calculating a standardized value for each favela-year, aiming to leverage within-favela variation in the index. Since São Paulo is a very developed city, when measured using the nighttime luminosity index, many favelas were at or near the maximum value of the indicator (63). Therefore, I constructed a within-favela normalized indicator:

where Standardized
$ {\mathrm{DMSP}}_{\mathrm{it}} $
 is an index variable measuring the level of economic development in a
$ {\mathrm{favela}}_{\mathrm{i}} $
 at
$ {\mathrm{year}}_{\mathrm{t}} $
 . The indicator is benchmarked against the minimum and maximum values observed for each favela, such that when the indicator takes a value of 0, it represents the minimum value for that indicator in that favela, and when it takes a value of 1, it represents the maximum value for that indicator in that favela. In that sense, I use this indicator to assess the variation of the index within a given favela.
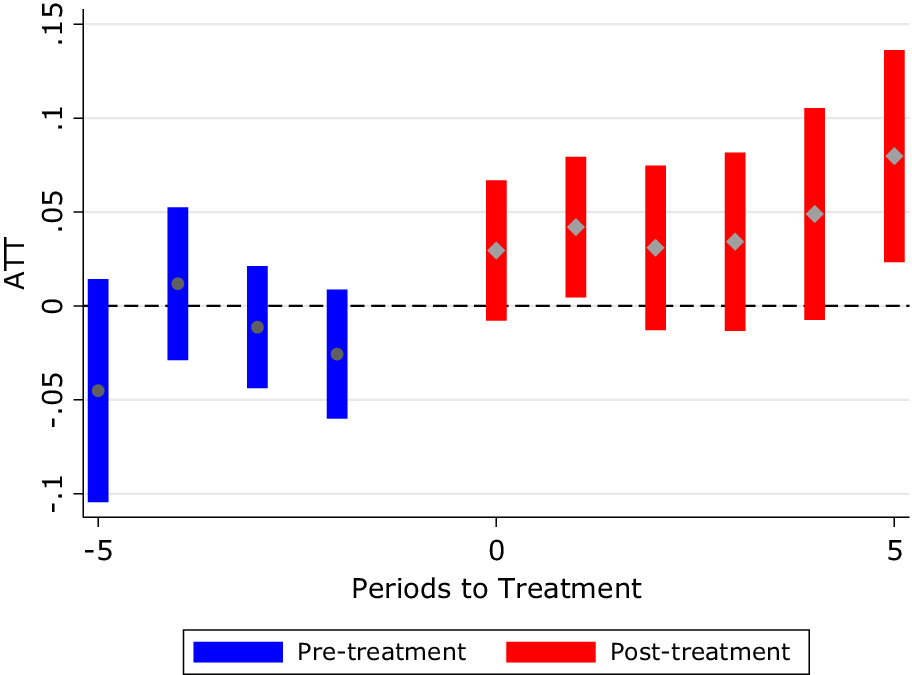
In Figure 6, I present the result of Equation 1 as an event-study graph, using the standardized DMSP as the outcome variable. To conduct this estimate, I once again apply the drDiD estimator (Callaway and Sant’Anna Reference Callaway and Sant’Anna2021), leveraging the staggered PCC expansion. In this case, unlike the previous section, I use 823 favelas as the units of analysis and not the APs (census groupings), which allows for a more granular identification. According to the results observed in Figure 6, there are no differential trends leading up to the treatment, which allows us to consider that PCC entry has led to an increase in the DMSP index, which I use as a proxy for the informal economy.
Nighttime Luminosity Subsequent to PCC Entry
Note: This figure presents the event-study specifications described in Model 1. The results were obtained by the author using Callaway and Sant’Anna (Reference Callaway and Sant’Anna2021) with data from DMSP/NOAA. The units of analysis are favelas and are shown in Supplementary Figure A1. The model includes a control for the specific location of each favela. The estimator does not provide coefficients for controls. The event study displays the evolution of outcomes over time.

Figure 6. Long description
The vertical Y-axis is labeled A T T and ranges from negative 0.1 to 0.15. The horizontal X-axis is labeled Periods to Treatment and ranges from negative 5 to 5. A dashed horizontal line marks the zero point on the Y-axis.
Data is presented in two distinct groups:
* Pre-treatment: Four blue vertical bars located at periods negative 5, negative 4, negative 3, and negative 2. Each bar contains a grey circular point. The points fluctuate near or below the zero line, showing no clear upward trend.
* Post-treatment: Six red vertical bars located at periods 0, 1, 2, 3, 4, and 5. Each bar contains a grey diamond point. Starting at period 0, the diamond points show a positive trend, moving from approximately 0.03 at period 0 to nearly 0.08 at period 5.
The vertical bars represent confidence intervals, which are generally larger in the post-treatment phase compared to the pre-treatment phase. A legend at the bottom identifies the blue bars as Pre-treatment and the red bars as Post-treatment.
The estimation of the parameter SimpleATT amounts to an overall increase of 4% (standard error: 0.018), or about 10% of a standard deviation of the indicator. These results are robust to OLS models, including fixed-effects and time-trends (see Supplementary Table A6), and are not affected by negative weight issues that are common to two-way fixed effects (TWFE) specifications. The results are also robust to alternative outcome definitions, including log transformations and raw DMSP averages. Meanwhile, the DMSP results are not robust to recent, nonlinear estimators of DiD, namely those proposed by Borusyak, Jaravel, and Spiess (Reference Borusyak, Jaravel and Spiess2024).
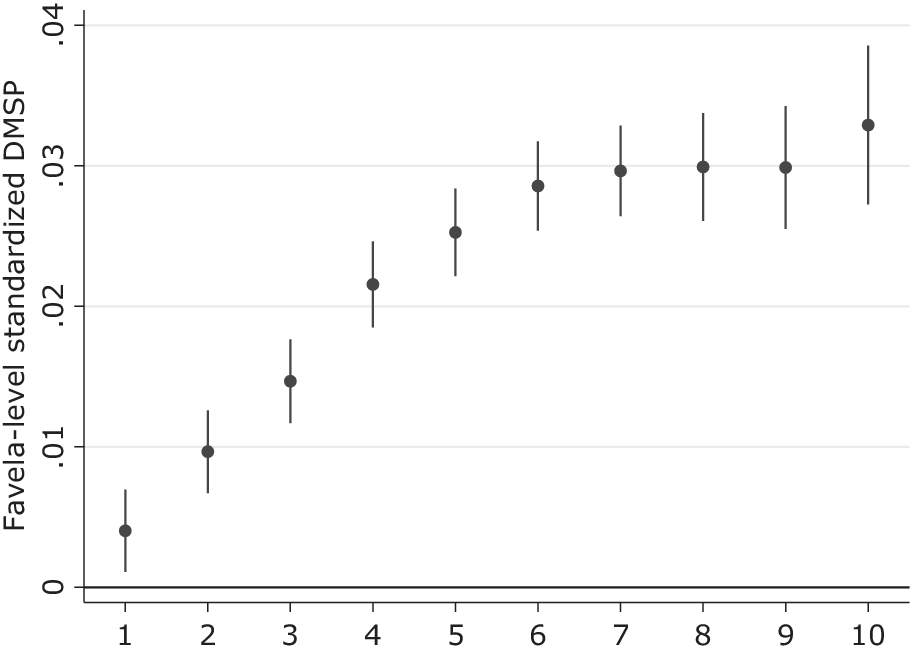
Once again, the results obtained imply that PCC presence is contributing to the informal development of São Paulo’s favelas. The coefficients estimated and presented in Figure 7 corroborate the findings from the previous section, as well as the findings from the causal model reported in Figure 6. They strengthen my hypothesis that criminal governance reshapes local incentives and investment horizons and that, as residents and investors become accustomed to the new hegemonic order, businesses, jobs, and investment are crowded in. In the next section, I analyze whether previous characteristics of the favelas can explain the timing of PCC entry.
Coefficients for Years of PCC Presence Compared to Baseline Levels
Note: This figure presents the estimated coefficients from an OLS two-way fixed-effects regression that includes a dummy for the number of years of PCC presence. It compares within-favela variation in DMSP across the years of PCC presence to their baseline levels. Full regression tables are available in Supplementary Tables A6 and A7.

Figure 7. Long description
The Y-axis is labeled Favela-level standardized D M S P with values ranging from 0 to .04 in increments of .01. The X-axis represents the number of years of P C C presence, labeled from 1 to 10.
Ten data points are plotted as solid circles with vertical error bars representing confidence intervals. The trend shows a logarithmic-style increase that plateaus in later years.
* Year 1: Coefficient is approximately .004.
* Year 2: Coefficient increases to approximately .01.
* Year 3: Coefficient is approximately .015.
* Year 4: Coefficient is approximately .022.
* Year 5: Coefficient is approximately .025.
* Year 6: Coefficient reaches approximately .029.
* Year 7: Coefficient is approximately .03.
* Year 8: Coefficient remains at approximately .03.
* Year 9: Coefficient remains at approximately .03.
* Year 10: Coefficient shows a slight final increase to approximately .033.
The error bars generally widen as the number of years increases, particularly at year 10.
ROBUSTNESS TESTS: TIMING OF PCC ENTRY AND OBSERVABLE CHARACTERISTICS USING BRAZILIAN CENSUS DATA
In this section, I explore Brazilian census data to understand whether PCC timing of entry is correlated with pre-existing characteristics of the favelas (measured through the 2000 Brazilian census). I also analyze the 2010 census data to map whether the PCC presence has crowded in state services. I estimate a series of OLS regressions where Y is the outcome of interest measured by the Brazilian census in 2000 or 2010.
$ \alpha $
 is the constant term, and the various
$ \beta $
 are the coefficients estimated for each year of PCC entry. The models capture the average difference between favelas that were treated in a given year, compared to the favelas where PCC presence is detected in 2003.
$ \epsilon\;\mathrm{is}\ \mathrm{the} $
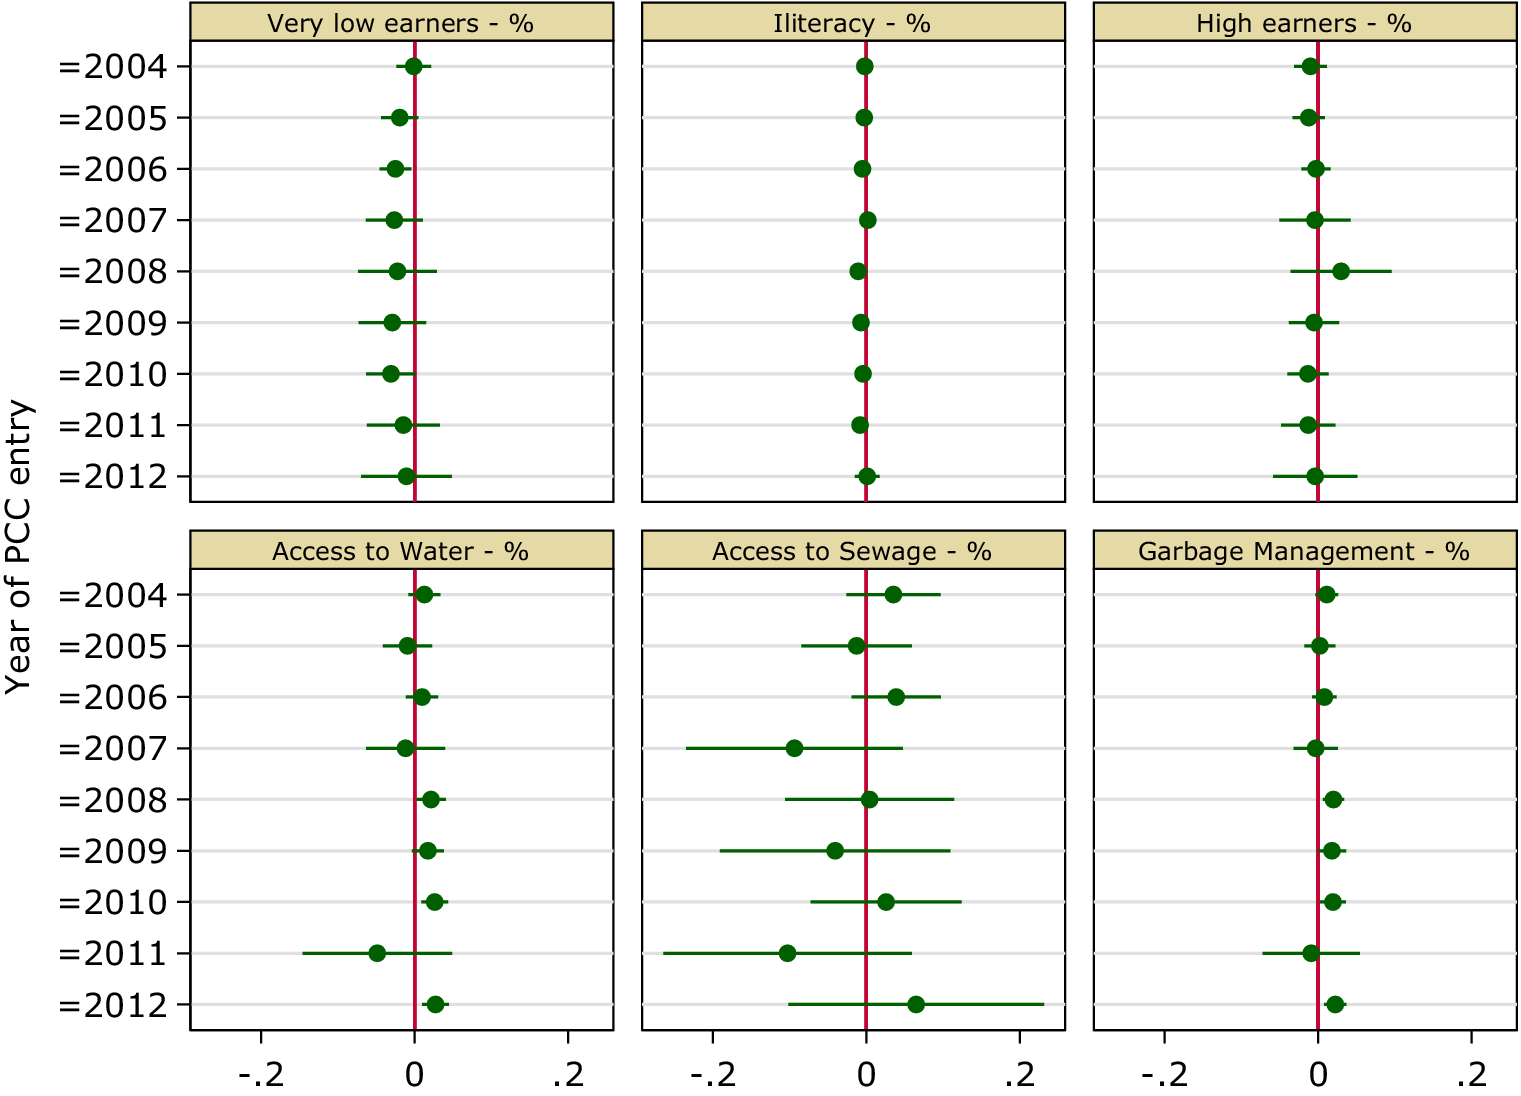
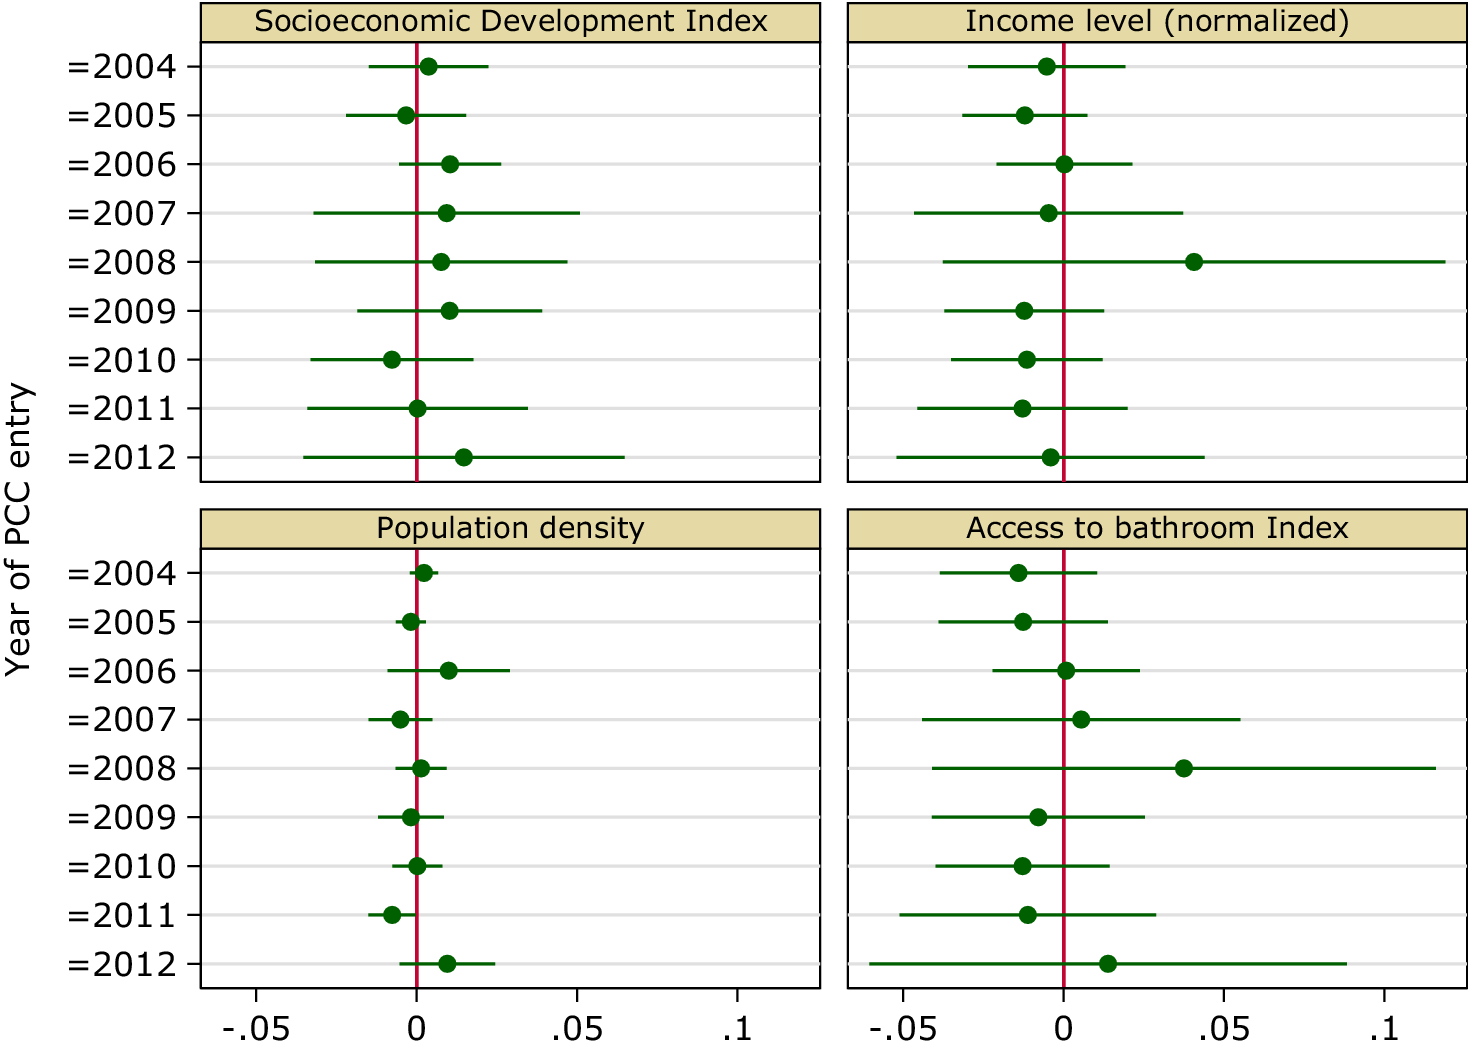
 error term in the equation. The equation and full regression tables are available in the Supplementary Material. As can be seen in Figures 8 and 9, there are no baseline characteristics in the 2000 Census that are systematically correlated with earlier/later PCC entry. This suggests that the PCC did not strategically choose the order of its entry into favelas based on observable characteristics of wealth or labor market conditions. The PCC presence seems to be unrelated to the Social Development variables of interest.
Can PCC Entry Be Explained by Observable Prevailing Infrastructure Conditions?
Note: This figure presents the OLS estimates (Supplementary Tables A3–A5) obtained from models where the year, when PCC is first observed in a favela, is the independent variable and the Census outcome of interest, measured in 2000, is the dependent variable. Baseline category is 2003. Very low earners refer to the percentage of families earning less than one-half of a minimum wage per capita. Illiteracy is measured as the percentage of those aged 10–14 who are illiterate. High earners are families earning more than 10 minimum wages. The author’s analysis is based on data from Disque-Denúncia, IBGE, and DeInfo.

Figure 8. Long description
A multi-panel plot with two rows and three columns. The Y-axis for all panels is Year of P C C entry, ranging from 2004 to 2012. The X-axis for all panels represents coefficient values from negative 0.2 to 0.2, with a vertical red line at zero. Each data point is a green dot with horizontal error bars.
* Top-left panel: Very low earners - percentage. Points are clustered tightly around the zero line with narrow error bars.
* Top-center panel: Illiteracy - percentage. Points are almost perfectly aligned on the zero line with extremely small error bars.
* Top-right panel: High earners - percentage. Points are centered on zero, with a slight rightward outlier in 2008.
* Bottom-left panel: Access to Water - percentage. Most points are slightly to the right of zero, except for 2011 which shows a significant negative estimate with wide error bars.
* Bottom-center panel: Access to Sewage - percentage. This panel shows the highest variance, with points for 2007, 2009, and 2011 falling to the left of zero and 2012 falling to the right. Error bars are significantly wider than in other panels.
* Bottom-right panel: Garbage Management - percentage. Points are clustered very close to the zero line, showing minimal deviation across all years.
Can PCC Entry Be Explained by Observable Prevailing Social Conditions?
Note: This figure presents the OLS estimates (Supplementary Tables A3–A5) obtained from models where the year, when PCC is first observed in a favela, is the independent variable and the Census outcome of interest, measured in 2000, is the dependent variable. Baseline category is 2003. The author’s analysis is based on data from Disque-Denúncia, IBGE, and DeInfo.

Figure 9. Long description
A multi-panel coefficient plot with four panels arranged in a two-by-two grid. The shared Y-axis on the left is labeled Year of P C C entry, listing years from 2004 at the top to 2012 at the bottom. The shared X-axis at the bottom ranges from negative 0.05 to 0.1. Each panel features a vertical red line at zero, with green dots representing point estimates and horizontal green lines representing confidence intervals.
* Top-left panel: Socioeconomic Development Index. Estimates fluctuate closely around the zero line. The 2012 estimate shows a slight positive shift with a wider confidence interval.
* Top-right panel: Income level normalized. Most estimates are slightly negative or near zero, except for 2008, which shows a significant positive spike reaching approximately 0.04 with a very wide confidence interval extending beyond 0.1.
* Bottom-left panel: Population density. Estimates are tightly clustered near the zero line with narrow confidence intervals, showing minimal variation across the years.
* Bottom-right panel: Access to bathroom Index. Similar to the income panel, most estimates are near zero, but 2008 shows a distinct positive outlier at approximately 0.04 with a wide confidence interval extending to the right edge of the plot.
CONCLUSION
This article provides causal evidence that hegemonic criminal governance can generate positive economic externalities in contexts where the state fails to deliver order and security. Focusing on São Paulo’s favelas and peripheries, I show that the territorial expansion of the PCC—an organization that institutionalized rules, violence control, and dispute resolution—produced economically and statistically significant increases in formal employment and firm creation. These effects are concentrated in the commerce sector, suggesting that reductions in violence and increased predictability lowered barriers to entrepreneurial investment and the formalization of previously informal activities.
These findings contribute to a growing political economy literature on the governance functions of non-state actors (Acemoglu, De Feo, and De Luca Reference Acemoglu, De Feo and De Luca2020; Gambetta Reference Gambetta1993; Lessing Reference Lessing2021; Skarbek Reference Skarbek2024). While prior studies have documented the negative developmental effects of fragmented or extortion-based criminal rule (Brown et al. Reference Brown, Montero, Schmidt-Padilla and Sviatschi2025; Melnikov, Schmidt-Padilla, and Sviatschi Reference Melnikov, Schmidt-Padilla and Sviatschi2022), this article shows that when criminal governance is hegemonic, institutionalized, and non-extractive, it can reshape local economic conditions in positive ways.
Methodologically, this article advances the empirical study of criminal governance by applying state-of-the-art staggered DiD estimators (Callaway and Sant’Anna Reference Callaway and Sant’Anna2021) to new geocoded data on criminal presence and economic outcomes. By doing so, it mitigates key identification concerns that have limited previous research in this area.
Theoretically, the São Paulo case highlights an important mechanism linking governance and development in weak-state contexts: when criminal organizations impose internal rules that limit violence, reduce uncertainty, and regulate market interactions, they can produce state-like positive externalities that foster economic growth. However, this should not be read as an endorsement of criminal governance. The conditions under which such positive effects emerge are rare, fragile, and context-dependent—often requiring a level of organizational capacity and restraint seldom observed among non-state violent actors.
My findings also carry important policy implications. While the results highlight the capacity of non-state actors to deliver governance-like benefits in contexts of state absence, they underscore the fundamental need for the state to reclaim its monopoly on legitimate violence and service provision. The positive economic externalities observed under PCC governance emerged in a unique context of organizational hegemony and rule-based enforcement, conditions that are unlikely to generalize across other criminal governance settings. Policymakers should therefore avoid interpreting these results as a justification for tolerating criminal control, but rather as evidence of the developmental costs of state neglect and the urgent need for investments in state capacity, violence reduction, and formal institutional governance in marginalized urban areas.
Future research should investigate whether similar patterns emerge in other contexts where criminal organizations have achieved territorial hegemony and institutionalized governance practices. By identifying the conditions under which non-state order can generate developmental benefits, this article contributes to broader debates about state capacity, institutional substitutes, and economic development in violence-affected regions.
SUPPLEMENTARY MATERIAL
To view supplementary material for this article, please visit http://doi.org/10.1017/S0003055425101354.
DATA AVAILABILITY STATEMENT
Research documentation and data that support the findings of this study are openly available at the American Political Science Review Dataverse: https://doi.org/10.7910/DVN/KN4UCV.
ACKNOWLEDGEMENTS
I thank Ciro Biderman, George Avelino, Juliana Camargo, Jessie Trudeau, Gabriel Feltran, Joana Monteiro, Isabella Montini, Callan Hummel, Guillermo Toral, Lucas Gelape, Frederico Ramos, Daniel Waldvogel, Tomás Wissenbach, Claudia Cerqueira, Alexandre Calil, André Oliveira, and many others from FGV-EAESP’s Economics and Politics of the Public Sector (PESP) research program. I also thank the editor and two anonymous reviewers who have immensely contributed to improve my work. All remaining errors are my own.
FUNDING STATEMENT
This research was partially funded by the TA Scholarship provided by FGV-EAESP during my PhD.
CONFLICT OF INTEREST
The author declares no ethical issues or conflicts of interest in this research.
ETHICAL STANDARDS
The author declares that the human subjects research in this article was reviewed and approved by the IRB at Fundação Getulio Vargas and that the certificate numbers are provided in the text. The author affirms that this article adheres to the principles concerning research with human participants laid out in APSA’s Principles and Guidance on Human Subject Research (2020).







Comments
No Comments have been published for this article.