Introduction
Unipolar depressive disorders are a significant problem in the United States and throughout the world despite advances in psychiatric and psychological treatments (Chisholm et al. Reference Chisholm, Sanderson, Ayuso-Mateos and Saxena2004). According to the National Comorbidity Survey Replication, major depression will affect nearly 1 in 7 adults over the lifespan and 1 in 14 in any particular year (Kessler et al. Reference Kessler, Berglund, Demler, Jin, Koretz, Merikangas, Rush, Walters and Wang2003). Given the high prevalence and high economic and health costs of depressive disorders, it is vital to gain a deeper understanding of their underlying causes and the related policy implications.
Typically the risk for, and morbidity of, depression is viewed through the lens of individual-level factors, such as genetic predisposition, sex, age, and SES. Recently, community and neighborhood factors have gained attention because of increasing recognition that physical and social neighborhood characteristics may affect mental health generally and depression specifically (Mair et al. Reference Mair, Roux and Galea2008, Reference Mair, Diez Roux, Shen, Shea, Seeman, Echeverria and O'Meara2009; Richardson et al. Reference Richardson, Westley, Gariépy, Austin and Nandi2015). Relations between individual-level and neighborhood-level factors can be depicted in a multi-level model that postulates effects of social and physical neighborhood environments on depression directly, through behavioral mediators and stress (Robert, Reference Robert1999), and through more complex processes such as gene×environment interactions (G × E) (Ware et al. Reference Ware, Smith, Mukherjee, Lee, Kardia and Diez-Roux2015). Despite the availability of a model emphasizing the importance of neighborhood context, depression is regarded as a clinical problem in most existing research and health policy literature, which typically focuses on individual-level solutions such as therapy and medication. If neighborhood effects are empirically important, then changing neighborhood social and economic contexts may be effective and complementary avenues for combating depression along with traditional efforts through individual-based treatment.
Many cross-sectional studies have found that living in socially deprived neighborhoods is associated with higher rates of depression and worse mental health in general for children and teenagers (Attar et al. Reference Attar, Guerra and Tolan1994; Aneshensel & Sucoff, Reference Aneshensel and Sucoff1996; Chase-Lansdale & Gordon, Reference Chase-Lansdale and Gordon1996; Xue et al. Reference Xue, Leventhal, Brooks-Gunn and Earls2005; Edwards & Bromfield, Reference Edwards and Bromfield2009), adults across broad ages (Yen & Kaplan, Reference Yen and Kaplan1999; Ross, Reference Ross2000; Silver et al. Reference Silver, Mulvey and Swanson2002; Wainwright & Surtees, Reference Wainwright and Surtees2004; Henderson et al. Reference Henderson, Roux, Jacobs, Kiefe, West and Williams2005; Skapinakis et al. Reference Skapinakis, Lewis, Araya, Jones and Williams2005; Weich et al. Reference Weich, Twigg, Lewis and Jones2005; Matheson et al. Reference Matheson, Moineddin, Dunn, Creatore, Gozdyra and Glazier2006; Galea et al. Reference Galea, Ahern, Nandi, Tracy, Beard and Vlahov2007; Beard et al. Reference Beard, Cerdá, Blaney, Ahern, Vlahov and Galea2009; Wight et al. Reference Wight, Ko and Aneshensel2011), and among the elderly (Ostir et al. Reference Ostir, Eschbach, Markides and Goodwin2003; Kubzansky et al. Reference Kubzansky, Subramanian, Kawachi, Fay, Soobader and Berkman2005; Murata et al. Reference Murata, Kondo, Hirai, Ichida and Ojima2008; Everson-Rose et al. Reference Everson-Rose, Skarupski, Barnes, Beck, Evans and Mendes de Leon2011). It is less clear whether there are sex differences in the relationship between neighborhood characteristics and mental health (Yen & Kaplan, Reference Yen and Kaplan1999; Ostir et al. Reference Ostir, Eschbach, Markides and Goodwin2003; Henderson et al. Reference Henderson, Roux, Jacobs, Kiefe, West and Williams2005; Matheson et al. Reference Matheson, Moineddin, Dunn, Creatore, Gozdyra and Glazier2006). Individual-level SES may moderate the relationship between neighborhood characteristics and mental health, though not all studies have found this (Henderson et al. Reference Henderson, Roux, Jacobs, Kiefe, West and Williams2005; Aneshensel et al. Reference Aneshensel, Wight, Miller-Martinez, Botticello, Karlamangla and Seeman2007). In the first of two major reviews on neighborhood effects, both social processes (e.g. social interactions, violence) and structural features (e.g. SES, race, built environment) showed associations with depression outcomes but the social process findings were more consistent (Mair et al. Reference Mair, Roux and Galea2008). In the second, which focused on longitudinal studies, the results were less consistent in showing the relevant associations, especially in studies with longer follow-up periods (Richardson et al. Reference Richardson, Westley, Gariépy, Austin and Nandi2015).
A major problem with the existing literature, and one possible reason for the contradictory studies, is structural confounding. Structural confounding is a lack of consideration of unobserved factors that simultaneously affect neighborhood selection and subsequent effects on health outcomes. These unobserved factors – which may include not only typical ‘control’ variables such as age, race, and SES but also subtler influences such as shared genetics and common developmental environment – are a challenge for the causal interpretation of any observed relationship. Our own research suggests that there are non-random familial factors (i.e. shared genetics and common developmental environment) that contribute to neighborhood selection and that the relative contributions of genes and environment to neighborhood selection change as people age (Duncan et al. Reference Duncan, Dansie, Strachan, Munsell, Huang, Vernez Moudon, Goldberg and Buchwald2012). Individual-level confounds (e.g. age, race, SES) have often been controlled for in relevant studies but the familial factors that are likely to confound the association typically go unrecognized or unmeasured (Duncan et al. Reference Duncan, Mills, Strachan, Hurvitz, Huang, Moudon and Turkheimer2014).
One way to address these confounds is randomization; however, it is neither feasible nor practical to randomize individuals into neighborhoods. The present study addresses structural confounding by using a twin study design to investigate neighborhood-level effects on depression outcomes while controlling for individual-level factors. Twin models can account for differential selection of individuals into neighborhoods based on social and genetic endowments (e.g. shared genetics and developmental environments), which might otherwise confound purported causal relations (Duncan et al. Reference Duncan, Dansie, Strachan, Munsell, Huang, Vernez Moudon, Goldberg and Buchwald2012, Reference Duncan, Mills, Strachan, Hurvitz, Huang, Moudon and Turkheimer2014). Twin studies also can partition variation in outcomes into genetic and environmental components. Theoretical and computational advances now permit investigators to determine whether the proportions of variance attributable to genetic and environmental sources are themselves moderated by environmental variables in the form of G × E interactions.
The purpose of this study was to examine the cross-sectional association between neighborhood-level SES and depressive symptoms and to test whether that association is direct or whether it is confounded by shared genetics or common environments (i.e. familial factors). This is essentially a question of causation. If the association between neighborhood SES and depressive symptoms can be accounted for by familial factors then the effect is not direct or causal. If, however, an effect remains after controlling for familial factors there is evidence for a direct association.
To accomplish our goals, we first established relevant background to inform our primary hypothesis by testing whether the variance in both neighborhood SES and depressive symptoms has genetic and common environmental components (i.e. that genes and common environment contribute to neighborhood selection and depressive symptoms). Next, we sought to establish the main effect of neighborhood-level SES on depressive symptoms when treating the twins as individuals and looking at the results across our entire sample.
We then tested this same association within twin pairs, hypothesizing that the effect of neighborhood SES would remain significant when we controlled for shared genetic and common environmental backgrounds. Finally, we tested for the presence of a G × E effect in this association, hypothesizing that the heritability of depressive symptoms would be modified by levels of neighborhood SES; specifically that the genetic influence on depressive symptoms would be more pronounced in lower SES neighborhoods. Although somewhat speculative, this last hypothesis was based on prior results showing that the genetic influence on sleep duration (a clinically important component of depression) was more pronounced in lower SES neighborhoods (Watson et al. Reference Watson, Horn, Duncan, Buchwald, Vitiello and Turkheimer2016).
Method
Participants
The Washington State Twin Registry (WSTR; formerly the University of Washington Twin Registry) is a community-based sample of adult twins reared together assembled from Washington State Department of Licensing records. Construction of the Registry is described in detail elsewhere (Afari et al. Reference Afari, Noonan, Goldberg, Edwards, Gadepalli, Osterman, Evanoff and Buchwald2006; Strachan et al. Reference Strachan, Hunt, Afari, Duncan, Noonan, Schur, Watson, Goldberg and Buchwald2013). Briefly, twins completed a survey with items on sociodemographics, general physical and mental health, and lifestyle behaviors. Standard questions about childhood similarity that determine zygosity with greater than 90% accuracy when compared with DNA-based methods were used to classify twins as identical (monozygotic; MZ) or fraternal (dizygotic; DZ) (Torgersen, Reference Torgersen1979; Eisen et al. Reference Eisen, Neuman, Goldberg, Rice and True1989; Spitz et al. Reference Spitz, Moutier, Reed, Busnel, Marchaland, Roubertoux and Carlier1996). The final sample included 3155 MZ twin pairs and 1275 DZ twin pairs (65.7% female) who completed surveys between 2006 and 2013. Overall, the sample was young (37.9 ± 17.8 years), well-educated (91% with at least a high-school degree and 31.6% with a Bachelor's degree or higher), middle-class (median household income US$50–60 K), and predominantly white (90.0%). The median household income across Washington State in 2013 was US$57 554; thus, household income of our participants is generalizable to the state level (State of Washington, 2013).
Measures
Singh index
Neighborhood-level SES was measured using a census-based deprivation index that focuses primarily on structural elements of the neighborhood as opposed to social process elements (Singh, Reference Singh2003). The Singh index is a composite measure of SES based on 17 different neighborhood indicators (e.g. educational and occupational composition, income and employment distributions, unemployment rate, quality of housing and crowding; see Singh, Reference Singh2003, and Kind et al. Reference Kind, Jencks, Brock, Yu, Bartels, Ehlenbach, Greenberg and Smith2014 for a detailed explanation for how to calculate the Singh index from U.S. Census data). The index is a normally distributed latent variable derived through factor analysis and is interpreted as an overall index of area deprivation, with higher scores indicating greater deprivation (i.e. lower SES).
Depressive symptoms
Depressive symptoms were measured by using three items from the Patient Health Questionnaire-9 (PHQ-9; Kroenke et al. Reference Kroenke, Spitzer and Williams2001) which asks: ‘In the past 4 weeks, how often have you been bothered by the following problems’: (1) ‘Little interested or pleasure in doing things’; (2) ‘Feeling down, depressed, hopeless’; and (3) ‘Feeling tired or having little energy’. All items were rated on a 4-point Likert scale ranging from 0 = not at all to 3 = nearly every day. The first two items constitute the PHQ-2, a reliable and valid screener for clinical depression (Kroenke et al. Reference Kroenke, Spitzer and Williams2003). The third item was included in the original WSTR survey because of investigator interests in functional impairment in depression and chronic fatigue. It was included here because the three items together demonstrated adequate internal reliability (α = 0.82) and high general factor saturation (ω = 0.89); thus, we created a latent depressive symptoms factor from these items in our primary analyses, with higher scores indicating greater severity of depressive symptomatology.
Statistical analyses
All analyses were conducted by using latent variable path analysis in the Mplus (Muthén & Muthén, Reference Muthén and Muthén1998–2012, Reference Muthén and Muthén2014) environment with maximum likelihood estimation. Analyses controlled for linear effects of individual-level SES factors including age, sex, ethnicity, household income, and educational attainment. We used likelihood ratio tests to compare nested models.
Univariate biometric decomposition
One of the advantages of using twins to estimate the relation between neighborhood-level SES and depressive symptoms is the ability to control for genetic or shared environmental overlap (i.e. family confounds) between the two phenotypes. The first step in the process is to decompose the variance of depressive symptoms and the Singh index into three components: additive genetic variance (A), which represents the additive effect of an individual's genes; shared environmental variance (C), which represents the environment shared between members of a twin pair; and non-shared environmental variance (E), which represents environmental experiences unique to the individual. In the classical twin model, we assume that the A variance components correlate r = 1.0 between MZ twins (who share 100% of their genes) and r = 0.5 between DZ twins (who share on average 50% of their segregating alleles). The C variance components correlate r = 1.0 between twins regardless of their degree of genetic relatedness because it represents environmental experiences that make members of the same family more alike. This C variance assumption is also known as the equal environments assumption (EEA) which is somewhat controversial in the twin studies literature (e.g. Joseph, Reference Joseph2002). However, empirical research has generally found that violations of the EEA do not substantially bias the results obtained from twin studies (Kendler et al. Reference Kendler, Neale, Kessler, Heath and Eaves1994; Mitchell et al. Reference Mitchell, Mazzeo, Bulik, Aggen, Kendler and Neale2007). The E variance components do not correlate between twins because they are by definition not shared between members of a twin pair.
It should be noted that E variance is confounded with measurement error in the absence of a measurement model (Neale & Maes, Reference Neale and Maes2004). In the present analysis, however, we use a measurement model to quantify depressive symptoms, which separates measurement error from non-shared environmental variance. In addition, research suggests that using a measurement model overcomes estimate bias related to skew that may arise from quantifying a phenotype with summed scores (Eaves & Verhulst, Reference Eaves and Verhulst2014; Molenaar and Dolan, Reference Molenaar and Dolan2014; Schwabe & van den Berg, Reference Schwabe and van den Berg2014; Van Hulle & Rathouz, Reference Van Hulle and Rathouz2015).
Causal pathways v. gene–environment correlation
Once it is established that each phenotype contains both family-level (A and/or C) and individual-level (E) variation, the next step in the co-twin control design is to determine the main effects of Singh index on depressive symptoms; that is, estimating the extent to which the Singh index and depressive symptoms are correlated through genetic, shared environmental, and non-shared environmental pathways. The non-shared environmental overlap between these phenotypes is independent of underlying genetic or environmental backgrounds that the Singh index and depressive symptoms may share, and provides the closest approximation of the causal effect of area-level deprivation on depressive symptoms short of random assignment to neighborhoods differing in level of area-level SES, which is not feasible.
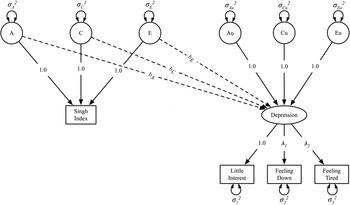
The co-twin control model is a regression model in which our latent depressive symptoms factor is regressed onto the A, C, and E components of Singh index (see Fig. 1). A causal interpretation is supported if the association between the Singh index and depressive symptoms is observed both treating twins as individuals (i.e. people who live in more deprived neighborhoods are on average more depressed) and using twin pair characteristics to control for shared genes and environment (i.e. the member of a pair in the more deprived neighborhood is more depressed than his or her co-twin living in a less deprived neighborhood). The within-pair association – the non-shared environmental overlap – is the most valid measure of the causal effect of the Singh index on depressive symptoms, and is represented by the b E path in Fig. 1 (Turkheimer & Harden, Reference Turkheimer, Harden, Reis and Judd2014). On the other hand, non-causal (or selection) processes are supported if Singh index and depressive symptoms are related between twin pairs but not within twin pairs. These processes may be the result of a shared genetic background (known as gene–environment correlation, or r GE, represented by the b A path in Fig. 1) or a common underlying developmental environment (represented by the b C path in Fig. 1). Although the co-twin control design cannot control for all possible confounds in the relation between Singh index and depressive symptoms, it does control for those measured or unmeasured factors that are shared by pairs of MZ twins who were raised together, yielding a quasi-causal effect of area-level SES on depressive symptoms (Turkheimer & Harden, Reference Turkheimer, Harden, Reis and Judd2014). Note, however, that these twin models have the same limitations as other cross-sectional study designs in terms of being unable to firmly establish direction of causation.
Path diagram of a bivariate twin model (only one twin shown for clarity). The A, C, and E latent variables (represented with circles) are the additive genetic, shared environmental and non-shared environmental variance components of the Singh index. The Au and Eu latent variables represent residual additive genetic and non-shared environmental variance in depression. The main effect of the Singh index on depression is divided into a genetic regression (b A, a shared environmental regression (b C), and a non-shared environmental regression (b E), The regression of depression on the A and C components of the Singh index represents the between-twin pair or population-level effect; the non-shared environmental regression represents the within-twin pair or causal effect of Singh index on depression. The residual variances for the three depression items were permitted to correlate across twins, and were estimated freely according to zygosity.

Gene-by-environment interaction
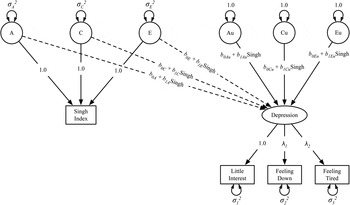
After accounting for the main effects of Singh index on depressive symptoms, the latent depressive symptoms factor has residual variation that may also be partitioned into A, C, and E components. Allowing these variances to vary as a function of the Singh index is a form of G × E interaction, and is easily tested by extending the model described above (see Fig. 2; Purcell, Reference Purcell2002). For moderating variables such as the Singh index that can differ between twins from the same family, r GE that is non-static with respect to the moderator must be accounted for when testing for G × E effects to reduce the inflated false positive rate that results from failure to do so (van der Sluis et al. Reference van der Sluis, Posthuma and Dolan2012). To account for r GE that depends on the level of the moderator, the regression of depressive symptoms on the ACE components of the Singh index are also allowed to vary as a function of the Singh index (i.e. the effect that the Singh index has on depressive symptoms can depend on level of the Singh index) (Johnson, Reference Johnson2007; van der Sluis et al. Reference van der Sluis, Posthuma and Dolan2012). We present a path diagram of the fully saturated model fit to the data in Fig. 2. For each of the moderated paths, the Singh index is the moderating variable; the b 0 terms are the values of the ACE variances (or main effects of the Singh index) where the Singh index = 0; and the b 1 terms represent the rate of increase or decrease in a given variance component (or main effect) as a function of the Singh index.
Path diagram of the fully saturated model fit to the data (model 3; only one twin shown for clarity). Successive models were fit by fixing parameters to zero and conducting likelihood ratio tests whether adding parameters resulted in a significant improvement in model fit. The A, C, and E latent variables (represented with circles) are the additive genetic, shared environmental and non-shared environmental variance components of the Singh index. The Au, Cu and Eu latent variables (also represented with circles) represent residual additive genetic, shared environmental, and non-shared environmental variance in depression. In this model, the main effect of the Singh index on depression (captured in the dotted single-headed paths from the A, C, and E components of the Singh index to depression) is permitted to vary with level of the Singh index. Similarly, the variance in depression that remains after controlling for the main effect of the Singh index (single-headed paths from Au, Cu, and Eu to depression) also varies as a function of Singh index.

Ethical standards
The authors assert that all procedures contributing to this work comply with the ethical standards of the relevant national and institutional committees on human experimentation and with the Helsinki Declaration of 1975, as revised in 2008.
Results
Descriptive statistics and univariate biometric decomposition
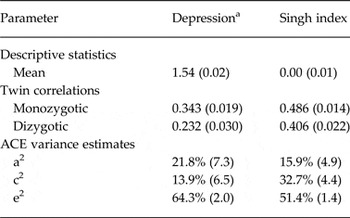
Descriptive statistics, twin correlations, and standardized ACE variances for depressive symptoms and the Singh index are presented in Table 1. Depressive symptoms were moderately heritable (22%) and showed some shared environmental variation (14%) but was heavily influenced by unique environmental factors (64%). The Singh index showed some genetic influence (16%) and substantial shared environmental (33%) and non-shared environmental (51%) influences. The presence of both between- and within-family variability in each trait leaves open the possibility that depressive symptoms and the Singh index may be correlated via genetic or environmental pathways (i.e. may be confounded by non-causal factors).
Descriptive statistics, twin correlations, and standardized variance components for depression and area-level socioeconomic deprivation

Standard errors in parentheses.
ACE estimates: additive genetic (a), variance attributable to the additive effect of individual genes; shared environmental (c), variance attributable to environmental influences shared by twins raised in the same family; and non-shared environmental (e), variance attributable to environmental influences unique to the individual.
a Descriptive statistics for depression here are based on a summed score of the three depression items, but the measurement model used in the biometric decomposition and primary analyses induces a continuous, normal distribution of latent scores on the depression continuum.
Causal pathways v. r GE
The uncontrolled, unstandardized phenotypic regression of depressive symptoms on the Singh index showed a significant positive association. On average, each unit increase in Singh index was associated with a 0.020 increase in depressive symptoms (p = 0.009). As noted above, both depressive symptoms and the Singh index showed genetic and shared environmental variation. To test whether the association between the Singh index and depressive symptoms is potentially causal – that is, whether this association is due to differential exposure to neighborhood socioeconomic factors rather than to a genetically or environmentally induced correlation between the two phenotypes – we fit the bivariate quasi-causal model in Fig. 1, which gives an estimate of the phenotypic effect that is unbiased by between-family confounds.
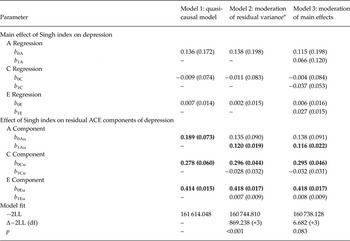
The results are presented in the first column of Table 2, labeled ‘Model 1: quasi-causal’. The quasi-causal pathway was no longer statistically significant after controlling for the genetic and environmental influences common to both the Singh index and depressive symptoms (b E = 0.007, p = 0.615). The estimate of the genetic background common to the Singh index and depressive symptoms was also non-significant (b A = 0.136, p = 0.427), as was the common shared environmental background (b C= −0.009, p = 0.901). However, when estimating the total between-family effect (achieved by constraining b A and b C to be equal) there was significant positive between-family confounding between the Singh index and depressive symptoms (b A= b C= 0.034, p = 0.047; b E= 0.011, p = 0.411; results from this model not presented in Table 2 as this model was not used in model comparisons). The results of this follow-up analysis further suggest that the relation between Singh index and depressive symptoms is best explained by underlying genetic or shared environmental factors that are common to both phenotypes rather than due to systematic differences in exposure to neighborhood socioeconomic factors.
Parameter estimates and fit indices for Gene × Singh index interaction in depression, University of Washington Twin Registry, 2006–2013

a Denotes best-fitting model.
Statistically significant (p < 0.05) parameter estimates bolded.
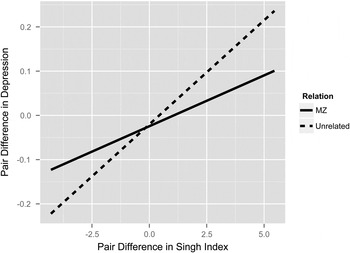
The main effect of Singh index on depressive symptoms is illustrated in Fig. 3, which shows pair differences in depressive symptoms (using a summed score of the three PHQ items) as a function of pair differences in the Singh index within randomly paired (i.e. unrelated) individuals (phenotypic difference; dotted line) and within MZ twin pairs (solid line). If the effect of the Singh index on depressive symptoms was causal, the slopes of these lines would closely approximate one another. Consistent with our findings from the quasi-causal model we fit to the data, this illustrative analysis clearly shows an attenuated effect of the Singh index on depressive symptoms within pairs of identical twins. That is, we observe at least partial mediation of this association by between-family (i.e. A and/or C) confounds.
Pair difference in a summed score of the three depression items as a function of pair differences in the Singh index. The phenotypic effect of the Singh index on depression, equivalent to a population-level regression among unrelated individuals, is represented by the dotted line. The solid line represents the same relation within monozygotic (MZ) twins, and illustrates the non-shared effect of the Singh index on depression. A causal interpretation is supported if the slopes of these lines approximate one another; evident in this plot is that the effect of Singh index on depression in MZ twins is attenuated compared with the effect among unrelated individuals, which suggests that non-causal processes better explain the depression – area-level socioeconomic deprivation association.

G × E interaction
We next fit a model that allowed for the residual ACE components of depressive symptoms to vary as a function neighborhood socioeconomic deprivation (solid paths from the latent variables Au, Cu, and Eu in Fig. 2). This model significantly improved model fit (p < 0.001; model 2 in Table 2), suggesting that residual variance in depressive symptoms depends on level of the Singh index. Allowing the main effects of the Singh index on depressive symptoms to vary by level of the Singh index (dotted paths from the latent variables A, C, and E in Fig. 2), which tests whether the covariance between depressive symptoms and the Singh index as a function of level of Singh index explains any of the moderation in residual ACE components of depressive symptoms (and yields unbiased estimates of the G × E process), did not improve model fit (p = 0.083; model 3 in Table 2).
The best-fitting models (model 2, denoted by superscript a in Table 2) suggest that genetic variance in depressive symptoms increases with increasing neighborhood socioeconomic deprivation. Residual genetic variance increased by 0.120 standard deviation units per unit increase in the Singh index (p < 0.001); changes in shared environmental variance (b 1Cu= 0.028, p = 0.379) and non-shared environmental variance (b 1Eu= −0.007, p = 0.393) as a function of the Singh index were non-significant.
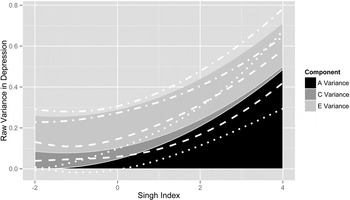
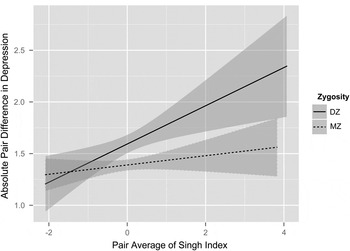
The results from model 2 are illustrated in the stacked variance plots in Fig. 4. The black region represents residual additive genetic variance in depressive symptoms as a function of the Singh index, the dark gray region represent the same relation for shared environmental variance, and light gray the non-shared environmental variance. Only the change in additive genetic variance reached statistical significance. We also plotted absolute pair differences in depressive symptoms (using a summed score of the three PHQ items) against pair average Singh index within MZ twin pairs (dotted line) and DZ twin pairs (solid line; see Fig. 5). The gap between the MZ and DZ lines (i.e. the tendency for MZ pairs to be more similar than DZ pairs) represents the additive genetic variance in depressive symptoms. If the Singh index had no impact on genetic variance in depressive symptoms, these lines would be parallel. The lines clearly diverge, however, consistent with increasing A variance with increasing Singh index, but also evident is that this increased variance appears to occur because DZ twins become more dissimilar as level of the Singh index increases.
Raw residual variance in depression as a function of the Singh index. The plot illustrates how the A (black region), C (dark gray region), and E (light gray region) residual variances in depression change with level of Singh index. The white dotted lines represent the 95% confidence intervals around the change in variance.

Absolute pair difference in a summed score of the three depression items as a function of pair average Singh index. The shaded regions represent the 95% confidence intervals around the line of best fit. The area between the monozygotic (MZ) (dotted) and dizygotic (DZ) (solid) lines represents the additive genetic variance in depression, which appears to increase with increasing Singh index. This increased heritability appears to be driven by a tendency for DZ twins to become more dissimilar in more stressful environments (i.e. those with higher area-level socioeconomic deprivation).

Discussion
The study partially supported our hypotheses. Using a large community-based twin sample from the United States, we established that both neighborhood SES (as measured by the Singh index) and depressive symptoms (as measured by items from the PHQ-9) have variance attributable to genetic (A) and common environmental (C) components (i.e. familial components) in addition to the unique experiences (E) that shape each individual. We also found that neighborhood SES predicts depressive symptoms in the expected direction. That is, we replicated results in the general population such that greater social deprivation was associated with higher levels of depressive symptoms across all twins in our sample. These results are consistent with prior research (Mair et al. Reference Mair, Roux and Galea2008; Richardson et al. Reference Richardson, Westley, Gariépy, Austin and Nandi2015). However, when we controlled the regression for shared genetics and common environment, the direct effect of neighborhood on depressive symptoms was rendered non-significant. Thus, in our study, we could not conclude that neighborhood-level social deprivation causes depressive symptoms. Instead, neighborhood selection and depressive symptoms appeared to be influenced by genetic and common environmental factors. These are the first such results from a genetically informative US sample with depressive symptoms as the primary outcome but they are consistent with a Swedish family-based study of neighborhood effects on schizophrenia and depressive symptoms (Sariaslan et al. Reference Sariaslan, Larsson, D'Onofrio, Langstrom, Fazel and Lichtenstein2015). That study also found that excess risk of psychiatric morbidity resulted primarily from unobserved familial selection factors.
We also tested whether the residual variance in depressive symptoms – that is, the variance left over after controlling for the main effects of neighborhood SES – varied as a function of neighborhood SES. These results were significant such that the variance in depressive symptoms attributable to additive genetics increased as a function of increasing social deprivation. Thus, although we did not find evidence for a direct effect of neighborhood SES on depressive symptoms, it appears that the genetic variance related to depressive symptoms is more strongly expressed in more deprived neighborhoods. This significant G × E effect is consistent with a study by Ware and colleaues in which they identified a gene region that interacted with neighborhood-level psychosocial environment to predict depressive symptoms scores (Ware et al. Reference Ware, Smith, Mukherjee, Lee, Kardia and Diez-Roux2015).
Although the subsequent tasks may seem daunting, there are practical implications of the finding that neighborhood SES impacts the heritability of depressive symptoms. A recent ‘realist review’ of longitudinal studies suggested five modifiable pathways that link neighborhood SES with depressive symptoms (Blair et al. Reference Blair, Ross, Gariepy and Schmitz2014). They were: (1) neighborhood-based stressors, (2) protective and supportive social networks, (3) resiliency, (4) esthetics and form of the built environment, and (5) control and agency within the neighborhood. Many of these pathways are already the focus of urban planners and policymakers – separate from their association with depressive symptoms – in the form of improving neighborhood walkability, creating appealing and open spaces, and building affordable housing (Belden Russonello & Stewart LLC, 2011). Such improvements might help address the findings of a study in which people living in deprived neighborhoods had lower odds of receiving new antidepressant treatments even controlling for access to care (Bocquier et al. Reference Bocquier, Cortaredona, Verdoux, Sciortino, Nauleau and Verger2013).
Additional practical solutions to coping with stress (neighborhood and otherwise), building and maintaining supportive social networks, and increasing resiliency at the level of the neighborhood are possible but definitely not trivial. Each of those is a common focus of empirically supported psychotherapies such as cognitive-behavioral therapy but these individual-level solutions may not be sufficient for someone at increased genetic risk for depressive symptoms based on neighborhood deprivation. Solutions to the heightened genetic risk problem would have to range from reductions in everyday stressors such as pollution, crime, and noise to broader societal concerns such as unemployment and racial and socioeconomic discrimination (Blair et al. Reference Blair, Ross, Gariepy and Schmitz2014). Unfortunately, the current unwillingness to address crumbling infrastructure in the United States despite dire economic consequences (e.g. Puentes, Reference Puentes2015) does not augur well for attempts to enrich deprived neighborhoods. However, our results continue to suggest the importance of taking whatever practical steps are available to improve the built environment in the name of individual mental and physical health. The effects of such practical steps should also be amenable to empirical study.
Our study used sophisticated twin models to elucidate the potentially causal and non-causal associations between neighborhood SES and depressive symptoms. A typical caveat to studies such as this would be that any quasi-causal associations are still cross-sectional and therefore are limited in drawing true causal conclusions. However, in our data, the effect of neighborhood SES on depressive symptoms was completely explained by shared familial factors including genes and common environment. Thus, there was no quasi-causal association to caveat. That said, the generalizability of the finding is limited by our somewhat homogenous, primarily white sample, which, while relatively reflective of the demographics of Washington State, may not be reflective of the broader US population. We know from prior research that the Twin Registry sample is less deprived overall than a nationally representative sample and this may also affect generalizability (Watson et al. Reference Watson, Harden, Buchwald, Vitiello, Pack, Strachan and Goldberg2014). However, when breaking the data into quintiles, the twins had a wide range of scores that included households in every quintile including the most deprived (5th) quintile. The twins also had a broader range than the nationally representative sample.
Future research would benefit from a longitudinal design – which would bolster conclusions about causation and direction of causation – and inclusion of families from populations which more closely resemble national averages for ethnic composition and other individual-level SES variables. Results similar to ours can be obtained without twins if a large number of extended family members are available for analysis.
In our study we found that neighborhood-level SES is an important contributor to depressive symptoms via modification of the genetic risk at different levels of neighborhood deprivation. Although not as straightforward a result as finding a direct effect of neighborhood on depressive symptoms, the practical implications are similar because they point to a dire need to intervene with residents living in the most deprived neighborhoods. Modifiable pathways that link neighborhoods to depressive symptoms have been proposed and should serve as targets for intervention and research. Fortunately, the modifiable targets are consistent with ongoing developments in urban planning and empirically supported treatments for depressive symptoms.
Acknowledgements
This work was supported by the National Institutes of Health (D. Buchwald, RC2 HL103416).
Declaration of Interest
None.