I. INTRODUCTION
Metallic alloys with superior mechanical properties at elevated temperatures remain in high demand for many applications. New technologies require metallic materials that can operate at temperatures much higher than current Ni-based superalloys. Although Ni-based superalloys have a unique combination of properties at temperatures up to 1000 °C, their use at higher operating temperatures is limited by their solvus and melting temperatures. Recently, a new strategy of so-called high entropy alloys (HEAs) has been proposed to develop a new generation of high temperature materials.Reference Cantor, Chang, Knight and Vincent1–Reference Miracle and Senkov3 Among currently reported HEAs, two groups can be identified for use at high temperatures: (i) HEAs based on the 3d-transition metals (TM HEAs) Co, Cr, Cu, Fe, Mn, Ni, Ti, and V; and (ii) HEAs based on refractory elements, which are called refractory high entropy alloys (RHEAs).Reference Miracle and Senkov3,Reference Gorsse, Miracle and Senkov4 The first TM HEAs were reported in 2004 in two seminal publications.Reference Cantor, Chang, Knight and Vincent1,Reference Yeh, Chen, Gan, Lin, Chin, Shun, Tsau and Chang2 TM HEAs have FCC, FCC + BCC, and/or BCC crystal structures and often contain intermetallic (IM) phases such as L12, B2, Laves, or sigma. Their densities range from 5.0 to 9.0 g/cm3. Many of these TM HEAs have excellent strain-hardening and/or age-hardening response and can achieve yield strengths greater than 1000 MPa below ∼600 °C. Some FCC-based TM HEAs also have high strength, good ductility, and high toughness at cryogenic temperatures. Unfortunately, none of the reported TM HEAs have elevated temperature properties superior to advanced Ni-based superalloys.Reference Gorsse, Miracle and Senkov4 Similar to Ni-based superalloys, the high temperature strength of TM HEAs quickly degrades above ∼800 °C. Their high temperature use is also limited by melting temperatures that are not significantly different from those of conventional Ni-based superalloys.
Following the founding motivation to explore the vast central regions of complex phase spaceReference Cantor, Chang, Knight and Vincent1,Reference Yeh, Chen, Lin, Gan, Chin, Shun, Tsau and Chang5 and inspired by the desire to develop new high temperature structural alloys, RHEAs were first introduced in 2010Reference Senkov, Wilks, Miracle, Chuang and Liaw6 and immediately attracted attention due to their ability to retain high strength up to 1600 °C.Reference Senkov, Wilks, Scott and Miracle7 The first two RHEAs were based on five refractory elements (Mo, Nb, Ta, V, and W), but subsequent alloys have been drawn from a broader palette of nine elements in Group IV (Ti, Zr, and Hf), Group V (V, Nb, and Ta), and Group VI (Cr, Mo, and W), sometimes with additions of nonrefractory metals such as Al, Si, Co, or Ni. Some of the refractory multicomponent alloys studied contain only four principal components and others have an element with a concentration greater than 35%. These are excluded by rigorous HEA definitions, but they are included in the present paper since they nevertheless satisfy the general intent to explore the central regions of complex phase space. Such alloys, including HEAs, are referred to as refractory complex concentrated alloys (RCCAs) or refractory multiprincipal element alloys.
RCCAs have a BCC crystal structure and may also contain IM phases, mainly B2 and/or Laves. The reported densities of RCCAs are in the range from 5.6 to 13.8 g/cm3. It is well known that considerable softening generally occurs at temperatures above about 0.6 of the absolute melting point of an alloy. Increasing the alloy melting temperature may therefore increase the maximum operating temperature, and the high melting points of refractory metals and alloys thus make them candidates for applications at temperatures significantly beyond Ni-based superalloys. Consistent with this concept, some reported RCCAs have impressive specific strengths at temperatures of 1000–1600 °C. Poor room temperature (RT) ductility, poor oxidation resistance, and high density limit the applications of many conventional refractory alloys, and these motivate RCCA research efforts on oxidation resistance, low density compositions, and on the development of improved RT ductility and processability. Research and development of RHEAs/RCCAs is also concentrated on the topics of deformation and strengthening mechanisms, developing heat treatment and hot-working processes, and developing RCCAs with extreme high temperature capabilities. Superalloys achieve their unique balance of properties through a microstructure consisting of a disordered FCC matrix with atomically coherent, nanometer-sized precipitates with an ordered FCC (L12) crystal structure. By mimicking this microstructure in BCC-based alloys, another research focus seeks to develop “RCCA superalloys” with a disordered BCC matrix and nanometer-sized, coherent, ordered BCC (B2) precipitates. A final research emphasis in RCCAs is developing computational and phenomenological models and experimental tools for the accelerated discovery and development of RCCAs with the required combination of properties.
The field of RHEAs has grown rapidly in the first 8 years. The purpose of the present manuscript is to review this rapidly growing field of RHEAs. The taxonomy of RCCAs will be presented in Sec. II, including the elements used and the common element groupings. The processing and microstructures produced will be described in Sec. III and mechanical properties are given in Sec. IV. Environmental and wear behaviors are covered in Sec. V and VI, respectively. Section VII discusses the techniques to accelerate exploration and development of RCCAs, followed by in Sec. VIII potential applications and a discussion of expected technical barriers that need to be addressed. This review concludes with a brief summary.
II. TAXONOMY AND STATISTICAL ANALYSIS
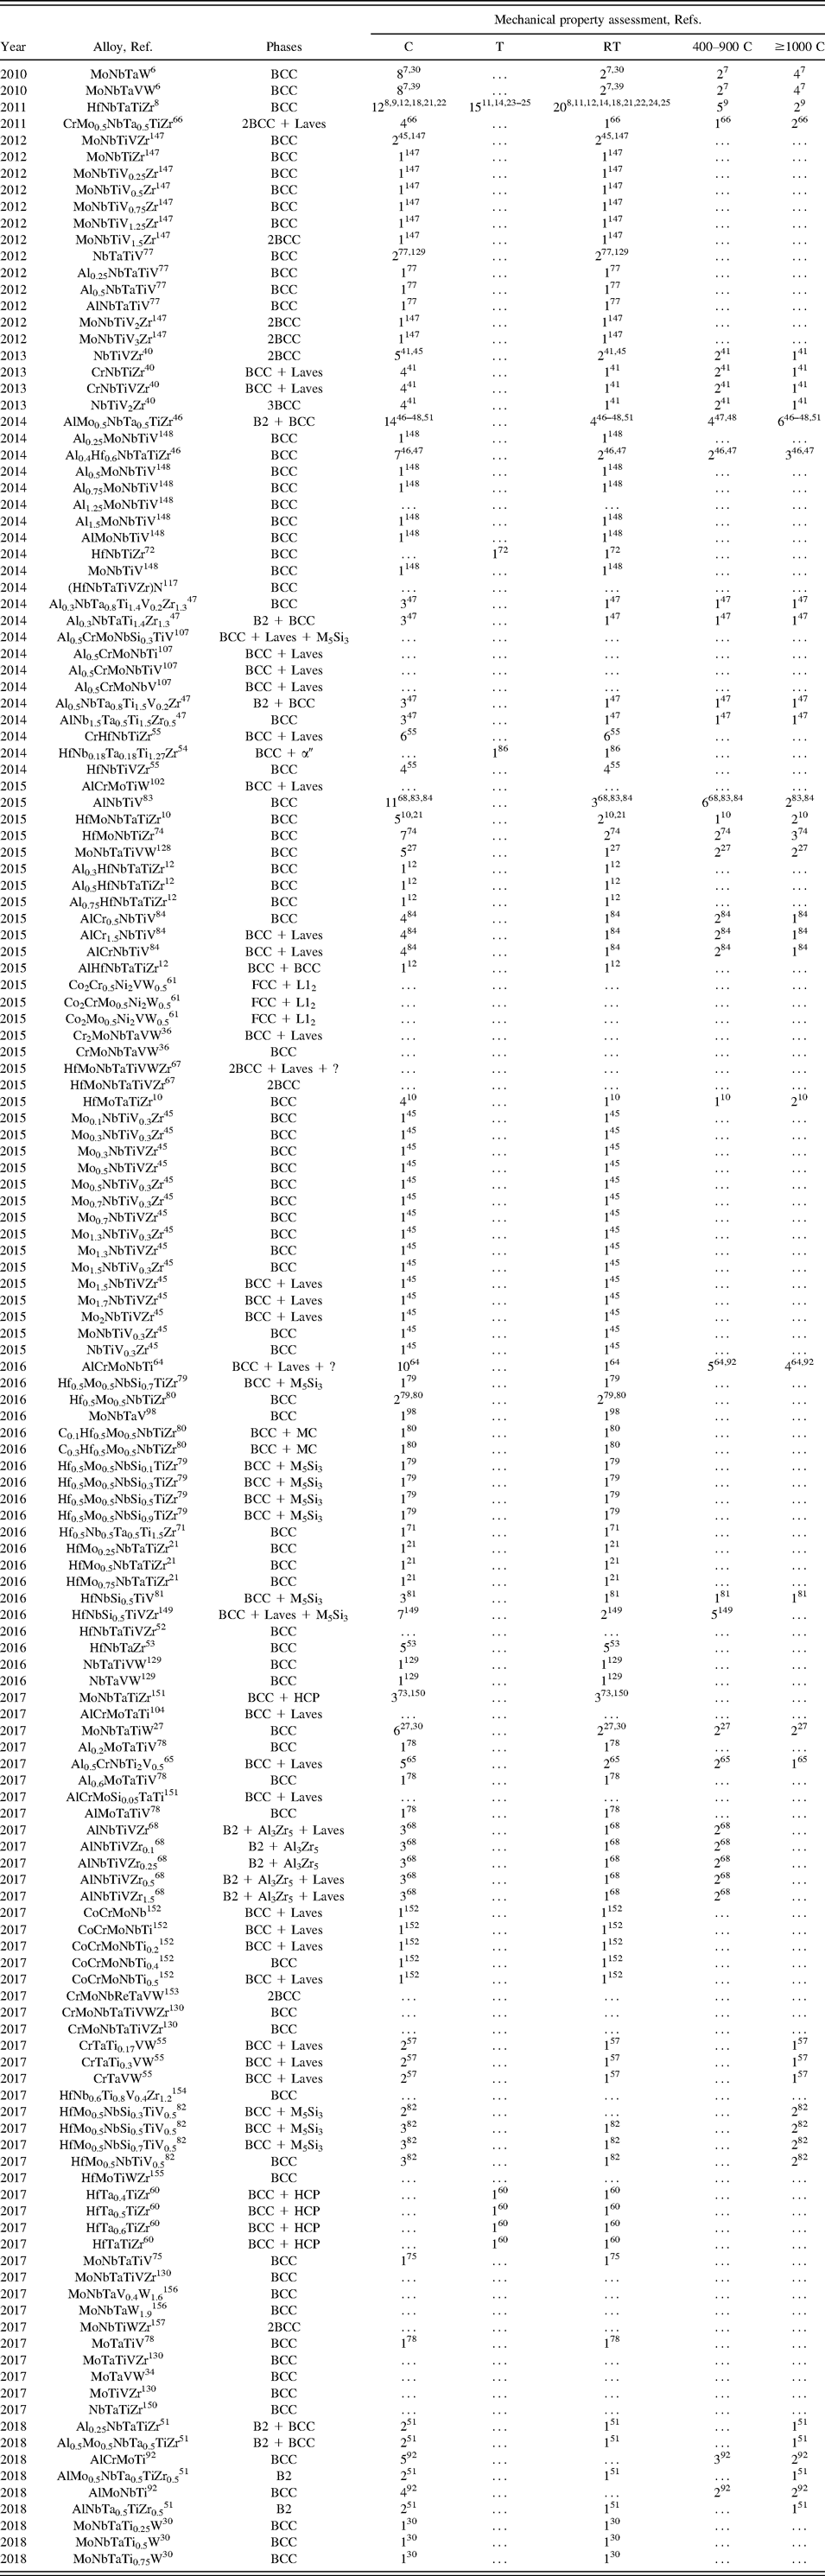
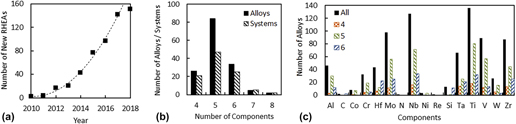
The first two RCCAs, MoNbTaW and MoNbTaVW, were reported in 2010 by Senkov et al.Reference Senkov, Wilks, Miracle, Chuang and Liaw6 and in the following years, the number of newly reported RCCAs has increased steadily [Fig. 1(a)]. By the end of January 2018, 151 new compositions were described in the open literature, among which 25 are 4-component, 85 are 5-component, 34 are 6-component, 5 are 7-component, and 2 are 8-component alloys (Table I). Some of these alloys have the same principal elements and differ only by the concentrations of the elements. Therefore, the total number of the reported alloy systems is 100. The distributions of the reported RCCAs and RCCA systems by the number of components are given in Fig. 1(b). These alloys use 9 refractory metals (Cr, Hf, Mo, Nb, Re, Ta, V, W, and Zr) and can also contain other elements, such as Al, Ti, Si, Co, Ni, C, and N. These additional elements can decrease alloy density (RCCA densities range from 13.8 to 5.6 g/cm3), may form compounds that may strengthen the alloy, and may influence other properties such as hardness and environmental resistance. The most common elements in RCCAs are Ti (present in 137 alloys), Nb (127), Mo (98), Zr (88), V (88), Ta (66), Hf (44), Al (46), and Cr (32) [Fig. 1(c)]. For example, Ti is present in 81 of 85 5-component RHEAs and 32 of 34 6-component RHEAs, while Nb is present in 72 5-component and 33 6-component RHEAs [Fig. 1(c)].
(a) Cumulative number of new RHEAs reported in the open literature as a function of the publication year, up to the end of January 2018. (b) Distribution of RHEAs and the alloy systems by the number of alloying elements. (c) Distribution of alloying elements in all reported RHEAs, as well as in 4-, 5-, and 6-component RHEAs.

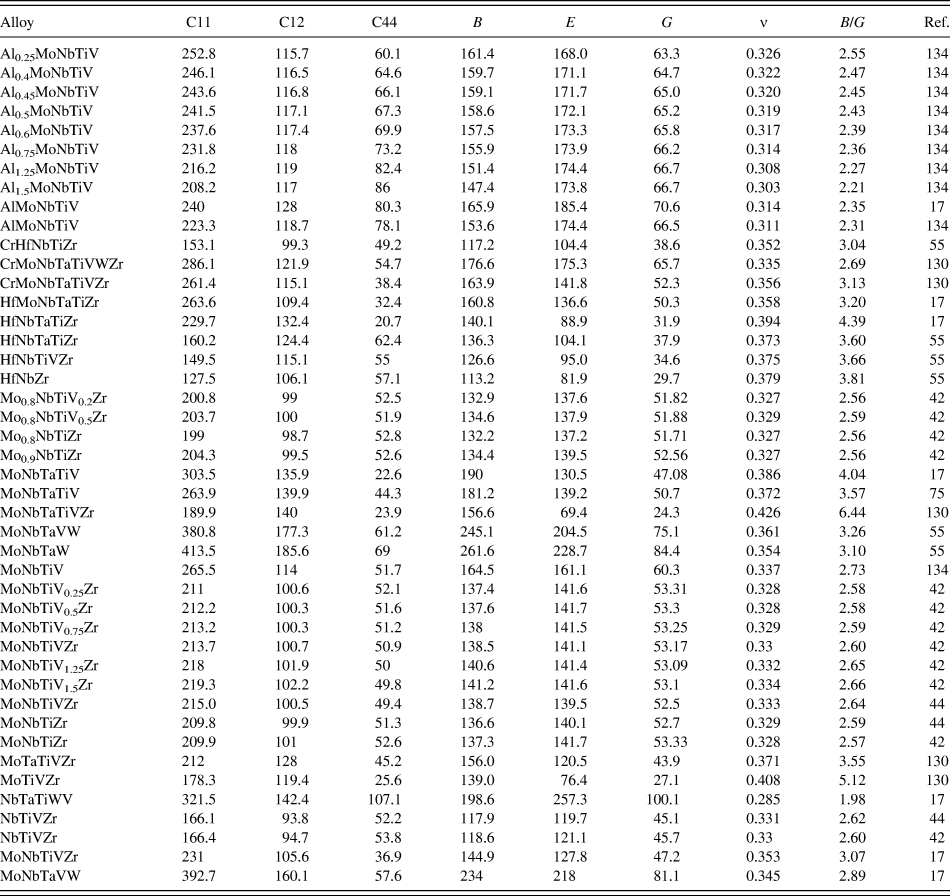
RHEAs and their phase compositions as reported in the open literature. The year when an alloy was first reported and the respective reference are also given here. Additionally is provided mechanical property assessment information (and respective references) for each of the alloys, i.e., the total number of compression (C) or tension (T) tests (corresponding to different microstructures or testing conditions) including those conducted at RT, from 400 to 900 °C and ≥1000 °C.

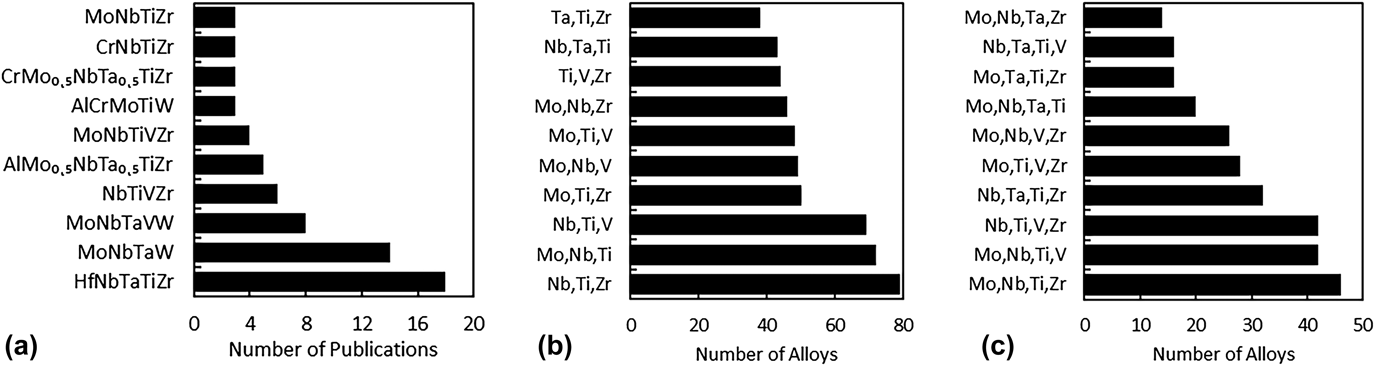
The RHEA compositions that are most frequently used are HfNbTaTiZr,Reference Senkov, Scott, Senkova, Miracle and Woodward8–Reference Lilensten, Couzinie, Perriere, Hocini, Keller, Dirras and Guillot25 MoNbTaW,Reference Senkov, Wilks, Miracle, Chuang and Liaw6,Reference Senkov, Wilks, Scott and Miracle7,Reference Dobbelstein, Thiele, Gurevich, George and Ostendorf26–Reference Del Grosso, Bozzolo and Mosca35 MoNbTaVW,Reference Senkov, Wilks, Miracle, Chuang and Liaw6,Reference Senkov, Wilks, Scott and Miracle7,Reference Han, Chen, Zhao, Fan, Yang, Shao and Yao27,Reference Del Grosso, Bozzolo and Mosca35–Reference Kang, Lee, Ryu and Hong39 NbTiVZr,Reference Senkov, Senkova, Woodward and Miracle40–Reference Wu, Cai, Chen, Wang, Si, Wang, Wang and Hui45 and AlMo0.5NbTa0.5TiZrReference Senkov, Senkova and Woodward46–Reference Senkov, Jensen, Pilchak, Miracle and Fraser51 [Fig. 2(a)]. MoNbTaW and MoNbTaVW are single-phase BCC alloys which retain high strength (above 400 MPa) at temperatures up to 1600 °C. HfNbTaTiZr and NbTiVZr show high strength and good ductility at RT and can be heat treated in single-phase or two-phase BCC structures. AlMo0.5NbTa0.5TiZr is the first reported refractory high entropy superalloy, which has a B2/BCC coherent nanophase structure and shows high-temperature specific strength that is much superior to Ni-based superalloys. Other most frequently used alloys are shown in Fig. 2(a). The reported RHEAs consist of different combinations of alloying elements, some of which are commonly used [Figs. 2(b) and 2(c)]. The most frequent combinations of three elements, such as Nb, Ti, Zr (79 RHEAs), Mo, Nb, Ti (72), Nb, Ti, V (69), and some others are shown in Fig. 2(b). The most frequent combinations of 4 elements are Mo, Nb, Ti, Zr (46), Mo, Nb, Ti, V (42), Nb, Ti, V, Zr (42), and Nb, Ta, Ti, Zr (32), as well as some other combinations shown in Fig. 2(c).
(a) Compositions of most frequently used RHEAs and the number of publications where these compositions were used. (b and c) Most frequent combinations of (b) three elements and (c) four elements in reported RHEAs.

Other elements may be added to the RCCA palette of principal elements in future studies. The refractory elements Ir, Os, Rh, and Ru are probably too expensive to be practical. Fe (T m = 1538 °C) and Y (T m = 1522 °C) have melting temperatures higher than both Ni (T m = 1455 °C) and Co (T m = 1495 °C)—Fe is by far the cheapest of all the elements in the RCCA palette and Y is less costly than many of the RCCA elements. The density of Y (4.47 g/cm3) also makes it an attractive element for RCCAs with reduced density. B (T m = 2075 °C) has a low density and, as a strong compound-former, is a principal element in the B–Mo–Nb–Si family of alloys studied since the 1980s. Adding these elements to those already used brings the RCCA palette to 17 metallic (metals or semimetals) elements and 2 nonmetals (C and N).
III. PROCESSING AND MICROSTRUCTURES
A. Alloy production and processing
High melting temperatures (>1800 °C), as well as very different melting points of refractory elements (from 1857 °C for Cr and Zr to 3422 °C for W), challenge the preparation of RHEAs. The main production method mixes alloying elements in the liquid state using arc melting (the most widely used method), induction melting, laser melting, or electron beam melting. These methods are done in high-purity inert atmosphere or high vacuum. Compositional complexity and large differences in elemental melting temperatures can produce significant elemental segregation in RHEAs prepared from the liquid state.Reference Senkov, Wilks, Miracle, Chuang and Liaw6,Reference Couzinie, Dirras, Perriere, Chauveau, Leroy, Champion and Guillot19,Reference Gao, Zhang, Yang and Guo52 Micro- and macrosegregation (often in the form of a dendritic structure), pores and residual stresses are typical solidification defects in RCCAs. Similar to conventional alloys, the microstructures of as-cast RCCAs are sensitive to the solidification rate. Increasing the solidification rate reduces microsegregation and refines grain size,Reference Couzinie, Dirras, Perriere, Chauveau, Leroy, Champion and Guillot19 and a nanocrystalline grain structure is found in rapidly solidified thin films.Reference Feng, Zhang, Wang, Hou, Wu, Liu and Sun28,Reference Feng, Zhang, Xia, Fu, Wu, Liu and Sun29 Other methods are used to produce homogeneous compositions in bulk cast samples. Most often, long-time annealing in inert atmosphere or vacuum is applied. The annealing temperatures are typically 1200–1400 °CReference Senkov, Senkova, Woodward and Miracle40,Reference Senkov, Woodward and Miracle47 but can be as high as 1800 °CReference Maiti and Steurer53 for RHEAs containing slow-diffusing elements. Since microsegregation is reduced with increasing solidification rate, induction remelting of an already prepared alloy followed by chill casting is another route.Reference Couzinie, Dirras, Perriere, Chauveau, Leroy, Champion and Guillot19,Reference Lilensten, Couzinie, Perriere, Bourgon, Emery and Guillot54,Reference Fazakas, Zadorozhnyy, Varga, Inoue, Louzguine-Luzgin, Tian and Vitos55 For ductile alloys, such as HfNbTaTiZr, HfNbTiZr, or HfMoNbTiZr, hot deformation or cold-work followed by recrystallization annealing are used to remove microsegregation and control grain structure.Reference Senkov and Semiatin11,Reference Lilensten, Couzinie, Perriere, Hocini, Keller, Dirras and Guillot25,Reference Guo, Wang, Luo, Li, Chen, Su, Guo and Fu56
Powder metallurgy (PM) combined with attrition milling and/or mechanical alloying is an alternate route for making RHEAs.Reference Dobbelstein, Thiele, Gurevich, George and Ostendorf26,Reference Kang, Lee, Ryu and Hong39,Reference Waseem, Lee, Lee and Ryu57,Reference Liu, Wang, Chen, Fang and Liu58 Elemental or pre-alloyed powders are blended and/or mechanically milled to achieve the desired composition, and a dense product is formed by consolidation methods that include spark plasma sintering (SPS) in vacuum.Reference Kang, Lee, Ryu and Hong39,Reference Waseem, Lee, Lee and Ryu57 RHEAs produced by PM often have a fine-grained structure and more homogeneous composition. However, special care is needed to avoid contamination and internal oxidation during preparation.Reference Kang, Lee, Ryu and Hong39 Iron contamination from the balls and container walls typically occurs in alloys containing significant W concentrations, and interstitial contamination (most often O and N) from the environment and the process control agent are usually found, especially in alloys containing reactive metals such as Ti and Zr.Reference Suryanarayana59 These contaminants are difficult to avoid and they can have a significant impact on the properties of consolidated materials. Direct metal deposition (DMD), in which continuously deposited powder is locally melted by a pulsed laser, can also be used to produce net-shape structures from RHEAs.Reference Dobbelstein, Thiele, Gurevich, George and Ostendorf26 Simultaneous handling of several elemental or pre-alloyed powders with very different melting temperatures and high sensitivity to oxygen brings new challenges to the DMD process. Factors such as preheating; laser power, beam size, and scan rate; heat conduction; melt pool size; and temperature should be optimized.Reference Dobbelstein, Thiele, Gurevich, George and Ostendorf26
B. Microstructure and phases
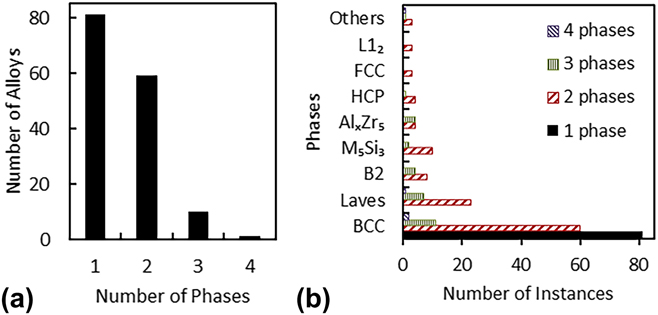
The microstructure and phases are mostly reported for RHEAs/RCCAs in the as-produced and/or annealed above 1000 °C conditions and only few publications report the microstructure of thermomechanically processed RHEAs. More than half of the reported RCCAs (81) are single-phase BCC structures [Fig. 3(a)]. Most of these alloys (57) consist only of elements of subgroups IV–VI of the periodic table, but 23 other single-phase BCC alloys also contain Al and one contains Co (Table I). There are 59 alloys containing 2 phases [Fig. 3(a)]. The matrix phase in these two-phase alloys is BCC (48 alloys), B2 (8 alloys, containing Al and Zr), or FCC (3 alloys based on Co–Ni–W) and the second phase is BCC (12 alloys), Laves (23), M3Si5 (10, containing Si), HCP (5, containing Hf, Ti and Zr), AlxZr5 (4, containing Al and Zr), or L12 (3 alloys based on Co–Ni–W and having FCC as the matrix phase) [Fig. 3(b)]. Only ten 3-phase and one 4-phase RHEAs are reported [Table I and Fig. 3(a)]. The matrix phase in these multiphase alloys is BCC (7 alloys) or B2 (4 alloys) and the secondary phases are Laves, AlxZr5, M3Si5, BCC, and/or B2 [Fig. 3(b)]. This analysis indicates that the most common phases are disordered BCC (found 154 times in all 151 alloys), Laves (found 31 times in twenty three 2-phase, seven 3-phase, and one 4-phase alloys), B2 (found 12 times in eight 2-phase and four 3-phase alloys, in all the cases as a matrix phase), and M5Si3 (found 12 times in ten 2-phase and two 3-phase alloys). The HCP phase occurs only in 6 alloys, which are rich in Hf, Ti, and Zr, as a secondary phase.Reference Stepanov, Yurchenko, Zherebtsov, Tikhonovsky and Salishchev15,Reference Schuh, Volker, Todt, Schell, Perriere, Li, Couzinie and Hohenwarter24,Reference Lilensten, Couzinie, Perriere, Bourgon, Emery and Guillot54,Reference Huang, Wu, He, Wang, Liu, An, Wu and Lu60 An FCC phase is reported only in 3 alloys based on the Co–Ni–W system and is accompanied with an ordered L12 phase.Reference Jiang, Jiang, Lu, Wang, Cao and Li61
(a) Distribution of reported RHEAs by the number of phases. (b) Number of occurrences of different phases in 1-, 2-, 3-, and 4-phase RHEAs.

Domination of the BCC phase in the reported RHEAs is not surprising as these alloys are based on refractory metals of subgroups V and VI, which have BCC crystal lattices and high mutual solubility, and metals of subgroup IV (Ti, Zr, and Hf), which are also BCC at high temperatures, although they experience an allotropic transformation and are HCP structures at RT. Al, which is present in 46 RHEAs, has an FCC structure, but it is a BCC stabilizing element for Ti, Zr, and Hf, and it also has high solubility in refractory metals.Reference Okamoto, Subramanian and Kacprzak62,Reference Villars, Prince and Okamoto63
The Laves phase (C14 or C15) is the second most frequently seen phase in the reported RHEAs. It is always associated with the presence of Cr,Reference Zhang, Gao, Zhang and Guo36,Reference Senkov, Senkova, Woodward and Miracle40,Reference Fazakas, Zadorozhnyy, Varga, Inoue, Louzguine-Luzgin, Tian and Vitos55,Reference Chen, Kauffmann, Gorr, Schliephake, Seemuller, Wagner, Christ and Heilmaier64–Reference Senkov and Woodward66 Mo and Zr,Reference Gao, Carney, Doan, Jablonksi, Hawk and Alman67 and/or a combination of Al, V, and Zr.Reference Yurchenko, Stepanov, Zherebtsov, Tikhonovsky and Salishchev68 The Laves phase is stable below the solidus temperature in Cr–Zr, Mo–Zr, V–Zr, and Cr–Ti binary systems and in Mo–V–Zr and Cr–V–Zr ternary systems, for compositions that exceed the maximum solubility of (Mo,V) or (Cr,V) in Zr and Zr in Cr, Mo, or V.Reference Okamoto, Subramanian and Kacprzak62,Reference Villars, Prince and Okamoto63 The Laves phase is also stable in Me-lean regions (where Me is Nb or Ti) of the Cr–Zr–Me, Mo–Zr–Me, and V–Zr–Me systems. Using this information, one may suggest that the large differences in atomic radii between Zr (the largest refractory metal atom) and Cr, V, or Mo favor Laves phase formation, while increasing Nb and/or Ti in alloys containing the above-mentioned Laves-forming elements hinders Laves phase formation. Depending on the volume fraction and heat treatment, the Laves phase can be present in the form of large particles and/or fine precipitates in a BCC matrix. The presence of a Laves phase notably decreases RT ductility but increases high temperature strengthReference Senkov, Senkova, Woodward and Miracle40,Reference Stepanov, Yurchenko, Panina, Tikhonovsky and Zherebtsov65,Reference Senkov and Woodward66 and improves oxidation resistanceReference Butler, Chaput, Dietrich and Senkov43,Reference Senkov, Senkova, Dimiduk, Woodward and Miracle69 of RHEAs. It is thought that the design of high-solvus heat-treatable RHEAs with a controlled amount of submicron-sized Laves-phase precipitates would be a beneficial direction for the development of new high-temperature materials.
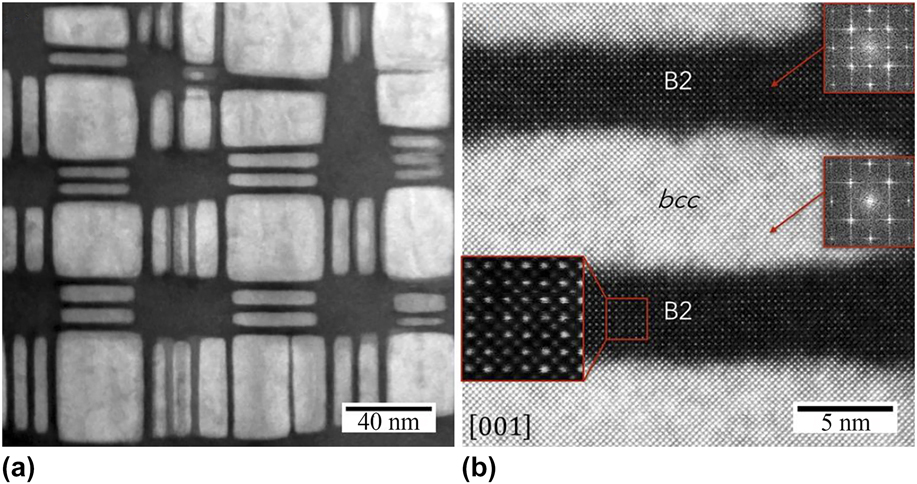
The ordered B2 phase is the third most common phase in reported RHEAs. It is found as a matrix phase in 12 multiphase alloys,Reference Senkov, Senkova and Woodward46,Reference Senkov, Woodward and Miracle47,Reference Senkov, Jensen, Pilchak, Miracle and Fraser51,Reference Yurchenko, Stepanov, Zherebtsov, Tikhonovsky and Salishchev68 which were in as-cast or as-cast and annealed ≥1200 °C conditions. The common elements in these 12 alloys are Al, Nb, Ti, and Zr. Some of them also contain Mo, Ta, and/or V. The secondary phases are BCC, AlxZr5, and Laves. The BCC phase is present as coherent, nanometer-sized precipitates (Fig. 4) in 5 alloys containing Ta and having Zr concentrations (in at.%) equal to or greater than AlReference Senkov, Woodward and Miracle47–Reference Jensen, Welk, Williams, Sosa, Huber, Senkov, Viswanathan and Fraser49,Reference Senkov, Jensen, Pilchak, Miracle and Fraser51 (see Table I). The modulated nanophase B2/BCC structure looks similar to that of superalloys and has good thermal stability and high-temperature strength retention. Because of these similarities and unique properties, RHEAs containing the B2/BCC (or BCC/B2) nanostructure are identified as a new group of refractory high entropy superalloys.Reference Senkov, Isheim, Seidman and Pilchak48,Reference Senkov, Jensen, Pilchak, Miracle and Fraser51 In spite of similar lattice parameters, the chemical compositions of B2 and BCC phases are quite different. Specifically, the BCC phase is depleted and B2 phase is rich in Al and Zr. The B2 ordering is likely due to strong interactions of Al and Zr atoms in the presence of other refractory elements.Reference Senkov, Isheim, Seidman and Pilchak48,Reference Senkov, Jensen, Pilchak, Miracle and Fraser51 It was suggestedReference Senkov, Isheim, Seidman and Pilchak48,Reference Senkov, Jensen, Pilchak, Miracle and Fraser51 that these phases are formed by decomposition of a high-temperature BCC phase due to a miscibility gap, similar to that observed in Nb–Zr and Ta–Zr systems.Reference Okamoto70 The mechanism of the phase separation (spinodal decomposition or nucleation-and-growth) still needs to be identified.
STEM-HAADF images of the nanophase structure present inside the grains of AlMo0.5NbTa0.5TiZr. (a) Cuboidal and plate-like precipitates of a disordered BCC phase are separated by continuous channels of an ordered B2 phase. (b) Fast Fourier transforms (shown inside the red squares) reveal an ordered B2 structure for the dark channels and a disordered A2 (BCC) structure for the cuboidal precipitates.Reference Senkov, Jensen, Pilchak, Miracle and Fraser51

The seven remaining RHEAs with a B2 matrix phase have AlxZr5 as a second phase that precipitates mainly at grain and subgrain boundaries. The alloys containing AlxZr5 are AlNbTiVZrx (x = 0.1–1.5),Reference Yurchenko, Stepanov, Zherebtsov, Tikhonovsky and Salishchev68 AlNbTa0.5TiZr0.5, and AlMo0.5NbTa0.5TiZr0.5.Reference Senkov, Jensen, Pilchak, Miracle and Fraser51 AlNbTiVZrx with x = 0.5 additionally contains a Laves phase. The B2-based RHEAs that do not have BCC nanoprecipitates have high RT strength, but they lose strength rapidly at temperatures above ∼800 °C.Reference Senkov, Jensen, Pilchak, Miracle and Fraser51,Reference Yurchenko, Stepanov, Zherebtsov, Tikhonovsky and Salishchev68
Only 3 reported RHEAs have a disordered FCC structure as a matrix phase. These alloys are modifications of a Co–Ni–W-based superalloy to which Cr, Mo, and V were added.Reference Jiang, Jiang, Lu, Wang, Cao and Li61 The compositions of the alloys are Co2Ni2W0.5VMo0.5, Co2Ni2W0.5Cr0.5, and Co2Ni2W0.5CrMo0.5. The alloys were produced by vacuum arc melting and had a dendritic structure with dendrites enriched in Mo and W and interdendrites enriched in Co and Ni. The alloys have good compression ductility, with RT yield strengths of 1000 MPa, 750 MPa, and 250 MPa, respectively, showing noticeable dependence on the alloying elements present. Though elevated temperature properties were not reported, these preliminary results indicate an ability to improve properties of conventional Co–Ni–W-based superalloys by using the high entropy approach.
Due to low diffusivity of refractory elements, the phases reported in some RHEAs, even those annealed at 1200 or 1400 °C for 24 h, are likely not equilibrium ones but rather represent high-temperature phases that are frozen during cooling due to kinetic restrictions. Indeed, recent studies show that a ductile HfNbTaTiZr RHEA, which was earlier considered to have a single-phase BCC structure, transforms into two BCC phases (one rich in Nb and Ta and the other rich in Hf and Zr) after severe cold-work and annealing at 700–900 °C.Reference Senkov and Semiatin11,Reference Schuh, Volker, Todt, Schell, Perriere, Li, Couzinie and Hohenwarter24 Moreover, severe plastic deformation (SPD) followed by annealing at 300 and 500 °C caused formation of a Hf- and Zr-rich HCP phase in this alloy.Reference Schuh, Volker, Todt, Schell, Perriere, Li, Couzinie and Hohenwarter24 All the phase compositions were kinetically stable at RT and provided different mechanical properties for the same alloy. The results indicate that slow diffusion of refractory alloying elements provides great opportunity for producing a variety of kinetically stable microstructures in RHEAs, thus allowing application-driven property optimization. These results also show the importance of thermomechanical processing for accelerating phase transformations and producing microstructures and phases which may provide desirable mechanical properties of a RHEA in a temperature range of intended use.
IV. MECHANICAL PROPERTIES
RHEAs/RCCAs are generally considered as future materials for high-temperature structural applications beyond Ni-based superalloys. Therefore, development efforts should identify RHEAs with superior mechanical properties such as strength, ductility, and toughness. Mechanical behavior is closely related to alloy composition, phase content, and microstructure(s). Given the compositional complexity of RHEAs, it is critical to obtain an overall view and identify potential enhancements of mechanical behavior for such materials, as well as to pinpoint general trends and thus suggest future research directions in this field.
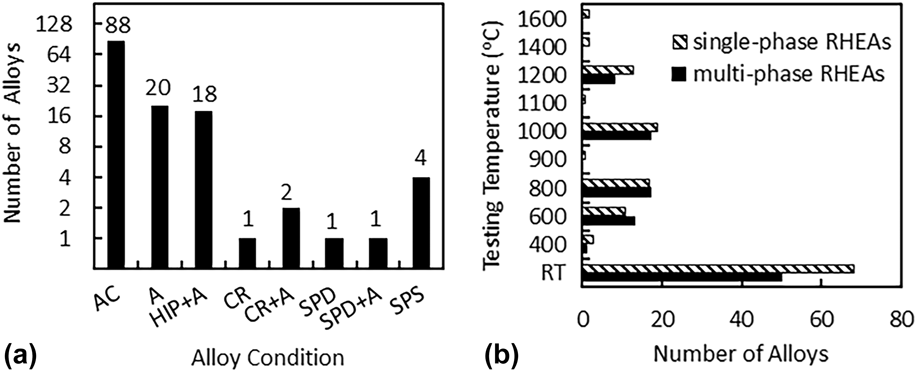
By the end of January 2018, mechanical properties (using compression and/or tension tests) were described for 120 of the currently reported 151 RHEAs/RCCAs (Table I). A wide temperature range, from RT to 1600 °C, was used for the studies. The great majority of the evaluated materials have at least one disordered BCC phase and were tested in compression under quasi-static and (in a single study) dynamic conditions. The few tensile studies were only conducted at RT, which does not allow the complete assessment of these alloys for high temperature applications. Furthermore, no reports are yet available on such critical structural properties as fatigue and creep resistance. RHEAs for mechanical testing are often prepared by conventional melting-solidification processes and different kinds of microstructures (single or multiphase) have been evaluated in as-cast (88 alloys), annealed (20), HIP plus annealed (18), and thermomechanically processed (5) conditions [Fig. 5(a)]. Four RHEAs were synthesized by PM/SPS. About 60% of the mechanically tested RHEAs are single-phase BCC structures and the remaining contained two or three phases [Fig. 5(b) and Table I]. The most-studied RHEAs/RCCAs are HfNbTaTiZr (10 published reports), AlMo0.5NbTa0.5TiZr (4), and AlNbTiV (3). The properties of other RHEAs were reported only in 1 or 2 publications each (Table I).
(a) Number of RHEAs for which compression or tension properties were reported for given processing conditions (AC = as-cast, A = annealed, HIP = hot isostatically pressed, CR = cold rolled, SPD = severe plastically deformed by high pressure torsion (HPT), and SPS = spark plasma sintered from powders). (b) Number of all single- and multiphase RHEAs for which compression or tension properties were reported, indicating the test temperatures used. Note the logarithmic scale for the vertical axis in (a).

Almost all (118) of the reported 120 RHEAs were tested at RT and only a few of them were tested at elevated temperatures [Figs. 5(b) and 6]. The more frequently used elevated temperatures for compression testing are 1000 °C (36 alloys), 800 °C (34), 600 °C (24), and 1200 °C (21) [Fig. 5(b)]. Only two alloys, MoNbTaW and MoNbTaVW, were studied at temperatures above 1200 °C.Reference Senkov, Wilks, Scott and Miracle7
Temperature dependence of (a) yield stress and (b) specific yield stress for RHEAs and two representative Ni-based superalloys, Inconel 718 and Mar-M247. All metallurgical states are considered, and single- and multiphase materials are distinguished. Only quasi-static results are displayed (strain rate between 10−5 and 10−3 s−1). RT: room temperature; SPS: spark plasma sintering; TRIP: transformation-induced plasticity.

A. Mechanical behavior and strengthening mechanisms
The main mechanical properties studied are the combination of the yield stress σY and plastic (or total) strain εP (εT). Figure 6 displays the evolution of yield stress (a) and specific yield stress (b) with temperature for all the RHEAs tested in the literature under quasi-static conditions (compression or tension, strain rates between 10−5 and 10−3 s−1), regardless of the type of microstructures and preparation processes. For the sake of comparison with standard alloys, the evolution of σY and σY/ρ for two Ni-based superalloys Inconel 718 (disk alloy) and Mar-M247 (blade alloy) are added to the plot. Due to the multitude of compositions and microstructures, the range of σY and σY/ρ reported for a given temperature is quite large. For example, at RT, σY values fall between 400 and 2612 MPa.
Similar to many BCC metals and alloys, RHEAs suffer from a lack of ductility in the low temperature regime. Aside from the notable exception of the equimolar HfNbTaTiZr alloy and some of its derived compositions, compressive ductility is often limited and RHEAs show brittle behavior at T ≤ 600 °C. Strategies to ductilize RHEAs are under consideration and appear promising.Reference Huang, Wu, He, Wang, Liu, An, Wu and Lu60,Reference Sheikh, Shafeie, Hu, Ahlstrom, Persson, Vesely, Zyka, Klement and Guo71 σY decreases with increasing temperature and a significant drop is observed beyond 800 °C for most RHEAs. It is worth noting that some multiphase RHEAs, such as AlMo0.5NbTa0.5TiZr and their derivatives, retain superior mechanical properties up to 1000–1200 °C (Fig. 6), due to thermally stable nanoscale precipitation.Reference Senkov, Isheim, Seidman and Pilchak48,Reference Senkov, Jensen, Pilchak, Miracle and Fraser51 Multiphase AlMo0.5NbTa0.5TiZr is also offering exceptional specific yield stresses with values ranging from ∼308 to ∼100 MPa cm3/g between RT and 1000 °C, significantly higher than Inconel 718 and Mar-M247 [Fig. 6(b)]. At 1000 °C, the B2 single-phase AlMo0.5NbTa0.5TiZr0.5 RHEA stands out from the other compositions and maintains ∼130 MPa cm3/g, which clearly attests the potential of such alloys for high temperature structural applications.
At very high temperatures (T ≥ 1200 °C), the few studied alloys containing both tantalum and tungsten maintain interesting properties, especially CrTaTixVW (0 < x < 1) prepared by PM and SPSReference Waseem, Lee, Lee and Ryu57 but also MoNbTaVW and MoNbTaW compositions developed in the pioneering work by Senkov and coworkers.Reference Senkov, Wilks, Scott and Miracle7,Reference Senkov, Isheim, Seidman and Pilchak48 Although the latter two alloys have high density and their specific strengths are less attractive than the strengths of some other RHEAs at temperatures ≤1000 °C, these are the only RHEAs that show potential use above 1200 °C [Fig. 6(b)].
1. RT behavior
Among the 314 mechanical tests reported for RHEAs, 168 (i.e., 53%) were carried out at RT (Table I). The majority of these RT tests (101) were conducted on RHEAs with as-cast and dendritic structures, 51 tests were conducted on homogenized alloys, 12 tests after thermomechanical processing (which included cold-work), and 4 tests were conducted on PM materials.
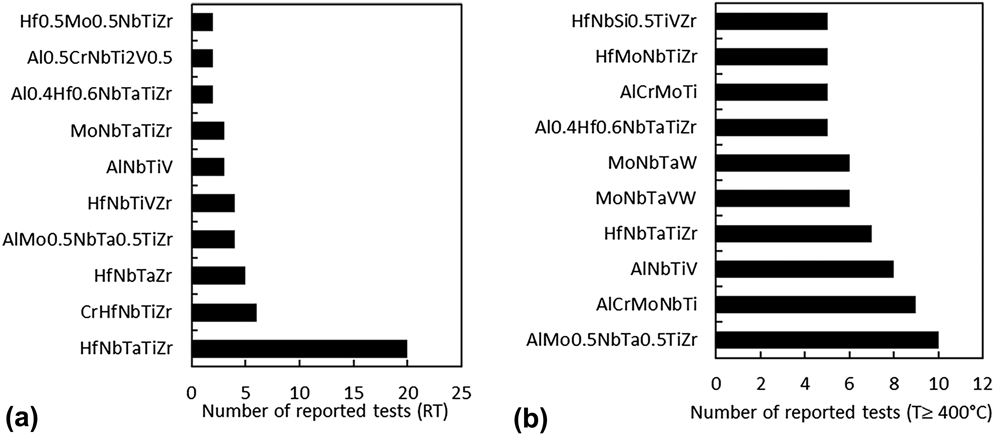
The alloys for which RT properties are most extensively reported (often for different microstructure conditions) are HfNbTaTiZr (20 reported tests), CrHfNbTiZr (6), HfNbTaZr (5), AlMo0.5NbTa0.5TiZr (4), HfNbTiVZr (4), AlNbTiV (3), and MoNbTaTiZr (3) [Fig. 7(a)]. Many other studies on related compositions aim to analyze the influence of elemental additions or substitutions on the microstructure and phase composition and, therefore, on mechanical properties of RHEAs.
Compositions of RHEAs, which (a) RT properties or (b) properties at temperatures ≥400 °C were reported most often, and the number of respective reported tests.

The most examined alloy, HfNbTaTiZr, is a BCC solid solution in the as-cast condition and also after annealing above 1000 °C. The alloy has a good combination of strength and ductility: compressive properties of the cast and/or annealed material are not affected by chemical heterogeneitiesReference Dirras, Lilensten, Djemia, Laurent-Brocq, Tingaud, Couzinie, Perriere, Chauveau and Guillot23 and show yield stress of 800–1000 MPa and compressive strains exceeding 50%.Reference Senkov, Scott, Senkova, Miracle and Woodward8,Reference Lin, Juan, Chang, Tsai and Yeh12,Reference Couzinie, Lilensten, Champion, Dirras, Perriere and Guillot18 Deformation is macroscopically homogeneous due to high number densities of uniformly distributed shear bands and twins.Reference Senkov, Scott, Senkova, Miracle and Woodward8 Due to excellent workability of HfNbTaTiZr,Reference Senkov and Semiatin11 its uniaxial tensile properties have been evaluated after classical thermomechanical processing.Reference Senkov and Semiatin11,Reference Juan, Tsai, Tsai, Hsu, Lin, Chen, Lin and Yeh14,Reference Lilensten, Couzinie, Perriere, Hocini, Keller, Dirras and Guillot25 The single phase material shows both yield stress and maximum true stress close to 1000 MPa, as well as tensile plastic strain far beyond 10% in fully homogenized samples. This combination of properties reflects the low strain-hardening of the BCC solid solution at RT.Reference Senkov and Semiatin11,Reference Juan, Tsai, Tsai, Hsu, Lin, Chen, Lin and Yeh14,Reference Lilensten, Couzinie, Perriere, Hocini, Keller, Dirras and Guillot25 The same trends (high yield stress, low strain-hardening, and good deformation properties) are found in derived compositions such as quaternary (annealed) HfNbTiZrReference Wu, Cai, Wang, Si, Zhu, Wang and Hui72 or quinary (as-cast) Hf0.5Nb0.5Ta0.5Ti1.5Zr.Reference Sheikh, Shafeie, Hu, Ahlstrom, Persson, Vesely, Zyka, Klement and Guo71
Similar to conventional BCC metals and alloys, the mechanical behavior of RHEAs is sensitive to the strain rate. Significant yield stress increases (∼40%) are reported with increasing strain rate in the sole study of HfNbTaTiZr under compressive quasi-static and dynamic conditions in the 10−3 to 3450 s−1 range.Reference Dirras, Couque, Lilensten, Heczel, Tingaud, Couzinie, Perriere, Gubicza and Guillot22 Whereas continuous strain and strain-rate hardening is effective between 10−3 and 9.3 s−1, flow softening is observed for strain rates of 2100 and 3450 s−1 due to adiabatic heating and strain localization in shear bands, which thickness increases with the strain rate.
Elemental additions or substitutions in RHEAs can drastically change the balance between strength and ductility. Additions of subgroup IV elements (Hf, Ti, Zr) generally improve ductility, while additions of subgroups V and VI elements and/or Al often improve strength but reduce ductility. For example, HfNbTaTiZr,Reference Senkov, Scott, Senkova, Miracle and Woodward8,Reference Couzinie, Lilensten, Champion, Dirras, Perriere and Guillot18 MoNbTaTiW,Reference Han, Luan, Liu, Chen, Li, Shao and Yao30 and MoNbTaTiVWReference Han, Luan, Liu, Chen, Li, Shao and Yao30 are more ductile than the respective MoNbTaTiZr,Reference Wang and Xu73 MoNbTaW,Reference Senkov, Wilks, Scott and Miracle7 and MoNbTaVW.Reference Senkov, Wilks, Scott and Miracle7 On the other hand, additions of V or Cr in HfNbTiZrX,Reference Fazakas, Zadorozhnyy, Varga, Inoue, Louzguine-Luzgin, Tian and Vitos55 Mo in MoxNbTiZrVyReference Wu, Cai, Chen, Wang, Si, Wang, Wang and Hui45 (0 < x < 1.5 and y = 0.3, 1), or Al in AlxHfNbTaTiZrReference Lin, Juan, Chang, Tsai and Yeh12 (0.5 < x < 1) considerably increase RT strengths of the base alloys but reduce ductility. The same pattern is observed in equimolar HfMoNbTiZrReference Guo, Wang, Luo, Li, Su, Guo and Fu74 solid solutions and in MoNbTaTiV,Reference Yao, Qiao, Hawk, Zhou, Chen and Gao75 HfMoNbTiZrTa,Reference Juan, Tsai, Tsai, Lin, Wang, Yang, Chen, Lin and Yeh10 and AlHfNbTaTiZrReference Lin, Juan, Chang, Tsai and Yeh12 multiphase materials which generally possess superior strength but poor ductility. First principles calculations recently show that alloying intrinsically brittle Mo and W with subgroup IV or V transition metals can make them intrinsically ductile.Reference Qi and Chrzan76 This composition-induced brittle to ductile transition was explained by changes in the electronic structure, which induced Jahn–Teller distortion and transition of the elastic instability mode from tensile to shear failure.Reference Qi and Chrzan76
Extending this theory to RHEAs, Sheikh et al.Reference Sheikh, Shafeie, Hu, Ahlstrom, Persson, Vesely, Zyka, Klement and Guo71 found that single-phase BCC RHEAs consisting of subgroup IV, V, and VI metals are intrinsically ductile if the valence electron concentration (VEC) is less than 4.5 and intrinsically brittle if VEC ≥ 4.6. Unfortunately, this approach does not apply if an RHEA contains elements of other groups of the periodic table, such as Al, Co, or Si.
Small additions of alloying elements to equimolar compositions can increase both strength and ductility as shown for AlxTiZrHfNbTaReference Lin, Juan, Chang, Tsai and Yeh12 (x < 0.3), HfMoxNbTaTiZr,Reference Juan, Tseng, Hsu, Tsai, Tsai, Lin, Chen, Lin and Yeh21 (0.25 < x < 0.75) and AlxNbTaTiVReference Yang, Zhang and Liaw77 (0.25 < x < 1). Ti additions in initially brittle NbMoTaV and NbMoTaVW also give a simultaneous (and pronounced) improvement of RT compressive yield stress and ductility.Reference Han, Chen, Zhao, Fan, Yang, Shao and Yao27,Reference Han, Luan, Liu, Chen, Li, Shao and Yao30 While a classical solid solution strengthening (SSS) effect is proposed to explain the strength increase, mechanisms associated with the improvement of plastic strain are still unclear, although a positive impact of titanium on grain boundary cohesion is suggested. This beneficial effect of minor alloy additions on both strength and ductility does not always occur. For example Al additions in AlxMoTaTiV (0 < x < 1) do not improve strength and ductility: compressive yield stress decreases from 1221 to 962 MPa and compressive ductility decreases from 9.9 to 4.2% with increasing x from 0 to 0.6, and no plastic strain is observed at x = 1.Reference Qiao, Jiang, Chang, Lu and Li78
Interstitial elements that segregate to grain boundaries during solidification and/or annealing are likely responsible for brittle behavior of some RHEAs at RT. This suggestion is supported by studies of properties of single-crystalline and bicrystalline samples of MoNbTaW.Reference Zou, Maiti, Steurer and Spolenak31,Reference Zou, Okle, Yu, Sumigawa, Kitamura, Maiti, Steurer and Spolenak32 Zou et al.Reference Zou, Maiti, Steurer and Spolenak31 studied RT compression properties of single-crystal micropillars (from 2 μm to 200 nm in diameter) of a well homogenized MoNbTaW. Extraordinarily high strengths of ∼4–4.5 GPa, which are ∼3–3.5 times higher than those of bulk samples, a weak size effect, and significantly improved ductility were reported. On the other hand, the fracture toughness of a bicrystalline sample of MoNbTaW was one order of magnitude lower than that of single-crystalline ones.Reference Zou, Okle, Yu, Sumigawa, Kitamura, Maiti, Steurer and Spolenak32 Atom probe tomography of the bicrystal HEA revealed element segregation and presence of oxygen and nitrogen at grain boundaries. These results suggest that minimizing grain boundary segregation and reducing the level of interstitial impurities are critical for improving ductility and toughness of some RHEAs.
Recent studies investigate the mechanical behavior of RHEAs reinforced with carbides or silicides.Reference Guo, Wang, Luo, Li, Chen, Su, Guo and Fu79–Reference Liu, Zhang, Zhang, Wang, Chen, Zhang and Li82 Alloying a single-phase BCC Hf0.5Mo0.5NbTiZr with C forms MC carbides (M = Hf, Nb, Ti, or Zr). These carbides do not have a noticeable effect on σY but improve both ductility and work hardening at RT, especially for low carbon content (C0.1Hf0.5Mo0.5NbTiZr).Reference Guo, Wang, Luo, Li, Chen, Su, Guo and Fu80 The authors claim that carbide formation provides second-phase strengthening but decreases the SSS due to a depletion of carbide-forming metallic elements in the matrix. Guo et al.Reference Guo, Wang, Luo, Li, Chen, Su, Guo and Fu79,Reference Liu, Zhang, Zhang, Wang, Chen, Zhang and Li82 studied the effect of Si additions on microstructure and properties of Hf0.5Mo0.5NbSixTiZr and HfMo0.5NbSixTiV0.5 RHEAs. Small Si additions (∼2.5 at.%) in Hf0.5Mo0.5NbTiZr form M5Si3 particles, refine grain size, and improve compression strength and ductility.Reference Guo, Wang, Luo, Li, Chen, Su, Guo and Fu79 A further increase in Si is however unfavorable for mechanical properties. The same (unfavorable) trend is observed in HfMo0.5NbSixTiV0.5 with x > 0.5.Reference Liu, Zhang, Zhang, Wang, Chen, Zhang and Li82
The effect of grain size and phase composition on the mechanical behavior of HfNbTaTiZrReference Senkov and Semiatin11,Reference Schuh, Volker, Todt, Schell, Perriere, Li, Couzinie and Hohenwarter24 has recently been studied. Using SPD by cold rollingReference Senkov and Semiatin11 or high pressure torsion (HPT),Reference Schuh, Volker, Todt, Schell, Perriere, Li, Couzinie and Hohenwarter24 sometimes followed by annealing at 300–1200 °C, different microstructures and phases were produced. In particular, HPT produced nanometer-sized grains in a single-phase BCC structure,Reference Zou, Maiti, Steurer and Spolenak31 annealing at 300 and 500 °C produced a two-phase BCC + HCP structure,Reference Zou, Maiti, Steurer and Spolenak31 annealing at 800 °C produced a two-phase BCC + BCC structure,Reference Senkov and Semiatin11,Reference Schuh, Volker, Todt, Schell, Perriere, Li, Couzinie and Hohenwarter24 and annealing above 1000 °C produced a recrystallized single-phase BCC structure.Reference Senkov and Semiatin11,Reference Schuh, Volker, Todt, Schell, Perriere, Li, Couzinie and Hohenwarter24 The refined grain structure and high dislocation density after HPT increased tensile yield stress of HfNbTaTiZr from 830 to 1900 MPa, with a slight drop in elongation from 9 to 8%.Reference Zou, Maiti, Steurer and Spolenak31 Similar, but less pronounced effect (an increase in the tensile yield stress to 1200 MPa) was also observed after cold rolling.Reference Senkov and Semiatin11 Annealing of the cold-worked material at 500 °C made the alloy brittle.Reference Zou, Maiti, Steurer and Spolenak31 After annealing at 800 °C, the HPT-processed alloy had a yield stress of 795 MPa and an elongation of 5%,Reference Zou, Maiti, Steurer and Spolenak31 while the cold-rolled material had a yield stress of 1300 MPa and an elongation of 2%.Reference Senkov and Semiatin11 After recrystallizing a cold-rolled sample at 1000 °C, the yield stress was 1145 MPa and elongation was 10%. In the initial BCC HfNbTaZr alloy, heat treatment at 1800 °C caused the formation of short-range clusters and consequently the increase of strength with a decrease in ductility.Reference Maiti and Steurer53 These results indicate that the strength and ductility of some RHEAs can be controlled over broad ranges by thermomechanical treatment. Thus, developing thermomechanical and heat treatment processes for RHEAs to achieve desired properties should be a priority for future research and development.
One RHEA strategy seeks to decrease density while keeping superior mechanical properties. This strategy has produced light-weight RHEAs using Cr, Nb, Mo, Ti, V, and Zr as principal elements, with or without addition of Al.Reference Senkov, Senkova, Miracle and Woodward41,Reference Senkov, Senkova and Woodward46,Reference Senkov, Woodward and Miracle47,Reference Stepanov, Yurchenko, Panina, Tikhonovsky and Zherebtsov65,Reference Senkov and Woodward66,Reference Yurchenko, Stepanov, Zherebtsov, Tikhonovsky and Salishchev68,Reference Stepanov, Shaysultanov, Salishchev and Tikhonovsky83,Reference Stepanov, Yurchenko, Skibin, Tikhonovsky and Salishchev84 Several RHEAs have been produced with alloy densities much below the density of Ni-based superalloys or steels. For example, AlxNbTiVZry alloys have the densities of 5.6–5.9 g/cm3.Reference Yurchenko, Stepanov, Zherebtsov, Tikhonovsky and Salishchev68,Reference Stepanov, Yurchenko, Shaysultanov, Salishchev and Tikhonovsky85 Secondary phases are often formed in these systems and precipitation of potential strengthening phases is targeted in the reports. Except for NbTiVZr and NbTiV2Zr, most of the alloys containing Cr and V as principal elements offer limited ductility at RT. Cleavage fracture of brittle Laves phases and ductile fracture of the BCC matrix occur.Reference Senkov, Senkova, Miracle and Woodward41,Reference Senkov and Woodward66
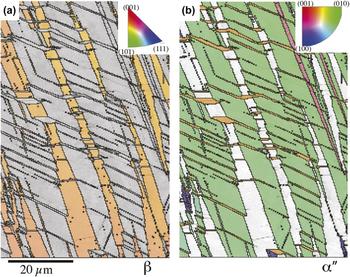
Recent strategies aiming to improve work hardening and tensile ductility of RHEAs have led to the development of HfNb0.18Ta0.18Ti1.27ZrReference Lilensten, Couzinie, Bourgon, Perriere, Dirras, Prima and Guillot86 and HfTa0.4TiZrReference Huang, Wu, He, Wang, Liu, An, Wu and Lu60 RHEAs experiencing strain- or stress-induced phase transformations. In both cases, the strategy was to design a RCCA composition to destabilize the initial BCC phase during the deformation process. Transformation-induced increases in tensile strain and work-hardening were achieved by forming, in strain-localized regions, a stronger HCP phase in HfTa0.4TiZrReference Huang, Wu, He, Wang, Liu, An, Wu and Lu60 or α″ martensite in HfNb0.18Ta0.18Ti1.27ZrReference Lilensten, Couzinie, Bourgon, Perriere, Dirras, Prima and Guillot86 (Fig. 8). The alloys have the yield stress of 400 and 540 MPa and work hardening rate, dσ/dε, of 3 and 6.5 GPa respectively. Similar approaches to enhance uniform tensile ductility by deformation-induced phase transformations [so-called transformation-induced plasticity (TRIP) or twinning-induced plasticity (TWIP)] are used in steels,Reference Herrera, Ponge and Raabe87,Reference Grassel, Kruger, Frommeyer and Meyer88 BCC-based titanium alloys,Reference Sun, Zhang, Marteleur, Gloriant, Vermaut, Laille, Castany, Curfs, Jacques and Prima89,Reference Marteleur, Sun, Gloriant, Vermaut, Jacques and Prima90 and FCC-based HEAs.Reference Li, Pradeep, Deng, Raabe and Tasan91 Tensile ductility of these alloys is enhanced by delaying Considere’s criteria and strain localization. Therefore, this method is only applicable to intrinsically ductile RHEAs and cannot be applied to inherently brittle RHEAs that fracture without strain localization/necking and, often, without any macroscopic strain.
Strain-induced formation of α″ orthorhombic martensite inside a BCC grain of an HfNb0.18Ta0.18Ti1.27Zr alloy experienced 7% tensile strain.Reference Lilensten, Couzinie, Bourgon, Perriere, Dirras, Prima and Guillot86 EBSD inverse pole figure maps of the (a) BCC phase and (b) α″ orthorhombic martensite phase. The color-coded stereographic triangles are shown in the respective insets.

2. Mechanical behavior from 400 to 1200 °C
The alloys, for which mechanical properties at T ≥ 400 °C have been more extensively reported, are AlMo0.5NbTa0.5TiZr (10 reported tests),Reference Senkov, Senkova and Woodward46–Reference Senkov, Isheim, Seidman and Pilchak48,Reference Senkov, Jensen, Pilchak, Miracle and Fraser51 AlCrMoNbTi (9),Reference Chen, Kauffmann, Gorr, Schliephake, Seemuller, Wagner, Christ and Heilmaier64,Reference Chen, Kauffmann, Laube, Choi, Schwaiger, Huang, Lichtenberg, Muller, Gorr, Christ and Heilmaier92 AlNbTiV (8),Reference Yurchenko, Stepanov, Zherebtsov, Tikhonovsky and Salishchev68,Reference Stepanov, Shaysultanov, Salishchev and Tikhonovsky83,Reference Stepanov, Yurchenko, Skibin, Tikhonovsky and Salishchev84 HfNbTaTiZr (7),Reference Senkov, Scott, Senkova, Meisenkothen, Miracle and Woodward9 and other RHEAs shown in Fig. 7(b). Many RHEAs, independent of the number and type of phases present, experience a brittle-to-ductile transition above RT. For example, single-phase BCC MoNbTaW and MoNbTaVW,Reference Senkov, Wilks, Scott and Miracle7,Reference Han, Luan, Liu, Chen, Li, Shao and Yao30 AlCrMoNbTi,Reference Chen, Kauffmann, Gorr, Schliephake, Seemuller, Wagner, Christ and Heilmaier64 HfMoTaTiZr,Reference Juan, Tsai, Tsai, Lin, Wang, Yang, Chen, Lin and Yeh10 and HfMoNbTaTiZrReference Juan, Tsai, Tsai, Lin, Wang, Yang, Chen, Lin and Yeh10 are brittle and show intergranular fracture at T ≤ 600 °C. RHEAs generally exhibit good ductility and ductile fracture above 600–800 °C. HfNbTaTiZr is probably the only RHEA studied to date with a brittle-to-ductile transition below RT. The microstructure and properties of this alloy were studied in a broad range of temperatures and strain rates.Reference Senkov, Scott, Senkova, Meisenkothen, Miracle and Woodward9 Three temperature regions with different deformation behaviors were identified. At temperatures up to 600 °C, HfNbTaTiZr exhibits strain hardening behavior, good ductility, and deformation twin activity similar to that observed at RT. At 800 °C fine grains, cavitation and crack propagation along grain boundaries were observed, as well as precipitates at grain boundaries due to the instability of the solid solution.Reference Stepanov, Yurchenko, Zherebtsov, Tikhonovsky and Salishchev15,Reference Schuh, Volker, Todt, Schell, Perriere, Li, Couzinie and Hohenwarter24 During deformation at 1000 and 1200 °C, dynamic recrystallization and formation of a fine, equiaxed grain structure occurred. At T ≤ 600°C and T ≥1000 °C, HfNbTaTiZr showed homogeneous deformation and no evidence of cavitation or fracture. The yield stress decreased with an increase in temperature from 535 MPa at 800 °C to 92 MPa at 1200 °C. Plastic flow at high temperatures and strain rates from 10−5 to 10−1 s−1 was described by Zener–Hollomon relationship, with a stress exponent n = 3.3 ± 0.3 and an activation energy Q = 226 kJ/mol, suggesting solute-drag controlling mechanism.Reference Senkov, Scott, Senkova, Meisenkothen, Miracle and Woodward9 Addition of Mo or replacing Nb with Mo in equimolar HfNbTaTiZr improves the compressive yield stress at 1000 °C and 1200 °C of HfMoNbTaTiZr to 814 MPa and 556 MPa and of HfMoTaTiZr to 855 MPa and 404 MPa, respectively.Reference Juan, Tsai, Tsai, Lin, Wang, Yang, Chen, Lin and Yeh10 Formation of second-phase precipitates, intergranular cracks, and porosity occurs in both alloys during compression testing at 1000 and 1200 °C. The phase transformations observed during high-temperature deformation may occur due to metastability of RT phases.Reference Senkov, Scott, Senkova, Meisenkothen, Miracle and Woodward9,Reference Juan, Tsai, Tsai, Lin, Wang, Yang, Chen, Lin and Yeh10,Reference Senkov, Senkova, Miracle and Woodward41,Reference Senkov, Jensen, Pilchak, Miracle and Fraser51
In the case of light-weight RHEAs, the multiphase CrNbTiVZr alloy has a σY of 1230 MPa and 615 MPa at 600 and 800 °C, respectively.Reference Senkov, Senkova, Miracle and Woodward41 The low density of this alloy (ρ = 6.57 g/cm3) gives specific yield strengths of 187 MPa cm3/g and 94 MPa cm3/g, respectively, at these two test temperatures. Light-weight RHEAs with Al have also been studied, including AlCrMoNbTi,Reference Chen, Kauffmann, Gorr, Schliephake, Seemuller, Wagner, Christ and Heilmaier64 Al0.4Hf0.6NbTaTiZr,Reference Senkov, Senkova and Woodward46 AlNbTiVZrx (0 < x < 1.5), and AlCrxNbTiV (0 < x < 1.5).Reference Yurchenko, Stepanov, Zherebtsov, Tikhonovsky and Salishchev68,Reference Stepanov, Yurchenko, Skibin, Tikhonovsky and Salishchev84 The single-phase AlCrMoNbTi alloy is barely ductile at 800–1200 °C, with 24% compressive plastic strain at 1200 °C.Reference Chen, Kauffmann, Gorr, Schliephake, Seemuller, Wagner, Christ and Heilmaier64 Its compressive strength is 860 MPa at 800 °C but the strength drops significantly at T ≥ 1000 °C. The alloy shows strain softening followed by quasi steady-state flow with σ = 110 MPa at 1200 °C. AlNbTiVZrx and AlCrxNbTiV have good properties up to 600 and 800 °C, respectively.Reference Yurchenko, Stepanov, Zherebtsov, Tikhonovsky and Salishchev68,Reference Stepanov, Yurchenko, Skibin, Tikhonovsky and Salishchev84 In the temperature range of 20–800 °C, the yield stress of AlCrxNbTiV increases with Cr additions due to the formation of Laves phases.Reference Stepanov, Yurchenko, Skibin, Tikhonovsky and Salishchev84 Among these alloys, AlCr1.5NbTiV has the highest specific yield stress of ∼160 MPa cm3/g at 800 °C. However, AlCrxNbTiV alloys (0 < x < 1.5) show reasonable compressive ductility only above 800 °C. Zirconium additions increase the strength of AlNbTiVZrx up to 600 °C due to SSS. A drop in the yield stress of AlNbTiVZrx occurs at T ≥ 800 °C, which is associated with a decrease in the long-range order of the B2 matrix.Reference Yurchenko, Stepanov, Zherebtsov, Tikhonovsky and Salishchev68
Substituting Al for dense (Hf) or brittle phase-forming (Cr,V) elements may give microstructures with improved mechanical properties and reduced densities.Reference Senkov, Senkova and Woodward46–Reference Senkov, Isheim, Seidman and Pilchak48,Reference Senkov, Jensen, Pilchak, Miracle and Fraser51 This is shown for AlMo0.5NbTa0.5TiZr, which has a duplex microstructure that is a BCC-based analogy to the FCC-based microstructures in conventional Ni-based superalloys.Reference Senkov, Isheim, Seidman and Pilchak48,Reference Jensen, Welk, Williams, Sosa, Huber, Senkov, Viswanathan and Fraser49,Reference Senkov, Jensen, Pilchak, Miracle and Fraser51 This alloy retains very high compressive yield strengths of 1597 MPa at 800 °C and 750 MPa at 1000 °C due to the coherent, BCC (β), disordered nanoprecipitates in an ordered B2 (β′) matrixReference Senkov, Isheim, Seidman and Pilchak48,Reference Jensen, Welk, Williams, Sosa, Huber, Senkov, Viswanathan and Fraser49,Reference Senkov, Jensen, Pilchak, Miracle and Fraser51 (Fig. 6). The nanoscale two-phase structure displays good thermal stability.Reference Senkov, Woodward and Miracle47,Reference Senkov, Isheim, Seidman and Pilchak48 The strength drops significantly above 1000 °C due to the inversion of continuous and discontinuous phases, but the alloy still has a σY of 250 MPa at 1200 °C. Forming a disordered BCC matrix phase and discontinuous B2 precipitates during high temperature deformation improves the low-temperature ductility of these alloys. Related compositions (Al0.5Mo0.5NbTa0.5TiZr and Al0.25NbTa0.5TiZr) are currently under consideration to maintain attractive properties in extreme thermal conditions.Reference Senkov, Jensen, Pilchak, Miracle and Fraser51
Table II lists 37 RCCAs/RHEAs for which compression properties at 1000 °C have been reported. The respective references, the σy values at RT  $\hbox( {\sigma _{\rm{y}}^{25^\circ {\rm{C}}}} \hbox)$ and 1000 °C
 $\hbox( {\sigma _{\rm{y}}^{1000^\circ {\rm{C}}}} \hbox)$, as well as the alloy condition, density, and phase composition, are also given in Table II. All the alloys are in the annealed or HIP + annealed conditions, 19 of them are single-phase [BCC (17) or B2 (2)] structures, 16 alloys contain 2 phases, and 2 alloys contain 3 phases. The density of single-phase RCCAs is in the range of 5.5–13.6 g/cm3 and that of multiphase RCCAs is in the range of 5.7–8.6 g/cm3. The reported
 $\sigma _{\rm{y}}^{1000^\circ {\rm{C}}}$ are in the range from 40 to 935 MPa for the single-phase RCCAs and from 58 to 745 MPa for the multiphase RCCAs. Among 5 single-phase RCCAs with
 $\sigma _{\rm{y}}^{1000^\circ {\rm{C}}}$ > 745 MPa, only one (AlMo0.5NbTa0.5TiZr0.5) is ordered B2, while others are disordered BCC. Among the RCCAs with
 $\sigma _{\rm{y}}^{1000^\circ {\rm{C}}}$ > 500 MPa, 11 are 1-phase alloys and only 6 are 2- or 3-phase alloys. These results indicate that achieving high strengths at high temperatures in RCCAs does not necessarily require multiphase structures. SSS probably plays a primary role in these alloys at high temperatures, at least at 1000 °C. Such behavior of RCCAs is quite different from Ni-based superalloys for which high-temperature strength is mainly controlled by second-phase precipitates. The possibility of single-phase, solid solution high temperature structural materials can significantly simplify alloy design. As a caution, the microstructures of the multiphase alloys in this analysis have not been optimized for high temperature strength, and so future studies to develop both single-phase solid solution alloys as well as particulate-strengthened RCCAs are both recommended.
RHEAs for which the yield stress at 1000 °C is reported. The alloy condition (annealed, A, or hot isostatically pressed plus annealed, HIP + A), phases, and the yield stress values at 25 °C  $\left( {\sigma _{\rm{y}}^{25^\circ {\rm{C}}}} \right)$ and 1000 °C
 $\left( {\sigma _{\rm{y}}^{1000^\circ {\rm{C}}}} \right)$ are given.

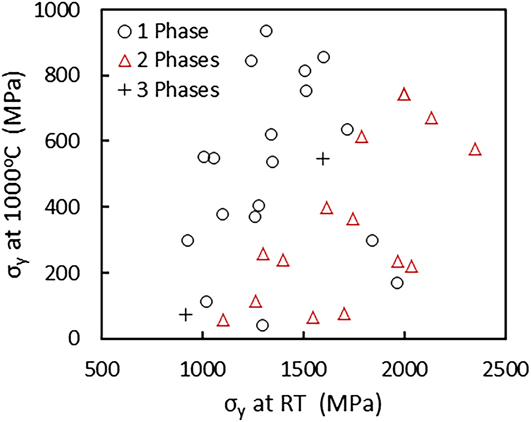
No correlation is found between  $\sigma _{\rm{y}}^{1000^\circ {\rm{C}}}$ and
 $\sigma _{\rm{y}}^{25^\circ {\rm{C}}}$ for RCCAs given in Table II. This can be clearly seen when
 $\sigma _{\rm{y}}^{1000^\circ {\rm{C}}}$ are plotted against respective
 $\sigma _{\rm{y}}^{25^\circ {\rm{C}}}$ values (Fig. 9). Indeed, different RCCAs with similar
 $\sigma _{\rm{y}}^{25^\circ {\rm{C}}}$ values can have quite different
 $\sigma _{\rm{y}}^{1000^\circ {\rm{C}}}$ values. For example, AlCr0.5NbTiV, AlNb1.5Ta0.5Ti1.5Zr0.5, and MoNbTaVW have nearly the same
 $\sigma _{\rm{y}}^{25^\circ {\rm{C}}}$ (1300 MPa, 1280 MPa, and 1246 MPa, respectively) but very different
 $\sigma _{\rm{y}}^{1000^\circ {\rm{C}}}$ (40, 403, and 842 MPa). The 2- and 3-phase RCCAs generally have higher RT strength than the 1-phase RCCAs; however, the advantage is lost at 1000 °C (Fig. 9). Moreover, a multiphase RCCA with the same
 $\sigma _{\rm{y}}^{25^\circ {\rm{C}}}$ as a single-phase RCCA generally has a considerably smaller
 $\sigma _{\rm{y}}^{1000^\circ {\rm{C}}}$ than the respective single-phase RCCA. This observation suggests that the yield strength of multiphase RCCAs drops more quickly with increasing temperature than does the yield strength of single-phase, solid solution RCCAs. The finding that RCCAs having high strength at RT do not necessarily also have high strength at high temperatures (1000 °C in this case) is crucial for the design of high-temperature RCCAs. This finding indicates that information on RT properties is not sufficient for the selection of an RCCA for high temperature application, as an RCCA with high strength at RT is not necessarily strong at 1000 °C. The relationships between the composition, microstructure, and high-temperature mechanical properties need to be established, which can be quite different from the relationships acquired at RT.
Comparison of the compressive yield stresses σ0.2 at 1000 °C and at 25 °C (RT) for RHEAs given in Table II.

3. Mechanical behavior in extreme conditions (T > 1200 °C)
The only two RHEAs studied above 1200 °C are MoNbTaW and MoNbTaVW, initially reported in the pioneering work on RCCAs.Reference Butler, Chaput, Dietrich and Senkov43 Both retain high compression yield stress (421–506 MPa for MoNbTaW and 656–735 MPa for MoNbTaVW in the 1400–1600 °C range). Strong resistance to strain softening is observed in NbMoTaW, which retains steady state flow to 1600 °C,Reference Senkov, Wilks, Scott and Miracle7 but MoNbTaVW shows strain softening above 1200 °C. The initial dendritic structure is retained after deformation and grain boundary sliding seems to be responsible for void formation.
B. Discussion of the nature of strengthening and deformation mechanisms
1. Strengthening mechanisms
SSS is expected to have a major impact on RHEA mechanical properties due to compositional complexity of these alloys. SSS in HEAs may be associated with the presence of elements with different atomic sizes, moduli, and chemical interactions. SSS of metallic solid solutions arises from the elastic interactions between the local stress fields of dislocations and solute atoms.Reference Labusch93–Reference Suzuki95 The interaction force, F, increases with both the atomic size misfit parameter, δa = (1/a)da/dc, and the modulus misfit parameter, δµ = (1/µ)dµ/dc, of the solute and solvent elements:
 $$F = \mu {b^2}\delta = \mu {b^2}\left( {{\delta _\mu } + \beta {\delta _{\rm{a}}}} \right)\quad .$$
Here µ is the shear modulus of the alloy, b is the magnitude of the Burgers vector, a is the lattice parameter, c is the solute atom fraction, and β is a constant, which is in the range from 2 to 4 for screw dislocations and ≥16 for edge dislocations.Reference Gypen and Deruyttere94 For a concentrated solid solution, the solute-induced stress increase, Δσ, can be expressed asReference Labusch93,Reference Gypen and Deruyttere94
 $$\Delta \sigma = A{b^{ - 2}}{F^{{4 / 3}}}{c^{{2 / 3}}}{\left( {2{E_{\rm{L}}}} \right)^{{{ - 1} / 3}}} = A\mu {\delta ^{{4 / 3}}}{c^{{2 / 3}}}\quad .$$
Here E L = µb 2/2 is the dislocation line tension and A is a dimensionless constant, which is of order of 0.1. Equation (2) was initially developed by LabuschReference Labusch93 for binary solid solutions in which the concentration of the solvent exceeds 60–70%. Nevertheless, with some modifications, it has recently been successfully applied to CCAs/HEAs.Reference Senkov, Scott, Senkova, Miracle and Woodward8,Reference Yao, Qiao, Hawk, Zhou, Chen and Gao75,Reference Toda-Caraballo and Rivera-Diaz-Del-Castillo96
The first SSS model for RHEAs was proposed in 2011 by Senkov et al.Reference Senkov, Scott, Senkova, Miracle and Woodward8 and applied to HfNbTaTiZr. The modified Labusch approachReference Labusch93 given in Eq. (2) was used and the misfit parameters δa and δµ were calculated by averaging nearest-neighbor atom interactions. The local environment around each element in a solid solution RHEA was estimated by assuming that the local concentrations are equal to the average concentration of the alloy. Then, for the BCC solid solution, δai and δµi (per atom pair) in the vicinity of an element i can be calculated asReference Senkov, Scott, Senkova, Miracle and Woodward8
 $${\delta _{{\rm{a}}i}} = {9 \over 8}\sum {{c_j}{\delta _{{\rm{a}}ij}}} \quad .$$
 $${\delta _{\mu i}} = {9 \over 8}\sum {{c_j}{\delta _{\mu ij}}} \quad .$$
Here c j is the atomic fraction of an element j in the alloy, 9 is the number of atoms in the i-centered polyhedron in the BCC lattice, 8 is the number of atoms neighboring with the center atom i, δaij = 2(r i − r j)/(r i + r j), and δGij = 2(µi − µj)/(µi + µj). By comparing δai and δµi in the vicinity of each alloying element, Senkov et al.Reference Senkov, Scott, Senkova, Miracle and Woodward8 showed that in HfNbTaTiZr, the atomic size misfit δa was mainly due to interactions of Hf and Zr with three other elements, while the shear modulus misfit was mainly due to interactions of Ta with other alloying elements. The analysis revealed that distortions due to the modulus effects were the strongest obstacles to dislocation motion in HfNbTaTiZr: the contributions from the atomic size and modulus misfits were estimated to be 221 and 647 MPa, respectively. The yield stress was predicted to be 1094 MPa,Reference Senkov, Scott, Senkova, Miracle and Woodward8 in good agreement with the experimental values for HfNbTaTiZr.Reference Senkov, Scott, Senkova, Miracle and Woodward8,Reference Senkov, Scott, Senkova, Meisenkothen, Miracle and Woodward9,Reference Senkov and Semiatin11,Reference Juan, Tsai, Tsai, Hsu, Lin, Chen, Lin and Yeh14
Using the SSS model developed by Senkov et al.Reference Senkov, Scott, Senkova, Miracle and Woodward8 for RHEAs, Yao et al.Reference Yao, Qiao, Hawk, Zhou, Chen and Gao75 calculated RT yield stress and Vickers hardness for 14 equiatomic RHEAs. Equation (2) was used to calculate strengthening contribution Δσi from an alloying element i that has the atomic fraction c i and atomic size and modulus misfits defined by Eqs. (3a) and (3b). The SSS contribution of an alloy was obtained by summation over Δσi:  $\Delta \sigma = {\left( {\sum {\Delta \sigma _i^{{3 / 2}}} } \right)^{{2 / 3}}}$.Reference Yao, Qiao, Hawk, Zhou, Chen and Gao75 The calculated yield stress and hardness values were in satisfactory agreement with the respective experimental values (Table III).
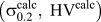
Calculated  $\left( {\sigma _{0.2}^{{\rm{calc}}},\;{\rm{H}}{{\rm{V}}^{{\rm{calc}}}}} \right)$ and experimental
 $\left( {\sigma _{0.2}^{\exp },\;{\rm{H}}{{\rm{V}}^{\exp }}} \right)$ RT yield stress and Vickers hardness values for several single-phase BCC RHEAs. The calculations were conducted by Yao et al.Reference Yao, Qiao, Hawk, Zhou, Chen and Gao75 using an RHEA SSS model developed by Senkov et al.Reference Senkov, Scott, Senkova, Miracle and Woodward8 The relationship
 ${\rm{H}}{{\rm{V}}^{{\rm{calc}}}} = 0.3\sigma _{0.2}^{{\rm{calc}}}$ was used to calculate HVcalc. The experimental data were taken from the provided references. The alloy condition (as-cast or annealed) is also shown.

A modified Labusch approach was also used by Toda-Caraballo and Rivera-Diaz-CastilloReference Toda-Caraballo and Rivera-Diaz-Del-Castillo96 to model solid solution hardening in HEAs and the relationship similar to Eq. (2) was derived. Interatomic spacing and elastic modulus misfits in HEAs were computed using Mooren’s approach.Reference Mooren, Taggart and Polonis97 The model was successfully used to predict solution strengthening in several TM HEAs.Reference Toda-Caraballo and Rivera-Diaz-Del-Castillo96 The modified Labush approach, Eq. (2), was also successfully used to explain the hardening effect of Ti additions in MoNbTaW and MoNbTaVW.Reference Han, Chen, Zhao, Fan, Yang, Shao and Yao27,Reference Han, Luan, Liu, Chen, Li, Shao and Yao30
Another approach to model SSS in HEAs is to consider the atomic size difference as quantified by the parameter δr:
 $${\delta _{\rm{r}}} = \sqrt {\sum\limits_{i = 1}^N {{c_i}{{\left( {1 - {{{r_i}} \over {\bar{r}}}} \right)}^2}} } \quad ,$$
with c i being the atomic fraction of the ith element, r i being the atomic radius of element i, and  $\bar{r}$ being the composition-weighted average atomic radius. Few studies attempt to relate SSS and δr in RHEAs. In AlCrxMoNbyTi (0 < x < 1; 0 < y < 1), a linear correlation is found between δr and RT microhardness.Reference Chen, Kauffmann, Laube, Choi, Schwaiger, Huang, Lichtenberg, Muller, Gorr, Christ and Heilmaier92 As shear moduli do not change significantly with composition, the modulus effect is minimized in this system, and the authors suggest that the size effect alone can explain the evolution of hardness with δr. It is worth noting that even if an added alloying element has only small effect on the global alloy moduli, strengthening might still be produced by local modulus mismatch between neighbor atoms due to large elastic modulus difference of alloying elements in RHEAs.Reference Senkov, Scott, Senkova, Miracle and Woodward8,Reference Juan, Tseng, Hsu, Tsai, Tsai, Lin, Chen, Lin and Yeh21,Reference Lilensten, Couzinie, Perriere, Hocini, Keller, Dirras and Guillot25,Reference Yao, Qiao, Gao, Hawk, Ma and Zhou98 For example, the shear modulus of Cr (115 GPa) or Mo (120 GPa) is much higher than the shear modulus of Al (26 GPa), Nb (38 GPa), or Ti (44 GPa).
Some studies propose a simplified expression for the increment of yield stress by a simple power law:
 $$\Delta \sigma = B\mu {c^n}\quad ,$$
with B being a constant and n being the exponent (0 < n < 1). No physical explanations have been proposed for this dependence, except those discussed above.Reference Senkov, Scott, Senkova, Miracle and Woodward8,Reference Toda-Caraballo and Rivera-Diaz-Del-Castillo96 Equation (5) has successfully been used for HfMoxNbTaTiZr (0 < x < 1) alloys deformed at RT,Reference Juan, Tseng, Hsu, Tsai, Tsai, Lin, Chen, Lin and Yeh21 where a linear dependence of the σY increment on the atom fraction of Mo is identified: Δσ = 2921c (MPa). A similar linear dependence of Δσ on c is also reported for single-phase MoxNbTiVZrReference Wu, Cai, Chen, Wang, Si, Wang, Wang and Hui45 and AlxHfNbTaTiZrReference Lin, Juan, Chang, Tsai and Yeh12 deformed at RT. In the B2-ordered AlNbTiVZrx, a good fit is obtained between Δσ and the Zr concentration at 20 and 600 °C for n = 1/2 and c Zr < 10 at.%.Reference Yurchenko, Stepanov, Zherebtsov, Tikhonovsky and Salishchev68 A weakening of solid solution hardening by Zr observed for AlNbTiVZrx with increasing temperature (from 20 to 600 °C) is probably due to a decrease in the shear modulus [Eq. (5)]. The modulus can also depend on composition, as shown by first principles calculations in AlxNbTiVZr, where increasing Al increases the elastic moduli.Reference Qiu, Miao, Zhou, Guo and Sun99 The simulations indicate that Al-induced elastic strengthening is triggered by the stronger angular bonds in the presence of Al and not particularly by atomic size or modulus mismatches between Al and other alloying elements.
The dependence of SSS on concentration is shown by exponents that range from 0.5 to 1 in the studies cited above. These compare with a value of 0.5 for traditional SSS in dilute solutions,Reference Hirth and Lothe100 showing more potent hardening in concentrated alloys. In all the approaches described above, thermally activated processes are not taken into account. According to Eqs. (2) and (5), temperature effects on solution strengthening come from the temperature dependence of the misfit parameter δ and alloy shear modulus μ.
Interstitial strengthening can also impact the mechanical behavior of RHEAs. Such an effect is proposed in MoNbTaVW produced by mechanical alloying of elemental powders followed by SPS.Reference Kang, Lee, Ryu and Hong39 The microstructure of the sample sintered at 1500 °C consists of a homogeneous BCC matrix with a grain size of 5.3 μm and small amount of Ta2VO6-based oxide inclusions originated from oxidation during the PM process. Noticeable amount of carbon (1.12 at.%) is also detected inside the BCC matrix. The sintered sample has a high compressive yield stress of 2612 MPa and a compressive ductility of 8.8%. The reported properties are significantly better than those (1246 MPa, 1.7%) obtained in the same alloy produced by arc melting.Reference Senkov, Wilks, Scott and Miracle7 The ultrahigh strength of the SPS alloy is explained by the operation of four strengthening mechanisms: substitutional SSS, which also includes lattice frictional strength, (contributed ∼42–46% to the total strength); SSS by interstitial elements (29–33%), grain-boundary strengthening (24%), and Orowan strengthening by oxide inclusions (1%). The authors evaluate interstitial strengthening in this alloy using a classical concentration dependence (∼c 1/2 or ∼c 2/3) and by deducing quantities of interest relating to grain boundaries, lattice friction, and other relevant phenomena by comparing the strengths of the SPS and cast samples. The authors make three assumptions: lattice friction (or intrinsic strength)Reference Kang, Lee, Ryu and Hong39 and solid solution effects are independent of the preparation process; as-solidified MoNbTaVW is considered to be free of interstitial elements; and only C atoms contribute to interstitial strengthening in the powder processed material. The basic assumptions and modeling details in the cited work may require more careful consideration. In particular, the absence of other contaminants in the mechanically alloyed material (such as Fe) and the absence of interstitial elements in the as-cast material were not confirmed. This introduces uncertainty in this analysis since interstitial contamination is difficult to suppress in refractory alloys (especially those containing Nb, Ta, Ti, and Zr) and can have an important effect on strength, even at levels far less than those in the SPS material described above. Interstitial contamination is rarely measured in RCCAs, making it difficult to compare results in different alloys or in the same alloy produced by different methods since different levels of interstitial contamination may be present and, if not accounted for, can contribute to confusing or contradictory results. In fact, interstitial contamination may also influence the solid solution hardening analyses described above. From the discussion above, interstitial contamination and hardening is an important topic, and future work to evaluate its presence and effects in RCCAs is suggested.
Precipitation strengthening is a key strengthening mechanism at high temperatures where SSS weakens. It is therefore proposed that the high-temperature strength of RCCAs can be considerably improved by designing multiphase structures and thermomechanical processes resulting in precipitation of fine, thermally stable second-phase particles. Multiphase RCCAs often consist of a disordered BCC matrix with ordered compounds. Laves phases in alloys with Cr, Mo, and/or V strengthen RCCAs but the alloys are frequently brittle since the precipitation size and volume fraction have not been appropriately controlled.Reference Senkov, Senkova, Woodward and Miracle40,Reference Stepanov, Yurchenko, Panina, Tikhonovsky and Zherebtsov65,Reference Stepanov, Yurchenko, Skibin, Tikhonovsky and Salishchev84 The same trend is seen after aging of disordered, ductile solid solutions such as HfNbTaTiZr,Reference Senkov and Semiatin11,Reference Stepanov, Yurchenko, Zherebtsov, Tikhonovsky and Salishchev15,Reference Schuh, Volker, Todt, Schell, Perriere, Li, Couzinie and Hohenwarter24 where hardening is limited due to the presence of incoherent phases. Second phase strengthening occurs in RHEAs reinforced by carbidesReference Guo, Wang, Luo, Li, Chen, Su, Guo and Fu80 as well as in alloys for which large silicides are formed.Reference Zhang, Liu, Li, Chen and Zhang81,Reference Liu, Zhang, Zhang, Wang, Chen, Zhang and Li82 Significant strength increases are observed in HfMo0.5NbTiV0.5Six (x = 0.3, 0.5, 0.7) in comparison to HfMo0.5NbTiV0.5. Reasons for such improved behavior are not clear but probably related to the distribution of large silicide particles in the matrix so that strengthening may come from load-sharing by the (presumably) stiffer silicide particles rather than from dislocation pinning. Efforts to control the volume fraction and the size of silicide precipitates have not been done and are suggested for future work. Finally the mechanical properties of Al–Mo–Nb–Ta–Ti–Zr RHEAs with coherent, nanophase B2/BCC structures attest to the significant potential of such alloys under extreme conditions.Reference Senkov, Woodward and Miracle47–Reference Jensen, Welk, Williams, Sosa, Huber, Senkov, Viswanathan and Fraser49,Reference Senkov, Jensen, Pilchak, Miracle and Fraser51
Grain boundary strengthening has been considered in RHEAs to evaluate the strengthening parameters relative to grain growth and also to the Hall–Petch law.Reference Juan, Tsai, Tsai, Hsu, Lin, Chen, Lin and Yeh14 Using appropriate thermomechanical treatments (cold rolling and subsequent annealing), the evolution of grain size with annealing time and temperature was analyzed for HfNbTaTiZr, giving an activation energy for a grain growth of 389 kJ/mol. Tensile testing on materials with various grain sizes confirmed a Hall–Petch relationship with a strengthening coefficient k = 240 MPa μm0.5.Reference Juan, Tsai, Tsai, Hsu, Lin, Chen, Lin and Yeh14 Grain boundary strengthening leads to exceptional RT yield stress in nanocrystalline RHEAsReference Kang, Lee, Ryu and Hong39 (Fig. 6). The effect was deduced from the differences of yield stresses in specimens made by PM or casting processes.Reference Kang, Lee, Ryu and Hong39 The grain boundary contribution can reach 765 MPa (30% of the yield stress) with the Hall–Petch coefficient falling into the range of 1462–1774 MPa μm0.5.
2. Deformation mechanisms
Only a few reports study the deformation processes in RHEAs. All these studies were conducted on a single phase HfNbTaTiZr alloy at RTReference Senkov, Scott, Senkova, Miracle and Woodward8,Reference Senkov, Scott, Senkova, Meisenkothen, Miracle and Woodward9,Reference Couzinie, Lilensten, Champion, Dirras, Perriere and Guillot18,Reference Dirras, Gubicza, Heczel, Lilensten, Couzinie, Perriere, Guillot and Hocini20,Reference Dirras, Lilensten, Djemia, Laurent-Brocq, Tingaud, Couzinie, Perriere, Chauveau and Guillot23,Reference Lilensten, Couzinie, Perriere, Hocini, Keller, Dirras and Guillot25 by the coupling between mechanical testing and nanoscale analyses of the resulting strained microstructures, and at elevated temperaturesReference Senkov, Scott, Senkova, Meisenkothen, Miracle and Woodward9 through the analysis of the flow stress dependence on strain-rate and temperature, and SEM observations of the deformed samples.
Couzinie et al.Reference Couzinie, Lilensten, Champion, Dirras, Perriere and Guillot18 studied deformation micromechanisms of as-cast HfNbTaTiZr using RT monotonic and relaxation compression tests followed by detailed TEM observations. Three stages of strain hardening were identified. Strain hardening decreased sharply in stage I, until a true plastic strain of approximately 3% is achieved; it stabilized at 1300 ± 50 MPa during stage II, and it decreased again above a true strain of ∼11% resulting in stage III. The measured apparent activation volumes decreased continuously from ∼50b 3 in stage I to ∼40b 3 in stage II and 30b 3 in stage III, where b is the Burgers’ vector. These activation volumes were correlated with Peierls stresses experienced by screw dislocations with b = a/2 〈111〉 in stage I and formation of dislocation bands at later stages (a is the lattice constant).
These results were later confirmed by Lilensten et al.Reference Lilensten, Couzinie, Perriere, Hocini, Keller, Dirras and Guillot25 who studied RT deformation mechanisms of a well homogenized single-phase BCC HfNbTaTiZr using uniaxial tension and simple shear tests coupled with thorough TEM investigations. Tensile samples were extracted from a 65% cold-rolled sheet which was annealed at 1050 °C for 4 h and air-cooled. Simple shear samples were made from ∼78% cold-rolled sheet that was annealed at 1100 °C for 5 h and air-cooled. These heat treatments provided fully recrystallized single-phase BCC structures with the mean grain sizes of ∼30 and 65 μm, respectively. In agreement with the data reported earlier by Couzinie et al.,Reference Couzinie, Lilensten, Champion, Dirras, Perriere and Guillot18 it was found that deformation was controlled by the glide of screw dislocations. The dislocations were rectilinear and had low mobility. The rectilinear aspect of screw dislocations and the reported activation volumes suggest high Peierls stresses in HfNbTaTiZr at RT. The high yield stress of the alloy was linked to the effect of short-distance solid-solution–related obstacles on the gliding dislocations. The effective stress induced by these short-range interactions between dislocations and solid-solution–related obstacles was strain-independent. The strain hardening was mostly due to an increase in the dislocation density and formation of deformation bands acting as long-range obstacles. A similar conclusion was also made by Dirras et al.Reference Dirras, Couque, Lilensten, Heczel, Tingaud, Couzinie, Perriere, Gubicza and Guillot22 to explain strain hardening of HfNbTaTiZr tested under compressive dynamic conditions. The results reported by Couzinie et al.Reference Couzinie, Lilensten, Champion, Dirras, Perriere and Guillot18 and Lilensten et al.Reference Lilensten, Couzinie, Perriere, Hocini, Keller, Dirras and Guillot25 are in good agreement with atomistic simulations by Rao et al.Reference Rao, Varvenne, Woodward, Parthasarathy, Miracle, Senkov and Curtin101 of dislocation configurations and dislocation mobility in a BCC multicomponent concentrated solid solution. According to these simulations, the short distance obstacles can be related to the local concentration fluctuations, which impact the dislocation core configuration and dislocation mobility. Rao et al.Reference Rao, Varvenne, Woodward, Parthasarathy, Miracle, Senkov and Curtin101 mention that contrary to classical BCC metals, the critical resolved shear stress on edge dislocations in RCCAs could be comparable to that for screw dislocations. Analysis of the deformation behavior of HfNbTaTiZr at elevated temperatures suggested solute drag as a strengthening mechanism.Reference Senkov, Scott, Senkova, Meisenkothen, Miracle and Woodward9
V. ENVIRONMENTAL BEHAVIOR
A. Oxidation behavior
Poor high-temperature oxidation resistance is a primary limitation of widespread implementation of commercial refractory alloys and requires them to be “prime-reliant” on environmental barrier coatings (if the coating fails, the part fails). The RCCA strategy offers the opportunity to deliver increased oxidation resistance through high concentrations of alloying elements beneficial to environmental resistance. By the end of January 2018, oxidation behaviors of 20 RCCAs were reported (Table IV). In the majority of these efforts, the focus was to evaluate compositions that combine high melting point elements (Hf, Mo, Nb Ta, W, and Zr) for thermal stability and high temperature strength with elements beneficial for oxidation resistance (Al, Cr, Ti, and Si). Oxidation behaviors were studied from 700 to 1300 °C, with the majority of the tests conducted at 1000, 1100, and 1300 °C (Fig. 10a). No measureable oxidation was noted at T ≤ 600 °C.Reference Gorr, Azim, Christ, Mueller, Schliephake and Heilmaier102–Reference Senkov106 The compositions of the studied RHEAs, initial processing/microstructural conditions, oxidation test temperatures, and characteristics of the oxidation behavior are summarized in Table IV. These initial results show that RCCAs exhibit a wide range of oxidation kinetics and have the potential to deliver far superior oxidation resistance compared to commercial refractory alloys (Fig. 10).
RHEAs which oxidation behavior has been reported in the open literature. The respective references, alloy initial processing condition and phase content, oxidation temperature, oxidation products, mass change, and oxidation time are given here.

(a) Number of reported oxidation tests of RHEAs conducted at different temperatures. (b–d) Oxidation behavior (mass change per unit surface area versus oxidation time) of selected RHEAs at (b and c) 1000 °C and (d) 1300 °C: (b) AlCrMoTiW, AlCrMoTiNb, AlCrMoTiNb + 1% Si, and AlCrMoTiTaReference Gorr, Azim, Christ, Mueller, Schliephake and Heilmaier102–Reference Gorr, Muller, Azim, Christ, Muller, Chen, Kauffmann and Heilmaier104; (c) CrMo0.5NbTa0.5TiZr,Reference Senkov, Senkova, Dimiduk, Woodward and Miracle69 NbTiZrV and NbTiZrCr,Reference Butler, Chaput, Dietrich and Senkov43 and Al2Nb3TaTi3ZrReference Senkov106; (d) Al0.5CrMoNbV, Al0.5CrMoNbTiV, Al0.5CrMoNbTiVSi0.3, and Al0.5CrMoNbTa.Reference Liu, Wang, Zhang, Tang and Zhang107 Oxidation behavior of a commercial Nb alloy C103 is shown in (c) for comparison.

Gorr et al.Reference Gorr, Azim, Christ, Mueller, Schliephake and Heilmaier102–Reference Gorr, Muller, Azim, Christ, Muller, Chen, Kauffmann and Heilmaier104 have reported the most oxidation resistant RHEAs [Fig. 10(b)]. They evaluated the oxidation behaviors of three equiatomic AlCrMoTi-X RCCAs where (X = Nb, W, or Ta), as well as AlCrMoTiNb with additions of 1 at.% Si, with the intent to deliver an alloy with a balance of high-strength and high oxidation resistance. Oxidation experiments with exposure times up to 48 h were conducted in air at 900–1100 °C using 2-mm thick plates. All five of these alloys demonstrated significantly lower specific mass gains (<10 mg/cm2 after 48 h oxidation in air) in comparison to commercial refractory alloys (a linear mass gain at ∼100 mg/cm2 per hour), as well as other reported RHEAs [Figs. 10(b)–10(d) and Table IV]. AlCrMoTiNb and AlCrMoTiW showed “moderate” specific mass gain, and AlCrMoTiNb did not adhere to parabolic kinetics at 1000 or 1100 °C up to 48 h of oxidation. By contrast, the Ta-containing alloy displayed the lowest specific mass gain (on the order of Cr2O3-formers) and was reported to obey parabolic oxidation kinetics to 48 hReference Gorr, Muller, Azim, Christ, Muller, Chen, Kauffmann and Heilmaier104 [Fig. 10(b)]. A complex oxide scale consisting of an outermost TiO2, intermediate Al2O3, and (Cr, Ta, and Ti)-rich oxide at the oxide/substrate interface formed in AlCrMoTiTa. Small additions of Si noticeably improved oxidation resistance of AlCrMoTiNb,Reference Gorr, Mueller, Christ, Mueller, Chen, Kauffmann and Heilmaier103 although no silicon oxide layer formed. Supporting these reduced oxidation kinetics, the alloys tested by Gorr et al. all contain ∼40 at.% of the protective oxide-forming elements, Al and Cr. Although many oxide phases are generally formed on these samples, several samples contain Al2O3, Cr2O3, or both. All the alloys tested by other researchers have lower combined Al + Cr concentrations.
The oxidation rates of all other reported RHEAsReference Butler, Chaput, Dietrich and Senkov43,Reference Senkov, Senkova, Dimiduk, Woodward and Miracle69,Reference Chang, Titus and Yeh105,Reference Liu, Wang, Zhang, Tang and Zhang107,Reference Zheng, Hou, Wang, Meng, Zheng and Zheng108 are about one order of magnitude higher than those reported by Gorr et al.,Reference Gorr, Azim, Christ, Mueller, Schliephake and Heilmaier102–Reference Gorr, Muller, Azim, Christ, Muller, Chen, Kauffmann and Heilmaier104 but their oxidation resistance is still noticeably better than commercial refractory alloys (Fig. 10 and Table IV). All these RHEAs tend to form complex oxide mixtures. The complexity of the oxide scales highlights the fact that RHEAs are intrinsically different than conventional refractory alloys due to the concentrated nature of these systems. Different complex oxides can provide quite different protective level against oxidation. For example, while formation of NbCrO4 slows oxidation, formation of CrVNbO6, Nb9VO25, and TiNb2O7 do not improve oxidation resistance of AlCrHfMoNbTiVW.Reference Zheng, Hou, Wang, Meng, Zheng and Zheng108 Oxidation of Al0.5CrMoNbV, Al0.5CrMoNbTiV, Al0.5CrMoNbTiVSi0.3, and Al0.5CrMoNbTi RHEAs [Fig. 10(d)] resulted in the formation of many complex oxides including (TiCrNbV)O2, CrVNbO5, NbCrO4, and (TiCrNb)O2, among which the last one provides the best oxidation resistance.Reference Liu, Wang, Zhang, Tang and Zhang107 It can be noticed that V as an alloying element considerably reduces while Cr, Al, and Ti improve oxidation resistance of RHEAsReference Butler, Chaput, Dietrich and Senkov43,Reference Liu, Wang, Zhang, Tang and Zhang107 [Figs. 9(c) and 9(d)]. These results indicate the importance of selecting alloying elements and their combinations to form protective oxide scales. These initial efforts also highlight the need for a better alloy design methodology to deliver increased oxidation resistance since the current approaches lead to a wide range of oxidation performance. To exploit these systems and balance high temperature strength and oxidation resistance, more foundational work is required.
Limited work has been done to develop a fundamental understanding of the oxidation behaviors of these systems. A systematic exploration of the fundamental oxidation mechanisms in RCCAs has recently been performed in equimolar NbTiZrV and NbTiZrCr by Butler et al.Reference Butler, Chaput, Dietrich and Senkov43 These alloys were selected since they contain elements common to other previously evaluated RCCAs and those used in dilute concentrations in conventional refractory alloys. It was determined that these alloys exhibited a strong preference for internal oxidation, which is also a common observation in many uncoated, commercially available refractory alloys. Typically, this behavior is associated with rapid oxidation kinetics, which was observed in the V containing alloy. However, while the Cr-containing alloy exhibited a similar mechanism of internal oxidation, the nature of the internal oxide mixture promoted a favorable transition from linear kinetics to “sluggish” parabolic kinetics [Fig. 10(c)]. This transition did not rely on the formation of a protective external Cr2O3 scale; rather, it corresponded to the formation of a discontinuous, mixed internal scale with high concentrations of complex oxides (e.g., NbCrO4) not commonly observed in dilute refractory alloys. These observations are supported by Mayo et al.Reference Mayo, Shepherd and Thomas109 on a Nb–Cr binary alloy that showed favorable oxidation kinetics due to the formation of NbCrO4, as opposed to rapid formation of Nb2O5. Butler et al.Reference Butler, Chaput, Dietrich and Senkov43 conducted thermodynamic analyses of the stability of different oxides to better understand the observed RCCA oxide products. Due to the internal nature of oxidation, the first oxides to form at the internal oxidation front can be reasonably predicted as those with the lowest Gibbs free energies for molar oxide formation. This information was correlated with existing oxidation data on relevant, concentrated binary and ternary alloy systems to predict 100 h oxide scales. Fundamentally, this demonstrates the usefulness of simple thermodynamics in the pursuit of understanding these complicated oxidation processes.
Pesting is a well-described phenomenon that leads to unfavorable oxidation kinetics in many refractory-based intermetallics (IMs) (e.g., MoSi2 and NbSi2).Reference Kofstad110–Reference Westbrook and Wood112 This is typically categorized by rapid oxygen penetration via grain boundary diffusion at intermediate temperatures that leads to catastrophic failures. This behavior differs from more favorable oxidation mechanisms where external scales are formed on the free surface of the metal and continue to grow via bulk ion transport mechanisms. Recent work by Chang et al.Reference Chang, Titus and Yeh105 is the first published study that begins to explore concepts similar to pesting in RCCAs. They reported that increasing the Al content in AlxHfNbTaTiZr reduces the oxidation rate at both 700 and 900 °C but is ultimately less effective at 1100 and 1300 °C. With no Al (x = 0), it was reported that exposure at 700 and 900 °C displayed rapid oxidation kinetics with some powder formation and was termed a “partial pest” phenomenon. Although the final oxide product resembled to some degree what is characteristically produced during traditional pesting, some caution is needed with this assignment. Pesting is classically considered to occur exclusively in IM compounds,Reference Westbrook and Wood112 but AlxHfNbTaTiZr alloys (0 ≤ x ≤ 1) are all reported to be single-phase, disordered BCC structures (Tables I and IV). An alternative explanation of the reported behavior could be that transient oxides form rapidly at intermediate temperatures and quickly spall from the surface. This could lead to a spalled powder oxide product and cause accelerated oxidation kinetics due to the exposure of new metal free surface. Increasing the Al content in AlxHfNbTaTiZr (x > 0) was found to decrease the rate of attack at 700 and 900 °C,Reference Chang, Titus and Yeh105 and this could occur by stabilizing oxides with improved surface adhesion and reduced oxidation kinetics. This behavior has been reported earlier for Ni–Cr–Al alloys oxidized with various Al and Cr contents at different temperatures.Reference Giggins and Pettit113 In that work, it was reported that increasing Al content promotes more stable oxides that increased oxidation resistance, as opposed to Al-lean alloys that were hypothesized to form less protective mixed oxides. However, the distinct oxides that formed in each case were not reported. More detailed studies are recommended to distinguish the mechanisms responsible for the rapid oxidation of AlxHfNbTaTiZr at intermediate temperatures.
A large amount of fundamental work is required to understand the oxidation behavior of RCCAs. For example, the effects of different alloying elements, as well as their combinations, on the mechanism of formation of protective complex oxides, relevant elemental activities, and the rate of internal oxidation need to be studied in detail. The origin and degree of the oxidation protection by different complex oxides need to be studied. To better understand which complex oxides are protective, it is crucial to gain a better understanding of the respective chemical bonding, atomic ordering, and defect structures of these oxides. We also need to understand the influence of oxygen ingress on the resulting mechanical response of RCCAs. The effect of microstructure on the oxidation behavior of RHEAs has not been studied at all. Grain size, chemical composition, volume fraction, and distribution of secondary phases may have large implications on the resulting oxidation behaviors of these alloy systems.
B. Corrosion behavior
Only a few corrosion studies of RHEAs have been reported. Jayaraj et al.Reference Jayaraj, Thinaharan, Ningshen, Mallika and Kamachi Mudali16 studied the corrosion behavior of HfNbTaTiZr in nitric and fluorinated nitric acids at 27 and 120 °C. The alloy passivated spontaneously during potentiodynamic polarization in 11.5 M HNO3 and in 11.5 M HNO3 + 0.05 M NaF at 27 °C. The corrosion rate was also negligible during exposure in boiling (120 °C) 11.5 M HNO3 for 240 h and SEM studies did not show any noticeable corrosion attack. X-ray photoelectron spectroscopy (XPS) analysis revealed the formation of a protective passive film consisting of Ta2O5 in contrast to the air-formed native film consisting of ZrO2 and HfO2. HfNbTaTiZr severely corroded in boiling fluorinated nitric acid (at 120 °C). XPS showed that the nonprotective surface film consisted of ZrF4, ZrOF2, and HfF4 along with oxides containing Ta, Nb, and Ti.
Wang and XuReference Wang and Xu73 explored the possibility of using a MoNbTaTiZr RHEA for orthopedic implants. A phosphate buffer solution was used to assess the corrosion resistance of the alloy under simulated physiological environment at 37 °C. The corrosion behavior was compared with that of Ti6Al4V, 316L SS, and Co28Cr6Mo commercial alloys. MoNbTaTiZr showed excellent corrosion resistance comparable to Ti6Al4V, with no evidence of pitting. The corrosion behavior was superior to the 316L SS and CoCrMo alloys.
VI. WEAR BEHAVIOR
The friction and wear behaviors of MoNbTaVW,Reference Poulia, Georgatis, Lekatou and Karantzalis38,Reference Poulia, Georgatis, Lekatou and Karantzalis114 MoNbTaTiZr,Reference Mathiou, Poulia, Georgatis and Karantzalis115 and HfNbTiZrReference Ye, Liu, Wang and Nieh116 RHEAs and (HfNbTaTiVZr)N,Reference Grigoriev, Sobol, Beresnev, Serdyuk, Pogrebnyak, Kolesnikov and Nemchenko117 (HfNbTaTiZr)N,Reference Braic, Balaceanu, Braic, Viadescu, Panseri and Russo118 and (HfNbTaTiZr)CReference Braic, Balaceanu, Braic, Viadescu, Panseri and Russo118 RHEA nitride and carbide coatings have been studied using ball-on-diskReference Poulia, Georgatis, Lekatou and Karantzalis38,Reference Poulia, Georgatis, Lekatou and Karantzalis114,Reference Mathiou, Poulia, Georgatis and Karantzalis115,Reference Grigoriev, Sobol, Beresnev, Serdyuk, Pogrebnyak, Kolesnikov and Nemchenko117,Reference Braic, Balaceanu, Braic, Viadescu, Panseri and Russo118 or nanoscratchReference Ye, Liu, Wang and Nieh116 methods. All these materials show very high hardness, giving wear resistance superior to a commercial superalloy,Reference Poulia, Georgatis, Lekatou and Karantzalis38,Reference Poulia, Georgatis, Lekatou and Karantzalis114 refractory metals and alloys,Reference Ye, Liu, Wang and Nieh116 and tool steel.Reference Grigoriev, Sobol, Beresnev, Serdyuk, Pogrebnyak, Kolesnikov and Nemchenko117
Poulia et al.Reference Poulia, Georgatis, Lekatou and Karantzalis38,Reference Poulia, Georgatis, Lekatou and Karantzalis114 studied dry-sliding wear of a single-phase BCC MoNbTaVW using a ball-on-disk configuration with a 6 mm diameter 100Cr6 steel or Al2O3 ball, an applied normal load of 5 N, and a sliding speed of 0.1 m/s. Significantly improved wear response of MoNbTaVW, relative to Inconel 718 (well known for its high wear resistance), was observed. Friction against the steel ball led to a higher wear rate compared to the alumina ball. With the steel ball, the wear rates were K ≈ 2.1–2.3 × 10⁻⁴ cm3/(N m) and 8.3 × 10⁻⁴ cm3/(N m) for MoNbTaVW and IN718, respectively. When the alumina ball was used, the wear rates were 1.5 × 10⁻⁴ cm3/(N m) and 4.7 × 10⁻⁴ mm3/(N m), respectively, for these alloys. The coefficient of friction (COF) of MoNbTaVW–100Cr6 and MoNbTaVW–Al2O3 pairs was ∼0.7 and 0.5, respectively. The stronger wear by the steel ball was attributed to (i) limiting formation of Fe oxides due to the presence of Mo, which is a strong de-oxidizer in the alloy and (ii) formation of cracks and material delamination on the worn sample surface. Aluminum oxide nanoparticles produced from the alumina ball acted as a lubricant and slowed the alloys’ wear.
Mathiou et al.Reference Mathiou, Poulia, Georgatis and Karantzalis115 studied dry-sliding wear behavior of MoNbTaTiZr using the ball-on-disc configuration with experimental parameters similar to those in Refs. Reference Poulia, Georgatis, Lekatou and Karantzalis38 and Reference Poulia, Georgatis, Lekatou and Karantzalis114. The alloy had a BCC matrix and an HCP secondary phase. When a steel ball was used, the COF and wear rate K were 0.6 and 1.5 × 10⁻⁵ cm3/(N m), respectively. Noticeable wear and flattening of the Al2O3 ball was observed, increasing the contact surface and giving a wear rate of MoNbTaTiZr [K = 1.3 × 10⁻⁴ cm3/(N m)] about one order of magnitude higher compared to the steel ball. The COF of the MoNbTaTiZr–Al2O3 pair was ∼0.72. These results show that the MoNbTaTiZr wear resistance is better than that of MoNbTaVW,Reference Poulia, Georgatis, Lekatou and Karantzalis38,Reference Poulia, Georgatis, Lekatou and Karantzalis114 although the alloys have the same hardness (∼62 ± 1 HRC). The better wear resistance of MoNbTaTiZr was explained by the presence of a harder secondary HCP phase and easier formation of lubricating oxides based on Ti and Zr.
Ye et al.Reference Ye, Liu, Wang and Nieh116 studied the COF and wear rate of a single-phase BCC HfNbTiZr, commercial Nb-based C103 alloy, and pure Nb using a nanoscratch method. HfNbTiZr had ∼43% improved wear resistance and ∼50% smaller COF as compared to C103. The wear rate of HfNbTiZr was proportional to the applied normal force and the wear resistance scaled linearly with the alloy hardness. The normalized wear rates, K, were 1.28 × 10⁻⁵, 1.83 × 10⁻⁵, and 2.49 × 10⁻⁵ cm3/(N m) for HfNbTiZr, C103, and Nb, respectively. The friction behavior of the alloy followed two distinct regimes—elastic and plastic. The COF decreased rapidly with increasing normal force in the elastic regime but became essentially constant (∼0.16) in the plastic regime, indicating a transition of friction mechanism. The COF of C103 and Nb were 0.24 and 0.27, respectively. The better wear resistance and lower COF of HfNbTiZr were attributed to higher hardness-to-strength ratios and smaller plowing and adhesion friction coefficients.
Grigoriev et al.Reference Grigoriev, Sobol, Beresnev, Serdyuk, Pogrebnyak, Kolesnikov and Nemchenko117 studied the tribology properties of (HfNbTaTiVZr)N coatings deposited on a R6M5 (62 HRC) steel using different nitrogen pressures. All coatings were single-phase FCC solid solutions. Coatings produced at a low pressure of 0.09 Pa were textureless and had Vickers hardness of 38 GPa. Increasing the nitrogen pressure to 0.4–0.5 Pa resulted in the formation of monoaxial [111] or biaxial, [111] and [110], textures normal to the substrate surface and an increase in Vickers hardness to 40 GPa and 51 GPa, respectively. Dry-sliding wear was studied using a 6 mm diameter Al2O3 ball as a counter-body, but the applied pressure was not reported. The COF of the (HfNbTaTiVZr)N–Al2O3 pair was ∼0.9 for all coatings. The normalized wear rate was in the range of 2.1–3.8 × 10⁻⁵ cm3/(N m) and was the lowest for the textureless coating. For comparison, the wear rate of R6M5 steel was almost twice higher [5.12 × 10⁻⁵ cm3/(N m)]. The wear rate was consistent with that reported by Mathiou et al.Reference Mathiou, Poulia, Georgatis and Karantzalis115 and Ye et al.,Reference Ye, Liu, Wang and Nieh116 but it was an order of magnitude smaller than that reported by Poulia et al.Reference Poulia, Georgatis, Lekatou and Karantzalis38,Reference Poulia, Georgatis, Lekatou and Karantzalis114
Braic et al.Reference Braic, Balaceanu, Braic, Viadescu, Panseri and Russo118 studied mechanical and biomedical properties of (HfNbTaTiZr)N and (HfNbTaTiZr)C coatings deposited on Ti–6Al–4V (wt%) by co-sputtering Ti, Zr, Nb, Hf, and Ta metallic targets in a reactive atmosphere. The deposited films were FCC solid solutions with grain sizes in the range of 7.2–13.5 nm. The coatings were subjected to sliding wear in simulated body fluids (SBFs), with compressive stresses in the range of 0.8–1.6 GPa. The carbide coating exhibited Hv ≈ 32 GPa, COF = 0.12, and K = 2.0 × 10⁻⁸ cm3/(N m). The nitride coating, (HfNbTaTiZr)N, was slightly weaker and showed Hv ≈ 31 GPa, COF = 0.17, and K = 2.9 × 10⁻⁸ cm3/(N m). Lubricated by SBFs, these coatings showed much better wear resistance than the (HfNbTaTiVZr)N coatings in dry-sliding wear experiments.Reference Grigoriev, Sobol, Beresnev, Serdyuk, Pogrebnyak, Kolesnikov and Nemchenko117
VII. METHODS OF EXPLORATION AND DEVELOPMENT OF RHEAS
Although RHEAs represent only one family of HEAs, there are still an enormous number of alloy systems and different compositions to explore. Therefore, methods for rapid and efficient exploration and development of HEAs and CCAs described earlierReference Miracle, Miller, Senkov, Woodward, Uchic and Tiley119–Reference Miracle, Majumdar, Wertz and Gorsse121 can be applied to RHEAs. Here, we briefly outline these methods, relating particularly to RHEAs and RCCAs.
It is believed that the integration of high-throughput computations and multiscale simulations with high throughput experimental methods and automated analysis of the collected results will greatly accelerate discovery, development, and exploration of new HEA compositions with unique, application-driven structural, and/or functional properties.Reference Miracle, Miller, Senkov, Woodward, Uchic and Tiley119 The first step of alloy discovery starts from high-throughput, automated calculations of phase compositions to identify alloy systems that might produce desired microstructures. The full spectrum of computational methods can be used, including atomistic simulations, molecular dynamics (MD), Monte Carlo techniques and other less physical tools such as Bayesian methods and machine learning. Thermodynamics models using the CALculated PHAse Diagram (CALPHAD) approach have already been used in CCAs to model phase diagrams and to identify alloy systems that might produce desired microstructures.Reference Senkov, Miller, Miracle and Woodward120,Reference Senkov, Miller, Miracle and Woodward122 During the next step, properties that depend on composition but are relatively insensitive to microstructure are evaluated using known properties of pure metals and/or materials libraries of selected alloy systems with controlled composition gradients. Special emphasis is placed on high throughput evaluation of environmental resistance because (i) this is one of the quickest experimental tests and (ii) this is one of the most important properties of alloys used at high temperatures and/or aggressive environments, especially for refractory elements and alloys (Sec. VIII). The third step evaluates properties that depend on both composition and microstructure using material libraries of fixed composition and controlled microstructure gradients. At each stage of exploration, the obtained information is automatically analyzed using sets of criteria, so the number of prospective alloy compositions is reduced from many at the first step of quick screening to few at the final step. Candidate alloys that pass this three-step screening evaluation are subsequently characterized using more conventional and time-consuming experimental techniques.
The high-throughput experiments described in these earlier studies have not yet been reduced to practice and so will not be discussed further here. However, several computational methods are already being used to explore new RCCAs, and these efforts are briefly reviewed below.
A. Computational methods
1. CALPHAD
CALPHAD modeling, i.e., calculation of phase diagrams and thermodynamic properties, is one of the most important and powerful tools for HEA exploration.Reference Gao, Carney, Doan, Jablonksi, Hawk and Alman67,Reference Senkov, Miller, Miracle and Woodward120,Reference Senkov, Miller, Miracle and Woodward122–Reference Gao124 The quality of CALPHAD modeling depends on the quality of thermodynamic databases used for the calculations. CALPHAD predictions are reliable over composition ranges for which the databases have been built. To correctly predict thermodynamic properties of a multicomponent alloy, complete thermodynamic assessment of respective binary and ternary systems should generally be available. However, the currently available databases, even those specially developed for HEAs,125,126 have a limited number of elements, binary systems and, especially, ternary systems and thus can only be applied reliably to a limited number of alloy systems. Senkov et al.Reference Senkov, Miller, Miracle and Woodward120,Reference Senkov, Miller, Miracle and Woodward122 calculated phase diagrams for over 100,000 unique equiatomic alloys containing 3, 4, 5, or 6 alloying elements using 8 different thermodynamic databases developed by CompuTherm, LLC (Madison, WI).126 They found that the fraction of the alloys for which all the respective binary systems had full thermodynamic description rapidly decreased with increasing the number of components and that none of the alloys with 4 or more components had a full set of assessed ternaries. Comparison of the CALPHAD calculations with experimentally reported data for over 50 equiatomic alloys showed satisfactory agreement for the type and number of phases present only if the fraction of the related fully assessed binary systems exceeded 50%.Reference Senkov, Miller, Miracle and Woodward120 Otherwise, the agreement was poor. The calculations reported 51 new equiatomic alloys (33 of them are RCCAs) with solid solution phasesReference Senkov, Miller, Miracle and Woodward122 and 157 new equiatomic alloys, including 48 RCCAs that are single-phase solid solutions at their respective melting temperature, experience no phase transformations below 1000 °C and have density below 10 g/cm3.Reference Senkov, Miller, Miracle and Woodward120 Some of these alloys can be age-hardened for improved strength, providing new alloy bases for future development studies.
The CALPHAD method has been widely used for the development of new RHEAs and prediction of temperature and composition-dependent phase content and phase stability. Senkov et al.Reference Senkov, Senkova, Woodward and Miracle40 used CALPHAD to develop low-density RHEAs from the Cr–Nb–Ti–V–Zr system and model equilibrium and nonequilibrium phase diagrams in these refractory alloys. The calculations predicted single-phase BCC structures in as-solidified, Cr-free alloys and multiphase structures in the annealed alloys, in agreement with the experimental data. Although predicting correct trends, CALPHAD calculations were not able to accurately predict volume fractions and compositions of Laves phases in Cr-containing RHEAs. CALPHAD was later used to analyze equilibrium and nonequilibrium phases in a CrMo0.5NbTa0.5TiZr RHEA, which contains a Laves phase.Reference Senkov, Zhang and Miller127 Although the calculations were in qualitative agreement with the experimental results and explained different phase contents in as-cast and annealed conditions, noticeable quantitative discrepancies in the phase volume fractions and phase compositions were reported. This discrepancy was explained by the fact that CALPHAD simulated the Laves phase as an essentially binary Cr2Zr phase thus depleting other phases with these elements. On the other hand, the experimental results showed large concentrations of other elements in the Laves phase.
Senkov et al.Reference Senkov, Senkova and Woodward46,Reference Senkov, Woodward and Miracle47 also used CALPHAD to study the effect of Al additions on the phase composition of several RHEAs. Formation of two BCC phases was predicted and then experimentally observed in several RHEAs containing Al, Ta, and Zr. It was later found that CALPHAD (using both CompuTherm and ThermoCalc databases) was not able to predict ordering of BCC phases in RHEAs.Reference Senkov, Isheim, Seidman and Pilchak48,Reference Jensen, Welk, Williams, Sosa, Huber, Senkov, Viswanathan and Fraser49,Reference Senkov, Jensen, Pilchak, Miracle and Fraser51 The issue is that Al does not form B2 compounds with refractory elements, and so there are no binary and ternary models in the CALPHAD databases for the B2 phase in systems with refractory elements and Al. Zhang et al.,Reference Zhang, Gao, Zhang and Guo36,Reference Zhang, Gao, Zhang, Yang and Guo128 Yao et al.,Reference Yao, Qiao, Hawk, Zhou, Chen and Gao75,Reference Yao, Qiao, Gao, Hawk, Ma and Zhou98,Reference Yao, Qiao, Gao, Hawk, Ma, Zhou and Zhang129 and Gao et al.Reference Gao, Zhang, Yang and Guo52 used CALPHAD to aid the development of single-phase BCC RHEAs such as MoNbTaTiVW,Reference Zhang, Gao, Zhang, Yang and Guo128 CrxMoNbTaVW,Reference Zhang, Gao, Zhang and Guo36 MoNbTaV,Reference Yao, Qiao, Gao, Hawk, Ma and Zhou98 MoNbTaTiV,Reference Yao, Qiao, Hawk, Zhou, Chen and Gao75 NbTaTiV and NbTaTiVW,Reference Yao, Qiao, Gao, Hawk, Ma, Zhou and Zhang129 and HfNbTaTiVZr.Reference Gao, Zhang, Yang and Guo52
Gao et al.Reference Gao, Carney, Doan, Jablonksi, Hawk and Alman67 compared the ability of selected empirical parameters (enthalpy of mixing, atomic size difference, Ω-parameter, and electronegativity difference) and CALPHAD to predict single-phase RHEAs. Two alloys, HfMoNbTaTiVZr and HfMoNbTaTiVWZr, for which the empirical parameters predicted single-phase structure, were produced. The first alloy had two BCC phases whereas the second alloy had multiple phases in the as-cast condition thus showing failure of the empirical approaches. On the other hand, CALPHAD was able to qualitatively predict the phase compositions. The study demonstrated that for this very limited number of alloys, CALPHAD is more effective in predicting HEA formation than empirical parameters. Using CALPHAD, Gao et al.Reference Gao, Carney, Doan, Jablonksi, Hawk and Alman67 also identified new single-phase BCC RHEAs, HfMoNbTiZr, HfMoTaTiZr, HfMoNbTaTiZr, MoNbTaTiVZr, NbTaTiVZr, and HfMoTaTiVZr. The first four were later producedReference Juan, Tsai, Tsai, Lin, Wang, Yang, Chen, Lin and Yeh10,Reference Guo, Wang, Luo, Li, Su, Guo and Fu74,Reference Mu, Liu, Liu, Zhang, Jiang and Dong130 confirming correct predictions.
Schuh et al.Reference Schuh, Volker, Todt, Schell, Perriere, Li, Couzinie and Hohenwarter24 used CALPHAD to interpret experimental data in which secondary phases, HCP or BCC2, precipitate in a cold-worked BCC1 matrix of an HfNbTaTiZr RHEA during annealing at <700 °C or between 700 °C and 900 °C, respectively. CALPHAD confirmed the thermodynamic stability of these minor phases and, in agreement with the experiments, showed that the BCC2 phase is rich in Nb and Ta and stable below 1020 °C, while the HCP phase is rich in Hf and Zr and stable below 800 °C.
This analysis of the literature data illustrates three distinct levels of agreement between CALPHAD predictions and experiments. When sufficient binary and ternary thermodynamic data are available, predicting the number and types of phases present appears to be most reliable—this is the first level of agreement. Predicting transformation temperatures becomes more challenging,Reference Wertz, Miller and Senkov131 and the third most difficult level of agreement is for predictions of phase compositions and volume fractions. These last two levels of comparison are also more challenging to establish experimentally, perhaps contributing to the poorer levels of agreement between CALPHAD predictions and experiments.
Regarding prediction of the phases present, the results discussed above show success in using CALPHAD for the prediction of solid solution RHEAs when using particular alloying elements. However, currently available thermodynamic databases generally fail to model phases in RCCAs that contain IM-forming elements. Thermodynamic parameters for the B2 phase are often entirely lacking in the refractory metal databases, representing a key deficiency and opportunity for improvement. Reliable predictions of Laves and sigma phases are also important for RCCAs, but current thermodynamic models embedded within CALPHAD databases do not include appropriate elemental substitutions on the Laves sublattices. In fact, in the current state, thermodynamic databases for RCCAs are the least developed, as compared to the TM CCAs, and many ternary refractory systems are not assessed, even in the databases specifically designed for the complex concentrated systems.132,133 To further improve the reliability of the databases and CALPHAD calculations for RHEAs, thermodynamic data for the ternary systems, which are most important and most frequently occur in RHEAs, must be developed using both experimentation and reliable first principles (ab initio, DFT) calculations.
B. Other computational methods
First principles calculations have been used by a number of researchers to calculate the phase stability, lattice parameters, electronic structure, elastic properties, and thermodynamic properties of BCC RHEAs. For example, elastic properties were calculated for 40 unique RHEAsReference Zheng, Feng and Wang17,Reference Tian, Varga, Chen, Shen and Vitos42,Reference Tian, Wang, Harris, Irving, Zhao and Vitos44,Reference Fazakas, Zadorozhnyy, Varga, Inoue, Louzguine-Luzgin, Tian and Vitos55,Reference Yao, Qiao, Hawk, Zhou, Chen and Gao75,Reference Mu, Liu, Liu, Zhang, Jiang and Dong130,Reference Cao, Ni, Tian, Varga and Vitos134 (Table V), and comparison with the experimental data for some of these alloys showed good agreement. Calculation of the elastic properties is important for selection of prospective, intrinsically ductile RHEAs prior to heavy investment in alloy production and characterization. It is well known that Cauchy pressure (C 12–C 44) and Pugh’s index of ductility (B/G)Reference Pugh135 can indicate the ductile or brittle nature of an alloy. A negative Cauchy pressure indicates directional bonding and brittleness, while positive values of C 12–C 44 indicates metallic, nondirectional bonding and ductile nature of a material.Reference Pettifor136 Metallic materials are generally malleable if B/G > 2.Reference Pugh135 Alternatively, Pugh’s rule can be expressed using Poisson’s ratio ν = (1.5B/G − 1)/(3B/G + 1) so that metallic materials with ν > 0.29 are generally ductile and those with ν ≤ 0.29 are brittle. According to these rules, only NbTaTiVW from Table V is predicted to be brittle, while other alloys should be intrinsically ductile.
Elastic constants, C11, C12, and C44 (in GPa), polycrystalline elastic moduli B, E, and G (in GPa), Poisson’s ratio ν, and B/G ratio, calculated using ab initio methods.

Yao et al.Reference Yao, Qiao, Hawk, Zhou, Chen and Gao75 and Tian et al.Reference Tian, Wang, Harris, Irving, Zhao and Vitos44 compared elastic constants of several BCC RHEAs with those of respective pure elements and found that they follow the rule of mixtures. This finding allows rapid screening of prospective ductile RHEAs or RHEAs with required elastic properties without involvement of heavy first principles calculations.
Significant lattice distortions in relaxed cells of RHEAs are another important finding from first principles calculations.Reference Tian, Wang, Harris, Irving, Zhao and Vitos44,Reference Song, Tian, Hu, Vitos, Wang, Shen and Chen137 For example, Song et al.Reference Song, Tian, Hu, Vitos, Wang, Shen and Chen137 used a supercell model together with ab initio calculations to investigate local lattice distortions (LLDs) in BCC RHEAs and FCC 3d-transition-metal-HEAs caused by atomic size mismatch of the alloying components. They found that LLDs in RHEAs were much more significant than those in 3d-HEAs. The calculated distortions were different from those estimated using empirical atomic radii, which outlined the importance of interatomic interactions. Both the lattice distortion energy and the mixing entropy contributed significantly to the thermodynamic stability of the solid solution phases. However, LLDs had negligible effect on equilibrium lattice parameters and bulk moduli.
Song et al.Reference Song, Tian and Wang13 were the first to use ab initio methods to calculate thermodynamic properties of HfNbZr, HfNbTiZr, and HfNbTaTiZr RCCAs, such as coefficient of thermal expansion (CTE), vibrational entropy, and specific heat (Table VI). They calculated these properties using the pressures of 0 or 30 GPa and different temperatures. Additions of Ta and Ti to HfNbZr increased the CTE and its sensitivity to pressure but had no effects on other studied properties. An increase in temperature increased CTE, entropy, and specific heat while increasing pressure had no effect on specific heat, decreased CTE and entropy, and increased bulk modulus and Debye temperature (Table VI).
Equilibrium bulk modulus B (GPa), thermal expansion coefficient α (10−5/K), entropy S (J/mol K), specific heat from vibrational contribution C vib (J/mol K), isobaric specific heat C P (J/mol K), and Debye temperature θD (K), as calculated in Ref. Reference Song, Tian and Wang13.

Gao et al.Reference Gao, Zhang, Yang and Guo52 calculated diffusion constants at 2200 °C of the alloying elements in a BCC HfNbTaTiVZr RHEA using ab initio MD simulations, which, in descending order, are 5.35 ± 0.08, 4.96 ± 0.02, 4.07 ± 0.07, 3.96 ± 0.02, 3.86 ± 0.03, and 3.73 ± 0.06 [10−5 cm2/s] for V, Ti, Zr, Nb, Hf, and Ta, respectively. The results indicate that the diffusivities of different alloying elements in the same alloy are very similar in spite of very large differences in melting temperatures and self-diffusivities.
First principles total energy calculations conducted by Huhn and WidomReference Huhn and Widom138 for the binaries in MoNbTaW revealed a set of distinct energy-minimizing structures, implying the likelihood of chemically ordered low-temperature phases. A hybrid Monte Carlo and MD method was applied to evaluate the temperature-dependent chemical order.Reference Widom, Huhn, Maiti and Steurer33 It was found that temperature evolution of the system was driven by strong Mo–Ta bonding. At 27 °C, a cesium-chloride ordering was identified between mixed (Nb,Ta) and (Mo,W) sites. This order was lost at elevated temperatures. Wang et al.Reference Wang, Yan, Zhu, Wang, Wu, Hui, Otis, Shang, Liu and Chen139 applied the first principles phonon method to study phase reactions in Mo–Nb–Ta–V–W RHEAs in a wide temperature-composition space. Gibbs free energies were calculated for 178 phases, including pure elements, ordered B2, B32, B23, B22, hR6, hR7, tI6, C15, and D03 binary phases, two ordered MoNbTaW quaternary phases, and disordered multicomponent BCC phases. Phase separation/ordering for MoNbTaW and MoNbTaVW were thermodynamically predicted in the temperature range of 227–634 °C. The predicted ordering in these alloys still needs to be proven experimentally.
Wang et al.Reference Wang, Wang, Lin, Zou, Wu, Hu, Shang, Darling, Wang, Hui, Li, Kecskes, Liaw and Liu34 used a cluster-plus-glue-atom model to study order–disorder configurations in quaternary MoTM1TM2W (TM = Nb, Ta, and V) equiatomic RHEAs. The bonding lengths between alloying elements were calculated in terms of partial pair correlation functions, which revealed order–disorder configurational transitions. Different atomic radii and valence electron densities of the alloying elements were found to develop lattice distortions in the form of tightly bonded clusters and weak spots between the clusters. The presence of the strongly bonded clusters and weakly bonded glue atoms was suggested to be responsible for serrated deformation of high-entropy alloys, resulting in intermittent avalanches of defects.Reference Wang, Shang, Wang, Han, Darling, Wu, Xie, Senkov, Li, Hui, Dahmen, Liaw, Kecskes and Liu140
VIII. APPLICATIONS AND TECHNICAL CHALLENGES
A. Applications
The RCCA family was designed as a new class of high temperature structural alloys that might surpass the capabilities of nickel-based superalloys. Potential RCCA applications thus include high temperature superalloy components in aerospace propulsion systems, land-based gas turbines, nuclear reactors, heat exchanger tubing, and the chemical process industry. RCCAs may also be considered for applications where conventional refractory metals and alloys are used, including liquid rocket engine nozzles, nuclear reactors, and rotating anodes for X-ray production. Both superalloys and conventional refractory alloys additionally find uses where high temperature strength is not important, and RCCAs might also be considered for such applications. For example, superalloys are used for their exceptional corrosion resistance at temperatures below 400 °C in the chemical process industry. Ta is one of the most corrosion resistant materials and has the second-highest capacitance per unit volume of any material. Tungsten carbide is widely used for machining and cutting tools. Nb is a superconductor, and compounds based on Nb or V (Nb3Sn, Nb3Ge, NbN, and V3Si) are also superconductors. It is conceivable that RCCAs could be explored and developed for such applications, but extensive efforts to consider these possibilities have not yet been undertaken.
The majority of RCCA exploration efforts currently seek to surpass requirements of the most demanding superalloy applications—blades, vanes, and disks in aerospace gas turbine engines. These applications require a range of physical and mechanical properties. Foremost is the combination of both high temperature tensile strength and sufficient damage tolerance to resist failure during assembly (i.e., at RT) and operation. Of these components, blades and vanes operate at the highest temperatures (900–1000 °C), and the tensile strengths of commercial superalloy cast, single-crystal blade materials are in the range of 200–500 MPa at 980 °C.Reference Davis141 The minimum RT tensile ductility of these alloys is 4%, with typical values from 5 to 11%.Reference Davis141 Wrought, polycrystalline turbine disk alloys have higher strength requirements (over 1000 MPa) but lower maximum operating temperatures (around 650 °C) and possess RT tensile ductilities of 15% or greater. Other important properties for gas turbine blades, vanes, and disks include resistance to fatigue, creep, and stress-rupture conditions; environmental resistance; the ability to produce bulk forms using conventional primary and secondary processes; and the ability to repair components. Blades and vanes require good thermal conductivity to improve the effectiveness of active cooling and thermal barrier coatings. To operate efficiently, gas turbine engines operate with tight dimensional tolerances, so candidate materials should have modest coefficients of thermal expansion and elastic stiffnesses high enough to reduce elastic deflections. Alloy density is a primary consideration so that specific strengths are more appropriate alloy development goal. Current blade alloys possess the specific strengths of 57 MPa cm3/g or higher at the maximum operating temperature and disk alloys have density-normalized strengths over 90.6 MPa cm3/g at the use temperature. Finally, gas turbine engines operate for thousands of hours, so superalloys (and their replacements) must have good long-term microstructural stability at high temperatures.
Superalloys are also used for a wide variety of high temperature applications where the stresses are much lower. These applications include combustors, transition ducts, thermal protection systems (TPS), and temperature sensors in gas turbine engines; rocket nozzles; high-temperature heat exchangers and bellows; and heat-treating equipment. These “TPS alloys” are easy to fabricate and can be cold-rolled, deep-drawn, or hot-rolled. Since the strength requirements are more modest (specific strengths are around 32 MPa cm3/g at 760 °C), TPS applications represent a relatively low-risk opportunity for RCCAs.
B. Technical challenges
By working from a palette of refractory elements as principal elements, RCCAs provide the opportunity to increase alloy melting temperatures, and ultimately application temperatures, relative to superalloys. However, refractory elements and conventional refractory alloys display characteristics that have kept them from competing with superalloys. Two main issues that are common in many refractory elements and alloys are poor environmental resistance and poor RT ductility. RCCAs also have a third major technical challenge. Considering the RCCA palette to contain 17 principal metallic and semimetallic elements (see Sec. II), there are 21,624 different alloy systems with 3, 4, 5, or 6 principal elements. While far fewer than the number of alloys in the full CCA field, this is nevertheless a daunting challenge that requires dramatically faster approaches for alloy discovery and development. To put this in perspective, after 7 years of vigorous international study, none of the RCCA systems produced to date are well-characterized, and only 100 RCCA systems have been made. In most cases, only a cursory evaluation of the microstructure or properties of one or two alloys have been reported from each of these 100 alloy systems. At this rate, it would take the scientific community 1700 years to make just one or two alloys in each of the RCCA systems possible.
These three characteristics form the major technical challenges that must be addressed in the exploration and development of RCCAs for high temperature structural applications. The topic of high-throughput computations and experiments for the accelerated discovery and development of structural alloys has been covered elsewhere,Reference Miracle and Senkov3,Reference Miracle, Miller, Senkov, Woodward, Uchic and Tiley119–Reference Senkov, Miller, Miracle and Woodward122,Reference Miracle142 the remaining two technical challenges are described below.
1. Environmental resistance
Refractory elements and conventional refractory alloys can be limited by four distinct types of environmental attack: volatilization; “pest” attack; solid solution embrittlement; and rapid, nonprotective oxide formation. With the exception of Cr, none of the refractory elements form a dense, protective oxide scale, and so refractory elements and alloys are generally prone to nonprotective oxide formation. This mode of attack includes internal oxidation, where the diffusion rate of oxygen through refractory metal oxides is fast enough to form new oxide internally, beneath the oxide layer. The three remaining mechanisms of attack are less general and are usually specific to particular refractory elements. Mo forms a volatile MoO3 oxide that has a vapor pressure of 1 atm near 1100 °C. Even at lower temperatures, accelerated Mo loss by MoO3 volatilization can occur. At 1200 °C, elemental Cr has a vapor pressure of about 10−3 torr, and this may cause some concern about Cr loss from the surface during applications that last for thousands of hours. Solid solution embrittlement is well known in titanium alloys, but also occurs in other refractory elements such as NbReference Donoso and Reed-Hill143 and Mo.Reference Liu and Inoue144 Solid solution embrittlement is not “oxidation” in the traditional sense, as an oxide phase does not form and this mode of degradation is not detected by weight change measurements. Nevertheless, this can significantly reduce structural performance and must be considered in RCCAs. Finally, a “pest” phenomenon is observed in some refractory metal compounds with Al or Si. This attack occurs at intermediate temperatures in oxidizing environments and is characterized by the rapid (within hours) conversion of bulk samples to powder. While specific mechanisms of the “pest” attack continue to be discussed, it is generally agreed that rapid grain-boundary diffusion of oxygen embrittles the grain boundary regions and some stress incompatibility can then cause entire grains to spall from the bulk.Reference Westbrook and Wood112
Several successful approaches are used to protect refractory elements and conventional alloys in high temperature environments.Reference Davis141 Elements that favor formation of protective oxide layers, such as Al, Cr, or Si, are sometimes added to conventional refractory alloys. As an alternate approach, protective coatings can be directly applied by chemical vapor deposition, pack cementation, or slurry techniques. Successful coating systems have been developed for all refractory elements and alloys. The slurry approach is the most widely used but has the negative effects of reducing alloy strength and ductility. It also limits component design since sharp edges cannot be used.
Limited data collected to date suggest that oxidation kinetics in RCCAs appears to be sluggish compared to refractory elements and conventional refractory alloys (see Sec. V). Nevertheless, much more work is needed to establish the types of oxide phases formed and the kinetics of attack. Adding Al, Cr, and/or Si to favor formation of a dense, adherent, protective oxide is suggested as a specific approach to improve environmental resistance of RCCAs. Given the vast number of potential alloys, accelerated environmental resistance tests are likely to play a major role in the exploration and development of RCCAs.Reference Miracle, Majumdar, Wertz and Gorsse121 Such tests may be especially effective in eliminating candidate alloys susceptible to rapid, nonprotective oxide formation or “pest” attack. High-throughput computations may assist this effort by giving indications of the type of oxide phases that may form in candidate alloys. The ability to predict diffusion rates and defect structures of these oxides will be particularly valuable. Experimental studies that go beyond simple mass change data and develop mechanisms of attack will be challenging but may give important insights to develop alloys resistant to environmental degradation. In particular, solid solution embrittlement needs to be addressed and can be established by simple hardness profiles below the oxide scale.
2. RT ductility
Refractory metals and alloys, including RCCAs, typically have a BCC crystal structure. In BCC metals and alloys, the fracture stress (σf) is relatively insensitive to temperature but the yield stress (σy) depends strongly on temperature. The σy and σf values cross at a brittle-to-ductile transition temperature (T BDT), below which σf < σy and fracture occurs with no bulk plastic deformation. To be commercially viable, a candidate alloy must have a T BDT below RT. It is difficult to evaluate the T BDT of currently studied RCCAs, as mechanical properties are typically measured in compression. The T BDT can be indicated in compression if data are collected over a sufficiently wide temperature range, but such data are generally not available for RCCAs. Based on the magnitude of RT compressive ductilities alone, initial indications suggest that T BDT may be above RT for many RCCAs.
Approaches to lower the T BDT in BCC metals and alloys have been widely studied, and several fundamental material parameters influence this transition. The T BDT decreases with increasing σf or decreasing σy. The σf increases with higher elastic modulus, higher surface energy, or a smaller lattice constant,Reference Kelly, Tyson and Cotrell145 and σy decreases with decreasing shear modulus.Reference Tetelman and McEvily146 Grain size has a more complicated influence, but T BDT is ultimately reduced with a refined grain size.Reference Tetelman and McEvily146 Designing RCCAs with these concepts in mind may help reduce the T BDT to below RT. Consistent with these trends, the equimolar alloy HfNbTaTiZrReference Senkov, Scott, Senkova, Miracle and Woodward8,Reference Senkov and Semiatin11,Reference Schuh, Volker, Todt, Schell, Perriere, Li, Couzinie and Hohenwarter24 and its derived compositionsReference Sheikh, Shafeie, Hu, Ahlstrom, Persson, Vesely, Zyka, Klement and Guo71,Reference Wu, Cai, Wang, Si, Zhu, Wang and Hui72 are ductile at RT and use four of the six refractory elements with the lowest shear moduli (V and Mo are two other refractory metals with unusually low shear moduli). However, these approaches challenge traditional thinking, which strives to increase σy of candidate alloys.
The deformation and strength of BCC alloys are closely linked to the dislocation core structures and mechanisms of movement. Studies to establish the details of dislocation structure, mobility, and interactions with barriers are needed to provide guidance on improving RT ductility. A clear understanding of the intrinsic and extrinsic strengthening mechanisms in RCCAs is also required. High throughput experiments that can evaluate tensile ductility are currently not available and represent a major opportunity to accelerate the exploration and development of RCCAs for high temperature structural use.Reference Miracle, Majumdar, Wertz and Gorsse121
IX. SUMMARY AND CONCLUDING REMARKS
The field of RHEAs (also called RCCAs) is a rapidly growing field. The first publication in 2010 described 2 alloys drawn from 5 refractory elements, and by the end of January 2018, the field has expanded to include 151 distinct alloys drawn from a palette of 16 elements that include 9 refractory metals (Cr, Hf, Mo, Nb, Re, Ta, V, W, and Zr), 5 other metals or semimetals (Al, Ti, Si, Co, and Ni) and 2 nonmetals (C and N). Many of the alloys have different concentrations of the same principal elements so that there are 100 different alloy systems (unique combinations of principal elements) included in this review. Most RCCAs studied have from 4 to 6 principal elements, and some have as many as 8. Efforts have been undertaken to design RCCAs with low density; good strength at high temperature; good ductility at RT; and good environmental resistance. Brief summaries of the main sections in this review are given below, followed by concluding remarks regarding guiding concepts for future RCCA research and development.
A. Processing and microstructures
Melting is the most common method for producing RCCAs. The high melting temperatures and the large range in melting temperatures of the constituent elements complicate liquid metal processing and often produce chemical inhomogeneities in the form of micro and macrosegregation. Most materials are studied in the as-cast condition or after high temperature annealing that reduces (but does not eliminate) segregation, and a small number of alloys have been deformation processed and annealed to better reduce chemical inhomogeneities. PM techniques (mechanical alloying or DMD) are used infrequently to produce RCCAs.
RCCA microstructures are dominated by disordered, solid solution BCC phases, which account for two-thirds of the phases found in the 151 alloys. Regarding ordered compounds, Laves phases represent 14% of the observed phases and B2 and M5Si3 compounds give 5% each. All other observed phases combined, including disordered HCP and FCC phases and AlxZr5 and L12 ordered phases, make up about 9% of the observed phases. More than half of the alloys (81) show a single-phase, BCC solid solution microstructure. The elements in these single-phase alloys are drawn almost exclusively from Groups IV, V, and VI of the periodic table, but 23 single-phase alloys also contain Al and one contains Co. There are a significant number of 2-phase microstructures (59), and far fewer alloys have 3 or 4 phases. Three alloys, AlMo0.5NbTa0.5TiZr, Al0.5Mo0.5NbTa0.5TiZr, and Al0.25NbTaTiZr, offer a BCC analog to Ni-based superalloy microstructures by providing a duplex combination of a disordered BCC phase and an ordered, atomically coherent B2 phase. Unlike superalloy microstructures, the ordered phase in these RHEAs is continuous, but thermomechanical treatments can invert this microstructure, producing a continuous, disordered BCC matrix with discrete, coherent, ordered B2 phases. This microstructure shows promise for further study, including better control of the size, volume fraction and distribution of the strengthening phase, and determination if other RCCA alloy systems provide similar microstructures.
B. Mechanical properties
Mechanical properties ranging from RT to 1600 °C are reported for 113 of the 151 alloys in this review. Most of the properties are measured in compression, and the limited tensile testing is done only at RT. Testing is done mostly on materials in the as-cast condition, with fewer tests conducted after annealing, and even fewer after deformation processing. Sixty percent of the data are for single-phase, solid solution alloys.
Ductility is of vital importance and has been addressed in many studies. HfNbTaTiZr and its derived alloys, e.g., HfNbTiZr and HfNb0.18Ta0.18Ti1.27Zr, show RT tensile ductilities well in excess of 10% and compressive ductilities greater than 50%. All other RCCAs show limited compressive ductilities and most are expected to have no practical tensile ductility at T ≤ 600 °C. Based on trends in compressive ductilities, additions of subgroup IV elements (Hf, Ti, and Zr) often improve ductility, while elements from subgroups V and VI (Cr, and V) can improve strength but reduce ductility. Al or Mo increases ductility in some alloys but decreases ductility in others. Computations suggest that a critical VEC (VEC <4.5) in alloys consisting only of elements from Groups IV, V, and VI is needed for ductility. A mechanistic interpretation of ductility in RCCAs is not yet available and is suggested for future study.
The yield strengths, σY, of RCCAs typically fall in the range of 800–2200 MPa at RT and at 1200 °C generally drop to 100–800 MPa. The two alloys tested above 1200 °C retain compressive σY above 400 MPa (MoNbTaW) and above 600 MPa (MoNbTaVW) at 1400 and 1600 °C, but these alloys are rather dense and are expected to be brittle at RT. The largest σY decrease occurs between RT and 600 °C for solid solution alloys, while two-phase alloys generally show a significant drop at a higher temperature, 800 °C. With the exception of the two-phase AlMo0.5NbTa0.5TiZr superalloy, here have been no focused attempts to control the size, spacing, volume fraction, or distribution of strengthening particles in RCCAs. As a result, the properties reported here may not represent the full potential for two-phase RCCAs, and improvements in properties that depend sensitively on these features (RT ductility and high temperature strength) may be achieved in future studies. As a successful example of microstructural control, AlMo0.5NbTa0.5TiZr and its derivatives do not show a significant drop in strength below 1000 °C due to their nanometer-sized, coherent precipitates similar to superalloy microstructures.
The deformation mechanisms responsible for the measured mechanical properties are poorly reported in the literature and deserve attention in future studies, especially to understand and control RT ductility and high temperature strength. Initial studies show the major role of screw dislocations in controlling the plastic deformation of ductile RHEAs at RT. Short-range, solid-solution–related obstacles play a key role in the plasticity of refractory solid solutions, and local compositional fluctuations may significantly impact dislocation mobility.
Several solid solution hardening models have been proposed. Based on atom size and modulus misfits, these models show a power law dependence on concentration with exponents that range from 0.5 to 1. These compare with an exponent of 0.5 for traditional SSS in dilute solutions, showing more potent hardening in RCCAs. The use of a modified Labush model gives satisfactory results in HfNbTaTiZr and other NbTiZr-based RHEAs. Grain boundary strengthening was studied in cold-rolled and annealed HfNbTaTiZr with various grain sizes, confirming a Hall–Petch relationship with a strengthening coefficient k = 240 MPa m−1/2. Mechanistic studies of second-phase strengthening have not yet been conducted in RCCAs. Finally, even though interstitial elements exert a dramatic influence on the strength and ductility of conventional refractory alloys (even 2000 part per million by weight is sufficient to embrittle conventional titanium alloys), interstitial levels are rarely measured and essentially never controlled and studied in RCCAs. Without this critical data, it is not yet clear if the limited RT ductility of many RCCAs is an intrinsic property of those alloys, or if it is due to interstitial contamination. Future work to evaluate the presence and influence of interstitial elements in RCCAs is strongly recommended.
C. Environmental and wear behavior
The oxidation behavior of 20 RCCAs has been reported at temperatures from 700 to 1300 °C. Nonparabolic kinetics are most commonly observed, but some alloys show parabolic behavior. There is significant disagreement in the absolute values of oxidation kinetics between different researchers, supporting the need for additional research. Nevertheless, the oxidation resistance of RCCAs is generally much better, by at least 1 order of magnitude, than commercial refractory alloys. Oxidation resistance is usually improved with alloy additions of Al, Cr, and/or Ti and is degraded with V additions. The RHEAs studied often form complex oxide mixtures and show a strong preference for internal oxidation. Traditionally protective scales, such as Al2O3 or Cr2O3, were rarely observed, even in alloys with the most sluggish oxidation kinetics. Rather, favorable oxidation kinetics are generally associated with the formation of complex oxides such as NbCrO4, as opposed to rapid formation of Nb2O5 that is commonly observed in dilute refractory alloys.
Only a few corrosion studies have been reported for RCCAs. Pesting has not been studied, and while one report mentions a pesting-like product, the material studied does not match the profile of pesting-prone materials. No studies have explored interstitial embrittlement resulting from environmental exposure. A large amount of fundamental studies are needed to explore all of these dimensions to oxidation behaviors in RCCAs.
The friction and wear behaviors of several RCCAs and RCCA nitride and carbide coatings have been studied using ball-on-disk or nanoscratch methods. All the materials studied show very high hardness, giving wear resistance that is superior to commercial superalloys, conventional refractory alloys, and tool steels.
D. Exploration methods
High-throughput experiments and computations are needed to accelerate the exploration of RCCAs. High-throughput experiments have recently been reviewed elsewhere, this review focuses on computational methods used to accelerate RHEA screening. While a wide range of computational methods have value, most approaches to date have used the CALPHAD or first principles approaches. CALPHAD calculations predict the phases formed and transformation temperatures, providing insights into the microstructures possible and thermal treatments needed to produce them. CALPHAD has been used to predict single-phase solid solution alloys as well as compositions that may provide precipitation-hardened microstructures. Accuracy of predictions is a concern since RCCAs often require rather large extrapolations from compositions used to collect thermodynamic data. As a result, CALPHAD predictions for phase compositions and volume fractions are usually less reliable. As a critical deficiency, the B2 phase is an important component in RCCA microstructures, but it is not included in RHEA databases since the B2 phase does not form in binary phase diagrams containing a refractory metal and Al, while the ternary systems containing Al and refractory metals are not available. Efforts to include the B2 phase in refractory alloy thermodynamic databases are an essential requirement for future work.
First principles calculations have been successfully used by a number of researchers to calculate phase stability, lattice parameters, electronic structure, elastic properties, diffusivity, and thermodynamic properties of BCC RHEAs.
E. Applications and technical challenges
RCCAs are being studied to replace superalloys or conventional, dilute refractory alloys. Thus, any part that uses these alloys is a potential use for RCCAs. These applications include high temperature components in aerospace propulsion systems, land-based gas turbines, nuclear reactors, heat exchanger tubing, the chemical process industry, liquid rocket engine nozzles, and rotating anodes for X-ray production. To be successful, RCCAs must have both strength (or specific strength) superior to conventional alloys and RT tensile ductility. As benchmarks, superalloys for turbine blades have tensile strengths of 200–500 MPa at 980 °C (specific σY > 57 MPa cm3/g) with tensile ductilities that range from 4 to 11%. For turbine disk applications, superalloys have tensile strengths over 1000 MPa at 650 °C (specific σY > 91 MPa cm3/g) with tensile ductilities greater than 15%. Superalloys used in “thermal protection” applications have much lower strength requirements (285 MPa at 760 °C or 32 MPa cm3/g) and higher RT tensile elongation (48%), representing a relatively low-risk opportunity for RCCAs. Most of these applications operate for thousands of hours at the maximum service temperature, and so microstructural stability and environmental resistance are essential for successful application.
Many RCCAs have already demonstrated high temperature strengths sufficient to compete with superalloys and conventional refractory alloys—strength is not a major technical challenge. Rather, achieving the combination of good strength at high temperature and good RT ductility is a primary technical challenge for RCCAs. Initial indications based on the magnitude of measured RT compressive ductilities alone suggest that many RCCAs may have insufficient RT ductility (although this may also result from interstitial impurities), indicating a topic for future studies. To address this challenge, the brittle-to-ductile transition temperature (T BDT) needs to be routinely established for RCCAs. This can be done with tensile testing, but it can also be evaluated in compression if tests are done over a range of temperatures that is broad enough to show the temperature below which compressive ductility drops significantly. Even high-temperature hardness has the potential to indicate T BDT in alloys or individual phases. Approaches to lower the T BDT in BCC metals and alloys have been widely studied, and several fundamental material parameters influence this transition. Designing RCCAs with these concepts in mind may help reduce the T BDT to below RT. Finally, studies establishing the details of dislocation structure, mobility, and interactions with barriers are needed to provide guidance on improving RT ductility. Of course, a clear understanding of the intrinsic and extrinsic strengthening mechanisms in RCCAs is also required to achieve a balance of high temperature strength and RT ductility.
High-throughput experimental and computational methods are needed to more rapidly explore a large swath of RCCA composition and microstructure space. High-throughput calculations are already available and making important contributions. However, essential high-throughput experiments are lacking and represent second major technical barrier. High throughput experiments that can evaluate tensile ductility and environmental resistance are currently not available, and represent major opportunities to accelerate the exploration and development of RCCAs for high temperature structural use.
Understanding and controlling the environmental response of RCCAs represents the final major technical challenge. Refractory metal alloys and compounds exhibit four types of environmental degradation: volatilization; rapid, nonprotective oxide formation; solid solution embrittlement; and “pest” attack. Studies are needed to explore which of these mechanisms operate in RCCAs. Current results show sluggish oxidation kinetics in RCCAs relative to dilute refractory alloys, and basic studies are needed to better understand and control these phenomena.
F. Concluding remarks
A great deal of progress has been made on RHEAs and RCCAs in the past 8 years. The field has expanded to include many alloys and alloy systems, and these materials have been characterized in a wide range of evaluations including mechanical tests, oxidation exposures, and wear behaviors. New models are emerging for SSS, deformation mechanisms, and oxidation. Many of the alloys show unique and perhaps useful properties, spurring continued research. Essential future studies are outlined elsewhere in this review that will give an improved understanding of this class of materials and will support efforts to develop a practical balance of properties for structural applications. In this final section, we present several new ideas that are important for further development of high temperature RCCAs.
Developing alloys that have both RT ductility and high temperature strength is a grand goal. It is tempting to focus on high temperature strength since this seems to be the defining characteristic of a new high temperature structural alloy. However, it appears to be rather easy to find alloys with good high temperature strength, but very tough to find alloys with both high temperature strength and RT ductility. As a result, an equivalent focus on ductility and the basic features that produce it is essential for a balanced effort to develop high temperature structural RCCAs.
While it is very challenging to ductilize a phase that is strong but intrinsically brittle, there are many well-established approaches to strengthen a phase that is intrinsically ductile. Of the five classical strengthening mechanisms, the two that retain effectiveness at high temperatures both require a well-distributed strengthening phase within a ductile “matrix” phase. Producing such microstructures requires awareness and understanding of potential ductile “matrix” phases and of strengthening phases that can be produced within the matrix. Only a small number of intrinsically ductile RCCAs are currently known, and all are derived from the HfNbTaTiZr alloy. Research to identify new ductile phases is vital—the entire enterprise to develop high temperature structural alloys will fail without them. Classical concepts for ductilizing BCC phases are discussed elsewhere in this review and can be used to develop such matrix alloys.
It is risky to draw conclusions from mechanical tests done on uncontrolled, as-solidified microstructures. An alloy is tested and labeled as “strong” or “weak”, “brittle” or “ductile”. However, these properties depend sensitively on microstructure, and there are presently no attempts to control microstructure, especially in multiphase RCCAs. It is thus easy to draw incorrect conclusions. For example, an alloy may have a ductile matrix but fail in a brittle fashion due to an inappropriate size, volume fraction, or distribution of the (brittle) strengthening phase. Consider, for example, a microstructure where large Laves phases segregate to grain boundaries and brittle fracture occurs through this network—it is difficult to evaluate the constituent properties of the matrix phase without additional tests. In the same way, it is easy to discard potential strengthening phases as “embrittling” when the embrittlement has more to do with the size, volume fraction, or distribution of the phase than it does with the intrinsic properties of the phase. Specifically, it is common to conclude that the Laves phase embrittles RCCAs, but not a single study has produced Laves phases at a size or distribution that is consistent with good mechanical properties. It is thus essential to avoid evaluating as-solidified microstructures and to study instead microstructures obtained by thermomechanical treatments intended to produce attractive microstructures. Although the field is 8 years old, there is hardly a single study to intentionally control the size, volume fraction, and distribution of potential strengthening phases to give a balance of strength and ductility. Such studies are strongly recommended.
All the major microstructural components necessary for a new high temperature structural material have been identified in RCCAs. Intrinsically ductile BCC phases have been found, and possible strengthening phases, mostly Laves or B2, offer the possibility of microstructural design for particulate hardening. Atomically coherent, nanometer-sized particles have been produced in one alloy, but the grand goal of producing strong and ductile RCCAs by the intelligent combination of the essential microstructural components requires much more work. Phase transformations and thermomechanical processes that can produce controlled distributions of strengthening phases are still not known, and specific systems capable of effective precipitation hardening in RCCAs have not yet been discovered. Regarding other important properties, RCCAs show a wide range of densities, with values as low as 5.6 g/cm3. Environmental resistance is at least an order of magnitude better than conventional refractory alloys (but still much inferior to superalloys). Creep and fatigue properties have not yet been evaluated, but this is perhaps appropriate given the relative immaturity of RCCAs. Such tests are recommended only after more progress is made on the basic issues of combining strength and ductility, and in achieving better environmental resistance.
Above all, it is important to keep in mind that the best RCCA has not yet been made. There are over 31,000 possible alloy systems, but only 100 have been made to date and nearly all of these alloy systems have only 1 or 2 publications each. In most cases, the level of characterization can only be described as screening. Due to this limited amount of data, results obtained for any given alloy cannot be viewed as a general feature of RCCAs. The RCCA community must tenaciously resist the temptation to study relatively small adjustments to alloys already made, and rather continue to boldly explore the broad composition space as originally promised by this compelling new idea.
ACKNOWLEDGMENTS
Help of Dr. T. Butler in preparation of Sec. V.A (Oxidation behavior) is greatly appreciated. The authors appreciate discussions with J-W. Yeh, S.L. Semiatin, C. Woodward, P. Liaw, G. Dirras, S. Gorsse, K. Wertz, F. Zhang, and J. Miller. We sincerely thank the many friends and colleagues who contribute to the field and have shared their insights, ideas, and results freely. Work by O.N. Senkov was supported through the Air Force on-site contract FA8650-15-D-5230 managed by UES, Inc., Dayton, Ohio.