



%20--%3e%3c!DOCTYPE%20svg%20PUBLIC%20'-//W3C//DTD%20SVG%201.0//EN'%20'http://www.w3.org/TR/2001/REC-SVG-20010904/DTD/svg10.dtd'%3e%3csvg%20version='1.0'%20id='Layer_1'%20xmlns='http://www.w3.org/2000/svg'%20xmlns:xlink='http://www.w3.org/1999/xlink'%20x='0px'%20y='0px'%20width='64px'%20height='64px'%20viewBox='5.5%20-3.5%2064%2064'%20enable-background='new%205.5%20-3.5%2064%2064'%20xml:space='preserve'%3e%3cg%3e%3ccircle%20fill='%23FFFFFF'%20fill-opacity='0'%20cx='37.785'%20cy='28.501'%20r='28.836'/%3e%3cpath%20fill='%23595959'%20d='M37.441-3.5c8.951,0,16.572,3.125,22.857,9.372c3.008,3.009,5.295,6.448,6.857,10.314%20c1.561,3.867,2.344,7.971,2.344,12.314c0,4.381-0.773,8.486-2.314,12.313c-1.543,3.828-3.82,7.21-6.828,10.143%20c-3.123,3.085-6.666,5.448-10.629,7.086c-3.961,1.638-8.057,2.457-12.285,2.457s-8.276-0.808-12.143-2.429%20c-3.866-1.618-7.333-3.961-10.4-7.027c-3.067-3.066-5.4-6.524-7-10.372S5.5,32.767,5.5,28.5c0-4.229,0.809-8.295,2.428-12.2%20c1.619-3.905,3.972-7.4,7.057-10.486C21.08-0.394,28.565-3.5,37.441-3.5z%20M37.557,2.272c-7.314,0-13.467,2.553-18.458,7.657%20c-2.515,2.553-4.448,5.419-5.8,8.6c-1.354,3.181-2.029,6.505-2.029,9.972c0,3.429,0.675,6.734,2.029,9.913%20c1.353,3.183,3.285,6.021,5.8,8.516c2.514,2.496,5.351,4.399,8.515,5.715c3.161,1.314,6.476,1.971,9.943,1.971%20c3.428,0,6.75-0.665,9.973-1.999c3.219-1.335,6.121-3.257,8.713-5.771c4.99-4.876,7.484-10.99,7.484-18.344%20c0-3.543-0.648-6.895-1.943-10.057c-1.293-3.162-3.18-5.98-5.654-8.458C50.984,4.844,44.795,2.272,37.557,2.272z%20M37.156,23.187%20l-4.287,2.229c-0.458-0.951-1.019-1.619-1.685-2c-0.667-0.38-1.286-0.571-1.858-0.571c-2.856,0-4.286,1.885-4.286,5.657%20c0,1.714,0.362,3.084,1.085,4.113c0.724,1.029,1.791,1.544,3.201,1.544c1.867,0,3.181-0.915,3.944-2.743l3.942,2%20c-0.838,1.563-2,2.791-3.486,3.686c-1.484,0.896-3.123,1.343-4.914,1.343c-2.857,0-5.163-0.875-6.915-2.629%20c-1.752-1.752-2.628-4.19-2.628-7.313c0-3.048,0.886-5.466,2.657-7.257c1.771-1.79,4.009-2.686,6.715-2.686%20C32.604,18.558,35.441,20.101,37.156,23.187z%20M55.613,23.187l-4.229,2.229c-0.457-0.951-1.02-1.619-1.686-2%20c-0.668-0.38-1.307-0.571-1.914-0.571c-2.857,0-4.287,1.885-4.287,5.657c0,1.714,0.363,3.084,1.086,4.113%20c0.723,1.029,1.789,1.544,3.201,1.544c1.865,0,3.18-0.915,3.941-2.743l4,2c-0.875,1.563-2.057,2.791-3.541,3.686%20c-1.486,0.896-3.105,1.343-4.857,1.343c-2.896,0-5.209-0.875-6.941-2.629c-1.736-1.752-2.602-4.19-2.602-7.313%20c0-3.048,0.885-5.466,2.658-7.257c1.77-1.79,4.008-2.686,6.713-2.686C51.117,18.558,53.938,20.101,55.613,23.187z'/%3e%3c/g%3e%3c/svg%3e)
%20--%3e%3c!DOCTYPE%20svg%20PUBLIC%20'-//W3C//DTD%20SVG%201.0//EN'%20'http://www.w3.org/TR/2001/REC-SVG-20010904/DTD/svg10.dtd'%3e%3csvg%20version='1.0'%20id='Layer_1'%20xmlns='http://www.w3.org/2000/svg'%20xmlns:xlink='http://www.w3.org/1999/xlink'%20x='0px'%20y='0px'%20width='64px'%20height='64px'%20viewBox='5.5%20-3.5%2064%2064'%20enable-background='new%205.5%20-3.5%2064%2064'%20xml:space='preserve'%3e%3cg%3e%3ccircle%20fill='%23FFFFFF'%20fill-opacity='0'%20cx='37.637'%20cy='28.806'%20r='28.276'/%3e%3cg%3e%3cpath%20fill='%23595959'%20d='M37.443-3.5c8.988,0,16.57,3.085,22.742,9.257C66.393,11.967,69.5,19.548,69.5,28.5c0,8.991-3.049,16.476-9.145,22.456%20C53.879,57.319,46.242,60.5,37.443,60.5c-8.649,0-16.153-3.144-22.514-9.43C8.644,44.784,5.5,37.262,5.5,28.5%20c0-8.761,3.144-16.342,9.429-22.742C21.101-0.415,28.604-3.5,37.443-3.5z%20M37.557,2.272c-7.276,0-13.428,2.553-18.457,7.657%20c-5.22,5.334-7.829,11.525-7.829,18.572c0,7.086,2.59,13.22,7.77,18.398c5.181,5.182,11.352,7.771,18.514,7.771%20c7.123,0,13.334-2.607,18.629-7.828c5.029-4.838,7.543-10.952,7.543-18.343c0-7.276-2.553-13.465-7.656-18.571%20C50.967,4.824,44.795,2.272,37.557,2.272z%20M46.129,20.557v13.085h-3.656v15.542h-9.944V33.643h-3.656V20.557%20c0-0.572,0.2-1.057,0.599-1.457c0.401-0.399,0.887-0.6,1.457-0.6h13.144c0.533,0,1.01,0.2,1.428,0.6%20C45.918,19.5,46.129,19.986,46.129,20.557z%20M33.042,12.329c0-3.008,1.485-4.514,4.458-4.514s4.457,1.504,4.457,4.514%20c0,2.971-1.486,4.457-4.457,4.457S33.042,15.3,33.042,12.329z'/%3e%3c/g%3e%3c/g%3e%3c/svg%3e)
1. Introduction
The homogeneous distribution of heated particles in a fluid is one of the most fundamental operating conditions of numerous advanced engineering applications, such as particle solar receivers (Houf & Greif Reference Houf and Greif1987) and the combustion of metallic dust for propulsion (Goroshin, Higgins & Kamel Reference Goroshin, Higgins and Kamel2001). The uneven distribution not only generates temperature gradients in the continuum phase, but also results in non-uniform expansion of the gas (Pouransari et al. Reference Pouransari, Kolla, Chen and Mani2017). This happens because a higher concentration of particles in one region creates a dearth of particles in other regions. These areas of significant concentration can have a local particle number density up to sixty times higher than the global average (Squires & Yamazaki Reference Squires and Yamazaki1995). This is undesirable for thermal systems, as it can reduce the efficiency of particle–fluid heat transfer by up to  $25\,\%$ (Pouransari & Mani Reference Pouransari and Mani2017), and creates strong temperature fluctuations (Zamansky et al. Reference Zamansky, Coletti, Massot and Mani2016; Banko et al. Reference Banko, Villafañe, Kim and Eaton2020). These fluctuations grow further with the intensity of clustering (Zamansky et al. Reference Zamansky, Coletti, Massot and Mani2014). For particle combustion applications, grouping of particles can partially or even completely impede particle combustion in the centre of a cluster (Rahman et al. Reference Rahman, Saieed, Khan and Hickey2022). Such phenomena are evidently unacceptable for any thermal system, therefore efforts are made to have a homogeneous distribution of the particulate phase at all times.
Inertial particles are known to form clusters in a turbulent flow. This phenomenon is driven by particle (weight and size), fluid (density and viscosity) and turbulence characteristics (Sumbekova et al. Reference Sumbekova, Cartellier, Aliseda and Bourgoin2017). The competing effects of these parameters are accounted for in the particle Stokes number  $St$, which is often considered as the primary non-dimensional number governing particle clustering (Zhou, Wexler & Wang Reference Zhou, Wexler and Wang2001). Essentially,
 $St$ is the ratio of particle and fluid time scales, and is used to define particle behaviour in a turbulent flow ranging from tracer (very small particles, following closely the streamlines of the flow; Bec et al. Reference Bec, Biferale, Cencini, Lanotte and Toschi2006b) to ballistic particles (very heavy particles, passing easily through turbulent eddies; Njue et al. Reference Njue, Salehi, Lau, Cleary, Nathan and Chen2021; Nath et al. Reference Nath, Roy, Govindarajan and Ravichandran2022). Mathematically,
 $St$ is defined as (Crowe, Gore & Troutt Reference Crowe, Gore and Troutt1985)
 \begin{equation} St=\frac{\tau_p}{\tau}, \end{equation}
where  $\tau _p$ is the particle momentum response time scale, given as Stokes (Reference Stokes1851):
 \begin{equation} \tau_p=\frac{\rho_p d_p^2}{18\rho_f \nu_f}. \end{equation}
Here, subscripts  $p$ and
 $f$ denote the particle and fluid phases, while
 $d$,
 $\rho$ and
 $\nu$ are diameter, density and kinematic viscosity, respectively. Moreover, in (1.1),
 $\tau$ represents an appropriate time scale of the turbulent flow. This is because particles respond predominantly to different turbulence time scales based on their size/inertia, therefore particle clustering is scale-dependent (Eaton & Fessler Reference Eaton and Fessler1994). Additionally, in polydispersed flows, particles of different sizes collect in different regions of the flow (Saw et al. Reference Saw, Salazar, Collins and Shaw2012), and under similar conditions, different particle species have different accelerations (Dhariwal & Bragg Reference Dhariwal and Bragg2018). This suggests that particle clustering can be driven by any scale of the turbulent flow. However, integral
 $\tau _l$ (Khalitov & Longmire Reference Khalitov and Longmire2003) and Kolmogorov
 $\tau _\eta$ (Fessler, Kulick & Eaton Reference Fessler, Kulick and Eaton1994) time scales are most commonly used to characterise particle-laden flows (Dizaji & Marshall Reference Dizaji and Marshall2017). The expressions for
 $\tau _l$ and
 $\tau _\eta$ are
 \begin{gather} \tau_l=\frac{{(TKE)}^{3/2}}{\varepsilon u_{rms}}, \end{gather}
 \begin{gather}\tau_\eta=\left(\frac{\nu_f}{\varepsilon}\right)^{1/2}, \end{gather}
where  $u_{rms}$ is the root mean square of the fluid velocity,
 ${TKE}$ is the turbulent kinetic energy, and
 $\varepsilon$ is the turbulent kinetic energy dissipation rate.
The past literature agrees on the fact that particles with  $St\ll 1$ (tracer particles) and
 $St\gg 1$ (ballistic particles) do not show much clustering (Bec et al. Reference Bec, Biferale, Cencini, Lanotte, Musacchio and Toschi2007; Zaichik & Alipchenkov Reference Zaichik and Alipchenkov2007). Particles with
 $St \approx 1$, however, depict the maximum clustering (Eaton & Fessler Reference Eaton and Fessler1994). Albeit there are various explanations for this phenomenon, the most common among these is the preferential concentration or centrifugal effect, where inertial particles centrifuge out of vortices, local high-vorticity regions, and gather in local high-strain-rate regions, between vortices (Maxey Reference Maxey1987; Squires & Eaton Reference Squires and Eaton1991). On the other hand, enhanced particle clustering has been observed at
 $St$ much different from unity (Baker et al. Reference Baker, Frankel, Mani and Coletti2017), an observation that is difficult to reconcile with conventional clustering mechanisms. Yoshimoto & Goto (Reference Yoshimoto and Goto2007) argued that since turbulence is a multiscale phenomenon, clustering is inevitable provided that
 $\tau _\eta \leq \tau _p \leq \tau _l$; in this case, particles can exhibit considerable clustering at
 $St_\eta \neq 1$. They observed particle clustering at
 $St_\eta \gg 1$, where particles gathered at larger scales. A more accurate explanation is that the particles depict higher clustering at any scale with time scale
 $\tau ^*$, provided that
 $St=\tau _p/\tau ^* \approx 1$. Consequently, two
 $St$-based regimes were defined, where at
 $St < 1$, clustering is attributed to the centrifugal force (Squires & Eaton Reference Squires and Eaton1991), while at
 $St \geq 1$, clustering is due to a non-local temporal (history) effect (Bragg & Collins Reference Bragg and Collins2014). In the latter mechanism, particles carry the memory of having
 $St \approx 1$ in the past and then cluster at a later time when their
 $St$ is greater than unity.
The above stated mechanisms hold well for unheated particle-laden flows. However, when particles are heated, a feedback loop is created between particle clustering, local temperature variations and hydrodynamic forces (Zamansky et al. Reference Zamansky, Coletti, Massot and Mani2014). Even in this case, ignoring temperature-driven fluid viscosity maintains the validity of conventional clustering mechanisms. For example, Pouransari et al. (Reference Pouransari, Kolla, Chen and Mani2017) analysed turbulence modulation due to heated particles in decaying homogeneous isotropic turbulence (HIT) with constant viscosity. By focusing on the density-based variations, they observed maximum particle clustering at  $St \approx 1$, and consequently a higher uneven expansion of gas, which enhanced turbulence at the cluster (small) length scales. The gas expansion (decrease in local density) creates a divergent flow field that pushes the particles away from each other. This dilatation effect increases with particle loading, resulting in lower propensity for clustering. Pouransari & Mani (Reference Pouransari and Mani2018) investigated the influence of clustering on interphase heat transfer using direct numerical simulations (DNS). They reported that the mean particle-to-fluid heat transfer is a function of
 $St$, where
 $St \approx 1$ delivered the most inhomogeneous heat transfer. Rahmani et al. (Reference Rahmani, Geraci, Iaccarino and Mani2018) studied the influence of polydispersed particle-size distribution on preferential clustering and particle–fluid heat transfer characteristics in a fully two-way coupled channel flow. They attributed maximum clustering and inhomogeneous heat transfer to
 $St \approx 1$, even in polydispersed flow, which otherwise delivers superior dispersion and heat transfer compared to monodispersed particles. Pouransari & Mani (Reference Pouransari and Mani2017) also investigated the effect of particle clustering on heat transfer statistics in a channel flow. They reported that at maximum clustering (
 $St \approx 1$), the temperature fluctuation is up to
 $35\,\%$ of the average temperature rise. In all of these studies, higher clustering and its corresponding impact on turbulence and temperature statistics were attributed to
 $St \approx 1$. In fact, even in two-way momentum coupling, where particles can modulate turbulence considerably, the above
 $St$-based clustering characterisation holds (see e.g. Frankel et al. Reference Frankel, Pouransari, Coletti and Mani2016), if temperature-driven change in viscosity is neglected.
Note that under the constant viscosity assumption, the drop in density reduces the drag force on the particles. In practice, however, particle heating drops the density and increases the dynamic viscosity ( $\mu _f$) of the local gas, where viscous effects are expected to be much stronger than density effects. In our study, compared to the initial values,
 $\rho _f$ dropped by only
 $3.6\,\%$ (locally), while
 $\mu _f$ increased by approximately
 $60\,\%$ with the increase in temperature. The overall domain volume and density is constant, and this
 $3.6\,\%$ drop in
 $\rho _f$ refers to the local maximum change in
 $\rho _f$. This small decrease in local
 $\rho _f$ is due, in part, to the increase in domain pressure because of the triply periodic boundary condition. If the average domain pressure were constant, then the density would decrease proportional to the increase in temperature, while the viscosity would alter with a power law of temperature. Hence the effect of temperature-driven viscosity will remain a considerable factor. Additionally, the temperature-driven variation in viscosity is critical as it alters greatly the turbulent flow field and dynamics of the vortical structures (Zonta, Marchioli & Soldati Reference Zonta, Marchioli and Soldati2012). As per (1.2), the rise in
 $\nu _f$ alters
 $\tau _p$ considerably, which consequently changes the particles’
 $St$ number. In decaying turbulence – which is representative of turbulence in many engineering flows –
 $\tau _l$ decreases, while
 $\tau _\eta$ increases with time, which also affects the values of
 $St$. The compounding effects of these variations have a unique influence on particle clustering. Therefore, our primary focus is on the clustering originating from the increase in viscosity and the resulting rise in particle drag force.
In a recent analysis, we observed higher clustering in a heated bidispersed particle-laden flow when variable viscosity was used in comparison to constant viscosity cases (Saieed, Rahman & Hickey Reference Saieed, Rahman and Hickey2022). It was found that as the gas temperature-driven viscosity increased, the clustering of smaller particles increased even when their  $St$ based on the Kolmogorov scale (
 $St_\eta = \tau _p / \tau _\eta$) decreased from
 $0.65$ to
 $0.33$ – a trend opposite to the conventional assumption. This was surprising because an identical constant viscosity case with the evolution of
 $St_\eta$ from
 $1.1$ to
 $0.9$ showed lower clustering than in the aforementioned simulation. This counterintuitive behaviour cannot be elucidated even with the history effect, as particle clustering increased continuously, while
 $St_\eta$ kept declining below unity. We argued that this high clustering is the result of viscous capturing (VC), where a particle cluster prior to heating creates a viscous cloud around itself upon heating, which retains the already clustered particles and captures more particles as a result of the higher drag force on them.
Albeit VC is a compelling argument that explained adequately the deviation of particle clustering from the clustering predicted by  $St$ (maximum clustering is observed at
 $St \approx 1$), we made some simplifying assumptions to isolate the effect of temperature-dependent viscosity on particle dispersion. The most important among these is the one-way fluid–particle momentum coupling, where only the fluid exerted drag force on the particles, and consequently the particles could not resist the VC. Although this assumption has been used earlier (Carbone, Bragg & Iovieno Reference Carbone, Bragg and Iovieno2019), it is crucial to test VC in the regime where particle drag on the carrier fluid is non-negligible (two-way momentum coupling).
Analysing the turbulent energy spectrum in two-way coupling suggested that particles attenuate energy at low wavenumbers and augment it at high wavenumbers (Letournel et al. Reference Letournel, Laurent, Massot and Vié2020), and this effect enhances with the rise in particle number density (Hassaini & Coletti Reference Hassaini and Coletti2022). The increase in small-scale energy escalates  $\varepsilon$, the rate of energy transfer from the large to small scales,
 $l$ growth rate, and drops
 $\eta$ (Elghobashi & Truesdell Reference Elghobashi and Truesdell1993). Boivin, Simonin & Squires (Reference Boivin, Simonin and Squires1998) found that the
 ${TKE}$ dissipation increases with the increase in particle loading. By examining the exchange rate of fluid–particle energy, they reported that larger turbulent eddies drag the inertial particles, whereas particles drag the smaller eddies with them. Hence particles act as a sink at larger scales and a source at smaller scales, and this effect augments with the rise in particle loading. In a comprehensive review on particle-laden flows, Balachandar & Eaton (Reference Balachandar and Eaton2010) concluded that even in dilute particle-laden flows, turbulence modulation is prevalent as particles impart their kinetic energy on the fluid. Additionally, turbulence modification is also known to be maximum at
 $St \approx 1$ (Yang & Shy Reference Yang and Shy2005). In terms of particle size, Gore & Crowe (Reference Gore and Crowe1989) observed that smaller particles decrease
 ${TKE}$ as they are moved by the local fluid, whereas larger particles increase
 ${TKE}$ as they drag the fluid with them. The strength of this phenomenon also depends on the number of particles in the system.
Considering the discussion above, we are interested in characterising the effect of temperature-dependent gas viscosity on clustering at different particle loading densities, as the particles are heated rapidly to reach a temperature double their initial temperature. This analysis will bring out the prepotent impact of increasing drag force on the particle during heating, which has been greatly overlooked due to constant viscosity assumption. Here, particle–particle collisions were neglected and only drag force was taken into account. In this case, it is expected that the rise in drag force will correlate the kinematic and thermodynamic parameters of the particles and fluid inside a cluster.
By decreasing the global number of particles, we decrease the number of particles in each cluster/viscous cloud, and also reduce the particle clustering capacity (Aliseda et al. Reference Aliseda, Cartellier, Hainaux and Lasheras2002; Guo & Capecelatro Reference Guo and Capecelatro2019). This will help us to understand whether viscous clouds still form and capture particles when the local particle loading in each cloud drops and the particle–fluid heat transfer is reduced. We hypothesise that the rise in localised heating with particle loading density will enhance VC, despite the increase in particles’ ability to resist local viscous effects due to their reaction drag on the fluid. Furthermore, potentially, particle back-reaction force can also aid viscosity-driven clustering, as it reduces the local fluid velocity fluctuations, which in return drops the transfer of heat via turbulent fluid diffusion (Kuerten, Van der Geld & Geurts Reference Kuerten, Van der Geld and Geurts2011). Note that the parameters in this study are presented in arbitrary but consistent units. Thus present results can be interpreted in any consistent units system. This paper is structured such that § 2 states the computational set-up of this study, while simulation results are discussed in § 3. The conclusions drawn from the present analysis are outlined in § 4.
2. Methodology
In this study, DNS were conducted using a slightly modified version of the open-source, high-order finite difference code known as Pencil Code (Brandenburg et al. Reference Brandenburg2020). Three particle number densities were tested with two particle sizes (bidispersed particles); the numbers of large and small particles had a  $50:50$ ratio in each particle loading scenario. The radii of the two particle species were
 $0.0028$ and
 $0.0106$, which are identical to the test case Gas 2 of Saieed et al. (Reference Saieed, Rahman and Hickey2022). From here on, the two particle sizes will be referred to as small and large particles in the text. We employed bidispersed flow because we wanted to study the clustering characteristics of particles responding to different turbulence scales, without complicating further our simulations, which already involved particle heating, turbulence decay and heat diffusion. The global numbers of particles tested are
 $5 \times 10^5$ (similar to our previous study),
 $2.5 \times 10^5$ and
 $1.6 \times 10^5$. For conciseness, we will refer to these simulations as
 $\mathrm {L}_{5}$,
 $\mathrm {L}_{2.5}$ and
 $\mathrm {L}_{1.6}$, respectively. Here,
 $\mathrm {L}$ represents the loading, and the subscripts
 $5$,
 $2.5$ and
 $1.6$ are the multiples of
 $10^5$ in their respective loading numbers. We also simulated particle number densities
 $1.2 \times 10^5$ (
 $\mathrm {L}_{1.2}$),
 $0.5 \times 10^5$ (
 $\mathrm {L}_{0.5}$),
 $0.1 \times 10^5$ (
 $\mathrm {L}_{0.1}$) and
 $0.05 \times 10^5$ (
 $\mathrm {L}_{0.05}$). However, these simulations were not included in the main analysis (except for comparison in a few places) as it was found that below
 $\mathrm {L}_{1.6}$, particle clustering depends on Taylor-based Reynolds number (
 $Re_\lambda = u_{rms} \rho _f \lambda / \mu _f$, where
 $\lambda$ is the Taylor length scale) of the flow (see § 3.1). Note that the volume fraction (
 $\phi _p$) of the
 $\mathrm {L}_{5}$,
 $\mathrm {L}_{2.5}$ and
 $\mathrm {L}_{1.6}$ simulations is
 $O(10^{-3})$, which is just at the point where particle–particle collisions (
 $\phi _p > 10^{-3}$) become relevant (Elghobashi Reference Elghobashi1994). For simplification, we employed two-way momentum coupling. The volume fraction of
 $\mathrm {L}_{0.5}$ is
 $O(10^{-4})$, which is almost in the one-way coupling regime, but we also modelled it with two-way momentum coupling for consistency. We used a triangular-shaped cloud scheme, which employs second-order spline interpolation from 27 grid points for modelling fluid–particle interaction.
First, three base simulations were run with the same initial parameters but different particle number densities ( $\mathrm {L}_{5}$,
 $\mathrm {L}_{2.5}$ and
 $\mathrm {L}_{1.6}$). For the development of HIT, these simulations were carried out in a
 $2 {\rm \pi}^3$ periodic box, resolved into a
 $384^3$ grid with a solenoidal forcing function
 $F_i$ (Brandenburg Reference Brandenburg2001). We used a
 $384^3$ grid to interpolate particle motion accurately from the fluid, and keep the temperature gradient across each cell small and accurate. Likewise, the present forcing scheme is temporally delta-correlated in
 $k$ space, meaning that all the random forcing points are correlated at a particular time instance but vary between time steps.
These initialising simulations without particle heating were conducted for approximately five large eddy turnover times of the  $\mathrm {L}_{5}$ case. Here,
 $\mathrm {L}_{5}$ took the longest time to develop equilibrium between the large-scale energy addition and small-scale energy dissipation. The
 $\mathrm {L}_{5}$ simulation was also extended to ten eddy turnover times to ensure that the mean turbulence characteristics remain stable after five turnover times (not shown here). The instantaneous
 ${TKE}$ showed non-negligible oscillations about an average value even after five turnover times, which is a known problem in forced HIT in both spectral (Overholt & Pope Reference Overholt and Pope1998) and linear (Rosales & Meneveau Reference Rosales and Meneveau2005; Bassenne et al. Reference Bassenne, Urzay, Park and Moin2016) forcing. These temporal fluctuations, along with the fact that particle heating also adds energy to the flow, which could destabilise the simulations, were the reason why we did not use forced turbulence when running the particle heating simulations. Note that the forcing adds energy at the large scale, while particle heating adds energy at the particle/cluster scale. Here,
 $k_{max} \eta > 12$ was obtained, suggesting that the small scales are resolved fully (Pope Reference Pope2000).
These simulations solved the compressible Navier–Stokes equation, but we neglected the kinetic energy in the energy equation in order to decouple fluid velocity and temperature – only fluid internal energy is considered in the energy equation. This assumption is valid only in the low Mach number cases. This was verified in our  $\mathrm {L}_{1.6}$ case, in which the maximum local Mach number never exceeded
 $0.08$. Given the conservation of mass and the fixed volume of the triply periodic DNS domain, the mean gas density remained constant at
 $\rho _f = 1.08$ (prescribed value), but particle heating altered the local gas density in the vicinity of particles. After fully developed HIT was achieved, the artificial forcing was removed, allowing turbulence to decay, and particle heating was initiated. Of interest is the period of turbulence decay and particle heating over the first ten time units. Table 1 lists the turbulence characteristics at the beginning of the particle heating simulations. In table 1, the turbulent Reynolds number is defined as
 $Re = u_{rms} \rho _f l / \mu _f$. Here, the simulation set-up of all three base cases was identical, including the forcing function, but the difference in number of particles (due to two-way momentum coupling) resulted in the base simulations having slightly different turbulence characteristics.
Characteristics of the fully developed HIT.

The most critical turbulence characteristic in table 1 is the Taylor-based Reynolds number  $Re_\lambda$, as it determines the resolution of small scales and whether clustering is governed by a single or multiple turbulence scales (Coleman & Vassilicos Reference Coleman and Vassilicos2009). Ireland, Bragg & Collins (Reference Ireland, Bragg and Collins2016) stated that particle clustering is independent of
 $Re_\lambda$ for
 $St < 1$, which is the case in the present heating simulations, as discussed in § 3.4. However, for further assurance, we decreased
 $F_i$ in
 $\mathrm {L}_{2.5}$,
 $\mathrm {L}_{1.6}$,
 $\mathrm {L}_{1.2}$ and
 $\mathrm {L}_{0.5}$ to match the
 $Re_\lambda$ of
 $\mathrm {L}_{5}$, and compared clustering in the original and reduced
 $Re_\lambda$ cases. Since
 $Re_\lambda$ does not scale linearly with the forcing function, there was an approximate 5–10 % difference in the
 $Re_\lambda$ of the original and
 $Re_\lambda$ matched cases compared to
 $Re_{\lambda, {L}_5}$. But we will see in § 3.1 that only those particle loading densities were selected in which clustering is insensitive to
 $Re_\lambda$. Therefore, this difference of 5–10 % is considered trivial in these cases. Note that we opted to use identical forcing and overall simulation set-up in our test cases, based on
 $Re_\lambda$ independence analysis. Particle clustering was quantified with the radial distribution function (RDF), which counts the number of particles within a certain radial distance from a reference particle (for details, see Saieed et al. Reference Saieed, Rahman and Hickey2022). This analysis is explained in § 3.1. Note that the
 $l / \eta$ ratios of our lowest (
 $\mathrm {L}_5$) and highest (
 $\mathrm {L}_{1.6}$)
 $Re_\lambda$ cases are
 $41.8$ and
 $52.3$, respectively. Comparing these ratios with
 $Re_\lambda = 88$ of Ireland et al. (Reference Ireland, Bragg and Collins2016) (i.e.
 $l/\eta = 55.8$) suggests that despite the low
 $Re_\lambda$, our scale separation is adequate. Our mean energy spectrum
 $\overline {E(k)}$ in figure 5 also shows good resolution of the small scales, and we also obtained a
 $-5/3$ slope in
 $\overline {E(k)}$, albeit with shorter inertial range due to the two-way momentum coupling.
We employed a point-particle approach for both particle species in this analysis. For small particles, this is a straightforward choice, as for all the considered cases,  $d_p / \eta = O(10^{-2})$; typically, the point-particle method assumes
 $d_p / \eta \ll 1$. As per table 1, the ratio
 $d_p / \eta$ for
 $\mathrm {L}_5$ and
 $\mathrm {L}_{1.6}$ larger particles is
 $O(10^{-1})$. According to Balachandar & Eaton (Reference Balachandar and Eaton2010), for particles with
 $\rho _p > \rho _f$ and
 $d_p \approx O(\eta )$, a point-particle assumption can be used. Here,
 $\rho _p / \rho _f \approx 1400$ and the particle Reynolds number is
 $Re_p \leq 1$. Hence the use of a point-particle approach is justified.
Table 2 summarises the initial  $St$ values (prior to heating) of the present simulations. For this work, the smaller particles are defined by the Kolmogorov scale, as they are about
 $18$ times smaller than the Kolmogorov scale. Due to filtering effect (Bec et al. Reference Bec, Biferale, Boffetta, Celani, Cencini, Lanotte, Musacchio and Toschi2006a; Ayyalasomayajula, Warhaft & Collins Reference Ayyalasomayajula, Warhaft and Collins2008), larger particles will correspond to the integral scale, as they are about five orders of magnitude smaller than
 $\eta$. In two-way momentum coupling, the energy transfer from large to small scale has two routes: the classical energy cascade, and particles taking energy from the large scales and feeding it to the small scales. This affects the inertial scale (see figure 5), therefore it is plausible to assume that larger particles correspond primarily to the integral scale. Consequently,
 $St$ based on Kolmogorov scale (
 $St_\eta = \tau / \tau _\eta$) is used to characterise the smaller particles, and
 $St$ calculated from the integral scale (
 $St_l = \tau / \tau _l$) is used for larger particles, as shown in table 2. In the present case, the initial values of
 $St_\eta$ are different, since
 ${TKE}$ and
 $\varepsilon$ decrease with increasing particle loading (Boivin et al. Reference Boivin, Simonin and Squires1998). As clustering is maximum at the scale where
 $St$ (based on that scale) is unity, an increase in clustering can be observed at the integral scale. Thus we use
 $St_l$ for comparing simulations, as
 $\mathrm {L}_5$,
 $\mathrm {L}_{2.5}$ and
 $\mathrm {L}_{1.6}$ start with similar
 $St_l$.
Particle  $St_l$ and
 $St_\eta$ values at the start of heating simulations.

2.1. Continuum phase
The conservation equations of the carrier phase mass, momentum and energy are
 \begin{gather} \frac{\partial \rho_f}{\partial t} + \frac{\partial \rho_f u_i }{\partial x_i} = 0, \end{gather}
 \begin{gather}\frac{\partial \rho_f u_i}{\partial t} + \frac{\partial \rho_f u_i u_j}{\partial x_j} ={-} \frac{\partial p_f}{\partial x_i} + \frac{\partial \mu_f}{\partial x_j} \left(\frac{\partial u_i}{\partial x_j} + \frac{\partial u_j}{\partial x_i} -\frac{2}{3}\, \frac{\partial u_k}{\partial x_k}\,\delta_{ij}\right) + F_i + F_p, \end{gather}
 \begin{gather}\frac{\partial \left(\rho_f C_{v,f} T_f \right)} {\partial t} + \frac{\partial \left(\rho_f C_{p,f} T_f u_j \right)}{\partial x_j} = \frac{\partial}{\partial x_j} \left(k_f\,\frac{\partial T_f}{\partial x_j}\right) + Q_{pf}, \end{gather}
where  $T$,
 $p$ and
 $u_i$ are the temperature, pressure and gas velocity in the
 $i^{{\rm th}}$ direction, while the specific heats of the fluid at constant volume (pressure) and thermal conductivity are expressed as
 $C_{v,f}$ (
 $C_{p,f}$) and
 $k_f$, respectively. In (2.2),
 $F_p$ represents the local reaction force that the particles exert on the fluid, and thus accounts for the two-way fluid–particle momentum coupling. This force is opposite to the fluid drag on the particle and is given as
 \begin{equation} F_{p} = m_{p}\,\frac{u_p - u_f(x_p)}{\tau_p}, \end{equation}
where  $m_p$ and
 $u_p$ are particle mass and velocity, while
 $u_f(x_p)$ is the (disturbed) fluid velocity at the particle location
 $x_p$. As per the two-way coupling scheme,
 $u_f(x_p)$ should be the undisturbed fluid velocity at the particle location. This can affect the drag force prediction (Horwitz & Mani Reference Horwitz and Mani2016), and may require correction to the disturbed velocity for estimating the drag force. Horwitz & Mani (Reference Horwitz and Mani2018) proposed a regime diagram that can be used to determine if a model requires velocity correction. According to their
 $d_p/\eta = O(10^{-2})$ and
 $St_\eta = O(10^{-1})$, our smaller particles lie in the regime where a correction is not needed, while large particles may require correction, considering that their
 $d_p/\eta =O(10^{-1})$ and equivalent
 $St_\eta = O(10^0)$ lie on the borderline between two-way coupling correction and ‘other multiphase flow’ regimes. However, since the
 $St_\eta$ of our larger particles is small and decreases further with time (due to the increase in
 $\tau _\eta$ as the turbulence decays), velocity correction can be neglected without a considerable effect on the results.
Similarly, the expression for the temperature-dependent gas dynamic viscosity ( $\mu _{f}$) is
 \begin{equation} \mu_{f}=\mu_{f,0} \left(\frac{T}{T_0}\right)^{{2}/{3}}, \end{equation}
where subscript  $0$ stands for the initial/reference value. The initial kinematic viscosity was
 $\nu _{f,0} = 0.0034$, and the temperature of the base simulations was
 $T_0 = 273$.
2.2. Particulate phase
The Lagrangian equation set for the particles is given as
 \begin{gather} \frac{{\rm d}x_{p}}{{\rm d} t} = u_{p}, \end{gather}
 \begin{gather}\frac{{\rm d} u_{p}}{{\rm d} t} = \frac{C_D}{\tau_p}\,(u_{f}(x_{p}) - u_{p}), \end{gather}
where  $C_D$ is the particle drag coefficient, defined by the Schiller–Naumann equation (Schiller & Naumann Reference Schiller and Naumann1935)
 \begin{equation} C_D=1+0.15\,Re_p^{0.687}, \quad Re_p=\frac{d_p\,|u_{p} - u_{f}(x_p)|}{\nu_f}, \end{equation}
with  $Re_p$ the Reynolds number of the particles, and
 $|u_{p} - u_{f}(x_p)|$ the local fluid–particle drift velocity.
2.3. Particle heating model
We adopted the Mouallem & Hickey (Reference Mouallem and Hickey2020) particle heating model, which heats the particles externally and uniformly. The gaseous carrier phase is transparent to this heating, and absorbs heat from the particles via conduction (in the immediate vicinity of particles) and convection (gas far from particles). In this model, particle heating  $Q_p$ and particle-to-fluid heat transfer
 $Q_{p,f}$ terms are defined as
 \begin{gather} Q_p = m_p C_{p,p}\,\frac{T_{max} - T_p}{\tau_{heat}}, \end{gather}
 \begin{gather}Q_{p,f} = \frac{m_p C_{p,p}\,Nu}{2 \tau_{t}}\,(T_p - \hat{T}_p ). \end{gather}
In (2.9) and (2.10),  $m_p$,
 $C_{p,p}$ and
 $T_p$ are particle mass, heat capacity and temperature, respectively, whereas
 $\hat {T}_p$ is the undisturbed gas temperature at the particle position. Similarly,
 $T_{max}$ is the maximum particle temperature (prescribed as
 $600$) that can be attained via external heating. The particle heating time scale
 $\tau _{heat}$ was set to
 $1.0$ for rapid heating, and the particle-to-fluid heat transfer time scale
 $\tau _{t}$ was
 $10$ for fast heat transfer. It is worth mentioning that the heating is governed by the particle–fluid temperature difference, and the heat flux drops as the temperature of the fluid increases.
In (2.10), the particle–fluid Nusselt number is computed with the Ranz–Marshall correlation (Marshall & Ranz Reference Marshall and Ranz1952)
 \begin{equation} Nu = 2 + 0.6\,Re_p^{{1}/{2}}\,Pr^{{1}/{3}}, \end{equation}
where  $Pr$ is the Prandtl number.
3. Results
3.1. Verifying  $Re_\lambda$ independence

To verify if particle clustering – characterised by the RDF – is independent of  $Re_\lambda$ for our simulation set-up, we compare the cases with original
 $Re_{\lambda}$ and
 $Re_{\lambda}$ matched to
 $\mathrm {L}_{5}$ (
 $Re_{\lambda, {L}_5}$), as shown in figure 1. This comparison implies that clustering in
 $\mathrm {L}_{2.5}$ and
 $\mathrm {L}_{1.6}$ is independent of
 $Re_\lambda$, but we see a non-negligible difference in RDF plots of
 $\mathrm {L}_{1.2}$ and
 $\mathrm {L}_{0.5}$ smaller particles. This is plausible since higher
 $Re_\lambda$ generates more smaller scales in the flow, while the largest scale in the domain is restricted by the domain size. There is a slight difference between the original
 $Re_\lambda$ (solid lines) and
 $Re_\lambda = Re_{\lambda, {L}_5}$ curves of larger particles. However, since this difference is significantly less than the difference that we observe for the smaller particles of
 $\mathrm {L}_{1.2}$ and
 $\mathrm {L}_{0.5}$, we consider it negligible. This analysis is critical as it narrowed our comparison to
 $\mathrm {L}_{5}$,
 $\mathrm {L}_{2.5}$ and
 $\mathrm {L}_{1.6}$, where particle clustering is independent of
 $Re_\lambda$, and therefore prevented the erroneous comparisons of particle clustering with lower loading densities cases.
The dependence of particle clustering ( $RDF$) on
 $Re_\lambda$.

3.2. Particle heating
Considering the point-particle assumption, each particle has a uniform temperature (Biot number  $Bi \ll 1$). Using (2.11),
 $Nu$ was found to be less than
 $2.6$, which, according to the Ranz–Marshall expression, implies that conduction is the primary mode of heat transfer in the test cases. As heat conduction is a local phenomenon, it can enable/enhance other local phenomena such as thermal viscosity-driven clustering.
As a consequence of the rapid particle heating, it is expected that the particle and fluid will reach their maximum prescribed temperatures quickly, and the particle–fluid temperature difference will be small. This can be observed in figure 2(a), as the particle–fluid temperature difference drops to zero at approximately  $t=5$, which also implies that the increase in
 $\mu _f$ stops approximately at this time. Consequently, as per figure 2, at
 $t=1$ the particle–fluid temperature difference in
 $\mathrm {L}_5$ is about
 $1\,\%$, which increased to
 $30\,\%$ in
 $\mathrm {L}_{0.05}$ (not shown here). This suggests that the rate of increase in gas viscosity drops with the decrease in particle loading, which will hinder the development of the fluid viscosity-based clustering, as discussed later. The increase in particle–fluid temperature difference with the drop in loading density is due to the reduction in heat transfer to the carrier fluid at lower loading densities. We also included the normalised variance (
 $\sigma ^2$) of particle–fluid temperature difference in figure 2(b), which portrays a trend similar to the mean temperature difference. This suggests the absence of any significant local viscosity fluctuations, hence the fluid viscosity varies with the rise in fluid temperature.
(a) The average difference between particle ( $T_p$) and fluid (
 $T_f$) temperatures, and (b) the variance (
 $\sigma ^2$) of this temperature difference, normalised with the temperature at
 $t=0$ of heating (
 $T_0$).

3.3. Turbulence modulation
To quantify the effect of particle reaction drag force, the heating of different particle loadings, and the resulting change in viscosity on the underlying turbulence, we plot the evolution of the Taylor length scale in figure 3. Because the Taylor microscale bridges the energy transfer between the integral and Kolmogorov scales, it indicates the impact of different test conditions on turbulence. It is apparent that the decay rate of  $\lambda$ is similar in all the test cases; however, particle heating significantly raises
 $\lambda$ between
 $t=0$ and
 $2$. This can be justified with rapid particle heating, which increases
 ${TKE}$ of the flow via pressure-dilatation at scales comparable to the size of particle clusters (Pouransari et al. Reference Pouransari, Kolla, Chen and Mani2017). Therefore, the Taylor length scale augments as
 $\lambda = \sqrt {10 \nu _f {TKE} / \varepsilon }$. The rise in
 ${TKE}$ can also be witnessed in figure 4 in the form of a
 ${TKE}$ jump right after the onset of heating. Although this slight transience is short-lived, it produces strong and long-lasting effects on other parameters such as
 $\lambda$, as the added energy is then passed down to the smaller scales, imparting a prolonged influence on the corresponding turbulence parameters. The drop in particle loading reduces fluid–particle energy exchange (Elghobashi & Truesdell Reference Elghobashi and Truesdell1993; Boivin et al. Reference Boivin, Simonin and Squires1998) – the overall
 ${TKE}$ increases with the decrease in particle loading (Squires & Eaton Reference Squires and Eaton1990; Ling, Chung & Crowe Reference Ling, Chung and Crowe2000) – and also delays the increase in fluid temperature and viscosity, which then slows the rate of
 ${TKE}$ decay, as shown in figure 4. A critical take away here is that in comparison to non-heated (NH) cases, the difference in
 $\lambda$ between heating and
 $Re_\lambda = Re_{\lambda, {L}_5}$ cases is very small. This is another proof that the present comparison of
 $\mathrm {L}_{5}$,
 $\mathrm {L}_{2.5}$ and
 $\mathrm {L}_{1.6}$ clustering behaviour is valid.
The evolution of the normalised Taylor micro length scale ( $\lambda$). Here, NH represents non-heated simulations.

The temporal change in normalised  ${TKE}$.

Another important parameter depicting turbulence modulation by particles is the energy spectrum, as it determines the energy distribution among different turbulence scales. As discussed in § 1, in two-way momentum coupling, particles add energy to the small scales of turbulence at the expense of energy at the large scales (Letournel et al. Reference Letournel, Laurent, Massot and Vié2020), and this effect increases with increasing particle loading (Hassaini & Coletti Reference Hassaini and Coletti2022). Similar trends are observed in the mean energy spectrum,  $\overline {E(k)}$; see plots in figure 5. This figure presents the energy spectrum prior to particle heating (
 $t=0$), such that only particle loading influences the energy distribution among the turbulence scales. Moving from
 $\mathrm {L}_{5}$ to
 $\mathrm {L}_{0.05}$ shows the transition from the region where particle back-reaction is significant to where the particles stop enhancing energy of the smaller scales. Note that the inertial range in figure 5 is small (
 $\mathrm {L}_{5}$ to
 $\mathrm {L}_{0.5}$), which is due to two-way momentum coupling where fluid energy is also transferred from large to small scales via particles. Additionally, our low
 $Re_\lambda$ also caused the inertial range to be small.
The mean energy spectrum ( $\overline {E(k)}$) of the test cases at
 $t=0$ of heating, normalised with its initial value. The case
 $\mathrm {L}_{5,{\rm OWC}}$ is identical to the present
 $\mathrm {L}_{5}$, except with one-way momentum coupling (OWC).

3.4. Time scales and Stokes number
In decaying HIT, the integral time scale decreases monotonically, while the Kolmogorov time scale increases. Potentially, particle heating can alter this standard behaviour; however, present results are consistent with the classical trends despite the slight logarithmic curves of time scales, as depicted in figure 6. This is because for  $\tau _\eta$, as per (1.4), the increase in
 $\nu _f$ is divided by the rise in the
 ${TKE}$ dissipation rate (
 $\varepsilon =2 \nu _f\,|u_{i,j} u_{i,j}|$), while for
 $\tau _l$, the increase in
 $\nu _f$ decreases the velocity fluctuations (
 ${TKE}$), which according to (1.3) is divided by the increase in
 $\varepsilon$. On the other hand, in an incompressible flow without heating – constant
 $\nu _f$ and
 $\tau _p$ –
 $St_l$ and
 $St_\eta$ monotonically increase and decrease, respectively, as depicted by the NH curves in figure 7. But since
 $\nu _f$ in (1.2) is not normalised, our heating
 $St_l$ and
 $St_\eta$ curves depart from the conventional trends – variable
 $\tau _p$. Here,
 $St_\eta$ shows the greatest deviation due to smaller
 $d_p^2$, which is overpowered by the increase in
 $\nu _f$ in the denominator of the right-hand side of (1.2). Hence in the initial heating transient, when the viscosity rapidly changes with temperature,
 $St_\eta$ drops abruptly. It is clear overall that particle heating alters turbulence characteristics of the flow considerably, which should affect particle clustering characteristics.
The evolution of integral ( $\tau _l$) and Kolmogorov (
 $\tau _\eta$) time scales normalised with their initial values.

The temporal evolution of  $St_l$ and
 $St_\eta$ in the heating regime.

3.5. Clustering quantification
Looking at  $St_l$ and
 $St_\eta$, the main question is, does particle clustering adapt to the changes in
 $St$ and still portray maximum clustering at
 $St\approx 1$? As per figure 7, it is expected that the larger particles will show higher clustering, especially towards the end of the simulation, where
 $St_l$ approaches unity. An opposite trend is expected for smaller particles considering the evolution of their
 $St_\eta$. To test this, we computed the RDF of the three test cases as shown in figure 8. We also repeated these cases without heating, which shows particle clustering in the absence of thermodynamic changes in the fluid. Here, the clustering in NH cases can be explained by the history effect for larger particles and enhanced clustering at dissipative scales for smaller particles. In the absence of temperature-based viscous effects, the heating and NH RDF curves should overlap. We observe a dissimilar trend in figure 8 for
 $\mathrm {L}_{5}$ and
 $\mathrm {L}_{2.5}$. But before elucidating this, it is worth highlighting that the clustering pattern of small and large particles inverts from
 $\mathrm {L}_{5}$ to
 $\mathrm {L}_{1.6}$; larger particles show more clustering in
 $\mathrm {L}_{5}$, and small particles show greater clustering in
 $\mathrm {L}_{1.6}$. A similar trend was witnessed in Saieed et al. (Reference Saieed, Rahman and Hickey2022), where in Gas 1 and Liquid 1, larger particles depicted higher RDF than smaller particles, while an opposite pattern was observed in the other cases. This is a turbulence-driven effect (as discussed later), thus we are not concerned with whether smaller or larger particles show greater clustering. Our focus is on the increase in clustering – of either particle species – due to the increase in viscosity upon heating.
The RDF of small and large particles at even time steps.

Before analysing the heating results, we need to grasp the clustering pattern of each particle species prior to heating. We see that  $St_l$ and
 $St_\eta$ values at the start of the heating simulations are comparable as per figure 7. Thus both particle species should have similar clustering at the onset of heating. We observed this trend in
 $\mathrm {L}_{2.5}$ and weakly in
 $\mathrm {L}_{1.6}$, but not in
 $\mathrm {L}_5$. This is due potentially to the forcing scheme used, which adds energy to the flow at random locations, increasing the local velocity fluctuations and gradient. Towards the end of base simulations when
 $St_l$ and
 $St_\eta$ have approached their values at
 $t=0$ in figure 7, addition of energy would disperse the particles, potentially breaking clusters. The particles in test cases
 $\mathrm {L}_{2.5}$ and
 $\mathrm {L}_{1.6}$ have enough empty spaces to stay dispersed once a cluster breaks, before particles form new clusters. Hence they also show very low clustering at the start of heat (figure 8). The lack of large empty spaces in
 $\mathrm {L}_5$ results in the formation of a new cluster as one cluster breaks, resulting in higher clustering. However, even in this scenario, both particle species of
 $\mathrm {L}_{5}$ should depict similar initial RDF curves. This difference in initial clustering is due to the difference in drag force experienced by the two particle sizes. The drag force experienced by larger particles is on average about
 $O(10^1)$ higher than that of smaller particles. The random addition of
 ${TKE}$ pushes larger particles more, forcing them to disperse and then form clusters. Hence we cannot use
 $St_l$ and
 $St_\eta$ to delineate particle clustering at the onset of heating.
To this end, we evaluated the probability density function (PDF) of particle–particle relative velocity just prior to heating ( $t=0$), as illustrated in figure 9, to elucidate clustering at
 $t=0$ as particle clustering is a function of this relative velocity (Chun et al. Reference Chun, Koch, Rani, Ahluwalia and Collins2005; Bragg & Collins Reference Bragg and Collins2014). This PDF indicates the number of particles of each species possessing similar velocity. Therefore, a tighter PDF shows a greater clustering capability of a particle species. We see a good agreement between the PDF peaks and the initial RDF curves. For example, the PDF of
 $\mathrm {L}_{5}$ larger particles is higher than its smaller particles, while both species of
 $\mathrm {L}_{1.6}$ show similar PDF curves. On the other hand, relative velocity curves of small and large particles of
 $\mathrm {L}_{2.5}$ overlap perfectly.
The PDF of normalised particle–particle relative velocity at  $t=0$ of heating. Here,
 $n$ represents the
 $n$th particle.

Now that the initial clustering pattern of each particle species is understood, we can explain the VC by collating heating and NH RDF plots in figure 8. Comparing these curves of  $\mathrm {L}_{5}$ shows opposite trends in the two simulation sets, while the difference between these two simulations (heating and NH) decreases with particle loading. This highlights a crucial phenomenon that only well-formed clusters before heating establish VC upon heating, and the probability of cluster formation before heating dwindles with the reduction in particle loading. In the case of finite heating, the fluid reaches its maximum temperature and viscosity before the VC takes any dominant effect. Hence the difference between heating and NH simulations decreases with particle loading.
3.6. Viscous capturing
To elucidate further the RDF trends with the VC mechanism, we evaluated the mean particle–fluid drift velocity in regions with temperature one standard deviation higher than the average fluid temperature (hot regions, HR) –  $T_{HR} > \overline {T_f} + \sigma (T_f)$, where
 $\sigma$ is the standard deviation – in the heating simulations, as shown in figure 10. The strength of VC can be determined by the low local particle–fluid drift velocity in
 $T_{HR}$ regions as higher viscous drag on particles correlates the fluid and particle velocities. In figure 10, we see that not only do larger particles of
 $\mathrm {L}_{5}$ show the lowest drift velocity, but the drift velocity increases with the decrease in particle loading. Plausibly, lower particle loading results in more unoccupied fluid volume, where the fluid does not exchange energy with the particles, and consequently possesses higher
 ${TKE}$; see figure 4. This high-energy fluid disperses viscous clouds, therefore the local fluid velocity fluctuations at the particle location increase with the drop in particle loading, raising the drift velocity. Overall, the high RDF and low drift velocity in heated cases clearly suggest the important role of VC.
The temporal evolution of fluid–particle mean drift velocity ( $\overline {|u_p - u_f(x_p)|}$) in the hot regions, normalised with the Kolmogorov velocity (
 $u_{\eta } = \eta / \tau _\eta$).

A surprising observation in figure 10 is the monotonic decrease in  $\mathrm {L}_{5}$ and
 $\mathrm {L}_{2.5}$ drift velocities. In a turbulent flow – whether particles are clustered or unclustered – it is expected that particles experience finite spatial translation between consecutive time instances due to local fluid velocity variance, thus fluctuating drift velocity curves should have been observed. To highlight this, the drift velocity of
 $\mathrm {L}_{0.5}$ is also plotted in figure 10, which clearly validates this phenomenon. Minor fluctuations in
 $\mathrm {L}_{1.6}$ suggest only marginal VC at this particle loading. Additionally, on average the drift velocity of both particle species of
 $\mathrm {L}_{0.5}$ was approximately
 $2.5$ times higher than that of
 $\mathrm {L}_{5}$ particles, which further highlights the aforementioned relationship between VC and particle loading. It is worth mentioning that we do not take inter-particle collisions into account, which is a reasonable and common assumption based on the global particle loading considered. But particle loading in a cluster can be significantly higher than the global average, and as a result, inter-particle collisions can have negligible (reduced effect of particle–particle collisions due to increased viscosity) to detrimental (particles disperse after collisions) impact on VC. However, for a definitive conclusion, this requires further scrutiny of the VC mechanism with four-way momentum coupling.
Considering the particle–fluid drift velocity in figure 10, it is expected that the intensity of VC determines the particle–fluid velocity correlation in hot zones. To test this, we evaluated the distance correlation coefficient  $\boldsymbol {R}_{u_p, u_f(x_p)}$ between particle and fluid velocities in the hot zones, as depicted in figure 11. We observe good agreement between the drift velocity trends in figure 10 and
 $\boldsymbol {R}_{u_p, u_f(x_p)}$ values, where cases with low drift velocity result in higher correlation between particles and fluid velocities. Therefore, VC correlates the fluid–particle velocity in a cluster, and the intensity of VC determines the strength of this correlation.
The temporal evolution of the fluid–particle velocity distance correlation coefficient  $\boldsymbol {R}_{u_p, u_f(x_p)}$ in the hot zones.

3.7. Fluid–particle acceleration
The effect of fluid viscosity is reflected directly in the acceleration experienced by each particle species, as the viscous drag is the only force acting on the particles. Conventionally, smaller particles should adapt to the fluid acceleration, whereas larger particles should show a higher tendency to follow their own path due to their higher momentum. These trends can be seen in figure 12, where the negative values depict deceleration, while positive values represent acceleration. In this figure, acceleration was found by computing the difference in the mean velocity magnitude of each particle species between two consecutive time steps. The same procedure was repeated for the magnitude of the fluid acceleration at the particle location. As expected, smaller particles adapt rapidly to the fluid deceleration and readjustment to the evolving drag force, which attenuates very slowly; see figure 13. In contrast, initially larger particles accelerate due to their much higher drag coefficient (figure 13), which forces them to adapt to the local fluid with a high velocity variance. Recall that the fluid is faster than the particles; as in the base simulations, we forced the fluid to energise the particle motion. On the other hand, as the mean particle drag coefficient ( $C_D$) dwindles, particles transition from an accelerating to a decelerating regime after
 $\mu _f / \mu _0 = 1.4$ (figure 13). The increase in large particle deceleration is in the order
 $\mathrm {L}_{5} < \mathrm {L}_{2.5} < \mathrm {L}_{1.6}$, exactly opposite to the VC effect in the three test cases. This is because the difference in the acceleration of large particles and
 $\overline {a_f(x_l)}$ of
 $\mathrm {L}_{5}$ is much smaller than in other cases; in fact, its acceleration curve is almost a plateau at zero. Hence the
 $\mathrm {L}_{5}$ larger particles are well correlated with the local fluid acceleration and are travelling spatially with the same fluid at their location.
The temporal evolution of mean small and large particle acceleration magnitude. The local fluid acceleration at small ( $\overline {a_{f}(x_\eta )}$) and large (
 $\overline {a_{f}(x_l)}$) particle locations is also provided for comparison. Note that these curves are non-normalised.

The behaviour of the mean particle drag coefficient  $C_D$ with respect to the normalised dynamic viscosity.

The continuous adaptation of the acceleration of small particles to the fluid suggests that they are taking energy from the fluid, while the continuous rise in the deceleration of  $\mathrm {L}_{2.5}$ and
 $\mathrm {L}_{1.6}$ larger particles indicates that they are adding energy to the fluid – as per the classical behaviour (Gore & Crowe Reference Gore and Crowe1989). To confirm this, the difference in the mean turbulent kinetic energy (
 $\overline {{TKE}(x_\eta ) - {TKE}(x_l)}$) at the location of small and large particles is computed in figure 14. According to convention, the turbulent kinetic energy at the location of the larger particles should be greater than that of their smaller counterparts. Here, only
 $\mathrm {L}_{5}$ shows an unconventional trend. This is possible only if the particles do not add energy to the fluid, and follow the fluid according to figure 10. In other words, apart from altering particle clustering behaviour, VC also impacts the turbulence modulation by particles.
The temporal evolution of normalised difference in mean  ${TKE}$ at the positions of small (
 $x_\eta$) and large (
 $x_l$) particles.

3.8. Particle distribution
3.8.1. Strain rate and vorticity
It was found in one-way momentum coupling that particles of different sizes congregate in a range of strain rate ( $S$) and vorticity (
 $\varOmega$) zones; see figures 14 and 15 of Saieed et al. (Reference Saieed, Rahman and Hickey2022). In two-way coupling, we expect the local
 $S$ and
 $\varOmega$ fluctuation to be damped by the particles as
 $S$ and
 $\varOmega$ are the symmetric and skew-symmetric parts of
 $\boldsymbol {\nabla }\boldsymbol {u}$, respectively. Furthermore, the extent of local increase in viscosity also determines the attenuation in local
 $S$ and
 $\varOmega$. We see this phenomenon in figure 15, which presents the temporal distribution of particles in different
 $S$ and
 $\varOmega$ regions. Similar to the previous plots,
 $\mathrm {L}_{5}$ shows opposite trends compared to
 $\mathrm {L}_{2.5}$ and
 $\mathrm {L}_{1.6}$, where its larger particles are sampling low
 $S$ and
 $\varOmega$ regions. Enhanced clustering of
 $\mathrm {L}_{5}$ larger particles produces a higher attenuation of
 $S$ and
 $\varOmega$. The extent of VC also causes the particles to reside temporally in the same local fluid (inside a viscous cloud), resulting in particles’ local
 $S$ and
 $\varOmega$ values dropping with time. If the particles were not captured and restrained in local high viscosity regions, then a particle cluster would disintegrate in
 $t = O(\tau _\eta )$ (Liu et al. Reference Liu, Shen, Zamansky and Coletti2020). In fact, even if a cluster experiences partial disintegration, the curves in figure 15 would display many more fluctuations; the separating particles would reside in different
 $S$ and
 $\varOmega$ regions at adjacent time steps. This trend can be seen in the
 $\mathrm {L}_{0.5}$ plots.
The normalised differences in the number of small ( $N_\eta$) and large (
 $N_l$) particles in different (a,c,e,g) strain rate
 $S$ and (b,d,f,h) vorticity
 $\varOmega$ regions at even time steps.

Based on the understanding of preferential concentration (Squires & Eaton Reference Squires and Eaton1991), as  $St_l$ approaches unity, the larger particles should move into high
 $S$ and low
 $\varOmega$ regions, while as
 $St_\eta$ drops further below unity, smaller particles should reside in high
 $\varOmega$ regions. We do not see this in figure 15. This is because the explanation above applies to the local maxima and minima of
 $S$ and
 $\varOmega$, but we present particle number densities in a global (computed over the entire domain) context. The main observation here is that the local viscous effects influence particle behaviour greatly in the fluid, and cause them to sample globally certain
 $S$ and
 $\varOmega$ regions depending upon the strength of VC. Albeit the local sampling of inertial particles in high
 $S$ (low
 $\varOmega$) regions is a plausible explanation of particle clustering in unheated cases, VC can cause particles to remain captured temporally in different
 $S$ and
 $\varOmega$ regions of the domain. Therefore, this global description of particle location can be critical for thermal applications of particle-laden flows, although it requires further testing in continuous flow scenarios such as channel flow.
3.8.2. Cluster identification
To identify individual particle clusters in the flow, we employ a method known as density-based spatial clustering of application with noise (DBSCAN) (Ester et al. Reference Ester, Kriegel, Sander and Xu1996), which is an unsupervised machine learning algorithm. Similar tools have been applied successfully to a posteriori analysis in a variety of turbulent flows (Fan et al. Reference Fan, Xu, Yao and Hickey2019; Younes et al. Reference Younes, Gibeau, Ghaemi and Hickey2021; Zhang, Rival & Wu Reference Zhang, Rival and Wu2021). We chose DBSCAN for this analysis because of its ability to localize particle clusters spatially, where it identifies particles in each cluster and labels them separately. This aids greatly in conducting other statistical analyses on the clustered particles, as shown later in this section. Furthermore, the DBSCAN method is similar theoretically to the RDF that we used earlier, in §§ 3.1 and 3.5, as it also counts the number of particles at a certain distance from a reference particle, as discussed below.
The DBSCAN method identifies regions of high particle density by segregating data into core and noise points based on two parameters: inter-particle distance  $\epsilon$, and minimum number of neighbouring particles
 $N_\epsilon$ required to form a cluster. Here,
 $N_\epsilon$ or more particles at a distance
 $\epsilon$ from a core particle belong to a cluster, while the other particles are noise points and are considered unclustered. Note that
 $\epsilon$ and
 $N_\epsilon$ are input parameters and require careful estimation, as cluster identification is highly sensitive to these parameters. Determining
 $N_\epsilon$ is straightforward, as typically it is taken as twice the number of considered data dimensions (Sander et al. Reference Sander, Ester, Kriegel and Xu1998). For example,
 $N_\epsilon = 6$ for a three-dimensional (3-D) data set. The estimation of
 $\epsilon$ on the other hand, is slightly complex as it requires a good understanding of the data and some experience with the DBSCAN method. For finding
 $\epsilon$, a
 $k$-distance plot is required, which binds the particles based on their minimum distance from the nearest neighbour. This plot has a characteristic elbow shape, and the prevailing idea is to take
 $\epsilon$ equal to the inflection point on the curve.
In light of the above discussion, we take  $N_\epsilon =6$ for our 3-D snapshots. Next, we computed the species-specific
 $k$-distance plots for all test cases that resulted in
 $\epsilon$ as shown in table 3. Note that our
 $k$-distance plots exhibited two inflection points, which is normal. As per the DBSCAN guideline, we chose the smallest
 $\epsilon$ values.
Particle species-specific values of  $\epsilon$ for cluster identification in 3-D snapshots.

Returning to § 3.5, there is still an unanswered question: why is the clustering of  $\mathrm {L}_{5}$ smaller particles (RDF curves) not evolving temporally, despite sharing the domain with
 $\mathrm {L}_{5}$ larger particles showing strong VC? In the other two test cases, this can be attributed to weaker VC. Furthermore, the reasonably high RDF at
 $t=2$ also implies that
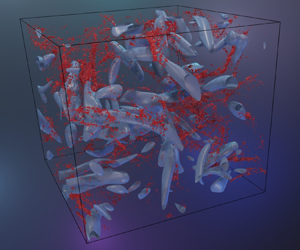
 $\mathrm {L}_{5}$ smaller particles are clustered prior to heating, a prerequisite for VC. To answer this, we estimate the distribution of clusters using DBSCAN in the 3-D domain. We also extracted two-dimensional (2-D) slices from the 3-D clustering snapshots, and mapped them on 2-D temperature contours at the centre of the domain. These are illustrated in figure 16. Visualising the 3-D snapshots shows that, albeit
 $\mathrm {L}_{5}$ smaller particles are clustered, such clusters are much smaller and well-distributed in comparison to
 $\mathrm {L}_{5}$ larger particles. Such small clusters can be witnessed in all other 3-D snapshots. This indicates that in addition to well-formed clusters, VC also requires large unevenly distributed clusters in the domain. It can be seen that the clusters are not exactly in the shape of a cloud. In fact, they are elongated in the shape of tubes/threads similar to caustics of suspended particles (Wilkinson & Mehlig Reference Wilkinson and Mehlig2005), as they are confined by a virtual boundary of a sharp temperature gradient called a front (Bec, Homann & Krstulovic Reference Bec, Homann and Krstulovic2014), as depicted by the 2-D contours of figure 16.
Cluster identification using the DBSCAN method at  $t=2$ of heating. The 3-D snapshots represent the overall distribution of clusters in the domain, whereas the 2-D slices show the normalised temperature (
 $\acute{T}_{f} = T_f / T_{f, max}|_{t=2}$, where
 $T_{f, max}|_{t=2}$ is the maximum fluid temperature at
 $t=2$) and clusters distribution in 2-D slice of depth
 $5\eta$ computed at the centre (
 $x=0$) of the box domain. Here, each particle cluster is identified with a different colour, and unclustered particles are removed.

In a fluid domain, particles with vastly different history paths can assemble in a region. In the absence of any external factor, such as heat, these particles carry their history even in shared space. This implies that the distribution of particle velocity in a cluster should be similar to particle velocity distribution in the entire domain. We see this trend in smaller particles as per figure 17, yet a much tighter PDF is obtained for  $u_{p,c}$ of larger particles. These particles inside a cluster have similar and the highest temperature in the domain (see figure 18), which correlates the particle velocity field via increased drag. In these figures, the peak velocity and temperature PDFs of clustered larger particles are approximately
 $1.4$ and
 $2$ times higher than the PDF of the entire domain. Thus VC greatly overpowers the particle history path, forcing the particles to remain in a hot zone. Figures 17 and 18 also suggest that the difference between the global and clustered particles’ velocity and temperature PDFs drops as the particles loading decreases.
The PDFs of normalised particle velocity ( $u_p$) and clustered particle velocity (
 $u_{p,c}$).

The PDFs of normalised particle temperature in the entire domain ( $T_p$) and in clusters (
 $T_{p,c}$) at
 $t=2$ of heating, where
 $T_{max}$ is
 $600$. Only one time step is shown as a similar distribution is obtained at other time steps.

Next, we want to test if VC retains particles over time. Inherently, the particle history should vastly alter the number of particles per cluster in the absence of VC. For assessing this notion, we computed the average number of particles in a cluster per cluster length as demonstrated in figure 19. Similar to figure 10, the temporal fluctuation increases as the VC effect loses its strength from  $\mathrm {L}_{5}$ to
 $\mathrm {L}_{1.6}$. We also note that the number of particles per cluster increases significantly due to VC. Hence it is clear from the discussion in this section that the control of temperature-driven viscosity on particle clustering is a strong function of particle loading density.
The average number of particles in a cluster per cluster characteristic length ( $L_c$). Here,
 $N_{p,c}$ and
 $N_c$ are the number of clustered particles and number of clusters in the domain, respectively.

3.9. Mathematical interpretation of VC
Considering the significance of thermoviscous effects on the turbulence and particle dispersion, another scientific question is why  $St$ and particle clustering do not evolve together, since
 $St$ already accounts for
 $\mu _f$. This is because
 $\tau _p$, and consequently
 $St$, accounts for the instantaneous
 $\mu _f$, but it does not consider the spatial and temporal change in
 $\mu _f$. As established in this study, the changes in
 $\mu _f$ and the corresponding effects on the particles and fluid turbulence play a critical role in governing particle clustering. Thus we propose a mathematical explanation to account for VC in heated systems. Recall that VC is tied to the ability of higher-viscosity gas to capture and retain particles passing through it. This ability is tied to the drag force, which is enhanced within the viscous region, and is linked directly to the particle acceleration. Therefore, if we substitute particle relaxation time scale (1.2) into the equation of Lagrangian particle motion (2.7), we get
 \begin{equation} \frac{{\rm d} u_{p}}{{\rm d} t} = \frac{C_D 18 \mu_f}{\rho_p d_p^2}\,(u_{f} (x_{p}) - u_{p}). \end{equation}
Here,  $C_D$ has a weak dependence on fluid viscosity (and thus temperature) and can, for mathematical tractability, be assumed constant in the present analysis.
Noting the power-law form of the viscosity (2.5), we can write
 \begin{equation} \frac{{\rm d} u_{p}}{{\rm d} t} = \frac{C_D 18}{\rho_p d_p^2}\,\Delta u\,\mu_0 \left(\frac{T}{T_0} \right)^{{2}/{3}}, \end{equation}
where  $\Delta u = u_{f} (x_{p} ) - u_{p}$. We can now separate the purely hydrodynamic component, denoted as
 \begin{equation} F_{hydro} = \frac{C_D 18}{\rho_p d_p^2}\,\Delta u\,\mu_0. \end{equation}
This component is related to the particle drag force without variable viscosity effect. The term is modified by the coefficient of VC ( $\varphi$):
 \begin{equation} \varphi = \left(\frac{T}{T_0} \right)^{{2}/{3}}. \end{equation}
Here,  $T$ is the fluid temperature in the vicinity of a particle. Therefore, the equation of Lagrangian particle motion can be expressed as
 \begin{equation} \frac{{\rm d} u_{p}}{{\rm d} t} = \varphi\,F_{hydro}. \end{equation}
As shown earlier, viscosity-driven clustering is tied to a higher  $\varphi$. To verify this, we compute the coefficient
 $\varphi$ for the fluid at the locations of the clustered (
 $\varphi _c$) and unclustered (
 $\varphi _{uc}$) particles. We plot the PDF of their difference at
 $t=2$ in figure 20. Since the numbers of clustered and unclustered particles can vary at each time step, and we are concerned primarily with
 $\varphi _c$, we subtracted the mean coefficient of unclustered particles (
 $\overline {\varphi _{uc}}$) from that of clustered particles. The peak and spread of the PDF (
 $\varphi _c - \overline {\varphi _{uc}}$) matches our previous plots, where
 $\mathrm {L}_5$ larger particles show more VC than their small particle counterparts, and this trend inverts slowly in lower particle loading numbers. Note that this difference in
 $\varphi _c$ and
 $\varphi _{uc}$ accounts for the spatial change in temperature-based viscous effects, while
 $T$ in the numerator in (3.4) increases with time due to particle heating.
The PDFs of  $\varphi _c - \overline {\varphi _{uc}}$ at
 $t=2$.

We acknowledge that this formulation of  $\varphi$ is very simplistic and assumes
 $C_D$ constant, which is not true in practice. However, it demonstrates adequately the VC trends in agreement with the RDF of the present particle loading densities. A comprehensive mathematical model of
 $\varphi$ warrants a more thorough testing of thermoviscous effects on particle dispersion, especially with higher Reynolds number simulations. We leave this for future analysis.
4. Conclusion
A fully two-way coupled DNS study of particle-laden, decaying HIT is conducted to test the effect of particle number density on temperature-dependent viscosity-based particle clustering. For this, a power-law model was used for specifying temperature-dependent gas viscosity, and two particle species were used for three cases with different particle loading numbers. The particle–fluid interactions were two-way coupled in both momentum and energy. It is observed that the particle loading determines the strength of VC. Since higher loading density enhances the change of cluster formation before heating and also the local particle number density inside a cluster, it governs the fluid viscosity-based clustering. Depending on the strength of the VC, a particle species can deviate considerably from its conventional clustering behaviour. Similarly, particle loading has a significant influence on the energy distribution between the turbulence scales. Higher particle loading density alters substantially the energy spectrum by transferring energy from the integral scales to the dissipative scales via particles, which shrinks the Taylor microscale. Higher particle loading also decreases local fluid velocity fluctuations, which aids in the retention of VC.
The global sampling of particles in distinct  $S$ and
 $\varOmega$ regions is also a strong function of particle loading and consequently the extent of VC. The particles captured viscously reside in the same local fluid within a viscous cloud over time, and therefore
 $S$ and
 $\varOmega$ at particle locations dwindle temporally. Hence the increasing fluid viscosity can stabilise considerably the global distribution of particles in distinct
 $S$ and
 $\varOmega$ regions, and in this case the particles appeared to be temporally stuck in these regions. This global
 $S$ and
 $\varOmega$ based distribution of particles is critical as it outlines the high and low particle concentration regions during turbulence decay. Finally, we visualised individual particle clusters in the 3-D domain with the DBSCAN method, which expanded further the requirement of preformed clusters prior to heating for VC to be noticeable. We found that the preformed clusters must be large in size and unevenly distributed. Small clusters might themselves be distributed somewhat evenly in the domain, albeit particles are distributed inhomogeneously. Thus they do not produce the same high local viscosity effect and cannot be captured or retained as particles in large unevenly distributed clusters. We also applied the temperature and velocity based conditional sampling on the clusters, and found that the thermodynamic and kinematic parameters of the particles are greatly correlated inside clusters. This phenomenon also increased with the rise in particle loading density.
Phenomenologically, VC will take effect only if particles receive an even amount of heat regardless of their location (inside or outside the cluster), which is the case here. But if particles experience a shadowing effect, which is a considerable factor in radiative heating (Frankel, Iaccarino & Mani Reference Frankel, Iaccarino and Mani2017; Banko et al. Reference Banko, Villafañe, Kim, Esmaily and Eaton2019), then the temperature inside a particle cluster would be lower than the temperature at the periphery of the cluster. In such a case, a particle cluster will not be able to create a strong viscous cloud. Hence, VC is not expected to be a dominant factor – even if observed at all – in controlling particle distribution in radiative heating. Also note that there was no heat conduction between particles due to uniform particle heating and the fast particle heating time scale (based on the heating model of Mouallem & Hickey Reference Mouallem and Hickey2020), and the inter-particle collisions were neglected. The presence of these effects might affect VC considerably.
In systems where the aforementioned conditions of higher particle number density and uniform particle heating are met, particles will show notably higher clustering and unconventionally modulate turbulence. This can be substantially detrimental for applications such as particle solar receivers, combustion of nanothermites in satellite engines, and thermal spray coatings, etc. Furthermore, since viscous clouds can restrain particles, in extreme cases, particles might be restricted spatially in certain regions of the flow. However, this hypothesis requires further scrutiny in a continuous flow scenario.
Funding
This research was supported by the computational resources of Sharcnet, SciNet and the Digital Research Alliance of Canada (previously known as Compute Canada). A.S. was supported by the NSERC Vanier Canada Graduate Scholarship award.
Declaration of interests
The authors report no conflict of interest.
Appendix. Mesh independence study
To verify that the present results are not grid resolution dependent, we repeated the base and heated simulations of  $\mathrm {L}_{5}$ with a mesh of
 $512^3$, as shown in figure 21. It can be seen that the dependence of both HIT development and heating simulations on grid resolution is almost negligible.
The normalised mean energy spectrum ( $E(k)$) at the end of the
 $\mathrm {L}_{5}$ base case (
 $t = 5 \tau _l$), and at the end of the
 $\mathrm {L}_{5}$ heating simulation (
 $t=10$).


 Open access

