I. INTRODUCTION
Lanthanum strontium cobalt ferrite, La0.6Sr0.4Co0.2Fe0.8O3 (LSCF), has been widely used as a solid oxide fuel cell (SOFC) cathode. Due to partial substitution of strontium (Sr) for lanthanum (La) and reduction of transition metals, it has a substantial oxygen vacancy concentration at high temperatures, and therefore exhibits high ionic and electronic conductivity resulting in low SOFC cathode polarization. Long-term stability is also an important requirement for the commercialization of SOFCs. However, Simner et al.Reference Simner, Anderson, Engelhard and Stevenson1 measured power density of anode-supported cells utilizing LSCF cathodes and observed decreased cell performance with time at 750 °C. Similarly, Tietz et al.Reference Tietz, Mai and Stover2 reported degradation of LSCF cathode-based cells during long-term testing.
Several studies report that Sr in LSCF tends to segregate to electrode surfaces or interfaces.Reference Simner, Anderson, Engelhard and Stevenson1, Reference Bucher and Sitte3–Reference Viitanen, von Welzenis, Brongersma and van Berkel5 As a result, the transition metal concentration was found to substantially decrease in the outermost surface layers. It is generally believed that B-site transition metals play a critical role for catalytic activity of ABO3 perovskite materials,Reference Tanaka and Misono6–Reference Shimizu9 and heterogeneous interaction is primarily determined by surface composition and structure.Reference Henrich10 Consequently, the formation of Sr-enriched layers on LSCF surfaces is a potential degradation mechanism for LSCF cathode-based cells.
Thus, the development of LSCF SOFC cathodes requires an understanding of Sr surface enrichment behavior. In the work presented herein, surface chemical compositional changes of LSCF at high temperatures were investigated by Auger electron spectroscopy (AES) and transmission electron microscopy (TEM). Dense and polished LSCF samples were examined to clearly identify surface morphological changes.
II. EXPERIMENTAL
A. Sample preparation
A dense LSCF sample was prepared for analysis by uniaxially pressing La0.6Sr0.4Co0.2Fe0.8O3-δ powder (Praxair Specialty Ceramics, Woodinville, WA) and sintering the pellet at 1400 °C for 4 h in air. The sintered body was cut and then polished with a series of SiC abrasive papers and diamond abrasives (Leco, St. Joseph, MI) down to 1 μm. All samples were cleaned with deionized (DI) water and acetone before heat treatments. Final sample thicknesses were around 1 mm.
B. Heat treatment
Samples were located on a quartz plate in the middle of a quartz reactor, and exposed to stagnant air between 600–900 °C. As K-type thermocouples (TC) could be a source of Cr contamination, the thermocouple was placed outside of the quartz reactor. Heat treatment was conducted for 50 and 100 h in air, and heating and cooling rates were established at 5 °C/min. LSCF was also heat-treated in N2 and 0.1% O2 for 50 h at 800 and 890 °C. Gas flow rates were controlled by MKS mass flow controllers (Andover, MA) and the total flow rate fixed at 10 standard cubic centimeter per minute (SCCM).
C. Post-heat-treatment characterization
The morphological and compositional changes were characterized using scanning electron microscopy (SEM; JSM 6335F, JEOL, Peabody, MA) combined with energy dispersive spectroscopy (EDS, Oxford, UK). ZAF correction is used for semiquantitative analysis, where Z is the atomic number, A is the absorption correction factor, and F is the fluorescence correction factors. The cross-sectional specimen of the precipitate, which was formed on the surface region after heat treatment, was prepared by focused ion beam (FIB; FEI Strata DB235, FEI, Hillsboro, OR) and analyzed using transmission electron microscopy (TEM; JEOL 2010F, JEOL, Peabody, MA) and EDS.
Surface chemical composition of LSCF before and after heat treatment was measured using Auger electron spectroscopy (AES; AES Perkin-Elmer PHI 660, Perkin-Elmer, Waltham, MA). The accelerating voltage was 10 kV and the scanned energy ranges were between 50 to 2050 eV, which covered the characteristic peaks of LaMNN (625 eV), SrLMM (1649 eV), Co (775 eV), FeLMM (703 eV), and OKLL (510 eV). These characteristic peaks were selected for minimizing interference with each other. Obtained AES spectrum was differentiated, and elemental atomic percentages were calculated based on the differentiated data using AugerScan 3.2.0 software (RBD Instruments, Bend, OR). The atomic percentages were calculated according to
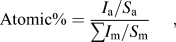
where I is the peak intensity and S is the relative elemental sensitivity factor for the Auger line used. Relative sensitivity factors, which are provided by RBD instruments, are 0.06, 0.045, 0.19, 0.13, and 0.35 for LaMNN, SrLMM, FeLMM, CoLMM, and OKLL, respectively. Due to small size of precipitates, it is difficult to distinguish the composition of the precipitates from the surrounding area using AES. Thus, the AES data are the area average of the entire surface in that region. The relative changes, based on the ratio of atomic percentages before and after heat treatment, were normalized by lanthanum (La). The enrichment factor was calculated according to

X-ray diffraction (XRD) patterns of the samples before and after heat treatment were measured (Philips APD 3720, Philips, Eindhoven, Netherlands) with Cu Kα radiation (λ = 1.54 Å). Low-angle mode XRD (Philips MRD X’Pert System) was applied for analyzing the structural variation of the surface region.
III. RESULTS AND DISCUSSION
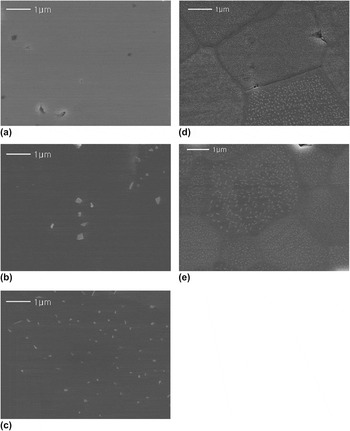
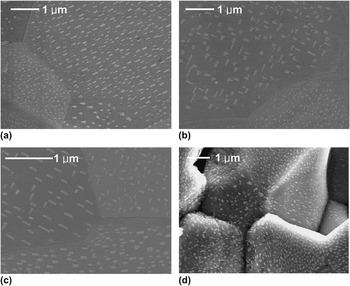
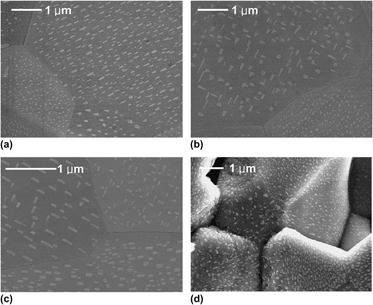
In Fig. 1 are representative SEM micrographs of the LSCF surfaces before and after heat treatment in air. Before heat treatment, LSCF exhibited dense and flat surfaces as shown in Fig. 1(a). However, after heat treatment, submicron precipitates were formed on the surfaces. These precipitates were more pronounced and exhibited higher areal density with increasing heat-treatment temperatures ranging between 600 and 900 °C. Interestingly, in the figure, the precipitates were not formed along the grain boundaries but on grain surfaces at 800 and 900 °C. The magnified images in Fig. 2 show more clearly the shapes of the precipitates, which are different from grain to grain. The typical shapes of precipitates are rods, triangles, or irregular polygons. For the rod type, the direction of the precipitate was either well-aligned in one direction or vertically crossed. The precipitates were found not only on polished surfaces but also on unpolished surfaces as shown in Fig. 2(d). The precipitates align directionally along the facets of the grains, and indicate that the formation of precipitates corresponds to the surface orientation of the underlying grains. The characteristic of the rod-type precipitates is close to the Widmanstatten morphology, of which an incoherent curved interface exhibits a fast growth rate while a semicoherent facet has slower growth.Reference Porter and Eastering11 However, the formation of precipitates observed in this study is different from the Widmanstatten morphology in that the precipitates grow out of the surface.
SEM micrographs of LSCF of (a) before heat treatment and after heat treatment at (b) 600 °C, (c) 700 °C, (d) 800 °C, and (e) 900 °C for 50 h. All images are of the same scale.

Magnified images of the precipitates on LSCF surfaces after heat treatment at (a) 900 °C for 50 h, (b) 900 °C for 50 h, (c) 860 °C for 100 h, and (d) 890 °C for 100 h. (a)–(c) are polished surfaces while (d) is an unpolished surface. (a) and (b) show different location of the same sample.

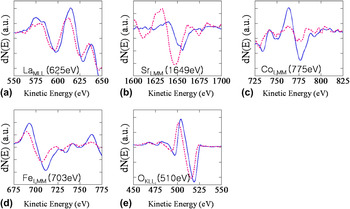
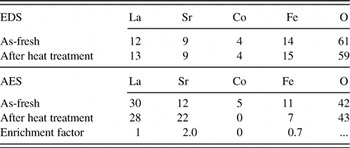
Chemical analysis was conducted using EDS after heat treatment and the results were compared with the as-fresh sample. As Table I shows, EDS data indicate roughly constant atomic percentages of all elements before and after heat treatment. This indicates that the bulk composition remains unchanged and the formation of precipitates is limited to the top surface- or near-surface region. AES analysis was performed to investigate the compositional change of the surface region. Figure 3 shows differentiated AES spectra of LaMNN, SrLMM, CoLMM, FeLMM, and OKLL for as-fresh and heat-treated LSCF. After heat treatment, a substantial increase in peak intensity was observed in Sr while that of lanthanum (La), cobalt (Co), and iron (Fe) decreased. The elemental atomic percentages obtained from AES are given in Table I. The enrichment factor, which represents the relative change of concentrations in the surface region, is calculated based on Eq. (2). Sr concentration doubled while Fe concentration halved. It should be stressed that the concentration of Co, which has been thought to be catalytically active, was not detected on the surface. Enrichment of A-site cation and deficiency of B-site cation in the topmost surface can be understood by the formation of the Ruddlesden–Popper (RP) phase, in which A–O and B–O phases are formed in the top surface layer and subsurface layer, respectively.Reference Ruddlesden and Popper12
Differentiated Auger electron spectra of the (a) LaMLL, (b) SrLMM, (c) CoLMM, (d) FeLMM, and (e) OKLL before (blue solid line) and after (red dotted line) heat treatment at 800 °C for 50 h.

Elemental atomic percentages (%) of pre-and post-heat-treated LSCF at 800 °C obtained from EDS and AES.

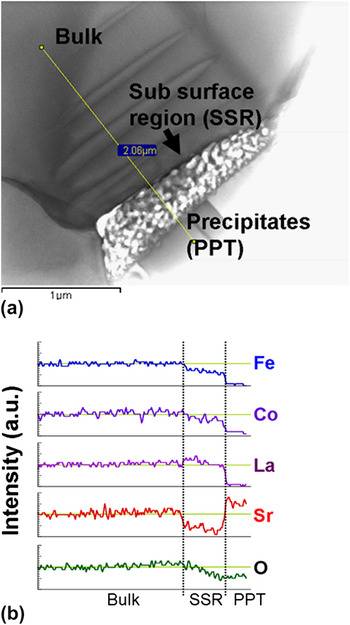
Chemical analysis of the precipitate was conducted using transmission electron microscopy (TEM). Figure 4(a) is a bright-field image of the cross section of the precipitate on the LSCF surface. The TEM micrograph shows the presence of a transition region below the precipitate on the top surface, which is marked by the brightest region in the figure. The EDS line scan was performed from the inner bulk region to the precipitate on the surface as shown in Fig. 4(a). The intensity of the Sr peak increases in the precipitate region compared with that of the bulk and the oxygen peak decreases slightly. In contrast, the peak intensities of the other cations decrease substantially in the precipitate. Thus the precipitate is a Sr–O compound. The decrease of Sr intensity in the subsurface regions indicates that Sr diffuses from the subsurface region to the surface to form the precipitate.
TEM bright-field image of the cross section of precipitate (a) and EDS line scan of selected elements (b).

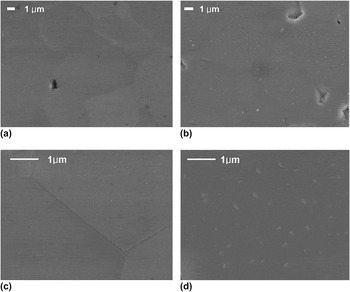
Figure 5 shows the pO2 dependence for the formation of precipitates. Samples were heat-treated at 800 °C for 50 h in pure N2 and 0.1% O2, which was balanced by argon (Ar). Compared with heat-treated samples in air at the same temperature [Fig. 1(d)], the formation of precipitates reduced considerably in 0.1% O2 [Fig. 5(b)] and no precipitates were found in the pure N2-treated sample [Fig. 5(a)]. These trends were similarly observed when the samples were heat-treated at higher temperatures in the same environments. Figures 5(c) and 5(d) show the heat-treated LSCF surface at 890 °C in N2 and 0.1% O2, respectively. The reduced formation of Sr–O precipitates indicates that in addition to temperatures, the oxygen partial pressure is a critical factor affecting the formation of Sr–O precipitates on LSCF surfaces.
SEM micrographs of LSCF surfaces after heat treatment for 50 h at (a) 800 °C/N2, (b) 800 °C/0.1% O2, (c) 890 °C/N2, and (d) 890 °C/0.1% O2.

The observed Sr enrichment on the LSCF surface after heat treatment further results in a decrease in surface transition metal concentration. This is in good agreement with previous works. Bucher et al.Reference Bucher and Sitte3 found Sr enrichment on the surfaces of LSCF after measuring surface exchange coefficients at 600–700 °C. HeideReference Heide4 observed Sr enrichment on La1-xSrxCoyFe1-yO3 surfaces after heat treatment at 1000 °C in 1% O2. Recently, Kubicek et al.Reference Kubicek, Limbeck, Fromling, Hutter and Fleig13 showed cation segregation behavior from pulsed laser-deposited La0.6Sr0.4CoO3−δ thin film electrodes on yttria-stabilized zirconia single crystals. They reported the formation of chemically inhomogeneous surface as a result of Sr excess particles after thermal annealing. Similarly, Cai et al.Reference Cai, Kubicek, Fleig and Yildiz14 observed Sr-enriched surface from pulsed layer deposited La0.6Sr0.4CoO3-δ thin film. They clearly show the presence of SrO-Sr(OH)2 species on the surface using spatially resolved AES. While these previous studies on Sr enrichment mostly postulated the formation of SrO layers on the surface based on the results from chemical analysis, this study clearly shows the formation of submicron-sized Sr–O precipitates on the surface using SEM and TEM. The elemental enrichment phenomena and formation of AO precipitates on the surface was previously shown in other ABO3 perovskite materials,Reference Rahmati, Fleig, Sigle, Bischoff, Maier and Ruhle15–Reference Jung and Tuller18 but the formation of the Sr–O precipitate on polycrystalline LSCF surfaces was visualized for the first time in the present study.
Generally, elemental enrichment and precipitation are related to defect structures, especially the presence of point defects.Reference Horvath, Gerblinger, Meixner and Giber19–Reference Szot and Speier22 As La1−xSrxCoyFe1−yO3 exhibits a substantial oxygen deficiency,Reference Tai, Nasrallah, Anderson, Sparlin and Sehlin23, Reference Stevenson, Armstrong, Carneim, Pederson and Weber24 oxygen vacancies may contribute to Sr–O precipitation. Even though oxygen vacancies improve the oxygen reduction reaction on the surface and oxygen diffusion in the lattice, their presence reduces the stability of the structure by increasing repulsive forces between like atoms. The effect of oxygen vacancies on bonding strength was experimentally demonstrated by Wang et al.Reference Wang, Duncan, Wachsman and Ebrahimi25 They found that the elastic modulus of ceria decreases drastically as the oxygen vacancy concentration increases. This is because oxygen vacancies weaken the attractive forces. The formation of oxygen vacancy in the lattice can be written as Eq. (3) using Kroger-Vink notation.

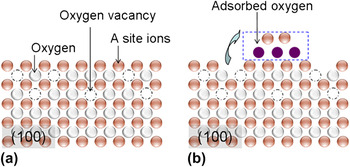
Figure 6(a) shows the schematic of the (100) plane of a cubic perovskite structure. Due to originally broken bonding, atoms on the surface are unstable compared with those in bulk. If oxygen ions are removed from the lattice according to Eq. (3), the shielding effect between cations will be removed and atoms in the surface region will become more unstable. Thus, to reduce the excess surface energy corresponding to unstable surfaces, it is probable that some cations near the surface region precipitate on the surface, yielding cation vacancies in the lattice as demonstrated in Fig. 6(b). As the binding of A–O is generally weaker than the binding energy of B–O in the ABO3 perovskite structure, the precipitation of A-site cations will be more energetically favorable than the precipitation of B-site cations.Reference Tanaka and Misono6, Reference Szot, Pawelczyk, Herion, Freiburg, Albers, Waser, Hulliger, Kwapulinski and Dec26 Therefore, enriched Sr in LSCF is likely to precipitate into Sr–O to reduce the excess surface energy caused by oxygen vacancy formation.
Schematic diagram of (a) the formation of oxygen vacancies and (b) formation of cation and anion vacancies simultaneously.

LSCF was heat-treated at the same temperatures over various pO2 ranges from pure N2 to air. LSCF exhibits reduced formation of Sr–O precipitates with decreasing pO2. A similar pO2-dependence of elemental enrichment was reported by Dufour et al.Reference Dufour, Bertrand, Caboche, Decorse, El Anssari, Poirson and Vareille27 They found that the ratio of Ba to Ti on the surfaces of BaTiO3 became doubled after heat treatment at 1300 °C in air, but the ratio was decreased to 1.4 when surfaces were heat-treated in N2. This indicates reduced Ba enrichment at lower pO2. Szot et al.Reference Szot, Pawelczyk, Herion, Freiburg, Albers, Waser, Hulliger, Kwapulinski and Dec26 studied the nature of the surface layer in ABO3 perovskite structure materials such as SrTiO3 and observed the formation of A–O layers at elevated temperatures, which is known as the RP phase.Reference Ruddlesden and Popper12
They proposed that the RP phase is likely to be more stable at high pO2 and therefore the formation of A–O layers can be inhibited at reduced pO2.
The formation of Sr–O precipitates on LSCF surfaces can be understood by a two-step mechanism: (i) the formation of oxygen vacancies and (ii) subsequent precipitation of enriched Sr. Step (i) increases with decreasing pO2 but step (ii) occurs at oxidizing conditions, i.e., at high pO2. As LSCF exhibits a high oxygen vacancy concentration even in oxidizing conditions, the overall reaction is likely to be controlled by step (ii). Konigstein et al.Reference Konigstein and Catlow28 reported that thermodynamically stable compounds of Sr–O are SrO and SrO2. The step (ii) for Sr–O precipitation, then, can be written as


Thus Sr–O precipitation would increase with increasing pO2 consistent with our experimental observation.
The precipitate crystal structure was analyzed using low-angle XRD but could not be identified due to limited amount of the secondary phase. Therefore, it cannot be concluded decisively which reaction (formation of SrO or SrO2) is more dominant. However, the reaction increasing hole concentration is likely to be thermodynamically unfavorable because the formation of holes increases the concentrations of Co4+ and Fe4+, which are unstable species at high temperatures.Reference Ishihara29 A further systematic quantum mechanical study is required to conclude the dominant reaction mechanism.
As reported by Kubicek et al.Reference Kubicek, Limbeck, Fromling, Hutter and Fleig13 and Cai et al.,Reference Cai, Kubicek, Fleig and Yildiz14 the formation of Sr–O precipitates on the surface contributes to degradation of cell performance. The oxygen reduction reaction at the cathode consists of a series of elementary steps such as
(i) Gas phase diffusion
(ii) Adsorption of molecular oxygen [O2(g) + sad → O2 (ad)]
(iii) Dissociation into atomic oxygen [O2(ad) → 2O (ad)]
(iv) Charge transfer [O(ad) + 2e/ → 2O//(ad)]
(v) Incorporation of oxygen ions [O//(ad) + VO•• → Oox]
where sad is the oxygen adsorption sites on the surface. Sr–O is electronically an insulator.Reference Copeland and Swalin30 The collected data of the surface exchange coefficients and the oxygen tracer diffusion coefficients of various metal oxides indicate that the electronic species on the surface are essential for oxygen exchange reaction.Reference De Souza and Kilner31 It is expected that the formation of Sr–O precipitate on the surface of LSCF forms a passive layer, reducing the concentration of electronic species and inhibiting the oxygen reduction reaction (ORR), especially charge transfer. In addition, for ABO3 perovskite materials, it is generally believed that B-site transition metals play a critical role for catalytic activity.Reference Tanaka and Misono6–Reference Shimizu9 Takeda et al.Reference Takeda, Kanno, Noda, Tomida and Yamamoto32 measured the cathodic polarization of La0.7Sr0.3MO3 (M = Cr, Mn, Fe, Co) and found that La0.7Sr0.3CoO3 exhibited the lowest polarization at 800 °C in air. Kilner et al.Reference Kilner, DeSouza and Fullarton33 investigated the dependence of surface exchange coefficients (Ko) on the composition of La0.8Sr0.2Mn1-yCoyO3 and found that Ko increased with increasing Co concentration. Kan et al.Reference Kan and Wachsman34 studied the effect of catalyst impregnation on the catalytic activity for oxygen exchange for La0.8Sr0.2MnO3 (LSM). They found oxygen exchange reaction was improved with the addition of Co on LSM surfaces via wet impregnation. These results indicate that Co is a catalytically active element for ORR. Consequently, deficiency of catalytically active transition metals, such as Co, due to Sr enrichment is likely to further reduce the ORR. Thus, Sr–O precipitation on LSCF surfaces can cause substantial increases in non-ohmic resistance (activation polarization). It can also lead to increases in ohmic resistance if Sr is enriched at the interface of LSCF and other cell components, forming secondary phases such as SrZrO3 or SrCrO4.Reference Mai, Becker, Assenmacher, Tietz, Hathiramani, Ivers-Tiffee, Stover and Mader35, Reference Fergus36
IV. CONCLUSIONS
LSCF surfaces exhibit substantial compositional variations in oxidizing condition at elevated temperatures. This heterogeneous surface structure involves Sr enrichment and subsequent formation of submicron-sized Sr–O surface precipitates. A two-step mechanism was proposed for Sr–O precipitation: (i) the formation of oxygen vacancies and (ii) precipitation of an enriched Sr phase. As LSCF exhibits high oxygen nonstoichiometry, it is likely that step (ii) controls the overall reaction. Sr–O is electrically insulating and Sr enrichment results in the depletion of transition metals. Consequently, the heterogeneous surface structure can lead to substantial degradation of the surface catalytic activity of LSCF.
ACKNOWLEDGMENTS
The author thanks Junghoon Jang for operating low-angle XRD and Eric Lambert for AES analysis. This work was supported by the Florida Institute for Sustainable Energy.