Introduction
Sesame (Sesamum indicum L.), a member of the family Pedaliaceae, is one of the ancient domesticated oil seed crops, grown widely in tropical and subtropical areas (Ashri, 1998). Sesame seeds are an important source of oil (44–58%), protein (18–25%) and carbohydrates (13.5%). They contain natural antioxidants such as sesamin and sesamolin (Fukuda et al., Reference Fukuda, Nagata, Osawa and Namiki2007). The cultivation of sesame has many advantages as it sets seeds and yields relatively well under high temperatures and can be carried out on residual soil moisture (Bhat et al., Reference Bhat, Babrekar and Lakhanpaul1999). However, it is difficult to decide as to when to harvest a sesame crop to maximize the yield, because plant growth is originally indeterminate and capsules dehisce when mature (Day, Reference Day2000). One of the most important issues in sesame cultivation is the accurate determination of seed maturity, since mature capsules near the base of the plant split and lose seeds while flowering continues on the top of the plant. Determinate growth habit sesame offers a solution to such difficulties and is now a prerequisite for adapting sesame to modern farming systems. This induced mutant trait leads to synchronized flowering and improved lodging resistance with shorter plant stature. Conversely, determinate plant yield is less than the indeterminate plant yield. For the enhancement of the efficiency of sesame breeding programmes, among the various molecular markers, simple sequence repeats (SSRs) are very useful as they have many advantages, such as simplicity, effectiveness, abundance, hypervariability, reproducibility, co-dominant inheritance and extensive genomic coverage (Powell et al., Reference Powell, Machray and Provan1996). They have been used to investigate genetic diversity and phylogenetic relationships in sesame (Cho et al., Reference Cho, Park, Lee, Ra, Chung, Lee, Ma, Lee, Lee, Lee and Park2011; Vinod and Sharma, Reference Vinod and Sharma2011; Zhang H et al., Reference Zhang, Wei, Miao, Zhang and Wang2012; Zhang Y et al., Reference Zhang, Zhang, Che, Wang, Wei and Li2012; Nyongesa et al., Reference Nyongesa, Were, Gudu, Dangasuk and Onkware2013). However, there are a few reports of the development of SSR markers for sesame (Wang et al., Reference Wang, Zhang, Qi, Gao and Zhang2012; Zhang H et al., Reference Zhang, Wei, Miao, Zhang and Wang2012; Zhang Y et al., Reference Zhang, Zhang, Che, Wang, Wei and Li2012).
The establishment of a core collection is an effective method for the utilization of sesame germplasm (Hodgkin et al., Reference Hodgkin, Brown, Hintum and Morales1995). Frankel (Reference Frankel, Arber, Llimensee, Peacock and Starlinger1984) indicated that 10% of the randomly selected samples of a whole collection could cover 70% of the genetic diversity and possibly more if the distribution of the diversity is well considered. Most of the core collections have been developed by grouping them based on their origin, passport data and GenBank evaluation data. Therefore, it is important to improve the determinate types using both conventional and molecular plant breeding strategies. To enhance the efficiency of sesame breeding programmes, the PowerCore software can be used for the development of core collections by identifying all the useful alleles or characteristics in the accessions. It reduces the redundancy of useful alleles and thus enhances the richness of the core collection (Kim et al., Reference Kim, Chung, Cho, Ma, Chandrabalan, Gwag, Kim, Cho and Park2007). The core collection of 277 accessions was established from 2751 randomly selected sesame accessions. These 277 accessions were developed using PowerCore to represent ~10.1% of the core collections used in this study. The aim of this study was to assess the genetic diversity and population structure of sesame core collection accessions using SSR markers.
Materials and methods
Plant materials and DNA isolation
The 277 sesame core collection accessions used in this study were obtained from the National Agrobiodiversity Center at the Rural Development Administration (RDA), Republic of Korea (http://genebank.rda.go.kr). The sesame accessions were collected from 15 countries in four continents (165 Asian, 60 American, 36 European and 16 African) (Supplementary Table S1, available online). DNA was extracted from freeze-dried leaves of 15-d-old seedlings from each accession, according to the modified cetyl trimethylammonium bromide method (Dellaporta et al., Reference Dellaporta, Wood and Hicks1983). The relative purity and concentration of the extracted DNA were estimated using a NanoDrop ND-1000 spectrophotometer (Dupont Agricultural Genomics Laboratory; NanoDrop Technologies). The final DNA concentration was adjusted to 20 ng/μl.
SSR assay
Fourteen polymorphic SSR markers, including seven markers from Dixit et al. (Reference Dixit, Jin, Chung, Yu, Chung, Ma, Park and Cho2005) and seven from Jin et al. (Reference Jin, Lee, Yu, Chung, Ma, Dixit, Kim, Paek, Cho and Park2009), were selected (Table 2). The sizes of the PCR products were measured using the M13-tailed polymerase chain reaction (PCR) method of Schuelke (Reference Schuelke2000). Amplification reactions were carried out in a total volume of 20 μl, comprising 200 ng of template DNA, 1 × PCR buffer, 0.2 mM of each dNTP, 1 U Taq DNA polymerase, 8 pmol of each reverse and fluorescent-labelled M13 (-21) primer, and 2 pmol of forward primer with the M13 (-21) tail at its 5′ end. PCR amplification was carried out at 94°C for 3 min, followed by 30 cycles at 94°C for 30 s, 55°C for 45 s and 72°C for 1 min; 10 cycles at 94°C for 30 s, 53°C for 45 s and 72°C for 1 min; and final extension at 72°C for 10 min. SSR alleles were resolved on an ABI Prism 3100 genetic analyzer (Applied Biosystems) using the GeneScan software (version 3.7; Applied Biosystems) by measuring the florescence intensity and sized precisely against 6-carboxy-X-rhodamine molecular size standards using the Genotyper software (version 3.7; Applied Biosystems).
Genetic diversity analysis
Basic statistics were calculated using the PowerMarker genetic analysis package (version 3.0) (Liu and Muse, Reference Liu and Muse2005) to measure the diversity at each SSR locus, including the total number of alleles (N A), major allele frequency (M AF), accession-specific alleles, observed heterozygosity (H o), number of genotypes (N G), polymorphism information content (PIC) and expected heterozygosity (H e). The numbers of rare alleles (R A), common alleles (C A) and abundant alleles (A A) were calculated using GenAlEx (version 6.5) (Peakall and Smouse, Reference Peakall and Smouse2012). Genetic distances between each pair of accessions were measured based on shared allele frequencies using PowerMarker (Liu and Muse, Reference Liu and Muse2005). A dendrogram was constructed from a distance matrix using the MEGA4 software embedded in PowerMarker, with the unweighted pair group method and the arithmetic averages (UPGMA) algorithm (Tamura et al., Reference Tamura, Dudley, Nei and Kumar2007).
Population structure analysis
The model-based software STRUCTURE 2.2 (Pritchard et al., Reference Pritchard, Stephens and Donnelly2000; Falush et al., Reference Falush, Stephens and Pritchard2003) was used to infer the population structure for the selected core set using a burn-in of 10,000, a run length of 100,000, and a model allowing for admixture and correlated allele frequencies. At least five runs of STRUCTURE were conducted by setting the number of populations (K) from 1 to 15. The model choice criterion to detect the most probable value of K was ΔK, an ad hoc quantity related to the second-order change of the log probability of data with respect to the number of clusters inferred by STRUCTURE (Evanno et al., Reference Evanno, Regnaut and Goudet2005).
Results
SSR marker polymorphism in sesame core collection accessions
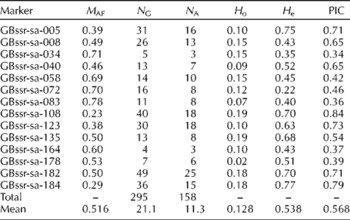
A total of 14 SSR markers revealed 158 alleles among the 277 sesame core collection accessions representing the 15 countries (Supplementary Table S2, available online). SSR locus diversity data are summarized in Table 1. The N A per locus varied widely among the markers, ranging from 3 (GBssr-sa-034 and GBssr-sa-164) to 25 (GBssr-sa-182), with an average of 11.3 alleles. The M AF per locus varied from 0.23 (GBssr-sa-108) to 0.78 (GBssr-sa-083), with an average of 0.516 per marker. The N G ranged from 4 (GBssr-sa-164) to 49 (GBssr-sa-182), with an average of 21.1. Among the 14 SSR markers, the overall PIC values ranged from 0.34 to 0.84, with an average of 0.568. The H o values ranged from 0.02 (GBssr-sa-178) to 0.19 (GBssr-sa-108), with an average of 0.128, and the H e values ranged from 0.22 (GBssr-sa-072) to 0.77 (GBssr-sa-184), with an average of 0.538. These results indicated the prevalence of high degrees of genetic differentiation within and among the populations. SSRs are distributed widely in eukaryotic genomes and are suitable for the evaluation of genetic variation within and among populations because high levels of polymorphism can be detected generally.
Statistics of genetic diversity across 14 SSR markers in the 277 sesame accessions

M AF, major allele frequency; N G, number of genotypes; N A, number of alleles; H o, observed heterozygosity; H e, expected heterozygosity; PIC, polymorphic information content.
Allelic diversity of SSR loci
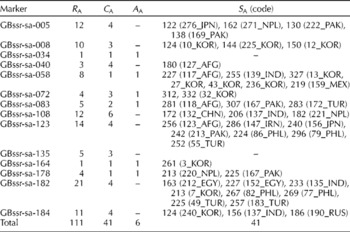
Forty-one genotype-specific alleles (S A) were identified in 12 of the 14 SSR markers. A maximum of eight S A were detected. The R A ranged from 1 (GBssr-sa-034 GBssr-sa-164) to 21 (GBssr-sa-182) with a total of 111 rare alleles, with each allele having a frequency < 5%. The C A ranged from 1 (GBssr-sa-034, GBssr-sa-058, GBssr-sa-164 and GBssr-sa-178) to 6 (GBssr-sa-108), with a frequency of 5–50%, and the A A frequency was > 50% (Supplementary Fig. S1, available online, and Table 2).
Details of allele types identified in 14 SSR markers among the 277 sesame core collection accessions

R A, number of rare ( < 5%) alleles; C A, number of common (5–50%) alleles; A A, number of abundant (>50%) alleles; S A, specific allele code (specific allele-scored accession number and country of origin).
Genetic diversity and phylogenetic relationships
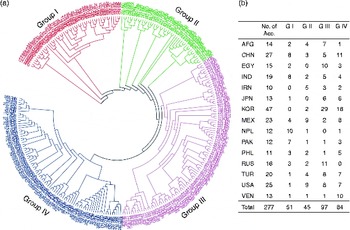
The proportion of shared alleles was used to calculate the genetic distances between all pairwise combinations among the 277 sesame accessions. The genetic distance matrix generated by PowerMarker was used to construct an UPGMA tree. The resulting dendrogram revealed a complex accession distribution pattern. The dendrogram could be divided into four main groups (Fig. 1). Group I included 51 accessions (South Asia, 30; East Asia, 9; North America, 5; East Europe, 3; North Africa, 2; South America, 1; and South Europe, 1). Group II consisted of 45 accessions (North America, 18; South Asia, 10; East Asia, 5; West Asia, 5; Southern Europe, 4; Eastern Europe, 2; and South America, 1). Group III included 97 accessions (East Asia, 40; South Asia, 14; Eastern Europe, 11; North Africa, 10; North America, 10; Southern Europe, 8; West Asia, 3; and South America, 1). Group IV included 84 accessions (East Asia, 33; North America, 15; South Asia, 14; South America, 10; Southern Europe, 7; North Africa, 3; and West Asia, 2). This dendrogram did not indicate any clear divisions among the sesame accessions based on their geographical locations.
(colour online) (a) UPGMA dendrogram showing the genetic relationships among the 277 sesame accessions collected from various countries. (b) Total number of accessions according to country and group. AFG, Afghanistan; CHN, China; EGY, Egypt; IND, India; IRN, Iran; JPN, Japan; KOR, Korea; MEX, Mexico; NPL, Nepal; PAK, Pakistan; PHL, Philippines; RUS, Russia; TUR, Turkey; USA, United States of America; VEN, Venezuela.

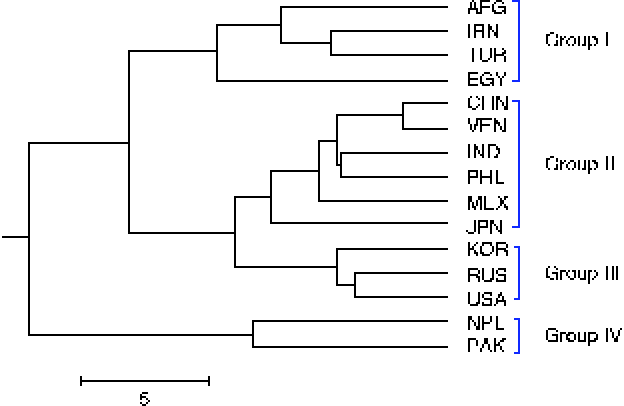
Phylogenetic relationships among the sesame populations' countries of origin were used to construct an UPGMA tree (Fig. 2). The pairwise F st estimation ranged from 0.025 (between the USA and China) to 0.224 (between Nepal and Egypt) (Supplementary Table S3, available online). The sesame populations were clustered into four groups. Group I contained four populations from Afghanistan, Iran, Turkey and Egypt (South Asia, West Asia, South Europe and North Africa). Group II included six populations from China, Venezuela, India, the Philippines, Mexico and Japan (East Asia, South America, South Asia, South Asia, North America and East Asia). Group III included three populations from Korea, Russia and the USA (East Asia, East Europe and North America). These clusters did not indicate any clear pattern of division according to the country of origin. Accessions collected from Nepal and Pakistan were grouped together in group IV.
(colour online) UPGMA dendrogram showing the genetic relationships among sesame populations collected from different countries. AFG, Afghanistan; IRN, Iran; TUR, Turkey; EGY, Egypt; CHN, China; VEN, Venezuela; IND, India; PHL, Philippines; MEX, Mexico; JPN, Japan; KOR, Korea; RUS, Russia; USA, United States of America; NPL, Nepal; PAK, Pakistan.

Population structure
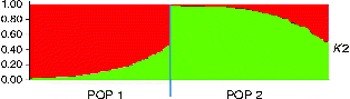
A total of 14 SSR markers were used to understand the population structure of the panel of 277 sesame accessions using a model-based approach in STRUCTURE, giving 1 to 15 possible clusters (K). The results were then permuted for each K value using the STRUCTURE software. The LnP(D) value for each given K increased with the increase in K, but as there was no sudden change in LnP(D), the probable K value could not be inferred (Supplementary Fig. S2(A) and (B), available online). However, on applying the second-order statistics (ΔK) developed by Evanno et al. (Reference Evanno, Regnaut and Goudet2005), a sharp peak in ΔK at K= 2 was observed, suggesting the presence of two major populations. As shown in Fig. 3, most accessions were divided into two subpopulations (POP1 and POP2), including 110 and 123 sesame accessions, respectively (Supplementary Table S4, available online, and Fig. 3). POP1 consisted of 110 accessions, originating from 15 countries – most from Korea (17) followed by those from the USA (13), Mexico (11), Turkey (11), Egypt (9), India (8), Japan (8), Pakistan (7), Russia (7), China (7), Venezuela (4), Afghanistan (3), Iran (2), Nepal (2) and Philippines (1). POP2 contained 124 accessions originating from Korea (24), China (15), the USA (11), Afghanistan (10), India (10), Philippines (8), Mexico (8), Venezuela (8), Iran (7), Nepal (6) Russia (5), Turkey (5), Japan (3), Egypt (2) and Pakistan (2). In addition to the accessions that clearly belonged to a single population, i.e. greater than 84.47% of their inferred ancestry was derived from one of the model-based populations, 43 accessions (15.52%) in the sample were categorized as belonging to admixed ancestry (Supplementary Table S4, available online, and Fig. 3).
(colour online) Model-based clustering for each of the 277 sesame core collection accessions based on the 14 SSR markers used to build the Q matrix K= 2. POP1 and POP2, subpopulations.

Discussion
The genetic diversity of different plants can be assessed using morphological traits, geographical origin and molecular markers such as restriction fragment length polymorphisms, random amplified polymorphic DNAs and amplified fragment-length polymorphisms. Intensive research has been conducted in many other species, particularly in cereals (Cho et al., Reference Cho, Mccouch, Kuiper, Kang, Pot, Groenen and Eun1998), horticultural crops (Aranzana et al., Reference Aranzana, Carbo and Arus2003), medicinal plants, ornamental plants and oil seed plants (Hansen et al., Reference Hansen, Siegismund and Jorgensen2003). SSR markers facilitate the investigation of variation in plants (Donini et al., Reference Donini, Stephenson, Bryan and Koebner1998; Huang et al., Reference Huang, Borner, Roder and Ganal2002; Khlestkina et al., Reference Khlestkina, Huang, Quenum, Chebotar, Roder and Borner2004). This study focused on analysing the genetic diversity and population structure of sesame core collections obtained from different countries of origin.
SSR marker polymorphism in sesame accessions
The allelic richness per locus varied widely among the markers from 3 to 25 alleles (average 11.3 alleles). The frequency of major alleles per locus, PIC values, H o values and H e values were relatively high, indicating a high level of genetic diversity. Our results are supported by previous studies based on morphological and agronomic traits and RAPD markers, which have reported a high genetic diversity in sesame germplasm (Ashri, Reference Ashri and Janick1998; Bhat et al., Reference Bhat, Babrekar and Lakhanpaul1999; Ercan et al., Reference Ercan, Taskin and Turgut2004; Salazar et al., Reference Salazar, Laurentin, Davila and Castillo2006; Nyongesa et al., Reference Nyongesa, Were, Gudu, Dangasuk and Onkware2013). Although sesame is self-pollinating, some authors have reported levels of outcrossing of 5–60% (Yermanos, Reference Yermanos, Fehr and Hadley1980; Pathirana, Reference Pathirana1994). Outcrossing plant species tend to represent 10–20% of the genetic variation between populations (Hamrick and Godt, Reference Hamrick, Godt, Brown, Clegg, Kahler and Weir1989). Hence, outcrossing among neighbouring fields could explain the high genetic variation observed.
Allelic diversity of SSR loci
We identified 41 S A. The R A ranged from 1 to 21 per locus with a total of 111 rare alleles, with each having a frequency < 5%. The C A ranged from 1 to 6 per locus, with a frequency of 5–50%, and the A A frequency was >50%, indicating an extensive degree of genetic diversity in the sesame core collection accessions. Gwag et al. (Reference Gwag, Dixit, Park, Ma, Kwon, Cho, Lee, Lee, Kang and Lee2010) reported a high frequency of rare alleles (34 alleles; 51.5%) among mungbean accessions, indicating that they contributed greatly to the overall genetic diversity of the collection (Roussel et al., Reference Roussel, Koenig, Beckert and Balfourier2004; Yifru et al., Reference Yifru, Hammer, Huang and Roder2006). Hence, it is important to include rare alleles to maximize the genetic variation in genebank collections and to utilize them in a breeding programme (Yifru et al., Reference Yifru, Hammer, Huang and Roder2006). Li et al. (Reference Li, Zhang, Zeng, Yang, Shen, Sun and Wang2002) reported that the sampling percentage of core collections generally accounted for 10–30% of the entire resource in several crop species. The representation evaluation indicated that the genetic diversity of the core collection represented the entire germplasm (Gao et al., Reference Gao, Zhang, Chang, Jia, Qiu and Dong2005; Bhattacharjee et al., Reference Bhattacharjee, Khairwal, Bramel and Reddy2007), suggesting that the core collection preserved a higher level of genetic variation. Therefore, 10.1% was selected as the best sampling percentage from the whole collection for the construction of the core collection.
Genetic diversity and phylogenetic relationships
In this study, the proportion of shared alleles was used to calculate the genetic distances between all pairwise combinations among the 277 sesame accessions. The genetic distance matrix was then used to construct an UPGMA tree. The resulting clustering into four groups revealed a complex accession distribution pattern. The accessions of all countries were distributed throughout the clusters. Based on genetic similarity results, Zhang H et al. (Reference Zhang, Wei, Miao, Zhang and Wang2012), Zhang Y et al. (Reference Zhang, Zhang, Che, Wang, Wei and Li2012) reported that sesame accessions did not get divided into clear groups. The distribution of these sesame accessions was not based on their geographical origin, in agreement with some previous reports (Bhat et al., Reference Bhat, Babrekar and Lakhanpaul1999; Ercan, Reference Ercan, Taskin and Turgut2004).
The phylogenetic relationships among the sesame populations from various countries were used to construct an UPGMA tree. The pairwise F st estimation ranged from 0.025 (between the USA and China) to 0.224 (between Nepal and Egypt). The sesame populations were clustered into four groups, and some geographically separated accessions were grouped in the same cluster.
Dangi et al. (Reference Dangi, Lagu, Choudhary, Ranjekar and Gupta2004) reported that Trigonella foenumgraecum accessions collected from one country and the nearby region were grouped together in some cases, but that they were placed in different clusters in other cases. Accessions collected from Pakistan and Afghanistan were grouped together in one cluster, while accessions collected from India and Nepal were grouped in a different cluster. Moreover, the three accessions collected from Turkey were clustered separately despite their geographical proximity. Thus, there was no clear clustering pattern of geographically proximal accessions, indicating no significant association between genetic similarity and geographical distance. However, analysis of further accessions collected from each geographical location is necessary to confirm this pattern.
Population structure
In this study, a model-based approach with 277 sesame accessions and 14 polymorphic SSR markers was used. The exact K value (genetic group) could be inferred because the estimated log-likelihood values appeared to be K2 for all the examined K values. Accordingly, another ad hoc quantity (ΔK) was used to identify a more probable true value of K. The highest ΔK value for the 277 sesame accessions was obtained for K= 2. When K values were calculated at K= 2, most accessions were classified into two subpopulations (POP1 and POP2), which included 110 and 123 sesame accessions, respectively. POP1 consisted of 110 accessions and POP2 123 accessions. In addition to the accessions that belonged to a single population, i.e. greater than 84.47% of their inferred ancestry was derived from one of the model-based populations, 43 accessions (15.52%) in the sample were categorized as belonging to admixed ancestry. Cho et al. (Reference Cho, Park, Lee, Ra, Chung, Lee, Ma, Lee, Lee, Lee and Park2011) reported three groups based on a model-based structure analysis, which was consistent with the clustering based on genetic distance. Jarvis and Hodgkin (Reference Jarvis, Hodgkin, Zencirci, Kaya, Anikster and Adams1998) reported the occurrence of some admixed/hybrid and introgressive hybrid genotypes, which suggested frequent hybridization and introgression events. Although the extent and significance of natural hybridization and introgression are unclear, new gene combinations between domestic cultivars and their wild or weedy relatives are important for the evolution of domesticated plant species (Jarvis and Hodgkin, Reference Jarvis and Hodgkin1999).
Our data suggest that the core collection is representative of the genetic diversity with high diversity values. The core collection may facilitate the selection of materials for sesame breeding and assist association mapping in sesame.
Supplementary material
To view supplementary material for this article, please visit http://dx.doi.org/10.1017/S1479262113000373
Acknowledgements
This study was carried out with the support of the ‘Research Program for Agricultural Science & Technology Development (Project No. PJ008623)’, National Academy of Agricultural Science, RDA, Republic of Korea.