





1 Introduction
Self-report scales using Likert-type items are common in the social and behavioral sciences. Examples range from the three-category items in the verbal aggression questionnaire (0 = No, 1 = Perhaps, and 2 = Yes; De Boeck & Wilson, Reference De Boeck and Wilson2004) to four-category items in the student survey of the Programme for International Student Assessment (PISA; 0 = Strongly disagree, 1 = Disagree, 2 = Agree, and 3 = Strongly agree). Respondents’ cognitive process of arriving at a particular response category (i.e., the response process) can be complex, often involving multiple stages rather than a single, immediate reaction (Tourangeau et al., Reference Tourangeau, Rips and Rasinski2000). For instance, when responding to a three-category item in the verbal aggression questionnaire, respondents may first decide whether they agree with the statement (i.e., if select No); if so, they then proceed to determine the extent to which they agree and choose between Perhaps and Yes (Jeon & De Boeck, Reference Jeon and De Boeck2016).
When responding to a Likert-type item, respondents may use different response processes. This is similar to using different problem-solving strategies to answer the same question. For a three-category verbal aggression item, in addition to the process described above, respondents may view Perhaps as a qualitatively distinct option and select it when they do not want to give a definitive response. If they are willing to reveal their attitude, they then choose between No and Yes.
In the current edition of The Standards for Educational and Psychological Testing (AERA, APA, & NCME, 2014), response processes are identified as one of the five sources of validity evidence and have thus received increasing attention from the research community. Examining response processes can also inform refinements to the content and design of test items (e.g., Embretson, Reference Embretson2023; Lenzner et al., Reference Lenzner, Hadler and Neuert2023). For instance, items may be revised through rewording, or new items may be added to better capture the intended constructs (Bao et al., Reference Bao, Harris, Lavender, Rafferty and Armes2024).
It is important to note that, although related, response processes are conceptually distinct from response styles. A response process refers to the set of cognitive steps through which a respondent arrives at an answer. The empirical uses of these processes depend jointly on respondents and items. Response processes can be effectively represented using IRTree models, which accommodate multiple cognitive stages and latent traits (e.g., Böckenholt, Reference Böckenholt2012; De Boeck & Partchev, Reference De Boeck and Partchev2012; Jeon & De Boeck, Reference Jeon and De Boeck2016). Response styles, by contrast, are person-level tendencies to use certain response options across items, such as extreme or middle categories. They are usually modeled as latent traits separate from the target trait and not tied to a specific item structure (e.g., Huang et al., Reference Huang, Chung and Falk2024; Kim & Bolt, Reference Kim and Bolt2021). Thus, respondents with similar response style tendencies may still follow different response processes when answering the same item.
1.1 IRTree for response process
IRTree models represent a family of item response theory (IRT) models with sequential decision tree structures. The tree structures describe the cognitive decisions respondents make when answering Likert-type items (e.g., Böckenholt, Reference Böckenholt2012; De Boeck & Partchev, Reference De Boeck and Partchev2012; Jeon & De Boeck, Reference Jeon and De Boeck2016). Specifically, an assumed response process is broken down into stages, with each stage represented by an internal decision node. These internal nodes may rely on different respondent traits such as the target latent trait, the item aims to measure and/or latent traits for response styles. The original polytomous item is therefore represented by several binary pseudo-items, and the probability of observing a specific response to the original item becomes the product of conditional probabilities of internal decisions that lead to the observed response. IRTree models have been used to study responses styles (e.g., Plieninger & Meiser, Reference Plieninger and Meiser2014) and omitted item responses (e.g., Debeer et al., Reference Debeer, Janssen and De Boeck2017).
To illustrate the IRTree model, consider a three-category verbal aggression item, A bus fails to stop for me. I would want to curse. The aforementioned two-stage response process can be described by the tree structure shown in Figure 1(a). Let
$\theta $
 denote respondents’ level of verbal aggression, the target trait measured by the questionnaire. In Stage 1, respondents decide if they agree with the statement, depending on their
$\theta $
 level. This stage includes one internal node, denoted by
$Y_1^*(\theta )$
 , which can be viewed as a binary pseudo-item. If
$Y_1^*(\theta )=0$
 , the respondents reach a terminal option 0 = No, and if
$Y_1^*(\theta )=1$
 , the respondents move to Stage 2. In Stage 2, they further decide to what extent they agree with the statement. This stage involves another internal node, denoted by
$Y_2^*(\theta )$
 , that also relies on
$\theta $
 . When
$Y_2^*(\theta )=0$
 , the observed response is 1 = Perhaps, and when
$Y_2^*(\theta )=1$
 , the observed response is 2 = Yes. The one-to-one correspondence between the three response options and responses to the two binary pseudo-items are summarized in the first two columns of Table 1. In this linear response process (LPT), the three response options show only quantitative differences. In other words, the middle category lies between No and Yes on the attitude continuum.
Correspondence between observed responses and internal node codes

Table 1 Long description
The table is divided into two main model sections: L P T and N P T.
Header Row:
- The L P T section contains two columns: y sub 1 super asterisk (theta) and y sub 2 super asterisk (theta).
- The N P T section contains two columns: y sub 1 super asterisk (kappa) and y sub 2 super asterisk (theta).
Data Rows:
- Row 1: Observed response ‘0 = No’ corresponds to L P T values of 0 and N A; and N P T values of 1 and 0.
- Row 2: Observed response ‘1 = Perhaps’ corresponds to L P T values of 1 and 0; and N P T values of 0 and N A.
- Row 3: Observed response ‘2 = Yes’ corresponds to L P T values of 1 and 1; and N P T values of 1 and 1.
A footer note specifies that N A indicates the corresponding internal node is not applicable on that branch of the response tree.
Note: NA indicates that the corresponding internal node is not applicable on that branch of the response tree.
Item response trees for processes with a three-response item.

Figure 1 Long description
The diagram consists of two panels labeled a and b.
Panel a, titled Linear process tree L P T, shows a two-stage decision process. At Stage 1, a central node contains Y sub 1 super asterisk theta. A left branch labeled 0 leads directly to a No response. A right branch labeled 1 leads to Stage 2. In Stage 2, a node contains Y sub 2 super asterisk theta. From this node, a left branch labeled 0 leads to a Perhaps response, and a right branch labeled 1 leads to a Yes response.
Panel b, titled Nested process tree N P T, shows a similar two-stage structure but with different parameters and outcomes. At Stage 1, the central node contains Y sub 1 super asterisk kappa. A left branch labeled 0 leads directly to a Perhaps response. A right branch labeled 1 leads to Stage 2. In Stage 2, the node contains Y sub 2 super asterisk theta. From this node, a left branch labeled 0 leads to a No response, and a right branch labeled 1 leads to a Yes response.
The second possible response process can be described by the tree structure in Figure 1(b). This nested process tree (NPT) also has two stages, but the two internal nodes depend on different latent traits. In Stage 1, respondents decide whether they want to use the response option Perhaps. This decision relies on a latent trait, denoted by
$\kappa $
 , that is separate from the target latent trait.
$\kappa $
 represents a tendency to select the Perhaps, although the psychological meaning of this tendency may vary by context. For sensitive items in the verbal aggression questionnaire,
$\kappa $
 may reflect respondents’ willingness to reveal their attitudes. In other settings, it may capture a middle response style or non-effortful responding. As shown in the last two columns of Table 1, if
$Y_1^*(\kappa )=0$
 , the observed response is 1 = Perhaps. If
$Y_1^*(\kappa )=1$
 , the respondents move to the next stage. In Stage 2, the internal node
$Y_2^*(\theta )$
 represents the direction of the attitude and depends on the target trait
$\theta $
 . Therefore,
$Y_2^*(\theta )=0$
 leads to 0 = No, and
$Y_2^*(\theta )=1$
 leads to 2 = Yes.
1.2 Between-person variation in response process
Although the IRTree model provides information regarding how respondents choose from options of Likert-type items, standard IRTree models usually assume that all respondents follow the same response process. This assumption may not hold in practice because the same item may trigger more than one response process. For the three-category verbal aggression items discussed above, some respondents may follow the LPT, whereas others may follow the NPT. To account for such between-person variation, mixture IRTree models have been proposed (e.g., Alagöz & Meiser, Reference Alagöz and Meiser2024; De Boeck et al., Reference De Boeck, Cho and Wilson2011; Kim & Bolt, Reference Kim and Bolt2021; Tijmstra et al., Reference Tijmstra, Bolsinova and Jeon2018). These models typically assume that respondents belong to two or more mutually exclusive latent classes (LCs). For each LC, an IRT or IRTree model is specified to describe the response process used by respondents in that class across all items in the scale.
For instance, Tijmstra et al. (Reference Tijmstra, Bolsinova and Jeon2018) introduced a two-class mixture IRTree model for Likert-type items with a neutral middle category (e.g., Neutral). The model assumes that respondents in one LC treat the middle category as the center of an ordinal response scale, while respondents in the other LC use the middle category to pass or avoid responding. For the first LC, a generalized partial credit model (gPCM; Muraki, Reference Muraki1992) is used to describe the relation between the target latent trait and the observed responses. For the second LC, an IRTree model similar to the NPT in Figure 1(b) is applied to model the response process.
The mixture IRTree model proposed by Kim and Bolt (Reference Kim and Bolt2021) focuses on four-category Likert-type items (e.g., Strongly disagree, Disagree, Agree, and Strongly agree) and modeled two response processes using different IRTree models. Accordingly, two LCs of respondents were considered: one class relies only on the target latent trait and does not show an extreme response style (ERS) when responding to items; the other class incorporates an additional ERS latent trait that encourages “extreme” responses (e.g., Strongly disagree and Strongly agree). For the non-ERS class, a two-stage IRTree model is used, in which both internal nodes depend on the target trait. The IRTree for the ERS class also consists of two stages. In Stage 1, respondents determine the direction of their attitude based on their target trait. In Stage 2, they further determine the extremity of their response (e.g., selecting Strongly agree over Agree) based on their ERS trait.
1.3 Within-person variation in response process
The above mixture IRT/IRTree models capture between-person variation but assume that a respondent follows the same response process for all items. However, this assumption can be overly restrictive. As discussed in Tourangeau et al. (Reference Tourangeau, Rips and Rasinski2000), some self-reported surveys may include items that are perceived as intrusive or sensitive by some respondents. One important source of item sensitivity is the social desirability of response options. When answering sensitive items, respondents may use response options differently from how they use them for nonsensitive items. Other factors, such as limited understanding of the item or insufficient background information, may also affect how respondents use response options (Tijmstra & Bolsinova, Reference Tijmstra and Bolsinova2025).
To account for within-person variation in response processes, Tijmstra and Bolsinova (Reference Tijmstra and Bolsinova2025) introduced a mixture IRTree model that focuses on the use of the middle response category (e.g., Neutral). Using a multinomial processing tree framework (Klauer, Reference Klauer2010), their model assumes that, across different items, the same respondent may reach the Neutral response category through two cognitive pathways: either by using it as an informative option or as a nonresponse option. When the middle category is used as an informative option for target trait inference, its probability can be modeled using standard polytomous IRT models, such as Samejima’s (Reference Samejima1969) graded response model (GRM). When the response is intended as a nonresponse option, the probability of choosing it is fixed at 1. Consequently, the probability of a middle response is a weighted sum of the middle response probabilities from these two cognitive pathways, with weights representing the proportions of informative and noninformative responses.
Other models also allow response processes to vary within respondents across items. Huang (Reference Huang2020) proposed a mixture IRTree model for performance decline, which includes a normal class, where respondents exert full effort across the test, and an aberrant class, where respondents may drop out, skip items, or reduce effort through a sequential decision process. Merhof and Meiser (Reference Merhof and Meiser2023) developed a dynamic response strategy model to model changes in response strategies over item positions. Their model reformulates IRTree models as multidimensional IRT models and allows the loadings on latent traits to vary as a function of item position.
1.4 This study
In this study, we introduce a new response-level mixture IRTree modeling framework, namely, MIX-R, to account for both within- and between-person variation in the response processes. MIX-R is motivated by the response-mixture IRT model introduced by Huang et al. (Reference Huang, Luo and Jeon2025), which models person- and item-specific LCs for item response strategies and uses auxiliary person-level, item-level, and/or response-level information (e.g., response time), when available, to inform LC memberships. Broadly speaking, MIX-R can be viewed as a response-level generalization of the generalized mixture IRT framework of Tijmstra et al. (Reference Tijmstra, Bolsinova and Jeon2018). Rather than assigning each respondent to a single response structure across all items, MIX-R treats process membership as response-specific and models it jointly through person and item effects. This allows the same respondent to use different complete response trees across items and permits process prevalence to be examined at the response, person, and item levels.
MIX-R differs from existing within-person mixture IRTree models in how it represents response process switching. Tijmstra and Bolsinova (Reference Tijmstra and Bolsinova2025) specify a single IRTree with two latent routes to the middle category, allowing the same middle response to reflect either an informative response or a nonresponse. In contrast, MIX-R uses a response-specific latent process indicator to select one of two or more complete IRTrees for each response. The indicator is mutually exclusive, meaning that each response is assumed to arise from exactly one process. Thus, MIX-R places the mixture at the level of item responses, so that the same respondent may use different response processes for different items. MIX-R also does not require auxiliary information, unlike models that use response-level information to capture performance decline or dynamic response strategies (e.g., Huang, Reference Huang2020; Merhof & Meiser, Reference Merhof and Meiser2023). It can incorporate person-, item-, and response-level information to predict response-level LC memberships and can be generalized to items with different numbers of response categories and to settings with more than two possible response processes.
The remainder of this article is organized as follows. In Section 2, we illustrate the MIX-R model in the context of three-category items with two possible response processes. We then outline its generalization to items with more than three response options. In Section 3, we demonstrate the empirical utility of the MIX-R model using the verbal aggression data (De Boeck & Wilson, Reference De Boeck and Wilson2004). In Section 4, through three simulation studies, we systematically evaluated the performance of the proposed MIX-R model. Finally, in Section 5, we discuss limitations of this study and future research directions.
2 Proposed approach
Without loss of generality, we present the MIX-R using the verbal aggression items with three response options (i.e., 0 = No, 1 = Perhaps, and 2 = Yes). We assume that respondent
$j\;(j=1,\dots ,J)$
 follows one of the two response processes to answer item
$i\;(i=1,\dots , I)$
 . Let
$C_{ij}$
 denote the response-specific LC for response
$Y_{ij}$
 .
$C_{ij}=\text {LPT}$
 if the linear process tree in Figure 1(a) is used, and
$C_{ij}=\text {NPT}$
 if the NPT in Figure 1(b) is used.
LPT model: Recall that, when
$C_{ij}=\text {LPT}$
 , the respondent perceives only quantitative differences between the three response options and proceeds stepwise from the lowest to the highest category via the two internal nodes. The two pseudo-items in the LPT process, denoted as
$A1$
 and
$A2$
 , rely on only the target latent trait
$\theta _j$
 . For each pseudo-item, we use a Rasch model to specify the probability of endorsement:

where
$b^{A1}_i$
 and
$b^{A2}_i$
 are the difficulty parameters for the Stage-1 and Stage-2 pseudo-items, respectively. Because the LPT represents a linear ordinal process, we impose
$b^{A2}_i>b^{A1}_i$
 , so that endorsing Yes requires a higher
$\theta $
 level than moving beyond No. The target latent trait
$\theta $
 is assumed to follow a normal distribution. Then we have the conditional probabilities for the observed response
$Y_{ij}$
 :

NPT model: When
$C_{ij}=\text {NPT}$
 , the first internal node,
$B1$
 , depends on
$\kappa $
 , a trait capturing the extent to which a respondent prefers using the Yes and No. The second node,
$B2$
 , relies on
$\theta $
 . The endorsement probabilities of two NPT pseudo-items are

where
$b^{B1}_i$
 and
$b^{B2}_i$
 are the difficulty parameters for
$\kappa $
 -based and
$\theta $
 -based nodes, respectively.
$\kappa $
 is assumed to follow a normal distribution. The conditional probabilities are

In the proposed model, the target trait
$\theta _j$
 is shared across the direction-relevant nodes of both trees and is identified on a common scale. Respondents may therefore be compared with respect to their
$\theta _j$
 . In contrast,
$\kappa _j$
 characterizes the decision specific to NPT and should not be interpreted as another measure of the target trait or compared numerically with
$\theta _j$
 . The validity of cross-respondent comparisons of
$\theta _j$
 remains conditional on the assumption that the trait has the same substantive interpretation across the alternative trees.
Prevalence model: We model,
$\pi _{ij}$
 , the probability that respondent j follows LPT to answer item i, using a logistic prevalence model,

where
$\mathbf {z}_j$
 ,
$\mathbf {x}_i$
 , and
$\mathbf {h}_{ij}$
 are vectors of person-, item-, and response-level covariates, respectively. The coefficient vectors
$\boldsymbol {\gamma }$
 ,
$\boldsymbol {\beta }$
 , and
$\boldsymbol {\delta }$
 describe how these covariates are associated with the log-odds of following LPT rather than NPT. Unless stronger design assumptions are justified, the covariate effects should be interpreted as associational. The terms
$u_j$
 and
$v_i$
 are person and item random effects. Larger values of
$u_j$
 indicate that respondent j is more likely to follow LPT across items, whereas larger values of
$v_i$
 indicate that item i is more likely to elicit LPT across respondents. Instead of estimating the effects of covariates simultaneously with parameters of items, a stepwise estimation approach that separates the measurement and structural components of MIX-R can be employed (Alagöz et al., Reference Alagöz, Meiser and Khorramdel2025; Vermunt, Reference Vermunt2010). Under this approach, the measurement model is first estimated using only item responses, without incorporating any covariates, to obtain posterior class membership probabilities of respondents. Subsequently, the effects of covariates are estimated by regressing the LC membership probabilities on covariates of interest.
If no covariate is included or when all covariates are zero,
$\mathrm {logit}^{-1}(\alpha _0)$
 can be interpreted as the baseline LPT probability when both person and item random effects are zero,
$u_j=0$
 and
$v_i=0$
 (i.e., the probability that a person with an average tendency to use LPT will follow LPT when responding to an item with an average tendency to elicit it). More generally, the response-level prevalence of LPT is the model-implied average
$\bar {\pi }$
 ; and
$\bar {\pi }_{j}$
 summarizes respondent j’s tendency to follow LPT across items, and
$\bar {\pi }_{i}$
 summarizes how likely item i is to elicit LPT across respondents:

Combining Equations (1)–(3), the probability of observing a specific response option, such as No, is

2.1 Model estimation and identification
Estimation: The MIX-R model was estimated in a Bayesian framework using the R package NIMBLE (de Valpine et al., Reference de Valpine, Turek, Paciorek, Anderson-Bergman, Temple Lang and Bodik2017) with the marginalized mixture likelihood
$P(Y_{ij})=\pi _{ij}P(Y_{ij}\mid C_{ij}=\text {LPT})+(1-\pi _{ij})P(Y_{ij}\mid C_{ij}=\text {NPT})$
 , integrating out the discrete LC indicator. All unknowns are continuous and sampled using NIMBLE’s adaptive random-walk Metropolis samplers. We run multiple chains, monitor rank-normalized split
$\hat R$
 (Vehtari et al., Reference Vehtari, Gelman, Simpson, Carpenter and Bürkner2021) and bulk/tail ESS, and assess out-of-sample fit via LOOIC (Vehtari et al., Reference Vehtari, Gelman and Gabry2017). Note that a data-augmentation version that samples discrete LCs
$C_{ij}$
 using Pólya–Gamma updates (Polson et al., Reference Polson, Scott and Windle2013) for the prevalence model is also possible with enough information (e.g., repeated measures in a longitudinal design and the availability of auxiliary variables). For simplicity, the results reported in this article use the marginalized form.
Priors: All internal nodes use Rasch models. Table 2 summarizes the priors used for the MIX-R specification. The latent traits are assigned independent standard normal priors,
$\theta _j\sim \mathcal N(0,1)$
 and
$\kappa _j\sim \mathcal N(0,1)$
 . This fixes the scale of each trait, provides mild regularization, and reflects our choice not to model the latent-trait association as a primary estimand in the main analysis. The raw Stage 1 thresholds and the item effects in the prevalence model are centered across items, with
$v_i=v_{i,\mathrm {raw}}-\bar v_{\mathrm {raw}}$
 . The fixed prior
$u_j\sim \mathcal N(0,1)$
 regularizes person-level heterogeneity on the logit scale and improves computational stability in the present application, where each respondent contributes a modest number of item responses.
Priors used in the main MIX-R specification

Table 2 Long description
The table consists of three columns: Parameter, Prior, and Notes.
* Row 1: Parameter theta sub j; Prior N(0,1); Notes: Target trait.
* Row 2: Parameter kappa sub j; Prior N(0,1); Notes: Secondary trait.
* Row 3: Parameter b super A 1 sub i, raw; Prior N(0, 5 super 2); Notes: L P T Stage 1 threshold.
* Row 4: Parameter b super B 1 sub i, raw; Prior N(0, 5 super 2); Notes: N P T Stage 1 threshold.
* Row 5: Parameter g sub i super A = b sub i super A 2 minus b sub i super A 1; Prior Exp(1); Notes: Enforces b sub i super A 2 > b sub i super A 1.
* Row 6: Parameter tau sub i; Prior Beta(3,3); Notes: Defines b sub i super B 2 = b sub i super A 1 plus tau sub i g sub i super A.
* Row 7: Parameter alpha sub 0; Prior N(0, 5 super 2); Notes: Prevalence intercept.
* Row 8: Parameter u sub j; Prior N(0,1); Notes: Person effect in prevalence model.
* Row 9: Parameter v sub i, raw; Prior N(0, sigma sub v super 2); Notes: Item effect in prevalence model.
* Row 10: Parameter sigma sub v; Prior half-t sub 3 (scale = 1); Notes: Item-effect S D.
* Row 11: Parameter gamma sub p, beta sub q, delta sub r; Prior N(0, 2.5 super 2); Notes: Covariate effects, when included.
When the association between
$\theta _j$
 and
$\kappa _j$
 is of substantive interest, the independent priors can be replaced by a bivariate normal prior,
$(\theta _j,\kappa _j)^\top \sim \mathcal N_2\{(0,0)^\top ,\Sigma _\rho \}$
 , where
$\Sigma _\rho =\begin {pmatrix}1&\rho \\ \rho &1\end {pmatrix}$
 . The correlation can be parameterized as
$z_\rho \sim \mathcal N(0,\sigma _\rho ^2)$
 and
$\rho =\tanh (z_\rho )$
 . The scale
$\sigma _\rho $
 should reflect substantive knowledge about the plausible association. Because the independent- and correlated-trait versions make different assumptions about the joint distribution of the latent traits, they should be treated as distinct model specifications. For completeness, we examine this prior choice in Appendix A of the Supplementary Material.
Identification: Each binary Rasch node contributes one free intercept. With slopes fixed to 1, the node likelihood is invariant to a common location shift. We identify location and set the latent scale by centering item difficulties within each tree; standard normal priors on the person traits provide the scale reference. In the correlated-trait specification, the marginal variances of
$\theta _j$
 and
$\kappa _j$
 remain fixed to one, while
$\rho $
 controls only their latent association. For three-category items, we enforce the LPT ordering
$b_i^{A2}>b_i^{A1}$
 by setting
$g_i^A=b_i^{A2}-b_i^{A1}>0$
 , with
$g_i^A\sim \mathrm {Exp}(1)$
 . This prior mildly regularizes threshold separation on the logit scale; for example,
$P(g_i^A<3)=0.95$
 . The ordering is specific to the LPT as a linear ordinal tree and does not limit the generalizability of MIX-R, because other response processes can be represented by IRTrees with their own process-appropriate constraints. NPT and LPT parameterizations are aligned by constraining
$b_i^{B2}=b_i^{A1}+\tau _i(b_i^{A2}-b_i^{A1})$
 with
$ \tau _i\sim \mathrm {Beta}(3,3). $
 This places the NPT
$\theta $
 -threshold between the two LPT
$\theta $
 -thresholds for the same item. As a result, the No versus Yes distinction under NPT remains comparable to the ordered meaning of No, Perhaps, and Yes under LPT. The
$\mathrm {Beta}(3,3)$
 prior is symmetric around 0.5 and mildly favors interior placements while allowing the full interval
$(0,1)$
 . The prevalence model is identified by taking NPT as the reference process and defining
$\pi _{ij}$
 as the probability of following LPT, centering the item-specific effects
$v_i$
 , and assigning
$u_j$
 a zero-centered regularizing prior. If a 2PL is used, one slope per latent dimension is fixed (e.g.,
$\alpha =1$
 on a reference item-node) and the remaining slopes receive diffuse log-normal priors.
2.2 Generalization to R response options and K response processes
MIX-R can be generalized to items with R response options and K possible response processes through modeling K LCs. Specifically, for the kth (
$1\leq k\leq K$
 ) LC, we adopt an IRTree with
$\mathcal {M}^{(k)}$
 binary internal nodes to describe the corresponding response process. Different combinations of the internal node outcomes then lead to R observed response options. Similar to Table 1, the one-to-one mapping between the R options and
$\mathcal {M}^{(k)}$
 internal nodes can be summarized by an
$R\times \mathcal {M}^{(k)}$
 matrix. Let
$p^{(k)}_{ijm}$
 denote the probability that respondent j endorses the mth (
$1\leq m \leq \mathcal {M}^{(k)}$
 ) binary internal node in the kth IRTree of item i. The marginal probability of observing response option
$r\;(1\leq r \leq R)$
 can be written as

where
$\pi _{ijk}$
 is the probability that respondent j follows the kth IRTree to answer item i, and
$\sum _{k=1}^{K}\pi _{ijk}=1$
 . The indicator
$I^{(k)}_{r,m}$
 represents the element in the rth row and mth column of the mapping matrix, with
$I^{(k)}_{r,m}\in \{0,1\}$
 .
To model process prevalence, let the Kth LC be the reference class. The log-odds of respondent j following the kth IRTree for item i are modeled as

where
$u_{jk}$
 and
$v_{ik}$
 are LC-specific person and item random intercepts, and
$u_{jk}\sim \mathcal {N}(0,\sigma _{u,k}^2)$
 and
$v_{ik}\sim \mathcal {N}(0,\sigma _{v,k}^2)$
 . For the reference LC, we let
$\alpha _K=u_{jK}=v_{iK}=0$
 . When observed information is available, the linear predictor in Equation (7) can be expanded to include person-, item-, and response-level predictors,
$\mathbf {x}_i^\top \boldsymbol {\beta }^{(k)}$
 ,
$\mathbf {z}_j^\top \boldsymbol {\gamma }^{(k)}$
 , and
$\mathbf {h}_{ij}^\top \boldsymbol {\delta }^{(k)}$
 . These terms may be useful when the goal is to improve prediction or describe associations between observed features and response-process prevalence.
These generalizations do not require an odd number of response categories or a unique middle option. Appendix G of the Supplementary Material illustrates, respectively, a four-category specification contrasting linear and nested response processes and a five-category specification that jointly represents response-process and response-style heterogeneity.
3 Empirical demonstration
To demonstrate the MIX-R model, we use the verbal aggression self-report data (De Boeck & Wilson, Reference De Boeck and Wilson2004). The data contain responses to 24 items from
$N=316$
 respondents (243 women and 73 men) with their Trait Anger scores from the State-Trait Anger Expression Inventory (STAXI; Spielberger, Reference Spielberger1988; Spielberger & Sydeman, Reference Spielberger, Sydeman and Maruish1994). The items were formed by crossing four frustrating situations (two Self-to-blame and two Other-to-blame), three verbally aggressive behaviors (Curse, Scold, and Shout), and two behavior modes (Want and Do). Each item has three response options:
$0=$
 No,
$1=$
 Perhaps, and
$2=$
 Yes. For details of the data, we refer readers to De Boeck and Wilson (Reference De Boeck and Wilson2004). In the original administration, these items were mixed with additional items of a similar type, and the order of items was randomized. Thus, any detected process differences are likely to be a reflection of substantive item and person differences rather than item locations.
3.1 Analysis
In the analysis, we consider five competing model specifications: an IRTree model for the linear response process (hereafter, the LPT model), an IRTree model for the nested response process (hereafter, the NPT model), a person-level mixture IRTree model (hereafter, the MIX-P model), a response-level mixture IRTree model (MIX-R model), and a MIX-R model with observed covariates (MIX-R+X). In all mixture models, one LC follows the LPT in Figure 1(a), and the other follows the NPT in Figure 1(b). In MIX-P, each respondent follows one process across all items. In MIX-R and MIX-R+X, the process may vary across person–item responses.
In this application,
$\theta $
 represents respondents’ propensity to react with verbal aggression when provoked, and
$\kappa $
 represents their tendency to reveal a directed attitude rather than select Perhaps. MIX-R includes only person and item random effects in the prevalence model. MIX-R+X adds observed predictors of response-process prevalence. Person-level covariates include gender and Trait Anger scores; item-level covariates include behavior mode, situation type, and behavior types.
We compare the five specifications using out-of-sample predictive fit and Pareto-k reliability. We then examine item properties and process-specific item functioning under the selected model. Finally, we summarize the overall response-level, item-level, and person-level prevalence of LPT, as defined in Equation (4). For MIX-R+X, covariate effects are interpreted as associations with the log-odds of following LPT rather than NPT.
3.2 Estimation, priors, and convergence diagnostics
All five models were estimated in a Bayesian framework via MCMC using NIMBLE (de Valpine et al., Reference de Valpine, Turek, Paciorek, Anderson-Bergman, Temple Lang and Bodik2017). To support model comparison, we used the same prior families and scales for parameters with comparable roles across models as stated in Section 2.1. We used four parallel chains, each with
$24{,}000$
 iterations; of these,
$4,000$
 are warm-up, and thinning
${=} 10$
 . We assessed MCMC behavior using visual diagnostics (e.g., trace and autocorrelation plots) and the rank-normalized split
$\hat {R}$
 (Vehtari et al., Reference Vehtari, Gelman, Simpson, Carpenter and Bürkner2021). For the primary quantities of interest (e.g., the overall prevalence parameter
$\alpha _0$
 ), we required that
${\hat {R}\le 1.01}$
 and bulk/tail ESS
$\ge 400$
 . For person and item parameters, we targeted
$\hat {R}\le 1.05$
 and ESS
$\ge 100$
 .
3.3 Results
3.3.1 Model comparison
All models show satisfactory convergence based on
$\hat {R}$
 . For MIX-R specifications, no monitored parameter had
$\hat {R}>1.05$
 . Because conventional criteria such as BIC and DIC can be unreliable for mixture models (Drton & Plummer, Reference Drton and Plummer2017), we assessed predictive fit using PSIS-LOO, reported as LOOIC, with smaller values indicating better fit. We also report the Pareto-k diagnostic, where values above 0.7 indicate unreliable LOO approximations (Vehtari et al., Reference Vehtari, Gelman and Gabry2017). Table 3 summarizes the model comparison results.
Model fit indices of five competing models

Table 3 Long description
The table consists of six columns and six rows. The header row contains the following labels: Model Name (unlabeled), L O O I C, p L O O, Pareto k greater than 0.7, Delta L O O I C, and S E Delta L O O I C.
* Row 1: MIX-R (bolded) has L O O I C 11,879.22, p L O O 512.34, Pareto k 0, Delta L O O I C 0.0, and S E Delta L O O I C is a forward slash.
* Row 2: MIX-R+X (bolded) has L O O I C 11,883.80, p L O O 512.52, Pareto k 0, Delta L O O I C 4.6, and S E Delta L O O I C 8.1.
* Row 3: L P T has L O O I C 12,374.64, p L O O 311.41, Pareto k 0, Delta L O O I C 495.4, and S E Delta L O O I C 36.6.
* Row 4: N P T has L O O I C 12,167.93, p L O O 442.85, Pareto k 0, Delta L O O I C 288.8, and S E Delta L O O I C 34.2.
* Row 5: MIX-P has L O O I C 11,923.62, p L O O 531.74, Pareto k 79, Delta L O O I C 44.4, and S E Delta L O O I C 32.8.
As shown in Table 3, both response-level mixture models fit the data better than the two single-process models. This suggests that the verbal aggression responses are unlikely to arise from a single response process. MIX-R also outperformed MIX-P by LOOIC and showed better diagnostic reliability. MIX-P had 79 left-out units with Pareto-
$k>0.7$
 , whereas both MIX-R specifications had none. Thus, the person-level mixture captured some process heterogeneity, but its predictive performance relied on a less stable approximation. Substantively, MIX-R is also better aligned with the response-process question in this study. MIX-P assumes that each respondent follows one response process across all items, whereas MIX-R allows the same respondent to switch processes across items. This distinction is important for the verbal aggression data because item content may affect how respondents use Perhaps; for example, Want items and Do items may invite different uses of the middle category. Therefore, the better LOOIC, stronger Pareto-k reliability, and closer match to the within-person process-switching hypothesis together support MIX-R as the primary model.
Adding covariates to MIX-R did not improve predictive fit. As shown in the table, MIX-R+X had a slightly larger LOOIC than MIX-R, and the difference was small relative to its uncertainty (
$\Delta LOOIC=4.6$
 , SE = 8.1). We therefore use MIX-R as the primary model for interpreting process-specific item functioning and response-process prevalence. MIX-R+X is used only to describe whether process prevalence is associated with respondent characteristics and item features.
3.3.2 Item properties under LPT and NPT
Item parameter estimates: The posterior means and 95% credible intervals (CrIs) of item difficulty parameters (
$\hat b^{A1},\hat b^{A2},\hat b^{B1},\hat b^{B2}$
 ), along with the item random effects
$\hat v_i$
 are summarized in Table S2 in the Supplementary Material. The estimates are broadly well identified, with several MIX-R item parameters, especially for the NPT first node, showed wider CrIs than those from the single-process models, reflecting additional uncertainty from estimating response-level process membership. Table S3 in the Supplementary Material provides a descriptive comparison of item-parameter posterior means across LPT, NPT, MIX-P, and MIX-R. Figure 2 illustrates how the two response processes differ at the item level through category response curves for three representative items: S1DoCurse, S3DoScold, and S3WantCurse.
Category response curves under LPT and NPT for selected items.
Note: Columns show selected items, and rows show LPT and NPT at
$\kappa =-2,0,2$
 . Dotted, dashed, and solid lines denote No, Perhaps, and Yes, respectively. For S1DoCurse, LPT and high-
$\kappa $
 NPT give similar No/Yes curves because Perhaps has low probability. For S3DoScold, low to moderate
$\theta $
 mainly leads to No under LPT but to Perhaps under NPT when
$\kappa $
 is low. For S3WantCurse, LPT assigns more probability to Perhaps, whereas NPT can assign more probability to No at lower
$\theta $
 .

Figure 2 Long description
A grid of twelve line graphs organized into four rows and three columns. The x-axis represents theta ranging from minus 2 to 2. The y-axis represents Probability from 0.0 to 1.0. A legend at the top indicates that dotted lines represent No, dashed lines represent Perhaps, and solid lines represent Yes.
Columns are labeled S 1 Do Curse, S 3 Do Scold, and S 3 Want Curse. Rows are labeled L P T, N P T kappa equals minus 2, N P T kappa equals 0, and N P T kappa equals 2.
* Row 1 L P T: Shows intersecting curves. For S 1 Do Curse, No decreases while Yes increases sigmoidally. For S 3 Do Scold, No remains high until theta equals 0 then drops. For S 3 Want Curse, Perhaps peaks at theta equals 0.
* Row 2 N P T kappa equals minus 2: Features flat dashed lines for Perhaps at high probability for S 1 Do Curse and S 3 Do Scold. S 3 Want Curse shows a flat dashed line at 0.6.
* Row 3 N P T kappa equals 0: Perhaps lines are flat at approximately 0.3 for S 1 Do Curse and 0.5 for S 3 Do Scold. S 3 Want Curse shows a flat Perhaps line at 0.2 with No and Yes intersecting at theta equals 0.
* Row 4 N P T kappa equals 2: Perhaps lines are flat near 0.0 for all three items. The No and Yes curves show a clear sigmoidal crossover, with No decreasing and Yes increasing as theta increases.
Figure 2 illustrates how LPT and NPT can produce different category probabilities for the same item. Under LPT, both internal decisions depend on
$\theta $
 . As
$\theta $
 increases, No generally decreases, Yes increases, and Perhaps is highest in the middle range of
$\theta $
 . This pattern appears in the first row of Figure 2. Under NPT,
$\kappa $
 determines whether respondents select Perhaps or proceed to the
$\theta $
 -based No/Yes decision. When
$\kappa $
 is low, Perhaps remains likely across
$\theta $
 , so changes in
$\theta $
 have limited effect on the observed response. As
$\kappa $
 increases, respondents are more likely to reach the second node, and the No and Yes curves become more responsive to
$\theta $
 .
The three items show different forms of process-specific item functioning. For the item S1DoCurse, LPT and NPT differ mainly in Perhaps. Under LPT, Perhaps is likely only within a limited middle range of
$\theta $
 , and response probabilities are mostly divided between No and Yes. Under NPT, Perhaps is mainly determined by
$\kappa $
 . When
$\kappa $
 is high, Perhaps has low probability, and the No and Yes curves resemble those under LPT for the same
$\theta $
 range. For S3DoScold, the main difference is that low to moderate
$\theta $
 mostly leads to No under LPT, but to Perhaps under NPT when
$\kappa $
 is low. Thus, across much of the
$\theta $
 range, predicted category probabilities under NPT depend strongly on
$\kappa $
 . For S3WantCurse, LPT assigns more probability to the middle category, whereas NPT can assign more probability to No at lower
$\theta $
 . This occurs because the first NPT node is easier to pass for this item, allowing more respondents to reach the
$\theta $
 -based No/Yes decision. These curve-level differences help explain the expected-score differences reported in Table 4.
Expected observed scores under LPT and NPT by item mode

Table 4 Long description
The table is organized into two primary categories: Do items and Want items. Each category has four columns: Item name, E super L P T, E super N P T, and Delta E.
For Do items, the items are S 1 through S 4 for Curse, Scold, and Shout. In all Do items, the E super N P T value is higher than the E super L P T value, resulting in positive Delta E values ranging from 0.05 to 0.93. The largest difference is in S 3 Do Shout (Delta E = 0.93).
For Want items, the items are S 1 through S 4 for Curse, Scold, and Shout. Unlike the Do items, many Want items show a decrease in expected scores under N P T. Specifically, S 1 Want Curse, S 1 Want Scold, S 2 Want Curse, S 2 Want Scold, S 3 Want Curse, and S 4 Want Curse all have negative Delta E values, ranging from minus 0.09 to minus 0.24. The items S 1 Want Shout, S 2 Want Shout, S 3 Want Scold, S 3 Want Shout, S 4 Want Scold, and S 4 Want Shout show positive Delta E values, with the highest being S 3 Want Shout at 0.79.
Expected scores are based on a scale where 0 equals No, 1 equals Perhaps, and 2 equals Yes. Delta E is calculated as E super N P T minus E super L P T.
Note: Expected scores are computed using the conventional coding
$0=\textit {No}$
 ,
$1=\textit {Perhaps}$
 , and
$2=\textit {Yes}$
 .
$\Delta \mathrm {E}[Y]=\mathrm {E}[Y^{\mathrm {NPT}}]-\mathrm {E}[Y^{\mathrm {LPT}}]$
 . The comparison applies the same observed-score rule to both processes. It should be read as the expected observed-score consequence of using conventional sum scoring when responses may arise from different response processes.
Expected item score differences: To describe the observed-score implications of the two response processes, we compare the expected item scores under LPT and NPT, denoted by
$\mathrm {E}[Y^{\mathrm {LPT}}_i]$
 and
$\mathrm {E}[Y^{\mathrm {NPT}}_i]$
 . These expected scores are computed using the conventional item scoring 0 = No, 1 = Perhaps, and 2 = Yes. For each MCMC draw s, we first compute
$p_{ijk}^{\mathrm {LPT}(s)}$
 , the probability that respondent j chooses category
$k=(0,1,2)$
 of item i under LPT. We then obtain the draw-specific average expected scores across respondents:

We summarize
$\mathrm {E}^{(s)}[Y^{\mathrm {LPT}}_i]$
 across draws to obtain the mean of
$\mathrm {E}[Y^{\mathrm {LPT}}_i]$
 . The expected item score under NPT,
$\mathrm {E}[Y^{\mathrm {NPT}}_i]$
 , is calculated similarly. The difference
$\Delta \mathrm {E}[Y_i]=\mathrm {E}[Y^{\mathrm {NPT}}_i]-\mathrm {E}[Y^{\mathrm {LPT}}_i]$
 is computed within each draw and then summarized across draws.
Table 4 summarizes expected observed scores under LPT and NPT. This comparison shows what can happen when responses from different processes are scored using the same conventional
$0,1,2$
 rule. Under this rule, the same item can contribute different expected observed scores depending on the response process. The differences are not uniform across items. For most items, the expected score under NPT is higher than under LPT. Several Want items show the opposite pattern, including S1WantCurse, S1WantScold, S2WantCurse, S2WantScold, S3WantCurse, and S4WantCurse. Thus, ignoring response-process heterogeneity can change how item responses contribute to a sum score, and the direction depends on the item.
Item-level prevalence and predictors: Recall that the item random effects
$v_i$
 index the prevalence of the LPT process for item i, with a larger
$\hat {v}_i$
 value that item i is more likely to elicit LPT, after accounting for the model terms included in the prevalence model. As shown in Figure 3, S3DoShout, S3WantShout, and S3DoScold showed the largest positive item effects, while S2WantScold, S1WantScold, and S1WantCurse showed the most negative item effects. These estimates indicate that some items were more likely than others to elicit LPT.
Item random effects
$\hat v_i$
 with 95% credible intervals.

Figure 3 Long description
A dot plot with a vertical y-axis ranging from negative 5.0 to 5.0, labeled v-hat sub i, and a horizontal x-axis with twenty-four categorical labels. A dashed horizontal line is at 0.0.
Legend details:
- Behavior: Circle for Curse, Square for Scold, Triangle for Shout.
- Mode: Blue for Do, Red for Want.
- Situation type: Thin outline for Other-to-blame, Thick outline for Self-to-blame.
Data trends from left to right:
- S 1 categories: Mostly below or near zero, with Want-Scold being the lowest point around negative 2.2.
- S 2 categories: Blue Do points are positive (0.7 to 1.1), while Red Want points are negative (negative 1.0 to negative 2.6).
- S 3 categories: Show the highest positive values, specifically S 3 Do Shout (triangle) at approximately 3.7 and S 3 Want Shout at 2.8.
- S 4 categories: Cluster closely around the zero line, ranging from negative 1.0 to 0.3.
Vertical error bars represent 95 percent credible intervals, with the widest intervals seen in the S 2 and S 3 categories.
To examine whether item differences relate to item features, Table 5 reports summaries from MIX-R and MIX-R+X. In the MIX-R column, item-level entries are post hoc regressions using posterior mean
$\hat v_i$
 as the outcome. In the MIX-R+X column, the same item features are included directly in the prevalence model. Both approaches give consistent results: Want items and blaming behaviors are associated with lower LPT prevalence, whereas self-to-blame items are associated with higher LPT prevalence. Expressive behavior shows no clear association. Together, these results suggest that item features help explain why some items are more likely than others to elicit LPT.
Model summaries and associations with response-process prevalence under MIX-R and MIX-R+X

Table 5 Long description
The table consists of three columns: Quantity, M I X minus R, and M I X minus R plus X.
Section 1: Latent associations.
- cov(theta-hat, kappa-hat): M I X minus R is -0.100 [-0.208, 0.010]; M I X minus R plus X is -0.100 [-0.208, 0.010].
- cov(theta-hat, u-hat): M I X minus R is -0.199 [-0.303, -0.091]; M I X minus R plus X is -0.185 [-0.290, -0.077].
Section 2: Person-level predictors.
- Female vs. male: M I X minus R is -0.078 (p = 0.25); M I X minus R plus X is 0.510 [-0.173, 1.205].
- Trait Anger score: M I X minus R is -0.013 (p < 0.05); M I X minus R plus X is -0.071 [-0.131, -0.011].
Section 3: Item-level predictors.
- Want vs. Do: M I X minus R is -1.361 (p < 0.01); M I X minus R plus X is -1.528 [-2.809, -0.386].
- Self-to-blame vs. other-to-blame: M I X minus R is 1.179 (p < 0.01); M I X minus R plus X is 1.602 [0.414, 2.780]. Both values are bolded.
- Blaming behavior: M I X minus R is -1.371 (p < 0.05); M I X minus R plus X is -2.010 [-3.402, -0.612].
- Expressive behavior: M I X minus R is -0.237 (p = 0.64); M I X minus R plus X is -0.450 [-1.771, 0.855].
Note: Values in brackets are 95% credible intervals. Bold values indicate that the interval excludes zero or, for the MIX-R posterior-estimate associations, that the corresponding test is statistically significant. Latent associations were computed as correlations among posterior-mean latent score estimates obtained under the independent-prior specification; a sensitivity analysis using a bivariate prior yielded the same substantive conclusions, with the covariate-adjusted
$\theta $
 -
$\kappa $
 association remaining weak and its 95% credible interval including zero (see Table S1 in the Supplementary Material). In the MIX-R column, person-level predictor entries are regression coefficients from models using posterior mean
$\hat u_j$
 as the outcome, and item-level predictor entries are regression coefficients from models using posterior mean
$\hat v_i$
 as the outcome. In the MIX-R+X column, predictor entries are coefficients estimated jointly in the prevalence model and are on the log-odds scale for following LPT rather than NPT. Scold and Curse are coded as blaming behavior, and Curse and Shout are coded as expressive behavior.
3.3.3 Person-level prevalence and latent scores
Table 5 also summarizes person-side results. Under both MIX-R and MIX-R+X, the posterior covariance between
$\hat \theta _j$
 and
$\hat \kappa _j$
 was weakly negative,
$-0.100$
 , with a 95% CrI of
$[-0.208,0.010]$
 including
$0$
 . This result should be interpreted cautiously because the main specification assigns independent priors to the two latent traits and does not treat their association as a primary estimand. As a sensitivity check, analyses using a bivariate normal prior for
$\theta _j,\kappa _j$
 produced the same general pattern of a weak negative association; these results are reported in Appendix A of the Supplementary Material.
The person-level covariate results describe whether respondent characteristics are associated with response-process prevalence. In MIX-R, post hoc regressions using posterior mean
$\hat u_j$
 as the outcome showed no clear gender association, but Trait Anger was negatively associated with
$\hat u_j$
 . MIX-R+X showed the same pattern when these covariates were included directly in the prevalence model. Conditional on the other terms in the prevalence model, respondents with higher Trait Anger scores were somewhat less likely to follow LPT and more likely to follow NPT.
3.4 Response-level prevalence and patterns
The response-level prevalence of LPT is
$\mathrm {E}[P_{\text {LPT}}]=0.488$
 (95% CrI
$[0.434,0.550]$
 ). In other words, about half of responses were expected to arise from the LPT process. As shown in Figure 4, this average masks substantial variation across both persons and items. Some respondents were consistently more likely to use LPT, whereas others were more likely to use NPT. Within the same respondent, LPT probability also varied by item. Some items such as S3DoShout tend to elicit LPT processes, while some items such as S2WantScold tend to show higher NPT prevalence.
Response-level prevalence of selected persons.
Note: Each row is a person, and each column is an item. Color encodes the response-level probability of using LPT: darker red indicates higher LPT probability, and darker blue indicates lower LPT probability. The figure highlights representative individuals with low overall LPT prevalence (
$ P_{\text {LPT}}<0.29$
 ) and high overall LPT prevalence (
$ P_{\text {LPT}}>0.66$
 ).

Figure 4 Long description
The Y-axis lists ten specific individuals: person 226, 209, 155, 124, and 34 in the top group, and person 278, 274, 271, 268, and 134 in the bottom group. The X-axis lists twenty-four items categorized by four scenarios (S 1 through S 4) and six actions: DoCurse, DoScold, DoShout, WantCurse, WantScold, and WantShout.
* The top five individuals (high L P T prevalence) show a horizontal band of predominantly red and light-pink circles, indicating high probability across most items. The darkest red peaks occur at S 3 DoShout and S 3 WantShout.
* The bottom five individuals (low L P T prevalence) show a horizontal band of predominantly blue and light-purple circles, indicating low probability. Even in this group, S 3 DoShout and S 3 WantShout remain the most frequent behaviors, appearing as light orange or red dots against the blue field.
* A vertical color legend on the right labeled p ranges from 0.00 (dark blue) to 0.50 (white) to 1.00 (dark red).
4 Simulation
We conduct three simulation studies to evaluate MIX-R. Study 1 examines whether predictive model comparison selects MIX-R when the data contain response-level process switching and favors simpler models when the data-generating process is simpler. Study 2 evaluates recovery of the overall prevalence of the target response process across a wide range of true values. Study 3 examines recovery of item parameters, person parameters, and person- and item-level prevalence under varying test length, sample size, and class balance. Across studies, we report bias, RMSE, 95% CrI coverage, and rank-order fidelity when applicable. All studies use a three-category response scale (
$ R=3$
 ) matching the LPT and NPT structures. Complete design details are provided in Appendix C of the Supplementary Material.
4.1 Simulation study 1: Model fit and model selection
4.1.1 Design
We evaluate whether the model selection criterion used in Section 3.3.1 favors the data-generating structure. We consider four generators: LPT, NPT, MIX-P, and MIX-R. For each generator, we simulate 25 datasets (
$ N \ { = } \ 500$
 ,
$I \ {= } \ 20$
 , and
$R\ { = } \ 3$
 ) and fit all four models under common priors, parameterizations, and MCMC controls. Predictive performance is summarized by
$\mathrm {LOOIC}$
 and
$p{\mathrm {LOO}}$
 . Within each generator condition, we report
$\Delta \mathrm {LOOIC}{=}\mathrm {LOOIC}{-}\mathrm {LOOIC}_{\text {ref}}$
 , where the generator-matched fit is the reference; negative values favor the comparison model. We also report the selected rate, the proportion of replications in which each fitted model had the smallest LOOIC among the four candidates. Additional design details can be found in Appendix C.1 of the Supplementary Material. To describe the realized degree of process separation, we computed response-level separation summaries for the MIX-R generated datasets using the true generating parameters; details are reported in Appendix D of the Supplementary Material. Across the 25 MIX-R datasets, average classification certainty had a mean of 0.93 and ranged from 0.79 to 1.00, with 0.50 indicating no separation. Thus, the MIX-R condition was informative but not artificially easy, because some response-level process memberships remained ambiguous.
4.1.2 Results
Across generator blocks, the true model typically attains the lowest mean LOOIC as shown in Table 6. When data were generated from a single process, the misspecified single-process alternative fit poorly. For example, when LPT generated the data, NPT had a mean
$\Delta LOOIC$
 of 1,046.08. When NPT generated the data, LPT had a mean
$\Delta LOOIC$
 of 1,393.73. When mixture structure is present, simpler models with lower
$p{\text {LOO}}$
 do not compensate for misspecification: under MIX-P, all competitors are far worse.
Predictive fit comparisons

Table 6 Long description
The table consists of six columns: Generator model, Fitted model, L O O I C (mean), p L O O (mean), Delta L O O I C, and Selected rate. Data is organized into four blocks based on the Generator model.
* L P T Generator block:
- Fitted L P T: L O O I C 12,674.88; p L O O 423.41; Delta 0.00; Selected rate 0.48.
- Fitted N P T: L O O I C 13,720.96; p L O O 607.78; Delta 1,046.08; Selected rate 0.00.
- Fitted M I X-P: L O O I C 12,675.11; p L O O 437.34; Delta 0.24; Selected rate 0.32.
- Fitted M I X-R: L O O I C 12,675.48; p L O O 427.94; Delta 0.61; Selected rate 0.20.
* N P T Generator block:
- Fitted N P T: L O O I C 11,836.66; p L O O 628.79; Delta 0.00; Selected rate 0.92.
- Fitted L P T: L O O I C 13,230.39; p L O O 427.65; Delta 1,393.73; Selected rate 0.00.
- Fitted M I X-P: L O O I C 11,851.02; p L O O 633.73; Delta 14.36; Selected rate 0.00.
- Fitted M I X-R: L O O I C 11,850.68; p L O O 630.98; Delta 14.02; Selected rate 0.08.
* M I X-P Generator block:
- Fitted M I X-P: L O O I C 12,329.48; p L O O 599.14; Delta 0.00; Selected rate 1.00.
- Fitted L P T: L O O I C 14,562.08; p L O O 448.03; Delta 2,232.60; Selected rate 0.00.
- Fitted N P T: L O O I C 13,675.35; p L O O 635.30; Delta 1,345.87; Selected rate 0.00.
- Fitted M I X-R: L O O I C 12,916.37; p L O O 655.10; Delta 586.89; Selected rate 0.00.
* M I X-R Generator block:
- Fitted M I X-R: L O O I C 13,289.12; p L O O 653.03; Delta 0.00; Selected rate 0.68.
- Fitted L P T: L O O I C 13,976.23; p L O O 441.24; Delta 687.11; Selected rate 0.04.
- Fitted N P T: L O O I C 13,693.53; p L O O 648.15; Delta 404.41; Selected rate 0.12.
- Fitted M I X-P: L O O I C 13,365.39; p L O O 649.09; Delta 76.27; Selected rate 0.16.
Note: Within each generator block,
$\Delta $
 LOOIC is computed relative to the generator-matched model. The selected rate is the proportion of replications in which each fitted model had the smallest LOOIC among the four candidates. Selected rates sum to one within each generator block.
The results also show that MIX-R did not spuriously dominate when the true data-generating process was simpler. Under the LPT generator, LPT had the lowest mean LOOIC, although MIX-P and MIX-R were very close; the selected rates were 0.48 for LPT, 0.32 for MIX-P, and 0.20 for MIX-R. Under the NPT generator, NPT was selected in 92% of replications, and MIX-R was selected in only 8%. Under the MIX-P generator, MIX-P was selected in all replications, whereas MIX-R was substantially worse, with a mean
$\Delta LOOIC$
 of 586.89. These findings indicate that when process heterogeneity is absent or purely between persons, the additional response-level flexibility of MIX-R is not favored by out-of-sample prediction.
When data were generated from MIX-R, the proposed model had the lowest mean LOOIC and the highest selected rate. MIX-R was selected in 68% of replications. Appendix E of the Supplementary Material shows that competitor selections occurred when realized LPT prevalence was near 0 or 1, so the generated data were close to simpler cases. Tables S8 and S9 in the Supplementary Material show little effect on
$\theta $
 or dominant-process item recovery, although rare-process parameters were less stable. The competing models had larger mean LOOIC values, with
$\Delta $
 LOOIC values of 687.11 for LPT, 404.41 for NPT, and 76.27 for MIX-P. Thus, the model comparison was sensitive to response-level process switching while remaining reasonably conservative when simpler structures approximated the generated data.
4.2 Simulation study 2: Recovery of overall prevalence
4.2.1 Design
We evaluate recovery of the overall prevalence of the LPT process,
$p_{\text {true}}$
 , which varied at nine levels from 0 to 1 (
$ p_{\text {true}}\in \{0,0.05,0.20,0.40,0.50,0.60,0.80,0.95,1\}$
 ). Data are generated from MIX-R; the prevalence intercept
$\alpha _0$
 is solved based on Equation (3), so the expected prevalence equals
$p_{\text {true}}$
 . Person/item effects and item parameters follow Table S10 in the Supplementary Material. We fix
$I\ { = } \ 20$
 ,
$N \ {= } \ 500$
 , and simulate 100 replications per level (900 datasets). Each dataset is fitted with the MIX-R model. For posterior draw s, we compute the draw-specific response-level prevalence, corresponding to Equation (4), as

The replication-level estimate is
$\hat {\bar {\pi }}_r=\mathrm {E}[\bar {\pi }^{(s)}]$
 , with 95% CrI obtained from the posterior quantiles of
$\bar {\pi }^{(s)}$
 . Full details appear in Appendix C.2 of the Supplementary Material.
4.2.2 Results
Across the 100 replications per condition, we report bias, RMSE, and 95% CrI coverage for
$\hat p_{r}$
 in Table 7. Estimates closely track the prevalence across conditions. In mid-range true prevalence (40%
$\sim $
 60%), bias was near zero and RMSE = 0.04 with coverage from 0.90 to 0.94. At the lower end (5%–20%), estimates showed small negative bias. At the upper end (80%–95%), estimates showed small positive bias. Coverage was stable across most of the interior but decreases at 95%, where the parameter is close to the boundary. At the hard boundaries (0% and 100%), both the point estimates and uncertainty collapse to the boundary.
Recovery of overall LPT prevalence

Table 7 Long description
The table consists of six columns and nine data rows.
Columns from left to right are:
1. p sub true: The true prevalence percentage.
2. Mean of hat over bar pi sub r: The estimated mean prevalence.
3. Median of hat over bar pi sub r: The estimated median prevalence.
4. Mean bias: Calculated as hat over bar pi sub r minus p sub true.
5. R M S E: Root Mean Square Error.
6. 95 percent C r I coverage: Credible Interval coverage.
Data rows by p sub true value:
* 0 percent: Mean 0.00, Median 0.00, Bias 0.00, R M S E 0.00, Coverage omitted.
* 5 percent: Mean 0.03, Median 0.05, Bias minus 0.02, R M S E 0.02, Coverage 0.89.
* 20 percent: Mean 0.17, Median 0.20, Bias minus 0.03, R M S E 0.04, Coverage 0.90.
* 40 percent: Mean 0.39, Median 0.40, Bias minus 0.01, R M S E 0.04, Coverage 0.91.
* 50 percent: Mean 0.50, Median 0.50, Bias 0.00, R M S E 0.04, Coverage 0.90.
* 60 percent: Mean 0.61, Median 0.60, Bias 0.01, R M S E 0.04, Coverage 0.94.
* 80 percent: Mean 0.83, Median 0.79, Bias 0.03, R M S E 0.04, Coverage 0.91.
* 95 percent: Mean 0.97, Median 0.94, Bias 0.02, R M S E 0.02, Coverage 0.80.
* 100 percent: Mean 1.00, Median 1.00, Bias 0.00, R M S E 0.00, Coverage omitted.
Note: Bias is computed as
$\hat {\bar {\pi }}_r-p_{\text {true}}$
 . Coverage is omitted at the hard boundaries because the posterior estimates collapse to 0 or 1.
Mean and median agree closely in the middle range, while small asymmetries appear near the edges: at 5%, the median equals the truth (0.05) but the mean is slightly below (0.03); at 80%–95%, the pattern reverses (mean
${\geq }$
 median). Figure 5 visualizes these patterns by plotting estimated prevalence against true prevalence across the full range.
Recovery of overall prevalence under MIX-R.
Note: Panel (a) shows the across-replication mean and median estimates at each true prevalence level. Panel (b) shows replication-level posterior means with 95% CrIs. The dashed diagonal is the identity line.

Figure 5 Long description
A two-panel scatter plot.
Panel a, titled Across-rep means/medians, has an x-axis labeled Mean true overall prevalence and a y-axis labeled Mean estimated overall prevalence, both scaled from 0.00 to 1.00. Data points for mean (circles) and median (triangles) estimators are plotted at intervals of approximately 0.1. All points sit directly on or extremely close to a dashed diagonal identity line, indicating high accuracy. A legend on the right identifies the Estimator symbols and Across-rep uncertainty represented by solid and dotted vertical lines.
Panel b, titled Replication-level means, has an x-axis labeled True overall prevalence and a y-axis labeled Estimated overall prevalence, both scaled from 0.00 to 1.00. This panel displays a much higher density of individual data points representing replication-level posterior means. Each point includes a vertical 95% C r I bar. The points and their associated credible intervals tightly follow the dashed diagonal identity line from the origin to the top-right corner, showing consistent recovery across the full range of prevalence values.
4.3 Simulation study 3: Person and item parameter recovery
4.3.1 Design
We assess recovery of item parameters for both trees (
$b^{A1}_i,b^{A2}_i;\ b^{B1}_i,b^{B2}_i$
 ), person parameters (
$\theta _j,\kappa _j$
 ), and unit-level LPT prevalence under MIX-R. We use a
$3{\times }2{\times }2$
 factorial design that varies
$p_{\text {true}}{\in }\{0.20,0.50,0.80\}$
 ,
$N{\in }\{500,2,000\}$
 , and
$I{\in }\{20,50\}$
 , with 25 replications per condition (300 datasets). Within each
$(I,N)$
 cell, the same person and item parameters were reused across prevalence conditions, so changes across
$p_{\text {true}}$
 reflect class balance rather than different parameter draws. Data were generated from MIX-R and fitted with MIX-R and a misspecified LPT model. Because LPT does not include
$b^{B1}_i$
 ,
$b^{B2}_i$
 , or
$\kappa _j$
 , cross-model comparisons focus on
$b^{A1}_i$
 ,
$b^{A2}_i$
 , and
$\theta _j$
 . We report bias, RMSE, 95% CrI coverage, and rank-order fidelity (within-replication Pearson r, Fisher-z averaged); full design details and condition-wise summaries are provided in Appendix C.3 of the Supplementary Material.
4.3.2 Results
Item parameters: Across all conditions, MIX-R recovers the LPT thresholds
$(b^{A1}_i,b^{A2}_i)$
 accurately, with near-zero bias, high rank fidelity, and close-to-nominal coverage. Recovery improved when LPT was more prevalent and when more item responses were available. In contrast, the misspecified LPT model showed large bias and severe under-coverage when the true data included substantial NPT use.
As shown in Figure 6, the LPT fit improved as
$p_{\text {true}}$
 increased, but its CrIs remained narrow, with coverage far below the nominal 95% level even when LPT was dominant. These results show that ignoring response-process heterogeneity can distort item-threshold recovery. NPT threshold recovery under MIX-R depended more strongly on class balance. When NPT was sufficiently represented,
$b^{B1}_i$
 and
$b^{B2}_i$
 were recovered with good accuracy and high rank fidelity. When LPT dominated, information for the NPT first node decreased, leading to larger RMSE and weaker rank recovery for
$b^{B1}_i$
 . Complete condition-wise results are reported in Table S11 in the Supplementary Material. Figure S3 in the Supplementary Material provides representative item-level recovery plots, showing that MIX-R estimates align with the true values when both processes are sufficiently represented.
Recovery of LPT item thresholds
$b^{A1}$
 and
$b^{A2}$
 under MIX-R and the misspecified LPT model.

Figure 6 Long description
A multi-panel figure with four main sections labeled a through d. Each section contains two sub-plots for b A 1 and b A 2. The x-axis for all plots shows four conditions: I 20 N 500, I 20 N 2000, I 50 N 500, and I 50 N 2000. Legends indicate circles for the L P T model and triangles for the M I X dash R model, with line shades representing prevalence at 20 percent, 50 percent, and 80 percent.
* Panel a, Mean Bias: Values for b A 1 are clustered near zero for both models. For b A 2, the L P T model shows higher positive bias (0.5 to 1.0) compared to the M I X dash R model, which remains closer to zero.
* Panel b, R M S E: In both b A 1 and b A 2, the L P T model (circles) shows significantly higher R M S E values, ranging from 0.4 to 1.2, while the M I X dash R model (triangles) maintains lower R M S E values below 0.3.
* Panel c, Fisher-z aggregated correlation (r): The M I X dash R model shows high, stable correlations near 1.0. The L P T model shows lower and more variable correlations, particularly at lower prevalence levels, ranging from 0.5 to 0.9.
* Panel d, 95 percent C I Coverage: The M I X dash R model shows consistent coverage near 100 percent. The L P T model shows much lower and highly variable coverage, fluctuating between 0 percent and 75 percent across different conditions.
Person estimates: MIX-R also recovered the target trait
$\theta _j$
 well as shown in Figure 7.
Recovery of person traits
$\theta $
 and
$\kappa $
 under MIX-R and the misspecified LPT model.

Figure 7 Long description
The figure consists of four panels arranged in a two-by-two grid. Each panel contains two sub-plots for theta and kappa. The x-axis for all plots shows four conditions: I 20 N 500, I 20 N 2000, I 50 N 500, and I 50 N 2000. Legends indicate Model types (L P T as circles with dashed lines, M I X dash R as triangles with solid lines) and Prevalence levels (20 percent in light gray, 50 percent in medium gray, and 80 percent in dark gray).
* Panel a, Bias: For theta, L P T shows high positive Mean Bias ranging from 0.2 to 0.8, increasing with prevalence. M I X dash R remains near zero. For kappa, both models show near-zero bias with vertical error bars.
* Panel b, R M S E: For theta, R M S E for L P T is higher (0.5 to 0.8) compared to M I X dash R (0.3 to 0.5). Both show a slight decrease at I 50 conditions. For kappa, M I X dash R R M S E is higher at lower prevalence.
* Panel c, Fisher-r: For theta, both models show high correlation r near 1.0. For kappa, M I X dash R shows higher correlation (0.4 to 0.9) than L P T, which is not plotted for kappa.
* Panel d, Coverage: For theta, M I X dash R maintains 95 percent C I Coverage across all conditions. L P T coverage drops significantly at I 50 conditions, falling as low as 30 percent for low prevalence. For kappa, M I X dash R maintains near 95 percent coverage throughout.
Recovery improved mainly with test length, as person information increases with the number of items.
$\kappa _j$
 was more sensitive to class balance: recovery was strongest when NPT was sufficiently represented and weaker when LPT dominated. The misspecified LPT model performed worse for
$\theta _j$
 , especially when LPT was not the dominant process, showing that response-process misspecification can propagate to person-score estimation. Full summaries are provided in Table S12 in the Supplementary Material, and representative person-level recovery plots can be found in Figure S4 in the Supplementary Material.
Unit-level prevalence: MIX-R reproduces both person-level
$(\hat \pi _j)$
 and item-level
$(\hat \pi _i)$
 LPT prevalences with small bias across conditions as shown in Table 8. Item-level prevalence was recovered especially well, with strong rank fidelity that improved with larger N. Person-level prevalence showed lower rank fidelity, especially when
$p_{\text {true}}=0.80$
 , but bias and RMSE remained modest. As shown in Table 8, increasing I improved person-level recovery, whereas increasing N improved item-level recovery. Figure 8 illustrates the same pattern in the high-information condition. Overall, MIX-R recovered unit-level prevalence well enough to support both person- and item-level summaries of process use.
Recovery of person- and item-level LPT prevalence under MIX-R

Table 8 Long description
The table is divided into two main sections by Unit: Person and Item. Each section evaluates prevalence rates of 20%, 50%, and 80% across combinations of I equals 20 or 50 and N equals 500 or 2,000.
For the Person unit:
* At 20% prevalence, Mean bias ranges from 0.00 to 0.03, R M S E from 0.09 to 0.10, and Fisher-r mean from 0.46 to 0.56.
* At 50% prevalence, Mean bias ranges from 0.00 to 0.05, R M S E from 0.11 to 0.13, and Fisher-r mean from 0.39 to 0.63.
* At 80% prevalence, Mean bias ranges from 0.02 to 0.06, R M S E from 0.10 to 0.12, and Fisher-r mean from 0.27 to 0.57.
For the Item unit:
* At 20% prevalence, Mean bias ranges from 0.00 to 0.03, R M S E from 0.04 to 0.09, and Fisher-r mean from 0.92 to 0.98.
* At 50% prevalence, Mean bias ranges from 0.00 to 0.05, R M S E from 0.05 to 0.12, and Fisher-r mean from 0.94 to 0.99.
* At 80% prevalence, Mean bias ranges from 0.02 to 0.06, R M S E from 0.07 to 0.14, and Fisher-r mean from 0.76 to 0.94.
Across both units, Mean 95% C r I coverage generally stays between 86.3% and 97.0%. Higher N values (2,000) consistently result in lower Mean bias and R M S E compared to N equals 500.
Note: Person-level prevalence is
$\hat \pi _j$
 , and item-level prevalence is
$\hat \pi _i$
 . Truths are computed from the simulated response-process indicators
$C_{ij}$
 . Fisher-r summarizes rank-order recovery within each replication and is averaged using Fisher-z transformation.
Recovery of unit-level LPT prevalence in the high-information condition (
$I=50$
 ,
$N=2,000$
 ).

Figure 8 Long description
A two-panel figure with a shared legend on the right. Both panels use an x-axis for True prevalence and a y-axis for Estimated prevalence, both ranging from 0.00 to 1.00. A dotted diagonal line represents perfect estimation accuracy.
Panel a, labeled person-level prevalence, shows three distinct horizontal clusters of data points.
* The bottom cluster, represented by light gray circles, corresponds to 20% prevalence and sits mostly above the diagonal line at low true prevalence values.
* The middle cluster, represented by medium gray triangles, corresponds to 50% prevalence and forms a dense horizontal band centered around 0.50 on the y-axis.
* The top cluster, represented by dark gray squares, corresponds to 80% prevalence and forms a horizontal band centered around 0.80 on the y-axis.
Panel b, labeled item-level prevalence, shows all data points tightly clustered along the dotted diagonal line.
* Light gray circles are concentrated at the bottom-left (0.00 to 0.25).
* Medium gray triangles are concentrated in the center (0.25 to 0.75).
* Dark gray squares are concentrated at the top-right (0.75 to 1.00).
The legend on the far right identifies the shapes and shades: circles for 20%, triangles for 50%, and squares for 80% prevalence.
5 Discussion
Understanding how respondents arrive at a response category is important for establishing validity and refining item content and design. IRTree models are well suited for this purpose because they represent response processes as sequential stages. Existing approaches often assume that all respondents follow the same process, or that a given respondent follows the same process across all items. These assumptions can be restrictive when item content and wording elicit distinct response processes. To address this limitation, in this study, we introduce a response-level mixture IRTree model, namely, MIX-R, to capture both the between- and within-person variation in response processes.
The MIX-R framework uses IRTree models to represent distinct response processes and models the probability of using each process as a function of person-, item-, and response-level covariates. In this sense, MIX-R extends mixture IRTree work that models heterogeneity across respondents or in the use of particular categories by allowing the whole response process to vary at the response level (Alagöz & Meiser, Reference Alagöz and Meiser2024; Kim & Bolt, Reference Kim and Bolt2021; Tijmstra & Bolsinova, Reference Tijmstra and Bolsinova2025; Tijmstra et al., Reference Tijmstra, Bolsinova and Jeon2018). Although this study demonstrates MIX-R using three-category items with two response processes, the framework can be generalized to items with more response categories or more than two processes.
Using verbal aggression data, we demonstrated several empirical uses of the MIX-R. First, MIX-R shows how item functioning can differ across response processes, including differences in category probabilities and expected observed scores. Second, it estimates response-level process prevalence and can therefore help diagnose how response categories are used in Likert-type data (e.g., whether Perhaps functions as qualitatively distinct from No and Yes). Third, it links response-process prevalence to item- and person-level covariates. These results show how MIX-R can support the design and validation of Likert-type measurement scales.
5.1 Simulation summary
The simulation studies supported the performance of MIX-R in three ways. First, predictive model comparison favored MIX-R when the data were generated with response-level process switching, but did not automatically favor MIX-R when the true structure was simpler. This suggests that MIX-R’s added flexibility does not by itself lead to systematic over-selection. Beyond model selection, the overall prevalence of LPT was recovered accurately across a wide range of true values, especially when the true prevalence was away from the boundaries. This supports model-implied prevalence summaries as interpretable measures of process use. Furthermore, item parameters, person parameters, and unit-level prevalence were generally recovered well when both response processes were sufficiently represented. Recovery became harder when one process dominated, especially for parameters tied to the less frequent process. Thus, process-specific item and person parameters should be interpreted alongside the estimated prevalence of the corresponding process. The misspecified LPT model showed larger bias and poorer coverage when the true responses came from a response-level mixture, indicating that ignoring process heterogeneity can distort both item and person inference.
5.2 Empirical findings
In the verbal aggression data, MIX-R provided an interpretable account of response-process variation. MIX-R and MIX-P yielded better model fit than the single-process models, supporting a mixture of LPT and NPT processes in the data. The MIX-R results also showed between-item variation in LPT prevalence, suggesting that respondents may switch processes across items and that response-process variation can occur both between and within persons.
The empirical results showed that process choice matters for item functioning and scoring. Category response curves showed that the same item can produce different probabilities of No, Perhaps, and Yes under LPT and NPT. When the same
$0,1,2$
 scoring rule was applied, expected observed scores also differed across processes, showing how conventional scores can change when response-process heterogeneity is ignored. We also found that response-process prevalence was related to item content and respondent characteristics. Want items and blaming behaviors were associated with lower LPT prevalence, whereas self-to-blame items were associated with higher LPT prevalence. Trait Anger was associated with lower LPT prevalence, suggesting that process use may vary with respondent characteristics as well as item features.
5.3 Implications for modeling and practice
Methodologically, the results caution against treating response categories as having single process meaning. The response-style literature has long shown that observed categories can reflect systematic response tendencies rather than only the target trait (Baumgartner & Steenkamp, Reference Baumgartner and Steenkamp2001). MIX-R extends this concern from category use to response-process use (Plieninger & Meiser, Reference Plieninger and Meiser2014): a category such as Perhaps may not simply reflect a global midpoint preference; it may arise from distinct processes that are engaged differently across items and respondents. If process switching is ignored, item parameters and person scores can be process-confounded, and model comparisons may favor an overly simple structure when mixtures are present. MIX-R provides a principled way to examine this possibility through predictive model comparison and person- and item-level prevalence diagnostics.
Substantively, our findings align with the idea that item content can shape response processes (De Boeck & Wilson, Reference De Boeck and Wilson2004; Tourangeau et al., Reference Tourangeau, Rips and Rasinski2000). The distinction between wanting to acting aggressively and actually doing so is central to the verbal aggression framework, where inhibition is reflected in the gap between aggressive impulses and expressed behavior (Smits et al., Reference Smits, De Boeck and Vansteelandt2004). In our results, contexts that emphasize immediate outward expression, such as Do–Shout, tended to lead respondents toward decisions that accentuate the No/Yes distinction, whereas more reflective Want contexts often kept the Perhaps path available. These process differences can change expected scores measured by the instrument and, in turn, conclusions about item severity, person ordering, and associations with covariates such as Trait Anger. It is worth noting that, in our empirical data analysis, the item parameters and covariate effects were estimated jointly. This modeling strategy was motivated by the substantive assumptions regarding the influence of item and person characteristics on response processes. In applications where the number of covariates is relatively large or the analysis is primarily exploratory, however, the stepwise estimation approach (Alagöz et al., Reference Alagöz, Meiser and Khorramdel2025; Vermunt, Reference Vermunt2010), in which the item parameters are estimated first, followed by the estimation of covariate effects, can be more desired.
More broadly, these findings are consistent with survey-methodology work showing that respondent answers are shaped by both question features and respondent characteristics. Reference Olson, Smyth and GanshertOlson et al. (Reference Olson, Smyth and Ganshert2019) showed that question and respondent characteristics are associated with respondent answering behaviors, including behaviors related to comprehension and response mapping. From this perspective, different items in the same scale may invite different response processes, and respondents may differ in which process they are more likely to use. MIX-R represents this variation statistically by allowing response-process membership to vary across responses and by relating this variation to item and respondent characteristics.
A complementary use of MIX-R is to support substantive analyses of existing data without assigning each response definitively to a single process. Person-level estimates and derived scores average over uncertainty in process membership, enabling process-adjusted comparisons while retaining uncertainty about how responses were generated. Researchers may compare person rankings, group differences, or associations with external criteria across a conventional single-process model and MIX-R to assess whether conclusions depend on assumptions of process homogeneity. MIX-R may yield wider posterior intervals when some processes provide less information about the target construct, but this appropriately reflects uncertainty that a misspecified single-process model would conceal. Evaluating the consequences of such uncertainty for statistical power and downstream analyses is an important direction for future research.
5.4 Limitations and future research
Like the IRTree model, the proposed MIX-R model implicitly assumes that within-item subprocesses are conditionally independent. In the IRTree model, violation of this assumption may result in lower item slope estimates for later decision nodes (Jeon, Reference Jeon2023; Lyu et al., Reference Lyu, Bolt and Westby2023). Accordingly, an important limitation of the present study is that the source of the class heterogeneity cannot be definitively determined. Specifically, it remains unclear whether the identified class heterogeneity reflects substantive differences in the underlying psychological response processes or instead captures residual conditional dependence across decision nodes. Although the conditional independence assumption cannot be directly evaluated, one can use the recently developed latent space item response model (LSIRM; Jeon et al., Reference Jeon, Jin, Schweinberger and Baugh2021) to explore the potential person-by-item interactions.
Several other limitations also remain and suggest directions for future research. First, our simulations covered only part of the possible design space. We varied test length, sample size, and process prevalence, but did not fully vary class separation, item-parameter extremity, or the number and structure of response processes. These factors are likely to affect model selection, parameter recovery, and prevalence estimation. Future simulation work should therefore examine how much information is needed to distinguish response processes under different levels of class balance, process separation, and test length.
Second, interpreting latent traits associated with response processes requires external validation. In this study,
$\kappa $
 was modeled as distinct from the target trait and was interpreted in relation to respondents’ willingness to give a definitive response. However, the empirical analysis relied on predictive fit and model diagnostics rather than observed ground-truth process labels. Future studies could combine MIX-R with additional evidence, such as cognitive interviews, think-aloud protocols, response times, mouse tracking, or other process data, to evaluate whether the modeled processes correspond to respondents’ actual response behavior. This is especially important because model-implied process labels may reflect several mechanisms, including effortful response behavior and satisficing (Krosnick, Reference Krosnick1991), sensitivity (Tourangeau & Yan, Reference Tourangeau and Yan2007), or response style (Van Vaerenbergh & Thomas, Reference Van Vaerenbergh and Thomas2013). Conceptually distinct response processes and response styles may produce overlapping category-response patterns. Appendix G.2 of the Supplementary Material illustrates how these sources of heterogeneity can be represented jointly in a richer five-category scale, where response-level process membership determines the organization of the response decisions, whereas a separate extremity factor governs endpoint use within either process. In the present three-category NPT, however, an omitted midpoint tendency affecting the directed-versus-middle decision may be absorbed by
$\kappa $
 . More generally, omitted response styles may affect process-specific traits, prevalence estimates, or item parameters. Although this potential confounding does not imply that
$\kappa $
 is itself a response-style parameter because it affects responses only when NPT is engaged, it warrants caution in interpreting estimated process prevalence. Such prevalence should be viewed as evidence consistent with the specified trees rather than as evidence necessarily free of response-style influence.
Third, the present application focused on two response processes for three-category items. The choice of candidate trees should be made deliberately, based on theory, item content, and the response processes that are plausible for the assessment context. Although MIX-R can be generalized to more than two processes and to items with more response categories, these extensions raise additional questions about identifiability, prior choice, and computation. Future work could connect MIX-R with dynamic IRTree models, which study within-person changes in response strategies over item position (Merhof & Meiser, Reference Merhof and Meiser2023), or with response-time mixture models that use auxiliary information to distinguish response strategies (Huang et al., Reference Huang, Luo and Jeon2025). Future work could also examine how to select and regularize covariates when person-, item-, and response-level predictors are included in the prevalence model.
Finally, future work can use MIX-R for item evaluation and scale refinement. Items that consistently elicit unintended or mixed response processes may be revised, retained as diagnostic items, or studied further to understand how wording and content shape response behavior. In this sense, MIX-R can connect response-process theory with item design. Separating response process from response style can support richer psychological inference and more defensible measurement in multicategory self-report settings.
Supplementary material
The supplementary material for this article can be found at https://doi.org/10.1017/psy.2026.10146.
Data availability statement
The empirical data analyzed in this study are publicly available, and the data source is described and cited in the article. The analysis code is available at https://github.com/jevanluo/MIX-R-paper-code .
Funding statement
No funding was received to assist with the preparation of this manuscript.
Competing interests
M.J. is an Associate Editor for Psychometrika, but was excluded completely from the review process. The remaining authors have no other relevant financial or non-financial interests to disclose.
Ethical standards
This study is a secondary analysis of existing data, and ethics approval is waived.
Consent to participate
This study is a secondary analysis of existing data, and informed consent is waived.
Consent to publication
This study is a secondary analysis of existing data, and consent publication is waived.

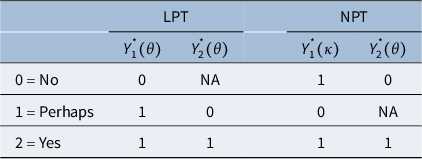
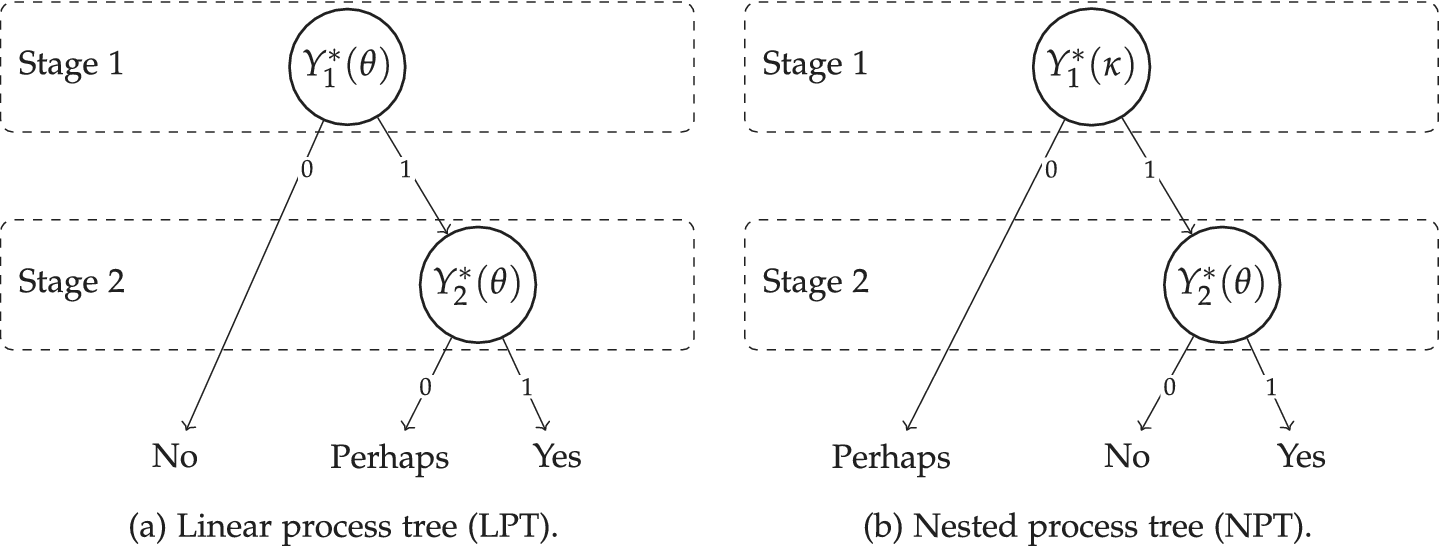
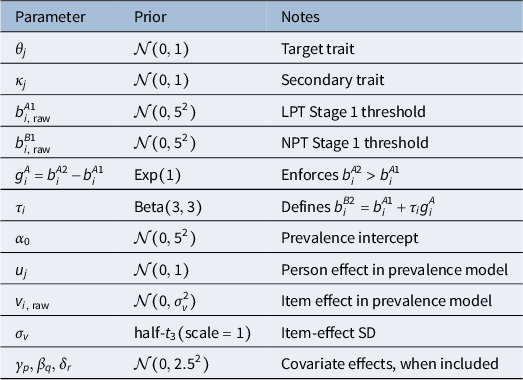
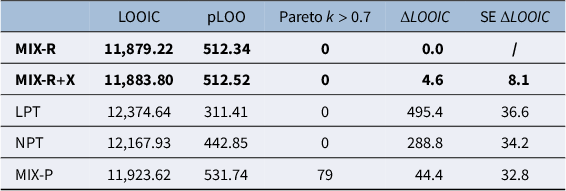
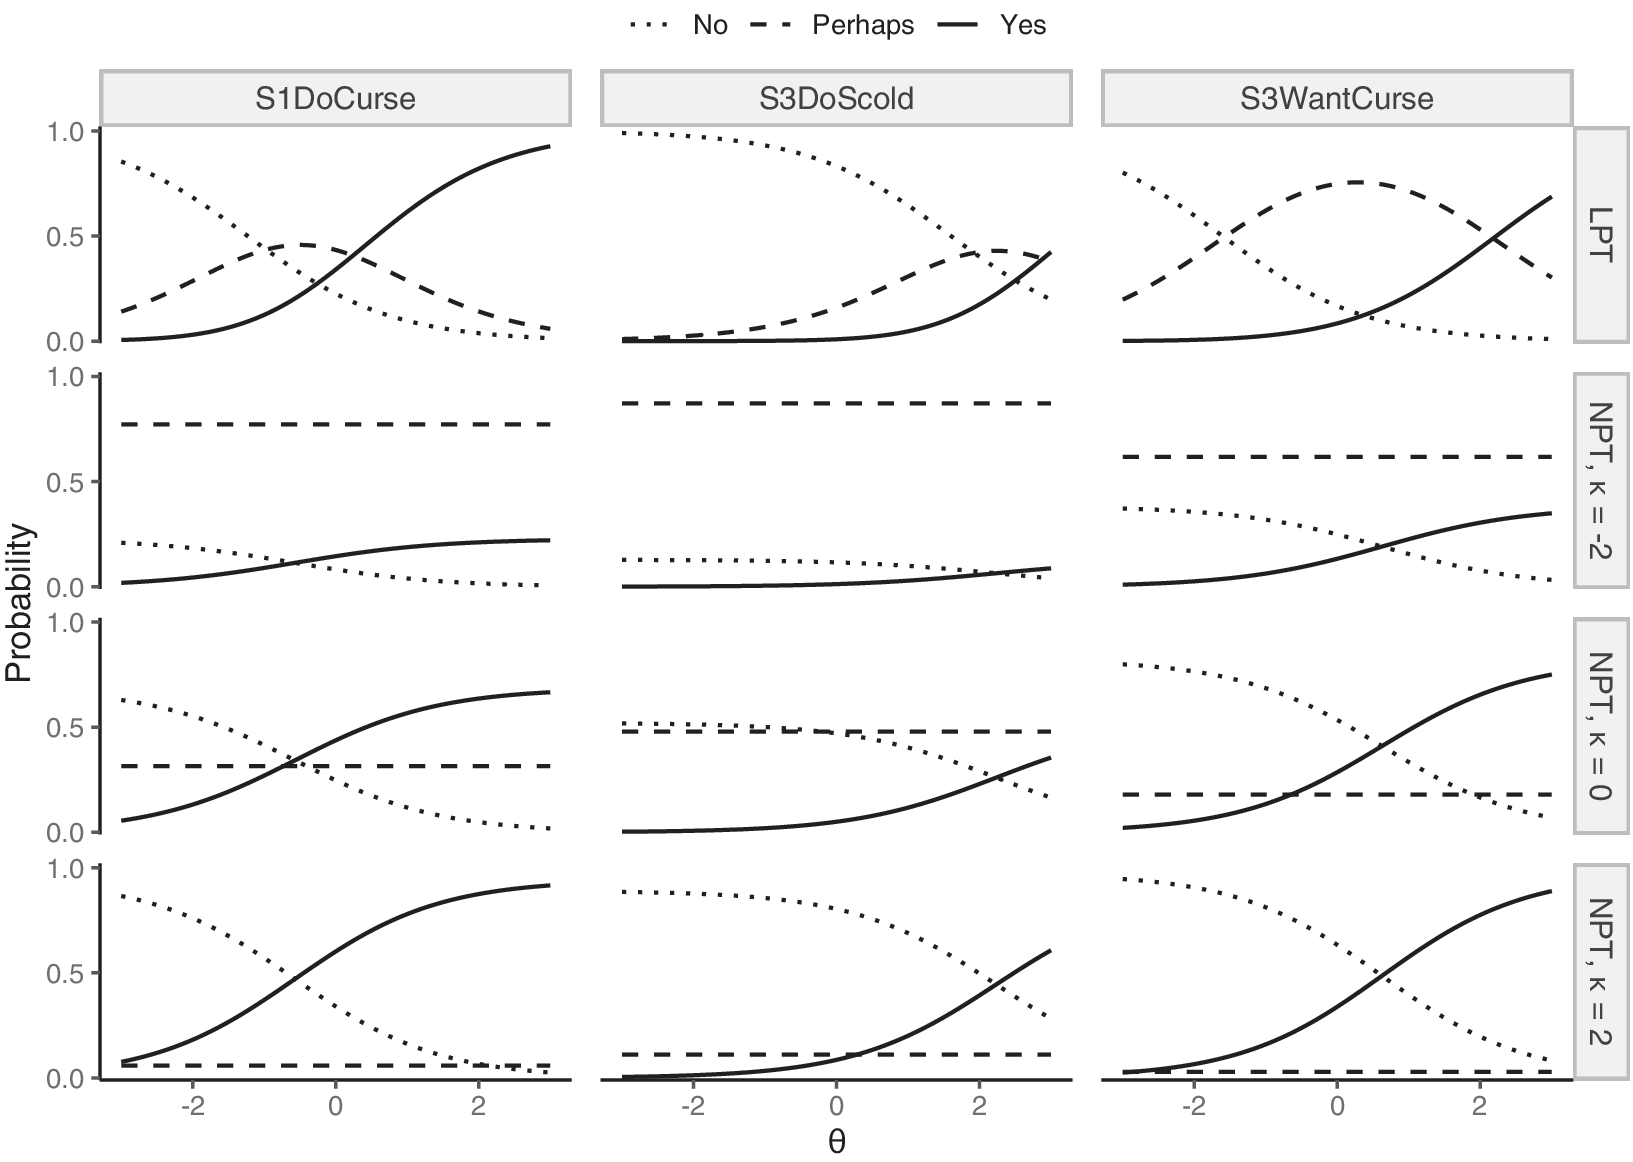


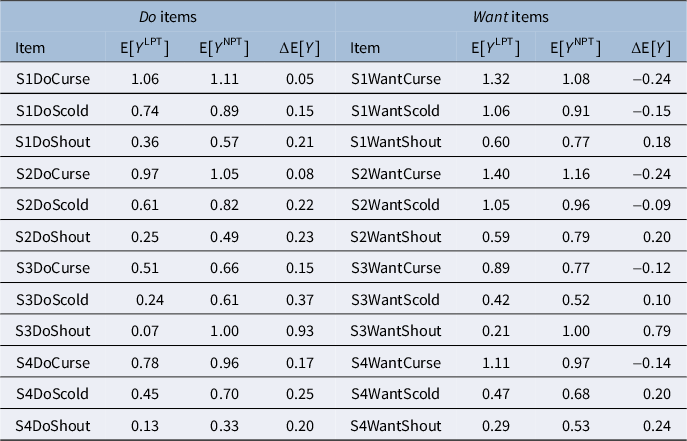
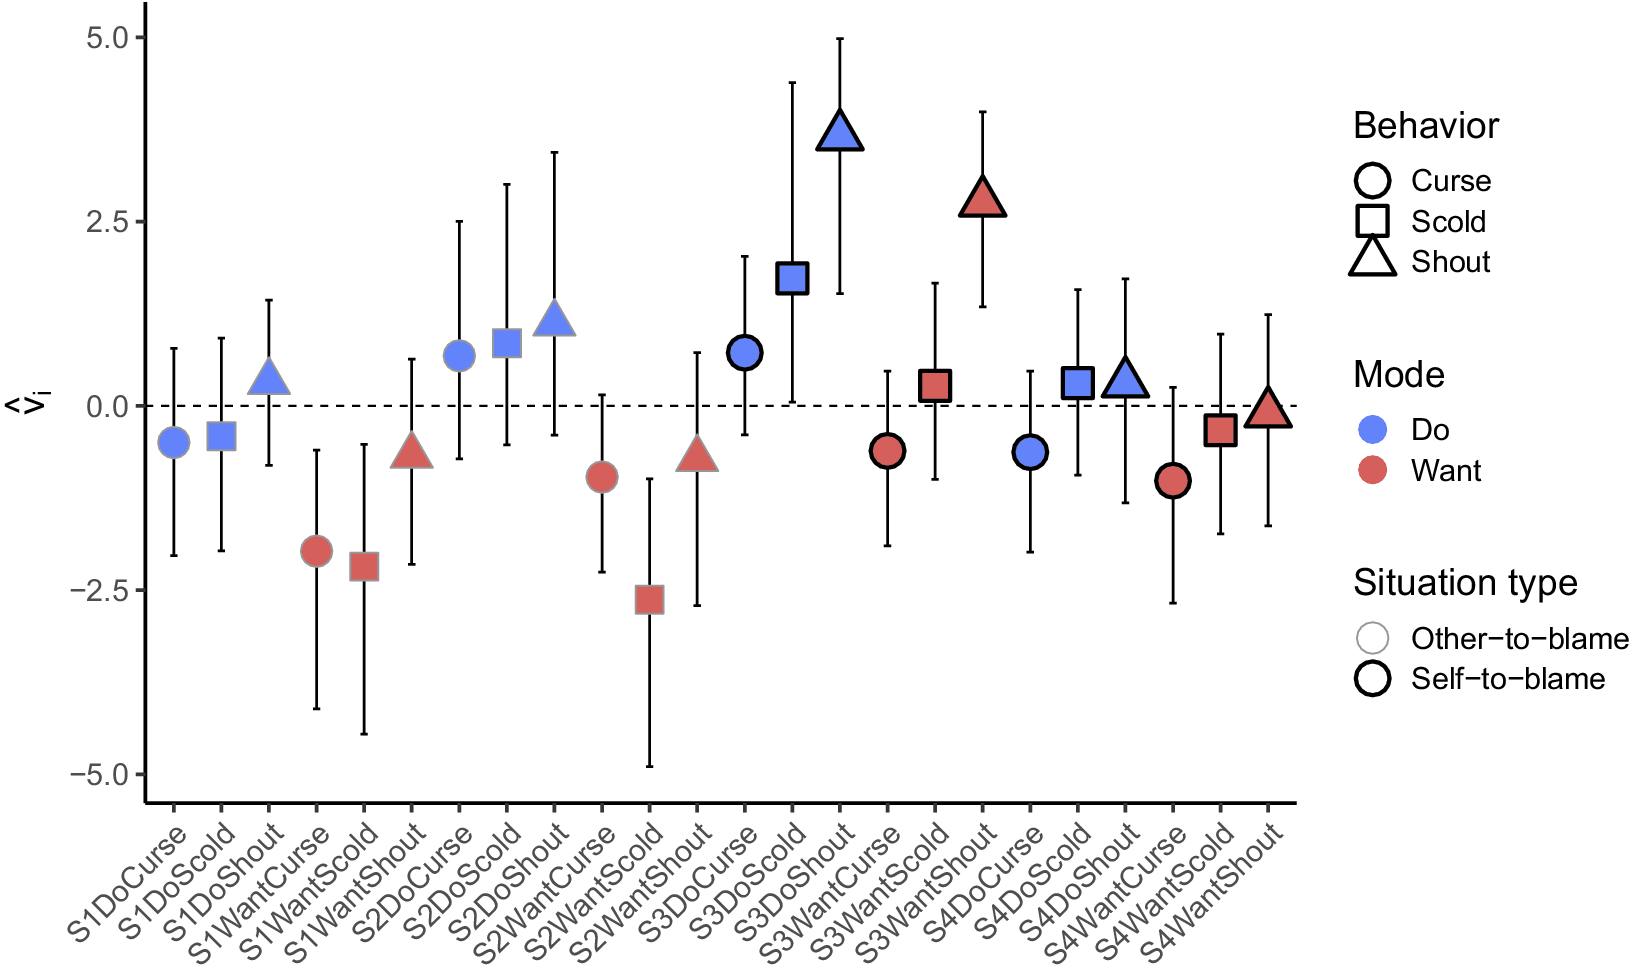

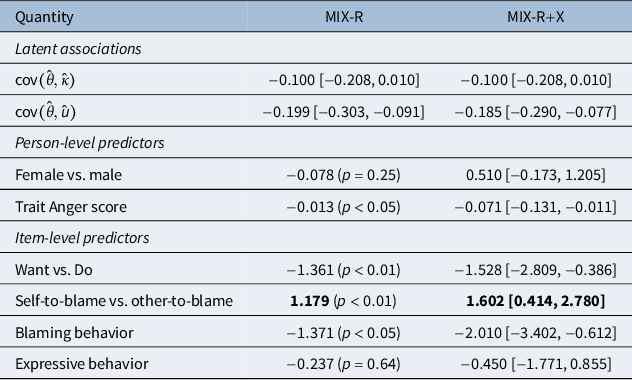


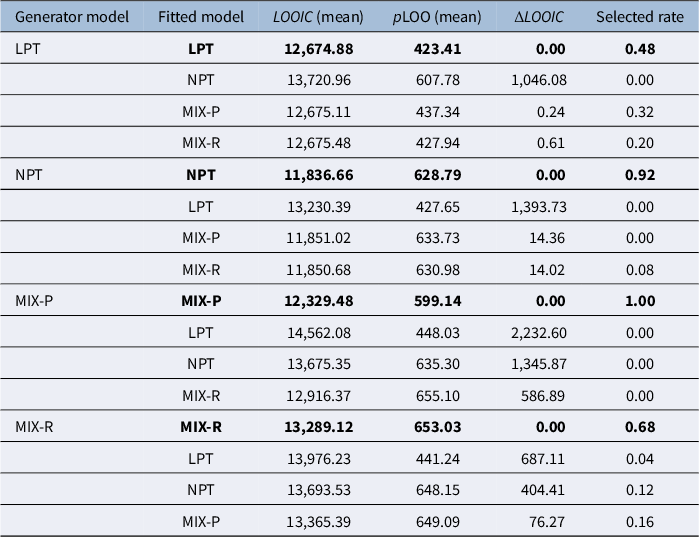
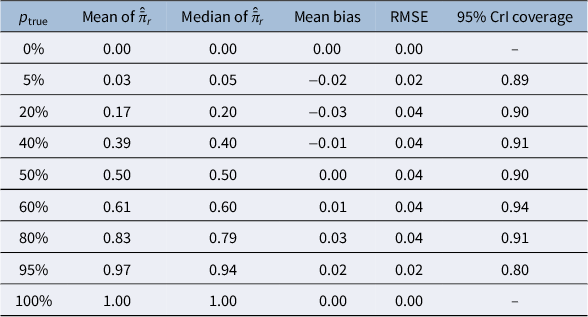
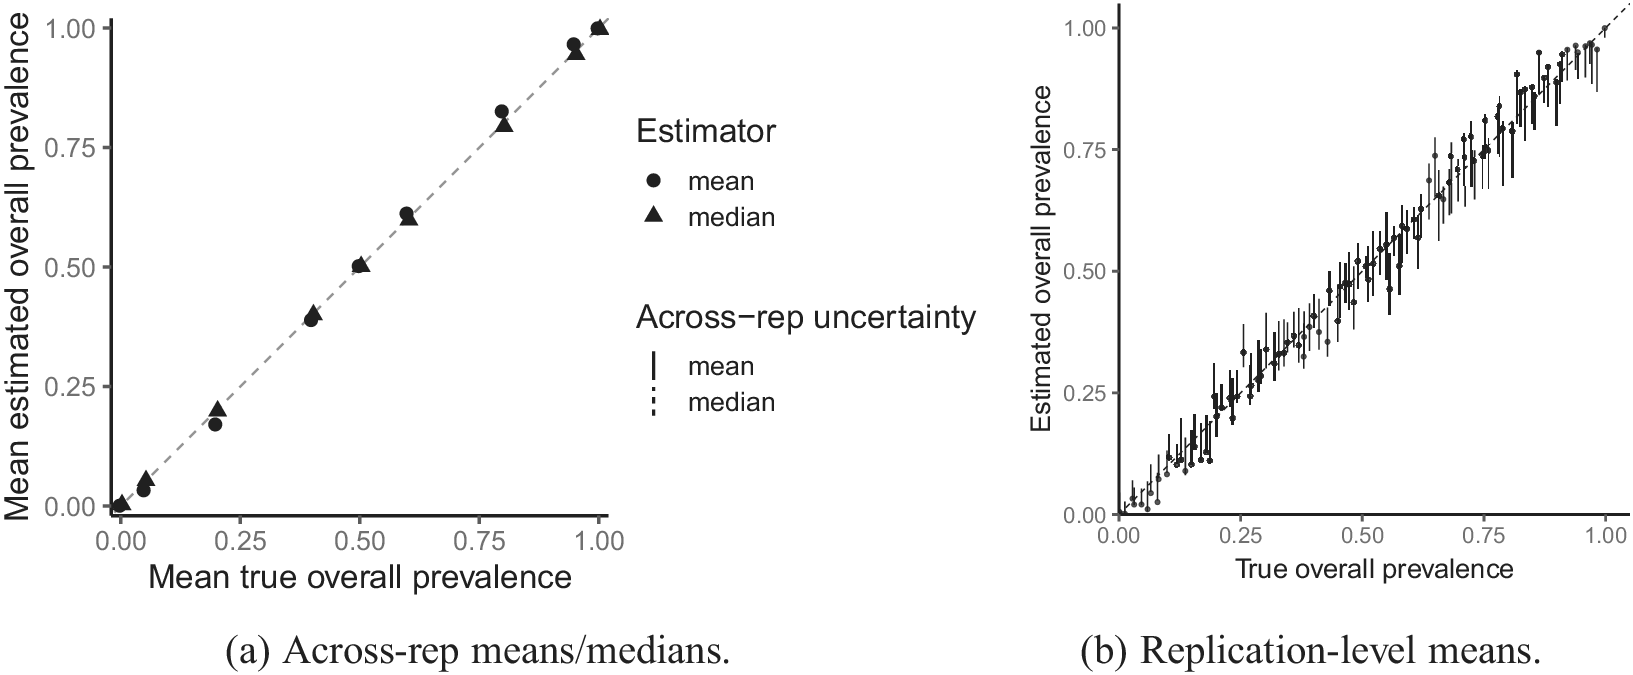
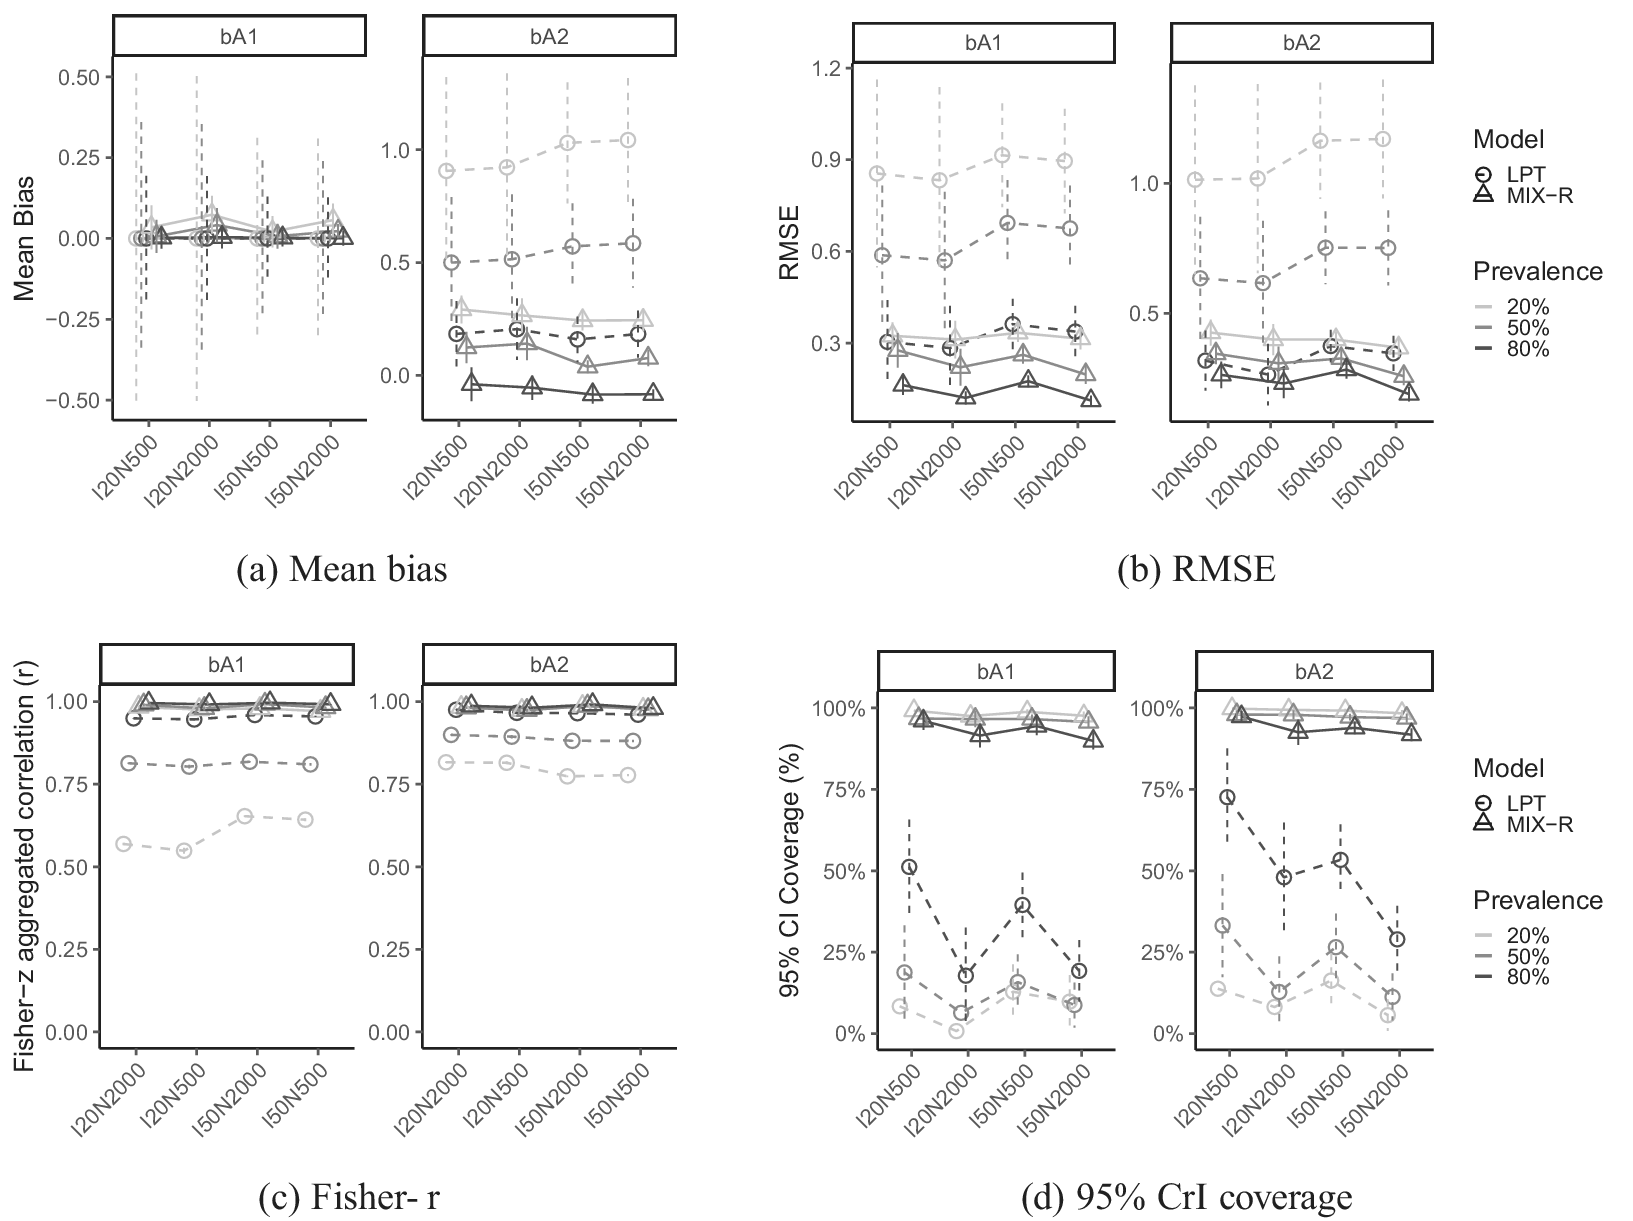


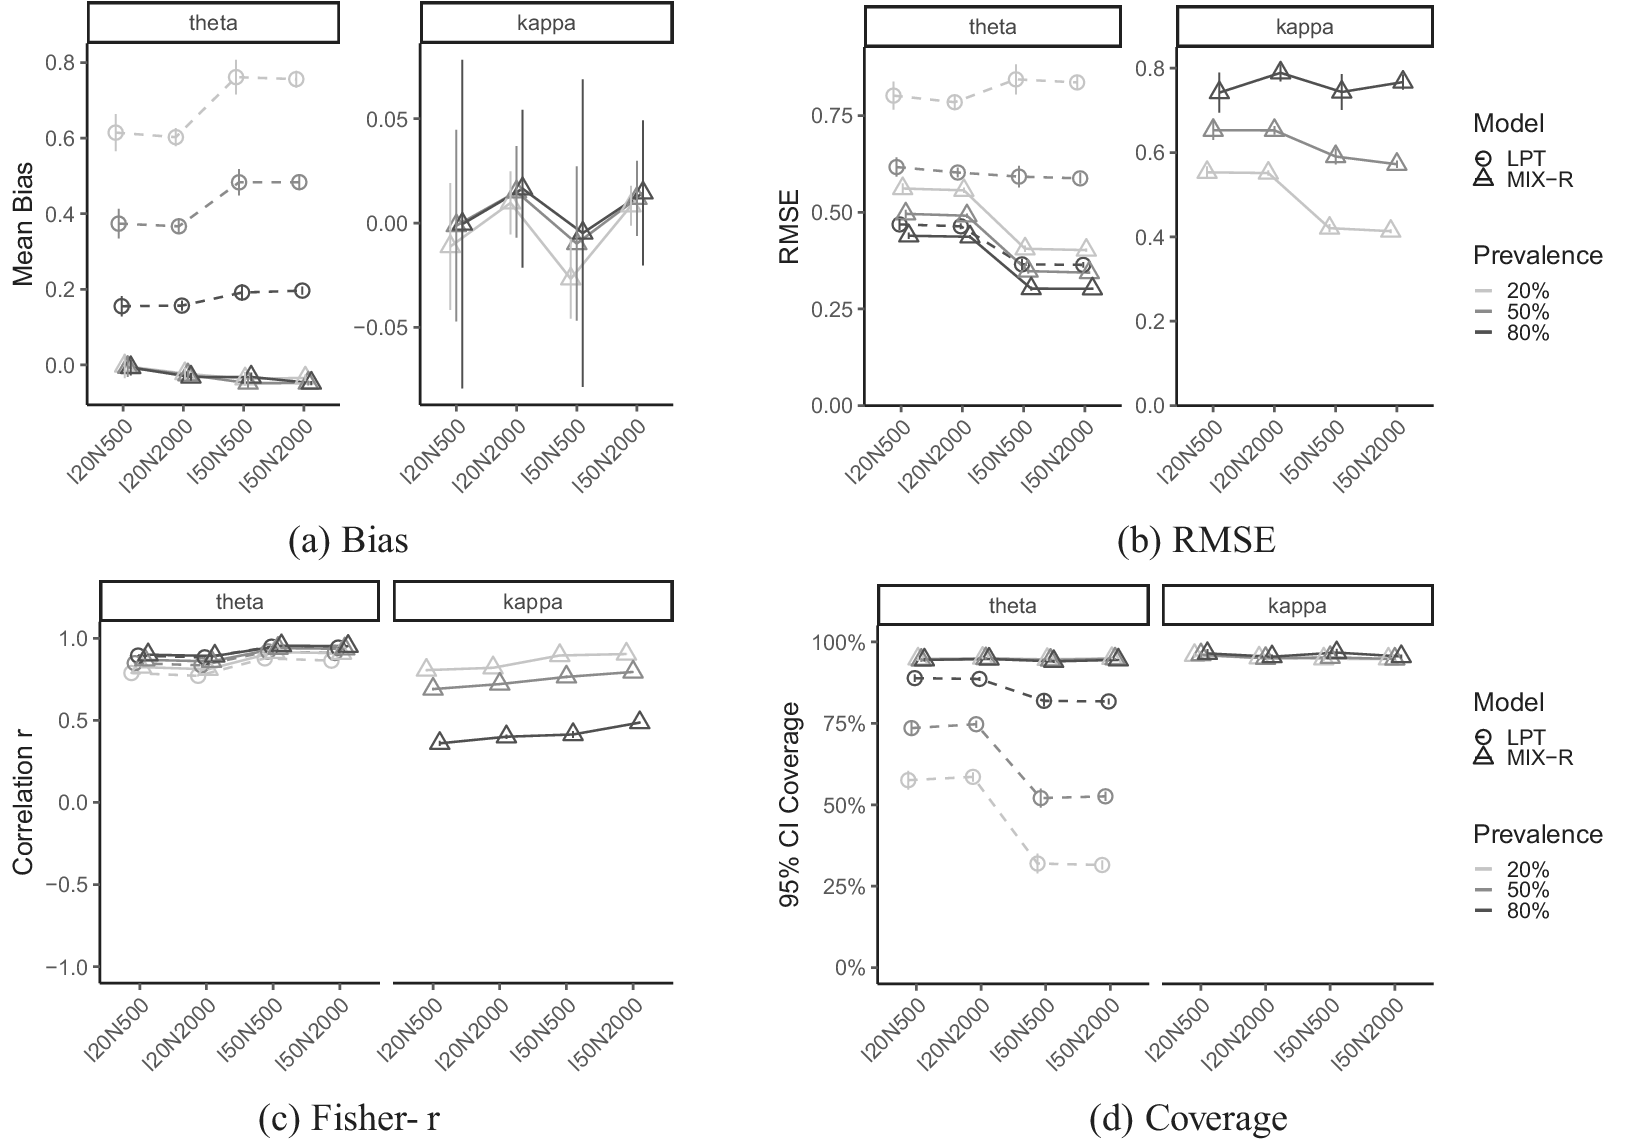


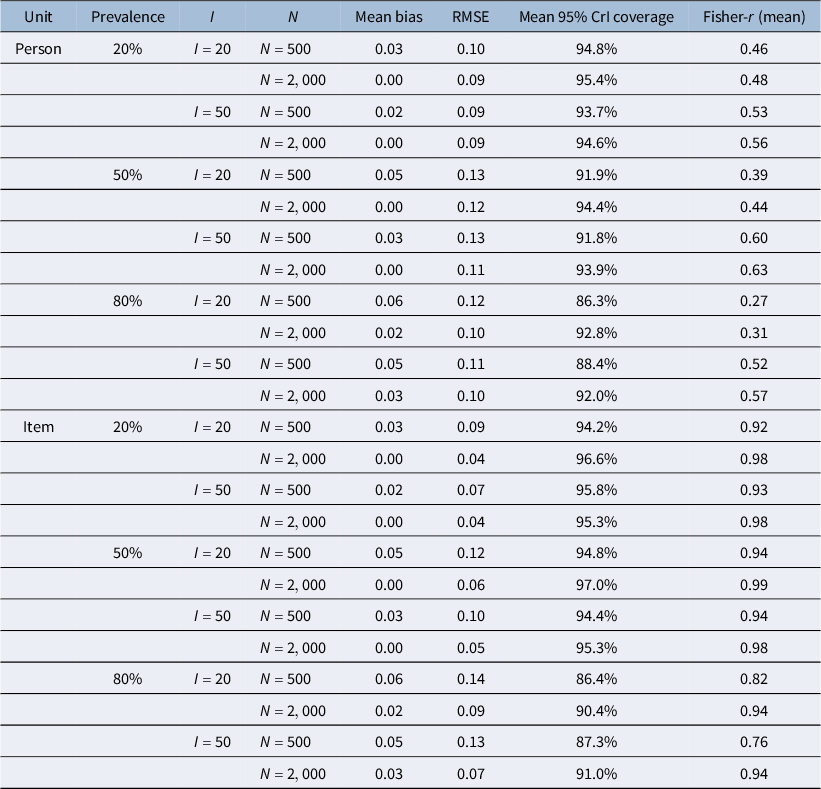
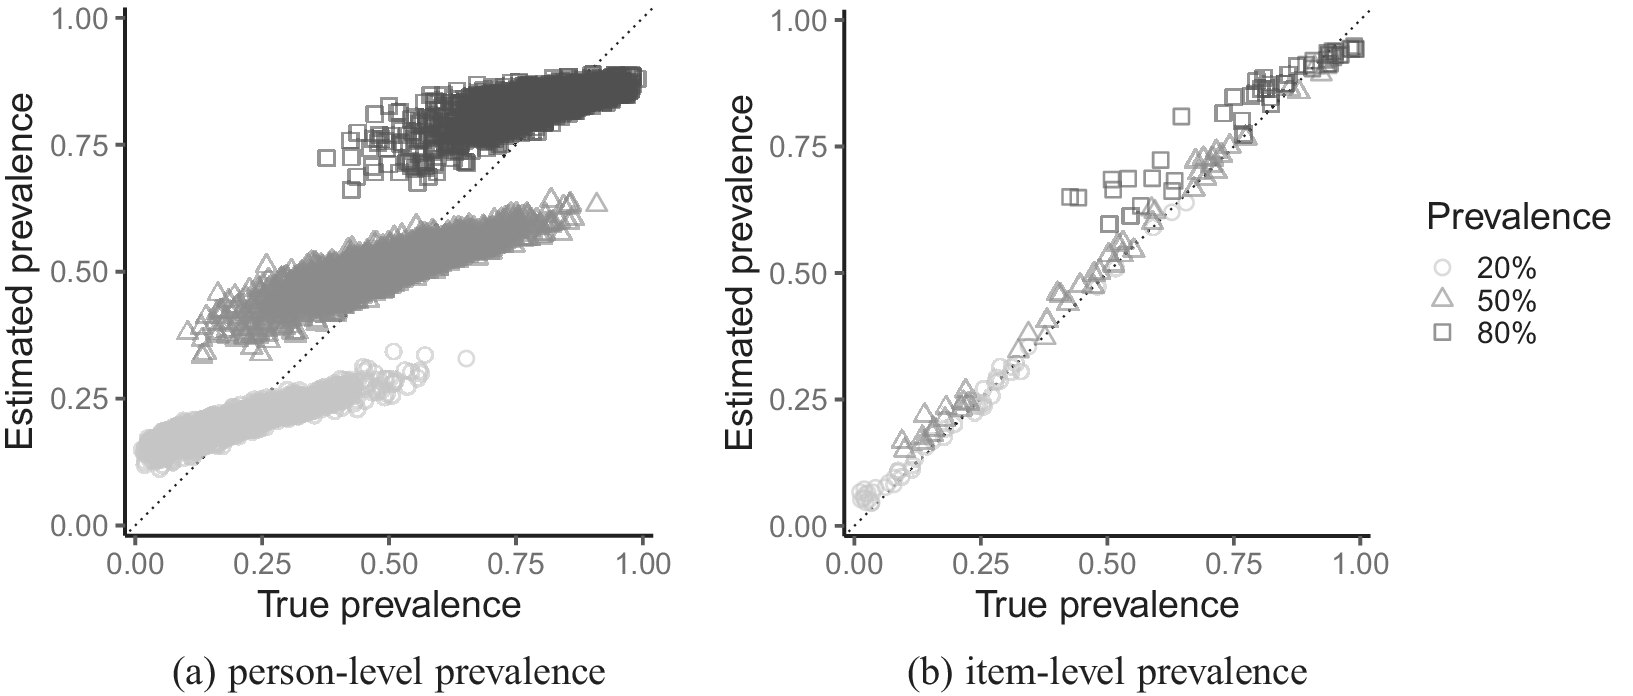


 Open access

